semi-annual financial statements · semi-annual financial statements bmo private portfolios ......
TRANSCRIPT

Semi-Annual Financial Statements
BMO Private Portfolios
June 30, 2015
BMO Private International Equity Portfolio(formerly BMO Harris International Equity Portfolio)
NOTICE OF NO AUDITOR REVIEW OF THE SEMI-ANNUAL FINANCIAL STATEMENTS
BMO Private Investment Counsel Inc., the Manager of the Portfolios, appoints independent auditors to audit the Portfolio’s Annual Financial Statements. Under Canadian securities laws (National Instrument 81-106), if an auditor has not reviewed the Semi-Annual Financial Statements, this must be disclosed in an accompanying notice.
The Portfolio’s independent auditors have not performed a review of these Semi-Annual Financial Statements in accordance with standards established by the Chartered Professional Accountants of Canada.
BMO Private International Equity Portfolio
(formerly BMO Harris International Equity Portfolio) (unaudited)
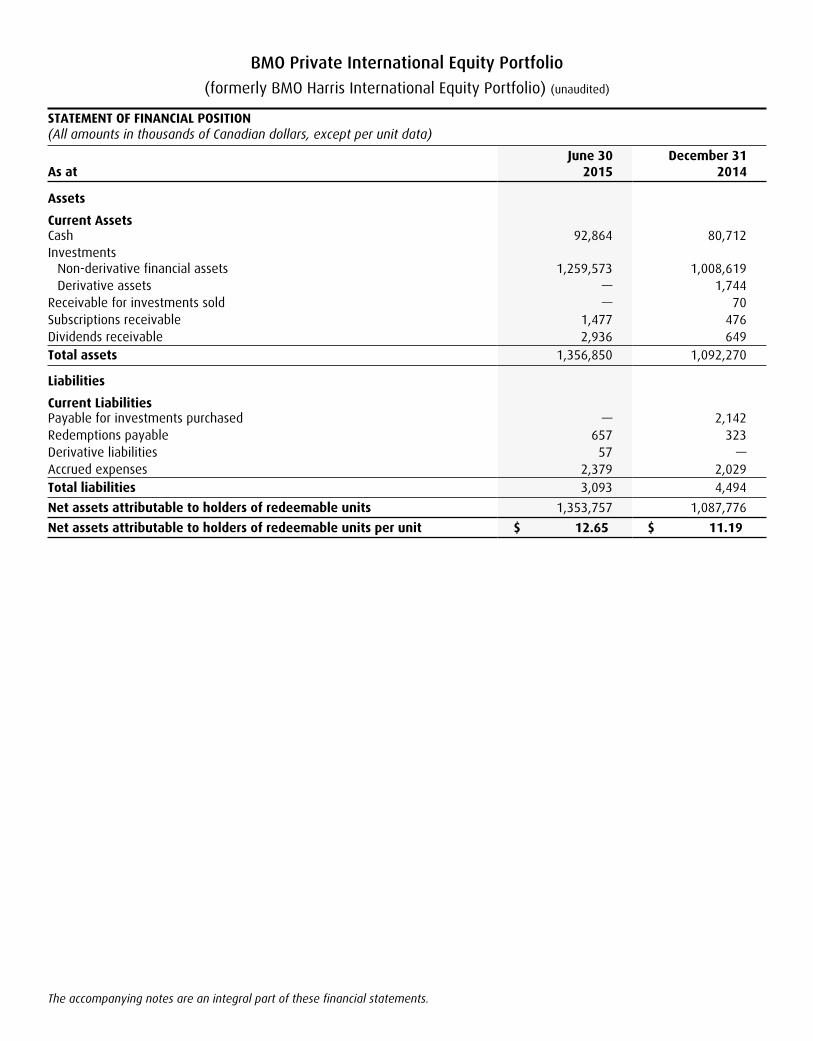
STATEMENT OF FINANCIAL POSITION(All amounts in thousands of Canadian dollars, except per unit data)
The accompanying notes are an integral part of these financial statements.
June 30 December 31As at 2015 2014
Assets
Current AssetsCash 92,864 80,712Investments
Non-derivative financial assets 1,259,573 1,008,619Derivative assets — 1,744
Receivable for investments sold — 70Subscriptions receivable 1,477 476Dividends receivable 2,936 649Total assets 1,356,850 1,092,270
Liabilities
Current LiabilitiesPayable for investments purchased — 2,142Redemptions payable 657 323Derivative liabilities 57 —Accrued expenses 2,379 2,029Total liabilities 3,093 4,494
Net assets attributable to holders of redeemable units 1,353,757 1,087,776
Net assets attributable to holders of redeemable units per unit $ 12.65 $ 11.19
BMO Private International Equity Portfolio
(formerly BMO Harris International Equity Portfolio) (unaudited)
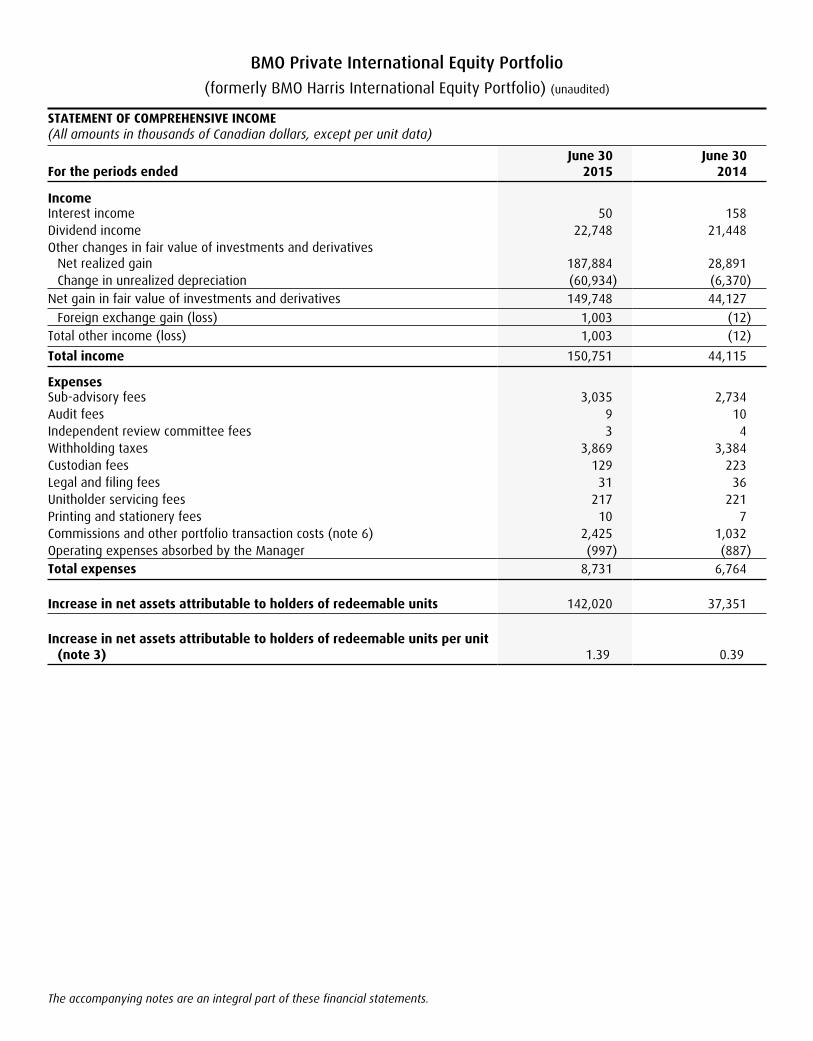
STATEMENT OF COMPREHENSIVE INCOME(All amounts in thousands of Canadian dollars, except per unit data)
The accompanying notes are an integral part of these financial statements.
June 30 June 30For the periods ended 2015 2014
IncomeInterest income 50 158Dividend income 22,748 21,448Other changes in fair value of investments and derivatives
Net realized gain 187,884 28,891Change in unrealized depreciation (60,934) (6,370)
Net gain in fair value of investments and derivatives 149,748 44,127
Foreign exchange gain (loss) 1,003 (12)Total other income (loss) 1,003 (12)
Total income 150,751 44,115
ExpensesSub-advisory fees 3,035 2,734Audit fees 9 10Independent review committee fees 3 4Withholding taxes 3,869 3,384Custodian fees 129 223Legal and filing fees 31 36Unitholder servicing fees 217 221Printing and stationery fees 10 7Commissions and other portfolio transaction costs (note 6) 2,425 1,032Operating expenses absorbed by the Manager (997) (887)Total expenses 8,731 6,764
Increase in net assets attributable to holders of redeemable units 142,020 37,351
Increase in net assets attributable to holders of redeemable units per unit (note 3) 1.39 0.39
BMO Private International Equity Portfolio
(formerly BMO Harris International Equity Portfolio) (unaudited)
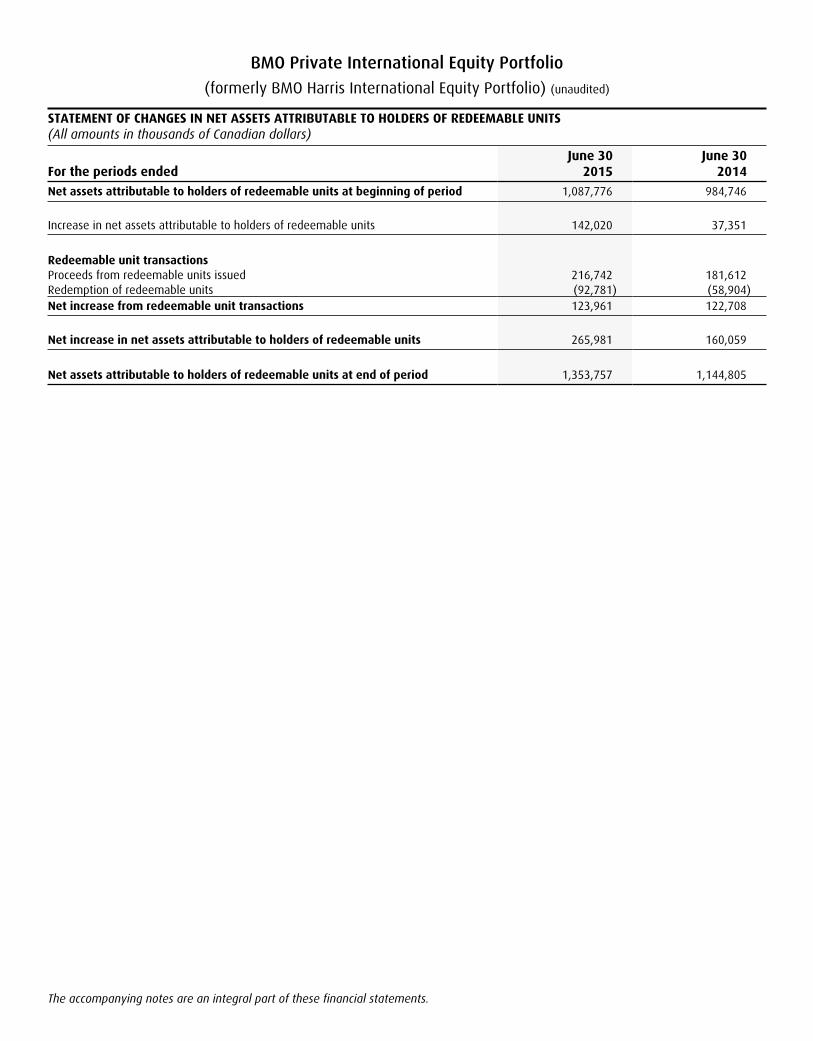
STATEMENT OF CHANGES IN NET ASSETS ATTRIBUTABLE TO HOLDERS OF REDEEMABLE UNITS(All amounts in thousands of Canadian dollars)
The accompanying notes are an integral part of these financial statements.
June 30 June 30For the periods ended 2015 2014
Net assets attributable to holders of redeemable units at beginning of period 1,087,776 984,746
Increase in net assets attributable to holders of redeemable units 142,020 37,351
Redeemable unit transactionsProceeds from redeemable units issued 216,742 181,612Redemption of redeemable units (92,781) (58,904)Net increase from redeemable unit transactions 123,961 122,708
Net increase in net assets attributable to holders of redeemable units 265,981 160,059
Net assets attributable to holders of redeemable units at end of period 1,353,757 1,144,805
BMO Private International Equity Portfolio
(formerly BMO Harris International Equity Portfolio) (unaudited)
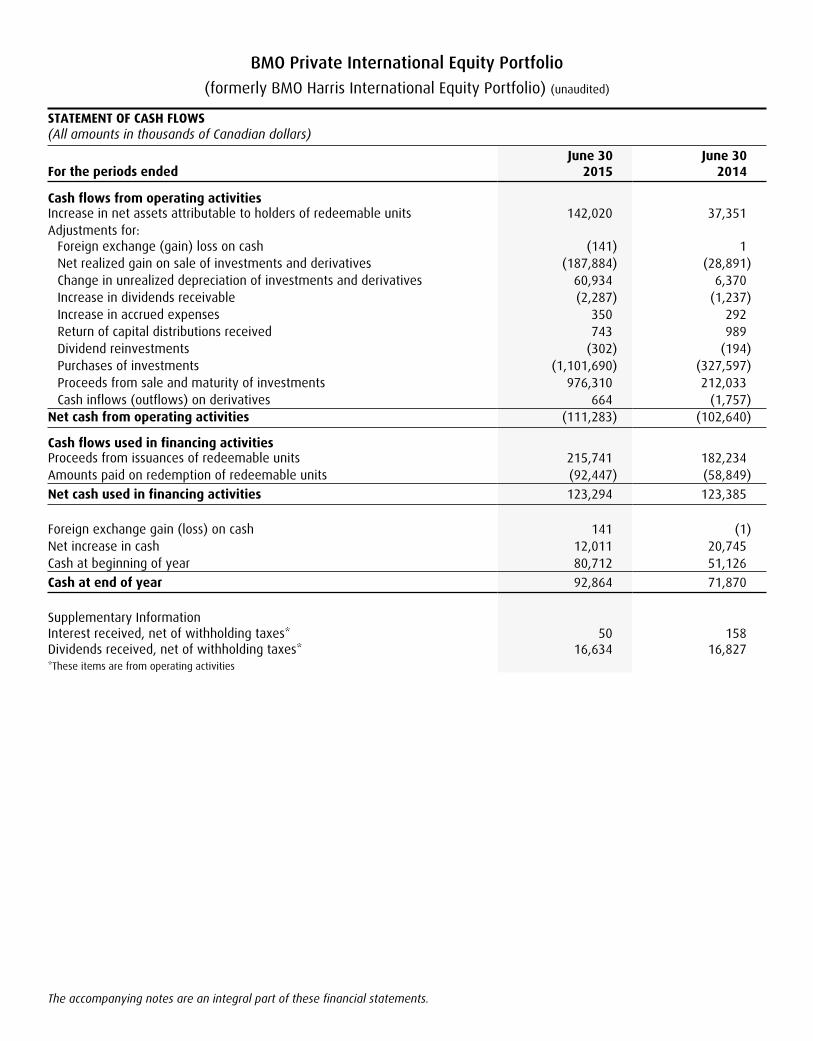
STATEMENT OF CASH FLOWS(All amounts in thousands of Canadian dollars)
The accompanying notes are an integral part of these financial statements.
June 30 June 30For the periods ended 2015 2014
Cash flows from operating activitiesIncrease in net assets attributable to holders of redeemable units 142,020 37,351Adjustments for:
Foreign exchange (gain) loss on cash (141) 1Net realized gain on sale of investments and derivatives (187,884) (28,891)Change in unrealized depreciation of investments and derivatives 60,934 6,370Increase in dividends receivable (2,287) (1,237)Increase in accrued expenses 350 292Return of capital distributions received 743 989Dividend reinvestments (302) (194)Purchases of investments (1,101,690) (327,597)Proceeds from sale and maturity of investments 976,310 212,033Cash inflows (outflows) on derivatives 664 (1,757)
Net cash from operating activities (111,283) (102,640)
Cash flows used in financing activitiesProceeds from issuances of redeemable units 215,741 182,234Amounts paid on redemption of redeemable units (92,447) (58,849)
Net cash used in financing activities 123,294 123,385
Foreign exchange gain (loss) on cash 141 (1)Net increase in cash 12,011 20,745Cash at beginning of year 80,712 51,126
Cash at end of year 92,864 71,870
Supplementary InformationInterest received, net of withholding taxes* 50 158Dividends received, net of withholding taxes* 16,634 16,827*These items are from operating activities
BMO Private International Equity Portfolio
(formerly BMO Harris International Equity Portfolio) (unaudited)
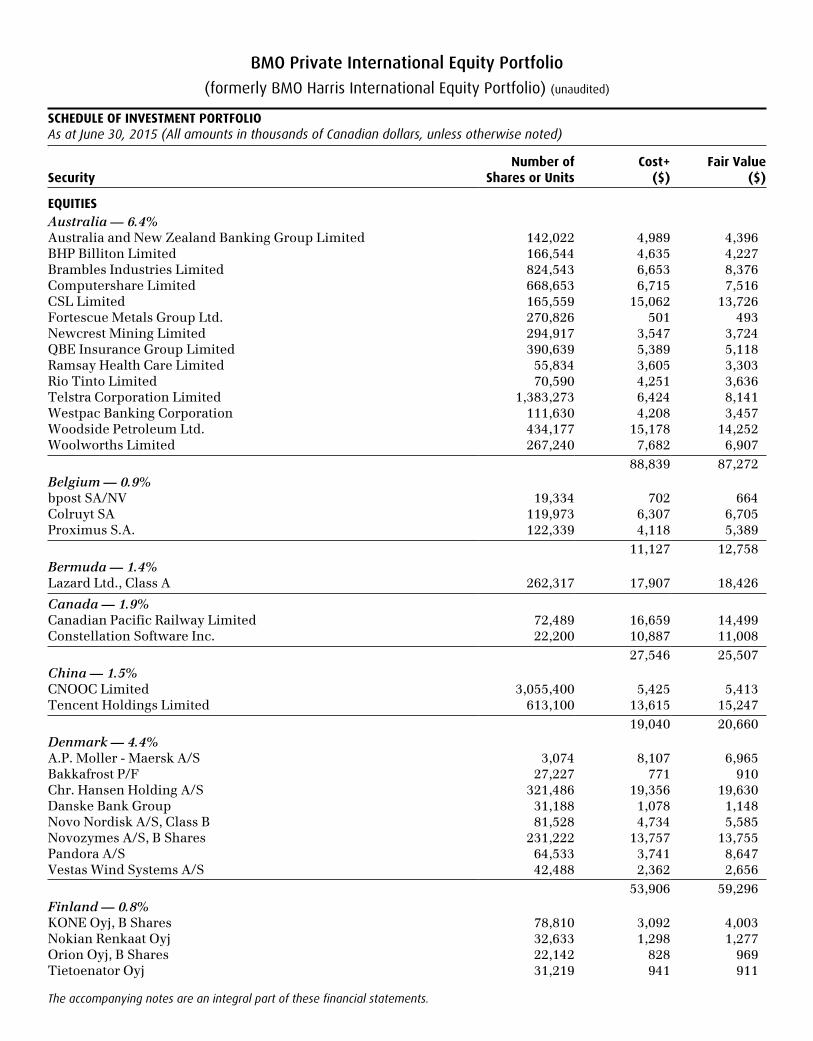
SCHEDULE OF INVESTMENT PORTFOLIOAs at June 30, 2015 (All amounts in thousands of Canadian dollars, unless otherwise noted)
The accompanying notes are an integral part of these financial statements.
0
SecurityNumber of
Shares or UnitsCost+
($)Fair Value
($)
EQUITIESAustralia — 6.4%Australia and New Zealand Banking Group Limited 142,022 4,989 4,396BHP Billiton Limited 166,544 4,635 4,227Brambles Industries Limited 824,543 6,653 8,376Computershare Limited 668,653 6,715 7,516CSL Limited 165,559 15,062 13,726Fortescue Metals Group Ltd. 270,826 501 493Newcrest Mining Limited 294,917 3,547 3,724QBE Insurance Group Limited 390,639 5,389 5,118Ramsay Health Care Limited 55,834 3,605 3,303Rio Tinto Limited 70,590 4,251 3,636Telstra Corporation Limited 1,383,273 6,424 8,141Westpac Banking Corporation 111,630 4,208 3,457Woodside Petroleum Ltd. 434,177 15,178 14,252Woolworths Limited 267,240 7,682 6,907
88,839 87,272Belgium — 0.9%bpost SA/NV 19,334 702 664Colruyt SA 119,973 6,307 6,705Proximus S.A. 122,339 4,118 5,389
11,127 12,758Bermuda — 1.4%Lazard Ltd., Class A 262,317 17,907 18,426
Canada — 1.9%Canadian Pacific Railway Limited 72,489 16,659 14,499Constellation Software Inc. 22,200 10,887 11,008
27,546 25,507China — 1.5%CNOOC Limited 3,055,400 5,425 5,413Tencent Holdings Limited 613,100 13,615 15,247
19,040 20,660Denmark — 4.4%A.P. Moller - Maersk A/S 3,074 8,107 6,965Bakkafrost P/F 27,227 771 910Chr. Hansen Holding A/S 321,486 19,356 19,630Danske Bank Group 31,188 1,078 1,148Novo Nordisk A/S, Class B 81,528 4,734 5,585Novozymes A/S, B Shares 231,222 13,757 13,755Pandora A/S 64,533 3,741 8,647Vestas Wind Systems A/S 42,488 2,362 2,656
53,906 59,296Finland — 0.8%KONE Oyj, B Shares 78,810 3,092 4,003Nokian Renkaat Oyj 32,633 1,298 1,277Orion Oyj, B Shares 22,142 828 969Tietoenator Oyj 31,219 941 911
BMO Private International Equity Portfolio
(formerly BMO Harris International Equity Portfolio) (unaudited)
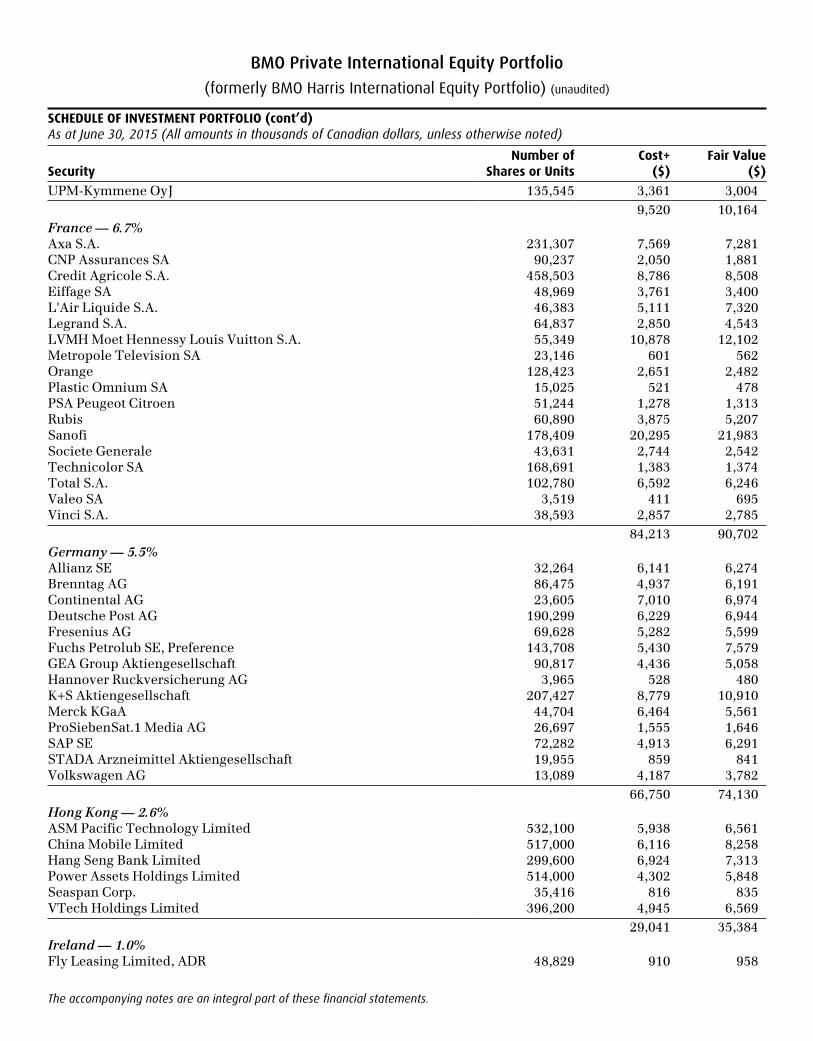
SCHEDULE OF INVESTMENT PORTFOLIO (cont’d)As at June 30, 2015 (All amounts in thousands of Canadian dollars, unless otherwise noted)
The accompanying notes are an integral part of these financial statements.
SecurityNumber of
Shares or UnitsCost+
($)Fair Value
($)
UPM-Kymmene OyJ 135,545 3,361 3,0049,520 10,164
France — 6.7%Axa S.A. 231,307 7,569 7,281CNP Assurances SA 90,237 2,050 1,881Credit Agricole S.A. 458,503 8,786 8,508Eiffage SA 48,969 3,761 3,400L'Air Liquide S.A. 46,383 5,111 7,320Legrand S.A. 64,837 2,850 4,543LVMH Moet Hennessy Louis Vuitton S.A. 55,349 10,878 12,102Metropole Television SA 23,146 601 562Orange 128,423 2,651 2,482Plastic Omnium SA 15,025 521 478PSA Peugeot Citroen 51,244 1,278 1,313Rubis 60,890 3,875 5,207Sanofi 178,409 20,295 21,983Societe Generale 43,631 2,744 2,542Technicolor SA 168,691 1,383 1,374Total S.A. 102,780 6,592 6,246Valeo SA 3,519 411 695Vinci S.A. 38,593 2,857 2,785
84,213 90,702Germany — 5.5%Allianz SE 32,264 6,141 6,274Brenntag AG 86,475 4,937 6,191Continental AG 23,605 7,010 6,974Deutsche Post AG 190,299 6,229 6,944Fresenius AG 69,628 5,282 5,599Fuchs Petrolub SE, Preference 143,708 5,430 7,579GEA Group Aktiengesellschaft 90,817 4,436 5,058Hannover Ruckversicherung AG 3,965 528 480K+S Aktiengesellschaft 207,427 8,779 10,910Merck KGaA 44,704 6,464 5,561ProSiebenSat.1 Media AG 26,697 1,555 1,646SAP SE 72,282 4,913 6,291STADA Arzneimittel Aktiengesellschaft 19,955 859 841Volkswagen AG 13,089 4,187 3,782
66,750 74,130Hong Kong — 2.6%ASM Pacific Technology Limited 532,100 5,938 6,561China Mobile Limited 517,000 6,116 8,258Hang Seng Bank Limited 299,600 6,924 7,313Power Assets Holdings Limited 514,000 4,302 5,848Seaspan Corp. 35,416 816 835VTech Holdings Limited 396,200 4,945 6,569
29,041 35,384Ireland — 1.0%Fly Leasing Limited, ADR 48,829 910 958
BMO Private International Equity Portfolio
(formerly BMO Harris International Equity Portfolio) (unaudited)
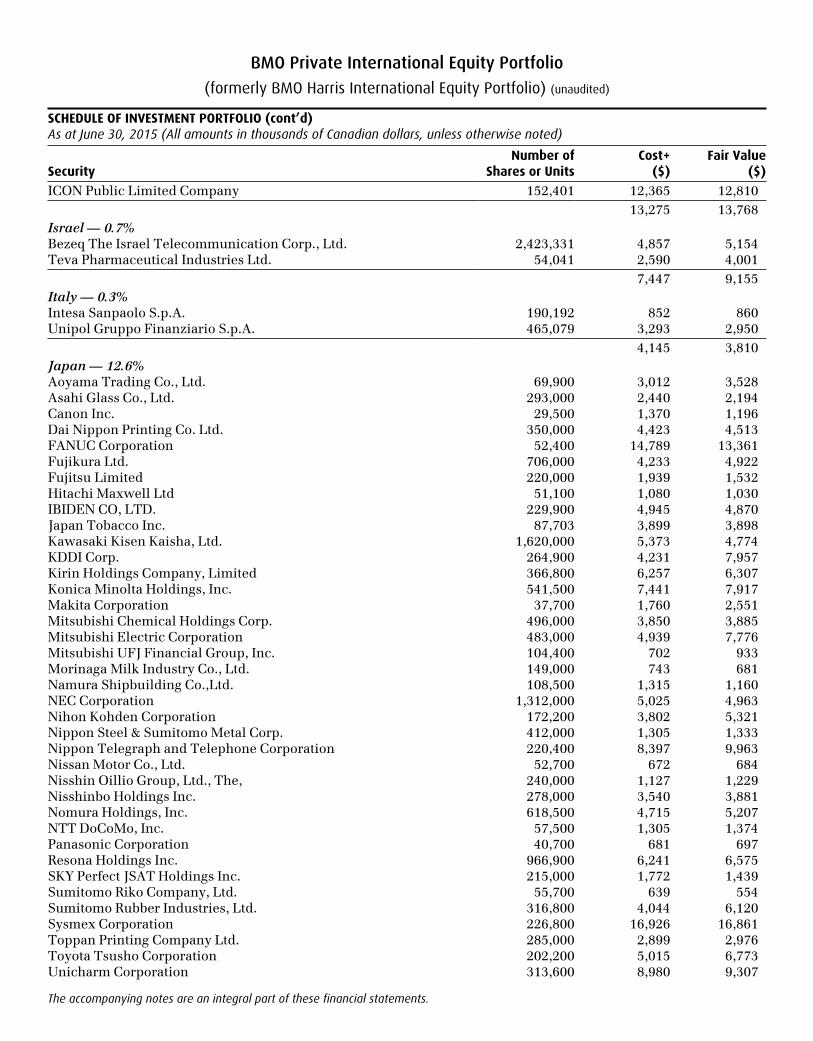
SCHEDULE OF INVESTMENT PORTFOLIO (cont’d)As at June 30, 2015 (All amounts in thousands of Canadian dollars, unless otherwise noted)
The accompanying notes are an integral part of these financial statements.
SecurityNumber of
Shares or UnitsCost+
($)Fair Value
($)
ICON Public Limited Company 152,401 12,365 12,81013,275 13,768
Israel — 0.7%Bezeq The Israel Telecommunication Corp., Ltd. 2,423,331 4,857 5,154Teva Pharmaceutical Industries Ltd. 54,041 2,590 4,001
7,447 9,155Italy — 0.3%Intesa Sanpaolo S.p.A. 190,192 852 860Unipol Gruppo Finanziario S.p.A. 465,079 3,293 2,950
4,145 3,810Japan — 12.6%Aoyama Trading Co., Ltd. 69,900 3,012 3,528Asahi Glass Co., Ltd. 293,000 2,440 2,194Canon Inc. 29,500 1,370 1,196Dai Nippon Printing Co. Ltd. 350,000 4,423 4,513FANUC Corporation 52,400 14,789 13,361Fujikura Ltd. 706,000 4,233 4,922Fujitsu Limited 220,000 1,939 1,532Hitachi Maxwell Ltd 51,100 1,080 1,030IBIDEN CO, LTD. 229,900 4,945 4,870Japan Tobacco Inc. 87,703 3,899 3,898Kawasaki Kisen Kaisha, Ltd. 1,620,000 5,373 4,774KDDI Corp. 264,900 4,231 7,957Kirin Holdings Company, Limited 366,800 6,257 6,307Konica Minolta Holdings, Inc. 541,500 7,441 7,917Makita Corporation 37,700 1,760 2,551Mitsubishi Chemical Holdings Corp. 496,000 3,850 3,885Mitsubishi Electric Corporation 483,000 4,939 7,776Mitsubishi UFJ Financial Group, Inc. 104,400 702 933Morinaga Milk Industry Co., Ltd. 149,000 743 681Namura Shipbuilding Co.,Ltd. 108,500 1,315 1,160NEC Corporation 1,312,000 5,025 4,963Nihon Kohden Corporation 172,200 3,802 5,321Nippon Steel & Sumitomo Metal Corp. 412,000 1,305 1,333Nippon Telegraph and Telephone Corporation 220,400 8,397 9,963Nissan Motor Co., Ltd. 52,700 672 684Nisshin Oillio Group, Ltd., The, 240,000 1,127 1,229Nisshinbo Holdings Inc. 278,000 3,540 3,881Nomura Holdings, Inc. 618,500 4,715 5,207NTT DoCoMo, Inc. 57,500 1,305 1,374Panasonic Corporation 40,700 681 697Resona Holdings Inc. 966,900 6,241 6,575SKY Perfect JSAT Holdings Inc. 215,000 1,772 1,439Sumitomo Riko Company, Ltd. 55,700 639 554Sumitomo Rubber Industries, Ltd. 316,800 4,044 6,120Sysmex Corporation 226,800 16,926 16,861Toppan Printing Company Ltd. 285,000 2,899 2,976Toyota Tsusho Corporation 202,200 5,015 6,773Unicharm Corporation 313,600 8,980 9,307
BMO Private International Equity Portfolio
(formerly BMO Harris International Equity Portfolio) (unaudited)
SCHEDULE OF INVESTMENT PORTFOLIO (cont’d)As at June 30, 2015 (All amounts in thousands of Canadian dollars, unless otherwise noted)
The accompanying notes are an integral part of these financial statements.
SecurityNumber of
Shares or UnitsCost+
($)Fair Value
($)
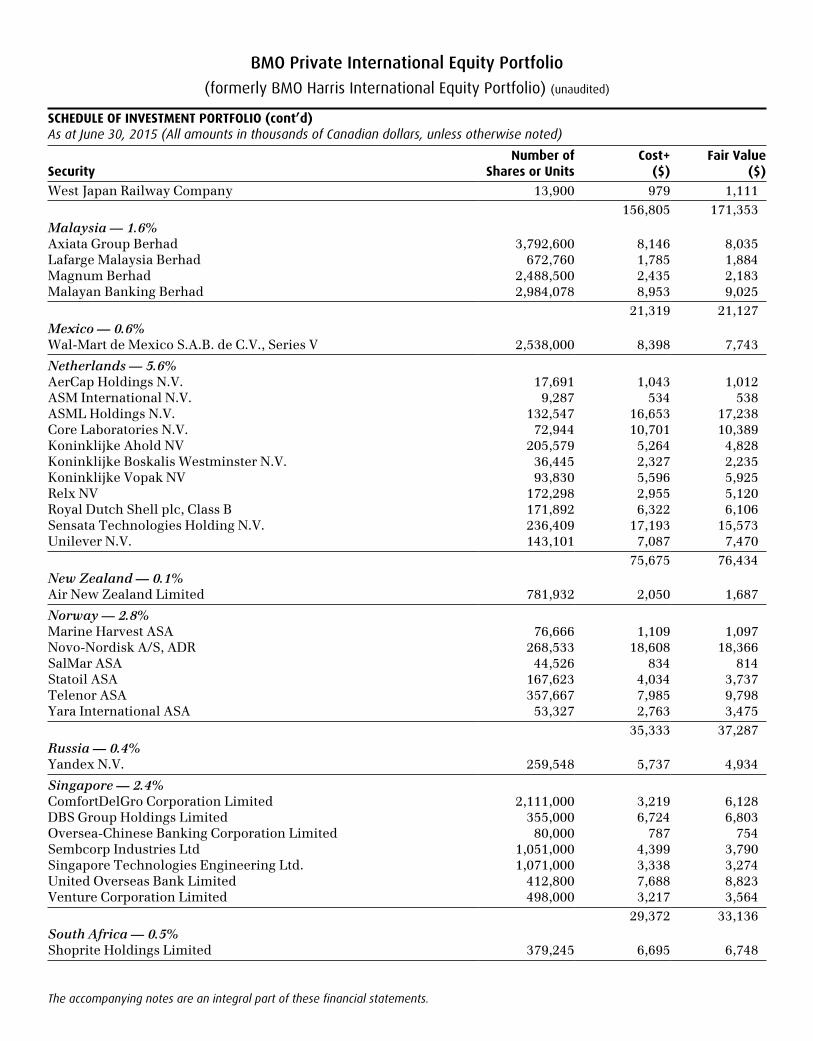
West Japan Railway Company 13,900 979 1,111156,805 171,353
Malaysia — 1.6%Axiata Group Berhad 3,792,600 8,146 8,035Lafarge Malaysia Berhad 672,760 1,785 1,884Magnum Berhad 2,488,500 2,435 2,183Malayan Banking Berhad 2,984,078 8,953 9,025
21,319 21,127Mexico — 0.6%Wal-Mart de Mexico S.A.B. de C.V., Series V 2,538,000 8,398 7,743
Netherlands — 5.6%AerCap Holdings N.V. 17,691 1,043 1,012ASM International N.V. 9,287 534 538ASML Holdings N.V. 132,547 16,653 17,238Core Laboratories N.V. 72,944 10,701 10,389Koninklijke Ahold NV 205,579 5,264 4,828Koninklijke Boskalis Westminster N.V. 36,445 2,327 2,235Koninklijke Vopak NV 93,830 5,596 5,925Relx NV 172,298 2,955 5,120Royal Dutch Shell plc, Class B 171,892 6,322 6,106Sensata Technologies Holding N.V. 236,409 17,193 15,573Unilever N.V. 143,101 7,087 7,470
75,675 76,434New Zealand — 0.1%Air New Zealand Limited 781,932 2,050 1,687
Norway — 2.8%Marine Harvest ASA 76,666 1,109 1,097Novo-Nordisk A/S, ADR 268,533 18,608 18,366SalMar ASA 44,526 834 814Statoil ASA 167,623 4,034 3,737Telenor ASA 357,667 7,985 9,798Yara International ASA 53,327 2,763 3,475
35,333 37,287Russia — 0.4%Yandex N.V. 259,548 5,737 4,934
Singapore — 2.4%ComfortDelGro Corporation Limited 2,111,000 3,219 6,128DBS Group Holdings Limited 355,000 6,724 6,803Oversea-Chinese Banking Corporation Limited 80,000 787 754Sembcorp Industries Ltd 1,051,000 4,399 3,790Singapore Technologies Engineering Ltd. 1,071,000 3,338 3,274United Overseas Bank Limited 412,800 7,688 8,823Venture Corporation Limited 498,000 3,217 3,564
29,372 33,136South Africa — 0.5%Shoprite Holdings Limited 379,245 6,695 6,748
BMO Private International Equity Portfolio
(formerly BMO Harris International Equity Portfolio) (unaudited)
SCHEDULE OF INVESTMENT PORTFOLIO (cont’d)As at June 30, 2015 (All amounts in thousands of Canadian dollars, unless otherwise noted)
The accompanying notes are an integral part of these financial statements.
SecurityNumber of
Shares or UnitsCost+
($)Fair Value
($)
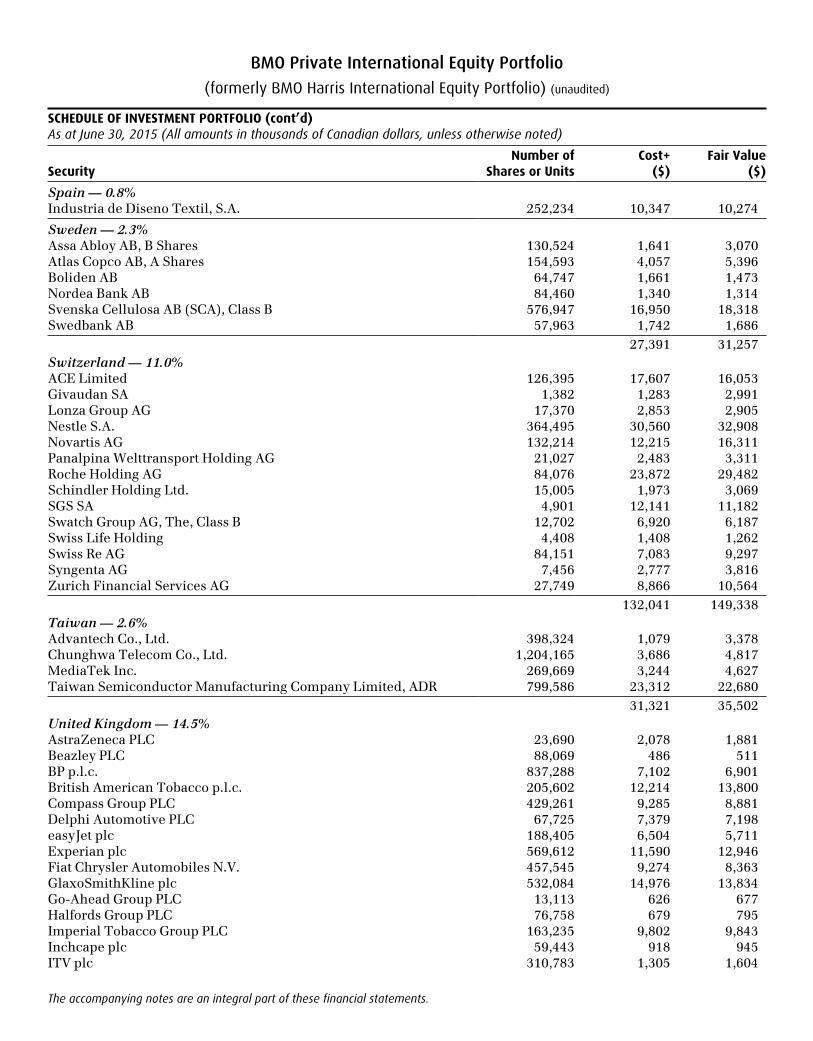
Spain — 0.8%Industria de Diseno Textil, S.A. 252,234 10,347 10,274
Sweden — 2.3%Assa Abloy AB, B Shares 130,524 1,641 3,070Atlas Copco AB, A Shares 154,593 4,057 5,396Boliden AB 64,747 1,661 1,473Nordea Bank AB 84,460 1,340 1,314Svenska Cellulosa AB (SCA), Class B 576,947 16,950 18,318Swedbank AB 57,963 1,742 1,686
27,391 31,257Switzerland — 11.0%ACE Limited 126,395 17,607 16,053Givaudan SA 1,382 1,283 2,991Lonza Group AG 17,370 2,853 2,905Nestle S.A. 364,495 30,560 32,908Novartis AG 132,214 12,215 16,311Panalpina Welttransport Holding AG 21,027 2,483 3,311Roche Holding AG 84,076 23,872 29,482Schindler Holding Ltd. 15,005 1,973 3,069SGS SA 4,901 12,141 11,182Swatch Group AG, The, Class B 12,702 6,920 6,187Swiss Life Holding 4,408 1,408 1,262Swiss Re AG 84,151 7,083 9,297Syngenta AG 7,456 2,777 3,816Zurich Financial Services AG 27,749 8,866 10,564
132,041 149,338Taiwan — 2.6%Advantech Co., Ltd. 398,324 1,079 3,378Chunghwa Telecom Co., Ltd. 1,204,165 3,686 4,817MediaTek Inc. 269,669 3,244 4,627Taiwan Semiconductor Manufacturing Company Limited, ADR 799,586 23,312 22,680
31,321 35,502United Kingdom — 14.5%AstraZeneca PLC 23,690 2,078 1,881Beazley PLC 88,069 486 511BP p.l.c. 837,288 7,102 6,901British American Tobacco p.l.c. 205,602 12,214 13,800Compass Group PLC 429,261 9,285 8,881Delphi Automotive PLC 67,725 7,379 7,198easyJet plc 188,405 6,504 5,711Experian plc 569,612 11,590 12,946Fiat Chrysler Automobiles N.V. 457,545 9,274 8,363GlaxoSmithKline plc 532,084 14,976 13,834Go-Ahead Group PLC 13,113 626 677Halfords Group PLC 76,758 679 795Imperial Tobacco Group PLC 163,235 9,802 9,843Inchcape plc 59,443 918 945ITV plc 310,783 1,305 1,604
BMO Private International Equity Portfolio
(formerly BMO Harris International Equity Portfolio) (unaudited)
SCHEDULE OF INVESTMENT PORTFOLIO (cont’d)As at June 30, 2015 (All amounts in thousands of Canadian dollars, unless otherwise noted)
The accompanying notes are an integral part of these financial statements.
SecurityNumber of
Shares or UnitsCost+
($)Fair Value
($)
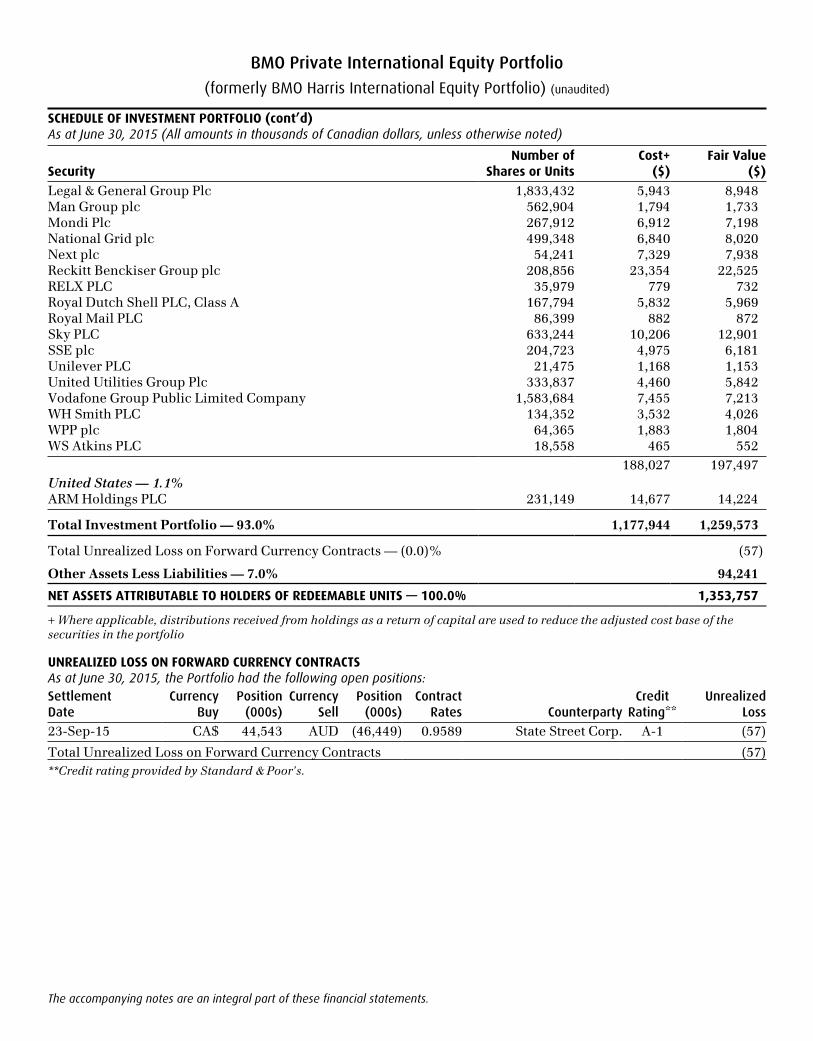
Legal & General Group Plc 1,833,432 5,943 8,948Man Group plc 562,904 1,794 1,733Mondi Plc 267,912 6,912 7,198National Grid plc 499,348 6,840 8,020Next plc 54,241 7,329 7,938Reckitt Benckiser Group plc 208,856 23,354 22,525RELX PLC 35,979 779 732Royal Dutch Shell PLC, Class A 167,794 5,832 5,969Royal Mail PLC 86,399 882 872Sky PLC 633,244 10,206 12,901SSE plc 204,723 4,975 6,181Unilever PLC 21,475 1,168 1,153United Utilities Group Plc 333,837 4,460 5,842Vodafone Group Public Limited Company 1,583,684 7,455 7,213WH Smith PLC 134,352 3,532 4,026WPP plc 64,365 1,883 1,804WS Atkins PLC 18,558 465 552
188,027 197,497United States — 1.1%ARM Holdings PLC 231,149 14,677 14,224
Total Investment Portfolio — 93.0% 1,177,944 1,259,573
Total Unrealized Loss on Forward Currency Contracts — (0.0)% (57)
Other Assets Less Liabilities — 7.0% 94,241
NET ASSETS ATTRIBUTABLE TO HOLDERS OF REDEEMABLE UNITS — 100.0% 1,353,757
+ Where applicable, distributions received from holdings as a return of capital are used to reduce the adjusted cost base of the securities in the portfolio
UNREALIZED LOSS ON FORWARD CURRENCY CONTRACTSAs at June 30, 2015, the Portfolio had the following open positions:Settlement Date
Currency Buy
Position (000s)
Currency Sell
Position (000s)
Contract Rates Counterparty
Credit Rating**
Unrealized Loss
23-Sep-15 CA$ 44,543 AUD (46,449) 0.9589 State Street Corp. A-1 (57)
Total Unrealized Loss on Forward Currency Contracts (57)**Credit rating provided by Standard & Poor's.
NOTES TO FINANCIAL STATEMENTS(All amounts in thousands of Canadian dollars, except per unit data)June 30, 2015
BMO Private International Equity Portfolio
(formerly BMO Harris International Equity Portfolio) (unaudited)
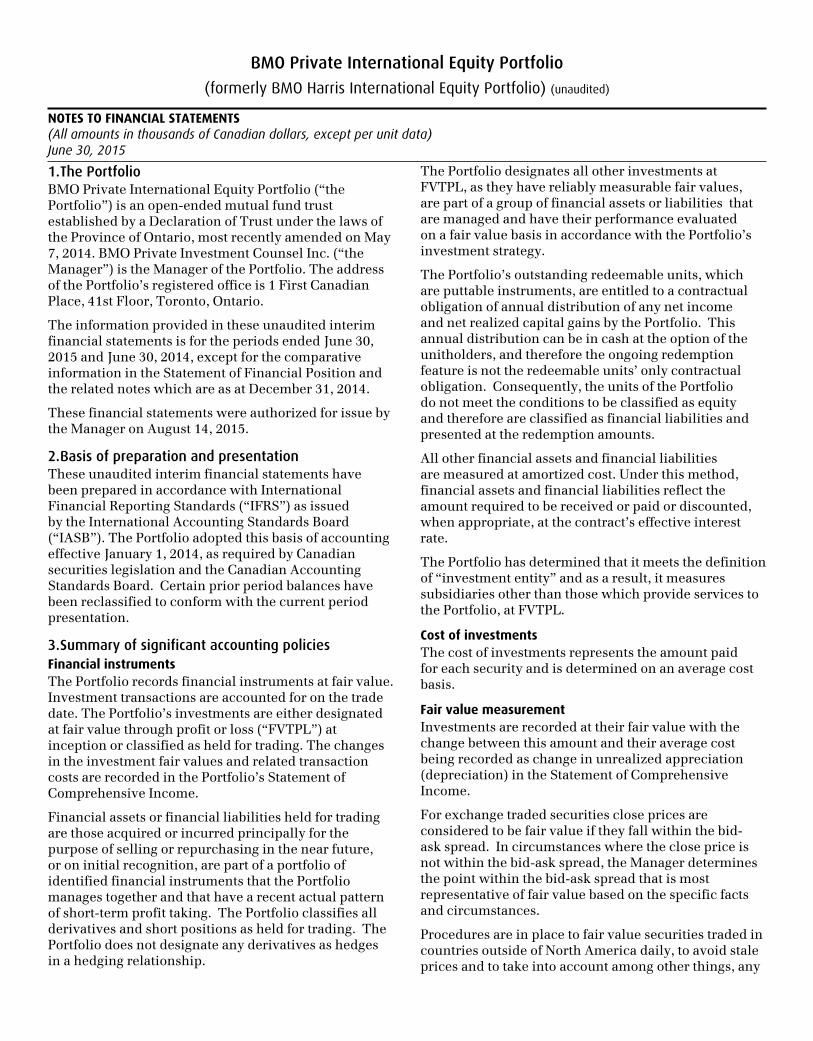
1. The PortfolioBMO Private International Equity Portfolio (“the Portfolio”) is an open-ended mutual fund trust established by a Declaration of Trust under the laws of the Province of Ontario, most recently amended on May 7, 2014. BMO Private Investment Counsel Inc. (“the Manager”) is the Manager of the Portfolio. The address of the Portfolio’s registered office is 1 First Canadian Place, 41st Floor, Toronto, Ontario.
The information provided in these unaudited interim financial statements is for the periods ended June 30, 2015 and June 30, 2014, except for the comparative information in the Statement of Financial Position and the related notes which are as at December 31, 2014.
These financial statements were authorized for issue by the Manager on August 14, 2015.
2. Basis of preparation and presentationThese unaudited interim financial statements have been prepared in accordance with International Financial Reporting Standards (“IFRS”) as issued by the International Accounting Standards Board (“IASB”). The Portfolio adopted this basis of accounting effective January 1, 2014, as required by Canadian securities legislation and the Canadian Accounting Standards Board. Certain prior period balances have been reclassified to conform with the current period presentation.
3. Summary of significant accounting policiesFinancial instrumentsThe Portfolio records financial instruments at fair value. Investment transactions are accounted for on the trade date. The Portfolio’s investments are either designated at fair value through profit or loss (“FVTPL”) at inception or classified as held for trading. The changes in the investment fair values and related transaction costs are recorded in the Portfolio’s Statement of Comprehensive Income.
Financial assets or financial liabilities held for trading are those acquired or incurred principally for the purpose of selling or repurchasing in the near future, or on initial recognition, are part of a portfolio of identified financial instruments that the Portfolio manages together and that have a recent actual pattern of short-term profit taking. The Portfolio classifies all derivatives and short positions as held for trading. The Portfolio does not designate any derivatives as hedges in a hedging relationship.
The Portfolio designates all other investments at FVTPL, as they have reliably measurable fair values, are part of a group of financial assets or liabilities that are managed and have their performance evaluated on a fair value basis in accordance with the Portfolio’s investment strategy.
The Portfolio’s outstanding redeemable units, which are puttable instruments, are entitled to a contractual obligation of annual distribution of any net income and net realized capital gains by the Portfolio. This annual distribution can be in cash at the option of the unitholders, and therefore the ongoing redemption feature is not the redeemable units’ only contractual obligation. Consequently, the units of the Portfolio do not meet the conditions to be classified as equity and therefore are classified as financial liabilities and presented at the redemption amounts.
All other financial assets and financial liabilities are measured at amortized cost. Under this method, financial assets and financial liabilities reflect the amount required to be received or paid or discounted, when appropriate, at the contract’s effective interest rate.
The Portfolio has determined that it meets the definition of “investment entity” and as a result, it measures subsidiaries other than those which provide services to the Portfolio, at FVTPL.
Cost of investmentsThe cost of investments represents the amount paid for each security and is determined on an average cost basis.
Fair value measurementInvestments are recorded at their fair value with the change between this amount and their average cost being recorded as change in unrealized appreciation (depreciation) in the Statement of Comprehensive Income.
For exchange traded securities close prices are considered to be fair value if they fall within the bid-ask spread. In circumstances where the close price is not within the bid-ask spread, the Manager determines the point within the bid-ask spread that is most representative of fair value based on the specific facts and circumstances.
Procedures are in place to fair value securities traded in countries outside of North America daily, to avoid stale prices and to take into account among other things, any

NOTES TO FINANCIAL STATEMENTS (cont’d)(All amounts in thousands of Canadian dollars, except per unit data)June 30, 2015
BMO Private International Equity Portfolio
(formerly BMO Harris International Equity Portfolio) (unaudited)
significant events occurring after the close of a foreign market.
For bonds, debentures, asset-backed securities and other debt securities fair value is represented by bid prices provided by independent security pricing services. Short-term investments, if any, are carried at amortized cost which approximates fair value. Unlisted warrants, if any, are valued based on a pricing model which considers factors such as the market value of the underlying security, strike price and terms of the warrant. Mutual fund units held as investments are valued at their respective Net Asset Value (“NAV”) on each Valuation Date (the “Valuation Date” is each day on which the Toronto Stock Exchange is open for trading), as these values are the most readily and regularly available.
For securities where market quotes are not available, unreliable or not considered to reflect the current value, the Portfolio may determine another value which it considers to be fair and reasonable, or using a valuation technique that, to the extent possible, makes maximum use of inputs and assumptions based on observable market data including volatility, comparable companies and other applicable rates or prices. These estimation techniques include discounted cash flows, internal models that utilize observable data or comparisons with other securities that are substantially similar. In limited circumstances, the Portfolio uses internal models where the inputs are not based on observable market data.
The Portfolio’s accounting policies for measuring the fair value of its investments and derivatives are aligned with the valuation policies used in measuring its NAV for transactions with unitholders.
Derivative instrumentsDerivative instruments are financial contracts that derive their value from underlying changes in interest rates, foreign exchange rates or other financial or commodity prices or indices.
Derivative instruments are either regulated exchange-traded contracts or negotiated over-the-counter contracts. The Portfolio may use these instruments for trading purposes, as well as to manage the Portfolio’s risk exposures.
Derivatives are marked to fair value. Discussion of the fair value measurement of derivatives is included in Note 3. Realized and unrealized gains and losses are recorded in the Statement of Comprehensive Income.
Forward currency contractsA forward currency contract is an agreement between two parties (the Portfolio and the counterparty) to purchase or sell a currency against another currency at a set price on a future date. The Portfolio may enter into forward currency contracts for hedging purposes which can include the hedging of all or a portion of the currency exposure of an investment or group of investments, either directly or indirectly. The Portfolio may also enter into these contracts for non-hedging purposes which can include increasing the exposure to a foreign currency or to shift exposure to foreign currency fluctuations from one country to another. The value of forward currency contracts entered into by the Portfolio is recorded as the difference between the value of the contract on the Valuation Date and the value on the date the contract originated.
Income recognitionDividend income and distributions from investment trust units are recognized on the ex-dividend and ex-distribution date, respectively.
Interest income from interest bearing investments is recognized in the Statement of Comprehensive Income using the effective interest rate. Interest receivable is shown in the Statement of Financial Position is accrued based on the interest bearing investments’ stated rates of interest.
Interest on inflation-indexed bonds is paid based on a principal value, which is adjusted for inflation. The inflation adjustment of the principal value is recognized as part of interest income in the Statement of Comprehensive Income. If held to maturity, the Portfolio will receive, in addition to a coupon interest payment, a final payment equal to the sum of the par value and the inflation compensation accrued from the original issue date. Interest is accrued on each Valuation Date based on the inflation adjusted par value at that time and is included in “Interest income” in the Statement of Comprehensive Income.
Foreign currency translationThe fair value of investments and other assets and liabilities in foreign currencies are translated into the Portfolio’s functional currency at the rates of exchange prevailing at the period-end date. Purchases and sales of investments, and income and expenses are translated at the rates of exchange prevailing on the respective dates of such transactions. Foreign exchange gains (losses) on completed transactions are included in “Realized gains (losses)” and unrealized foreign exchange gains (losses)
NOTES TO FINANCIAL STATEMENTS (cont’d)(All amounts in thousands of Canadian dollars, except per unit data)June 30, 2015
BMO Private International Equity Portfolio
(formerly BMO Harris International Equity Portfolio) (unaudited)
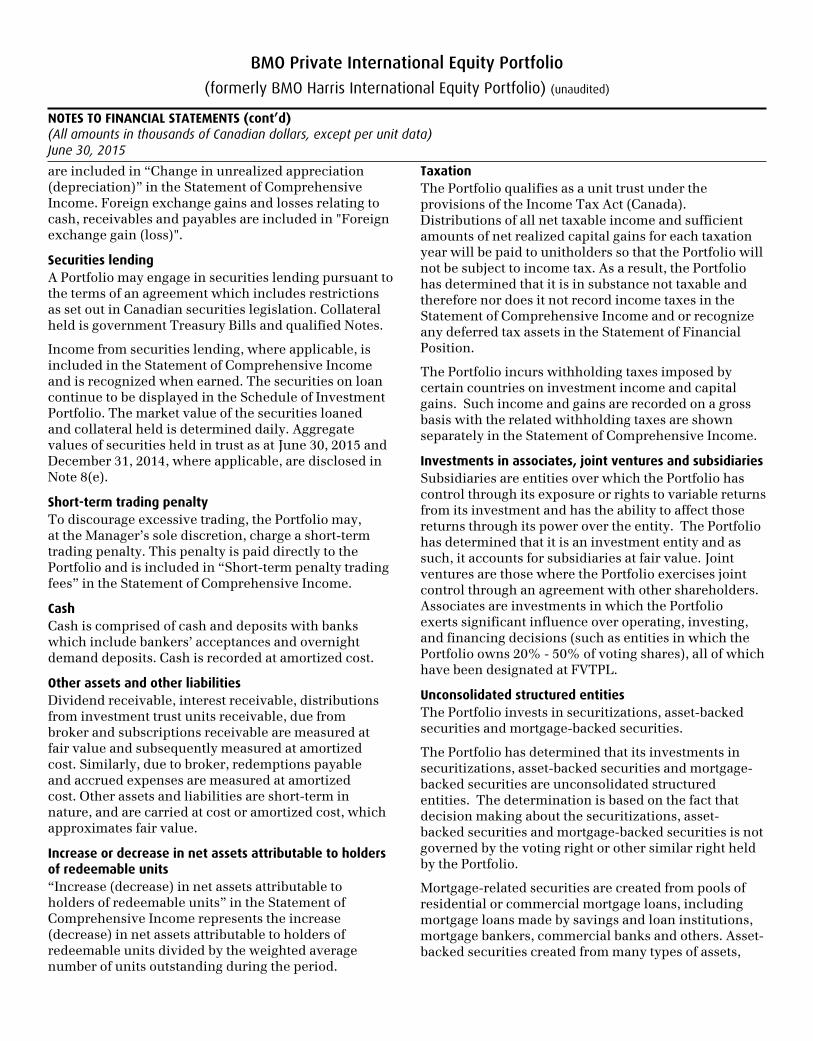
are included in “Change in unrealized appreciation (depreciation)” in the Statement of Comprehensive Income. Foreign exchange gains and losses relating to cash, receivables and payables are included in "Foreign exchange gain (loss)".
Securities lendingA Portfolio may engage in securities lending pursuant to the terms of an agreement which includes restrictions as set out in Canadian securities legislation. Collateral held is government Treasury Bills and qualified Notes.
Income from securities lending, where applicable, is included in the Statement of Comprehensive Income and is recognized when earned. The securities on loan continue to be displayed in the Schedule of Investment Portfolio. The market value of the securities loaned and collateral held is determined daily. Aggregate values of securities held in trust as at June 30, 2015 and December 31, 2014, where applicable, are disclosed in Note 8(e).
Short-term trading penaltyTo discourage excessive trading, the Portfolio may, at the Manager’s sole discretion, charge a short-term trading penalty. This penalty is paid directly to the Portfolio and is included in “Short-term penalty trading fees” in the Statement of Comprehensive Income.
CashCash is comprised of cash and deposits with banks which include bankers’ acceptances and overnight demand deposits. Cash is recorded at amortized cost.
Other assets and other liabilitiesDividend receivable, interest receivable, distributions from investment trust units receivable, due from broker and subscriptions receivable are measured at fair value and subsequently measured at amortized cost. Similarly, due to broker, redemptions payable and accrued expenses are measured at amortized cost. Other assets and liabilities are short-term in nature, and are carried at cost or amortized cost, which approximates fair value.
Increase or decrease in net assets attributable to holders of redeemable units“Increase (decrease) in net assets attributable to holders of redeemable units” in the Statement of Comprehensive Income represents the increase (decrease) in net assets attributable to holders of redeemable units divided by the weighted average number of units outstanding during the period.
TaxationThe Portfolio qualifies as a unit trust under the provisions of the Income Tax Act (Canada). Distributions of all net taxable income and sufficient amounts of net realized capital gains for each taxation year will be paid to unitholders so that the Portfolio will not be subject to income tax. As a result, the Portfolio has determined that it is in substance not taxable and therefore nor does it not record income taxes in the Statement of Comprehensive Income and or recognize any deferred tax assets in the Statement of Financial Position.
The Portfolio incurs withholding taxes imposed by certain countries on investment income and capital gains. Such income and gains are recorded on a gross basis with the related withholding taxes are shown separately in the Statement of Comprehensive Income.
Investments in associates, joint ventures and subsidiariesSubsidiaries are entities over which the Portfolio has control through its exposure or rights to variable returns from its investment and has the ability to affect those returns through its power over the entity. The Portfolio has determined that it is an investment entity and as such, it accounts for subsidiaries at fair value. Joint ventures are those where the Portfolio exercises joint control through an agreement with other shareholders. Associates are investments in which the Portfolio exerts significant influence over operating, investing, and financing decisions (such as entities in which the Portfolio owns 20% - 50% of voting shares), all of which have been designated at FVTPL.
Unconsolidated structured entitiesThe Portfolio invests in securitizations, asset-backed securities and mortgage-backed securities.
The Portfolio has determined that its investments in securitizations, asset-backed securities and mortgage-backed securities are unconsolidated structured entities. The determination is based on the fact that decision making about the securitizations, asset-backed securities and mortgage-backed securities is not governed by the voting right or other similar right held by the Portfolio.
Mortgage-related securities are created from pools of residential or commercial mortgage loans, including mortgage loans made by savings and loan institutions, mortgage bankers, commercial banks and others. Asset-backed securities created from many types of assets,
NOTES TO FINANCIAL STATEMENTS (cont’d)(All amounts in thousands of Canadian dollars, except per unit data)June 30, 2015
BMO Private International Equity Portfolio
(formerly BMO Harris International Equity Portfolio) (unaudited)
including auto loans, credit card receivables, home equity loans, and student loans.
The Portfolio does not provide and has not committed to providing any additional significant financial information or other support to the unconsolidated structured entities other than its investments in the unconsolidated structured entities. During the periods, the Portfolio had no sponsored unconsolidated structured entities.
Additional information on the Portfolio’s interest in unconsolidated structured entities, where applicable, is provided in Note 8.
Offsetting of financial assets and financial liabilitiesFinancial instruments are presented at net or gross amounts on the Statement of Financial Position depending on the existence of intention and legal right to offset opposite positions of such instruments held with the same counterparties. Amounts offset in the Statement of Financial Position are transactions for which the Portfolio has legally enforceable rights to offset and intends to settle the positions on a net basis. Amounts not offset in the Statement of Financial Position relate to transactions where a master netting arrangement or similar agreement is in place with a right of offset only in the event of default, insolvency or bankruptcy, or where the offset criteria are otherwise not met, including where the Portfolio has no intention to settling on a net basis. There were no master netting agreements during the periods.
Accounting standards issued but not yet adoptedBelow are accounting standards issued or amended but not yet effective and not yet adopted. The Manager does not expect the adoption of these standards or amendments to have a significant impact to the Portfolio’s financial statements.
In July 2014, the IASB issued the final version of IFRS 9 Financial Instruments, which addresses classification and measurement, impairment and hedge accounting.
The new standard requires assets to be carried at amortized cost, FVTPL or fair value through other comprehensive income based on the entity’s business model for managing financial assets and the contractual cash flow characteristics of the financial asset. The classification and measurement of liabilities remains generally unchanged with the exception of liabilities recorded at FVTPL. For these liabilities, fair value changes attributable to changes in the entity’s own
credit risk are to be presented in other comprehensive income unless they affect amounts recorded in income.
The new standard also addresses impairment of financial assets. It also introduced a new hedge accounting model that expands the scope of eligible hedged items and risks eligible for hedge accounting, and aligns hedge accounting more closely with risk management.
The new standard is effective for the Portfolio for its fiscal year beginning January 1, 2018. The Portfolio is evaluating the impact of this standard on its financial statements.
4. Critical accounting estimates and judgementsThe preparation of financial statements requires the use of judgement in applying the Portfolio’s accounting policies and to make estimates and assumptions about the future. The following discusses the most significant accounting judgements and estimates that the Portfolio has made in preparing its financial statements:
Accounting judgements:Functional and presentation currencyThe Portfolio unitholders are mainly Canadian residents, with the subscriptions and redemptions of the redeemable units denominated in Canadian dollars. The Portfolio invests in Canadian and U.S. dollars and other foreign denominated securities, as applicable. The performance of the Portfolio is measured and reported to the investors in Canadian dollars. The Manager considers the Canadian dollar as the currency that most faithfully represents the economic effects of the underlying transactions, events and conditions. The financial statements are presented in Canadian dollars, which is the Portfolio's functional and presentation currency.
Classification of measurement of financial instruments and application of fair value optionIn classifying and measuring financial instruments held by the Portfolio, the Manager is required to make significant judgements about whether or not the business of the Portfolio is to invest on a total return basis for the purpose of applying the fair value options for financial assets.
Accounting estimates:Fair value measurement of securities not quoted in an active marketThe Portfolio has established policies and control procedures that are intended to ensure these
NOTES TO FINANCIAL STATEMENTS (cont’d)(All amounts in thousands of Canadian dollars, except per unit data)June 30, 2015
BMO Private International Equity Portfolio
(formerly BMO Harris International Equity Portfolio) (unaudited)
judgements are well controlled, independently reviewed, and consistently applied from period to period. The estimates of the value of the Portfolio’s assets and liabilities are believed to be appropriate as at the reporting date.
The Portfolio may hold financial instruments that are not quoted in active markets. Note 3 discusses the policies used by the Portfolio for the estimates used in determining fair value.
5. Units and unit transactionsThe redeemable units of the Portfolio are classified as liabilities.
The units have no par value and are entitled to distributions, if any. Upon redemption, a unit is entitled to a proportionate share of the Portfolio’s NAV. The Portfolio is required to pay distributions in an amount not less than the amount necessary to ensure the Portfolio will not be liable for income taxes. The Portfolio has no restrictions or specific capital requirements on the subscriptions and redemptions of units except as disclosed in Note 8(a). The relevant movements in redeemable units are shown on the Statement of Changes in Net Assets Attributable to Holders of Redeemable Units. In accordance with its investment objectives and strategies, and the risk management practices outlined in Note 7, the Portfolio endeavours to invest the subscriptions received in appropriate investments, while maintaining sufficient liquidity to meet redemptions, with such liquidity being augmented by short-term borrowings or disposal of investments where necessary.
Redeemable units of the Portfolio are offered for sale on a continuous basis and may be purchased or redeemed on any Valuation Date at the NAV per unit of a particular series. The NAV per unit for the purposes of subscription or redemption is computed by dividing the NAV of the Portfolio (that is, the total fair value of the assets less the liabilities) by the total number of units of the Portfolio outstanding at such time.
6. Related party transactions(a) Unitholder servicing, sub-advisory commissions and other portfolio transaction costsThe Portfolio is provided with certain facilities and services by affiliates of the Manager. Expenses incurred in the administration of the Portfolio were paid to BMO Trust Company (“the Trustee”) and to BMO Asset Management Inc. (“the Registrar”) and charged to the Portfolio. These expenses are included in “Unitholder
servicing fees” in the Statement of Comprehensive Income.
The sub-advisors (including affiliates of the Manager, where applicable) engaged by the Manager provide investment advice and make investment decisions for the Portfolio’s investment portfolio. For these services the sub-advisors receive sub-advisory fees that are paid monthly by the Manager. These expenses are included in “Sub-advisory fees” in the Statement of Comprehensive Income. Any sub-advisory fees less than or equal to 0.15% of the net asset value of the Portfolio are absorbed by the Manager.
The Portfolio may execute trades with and or through BMO Nesbit Burns Inc., an affiliate of the Manager based on established standard brokerage agreements at market prices. These fees are included in “Commissions and other portfolio transaction costs” in the Statement of Comprehensive Income. Refer to Note 8 for related party fees charged to the Portfolio for the periods ended June 30, 2015 and June 30, 2014.
(b) Other related party transactionsFrom time to time, the Manager may on behalf of the Portfolio enter into transactions or arrangements with or involving subsidiaries or affiliates of Bank of Montreal, or certain other persons or companies that are related or connected to the Manager of the Portfolio. These transactions or arrangements may include transactions or arrangements with or involving subsidiaries and affiliates of Bank of Montreal, BMO Trust Company, BMO Nesbitt Burns Inc., BMO Private Investment Counsel Inc., BMO Asset Management Inc., BMO Asset Management Corp., BMO Investments Inc., Pyrford International Ltd, or other investment funds offered by Bank of Montreal, and may involve the purchase or sale of portfolio securities through or from a subsidiary or affiliate of Bank of Montreal, the purchase or sale of securities issued or guaranteed by a subsidiary or affiliate of Bank of Montreal, entering into forward contracts with a subsidiary or affiliate of Bank of Montreal acting as counterparty, the purchase or redemption of units of other Bank of Montreal affiliated investment funds or the provision of services to the Manager.
7. Financial instruments risksThe Portfolio’s activities expose it to a variety of risks associated with the financial instruments, as follows: market risk (including currency risk, interest rate risk and other market risk), credit risk and liquidity risk. The concentration table groups securities by asset
NOTES TO FINANCIAL STATEMENTS (cont’d)(All amounts in thousands of Canadian dollars, except per unit data)June 30, 2015
BMO Private International Equity Portfolio
(formerly BMO Harris International Equity Portfolio) (unaudited)
type, geographic location and/or market segment. The Portfolio’s risk management practice outlines the monitoring of compliance to investment guidelines.
The Manager manages the potential effects of these financial risks on the Portfolio’s performance by employing and overseeing professional and experienced portfolio managers that regularly monitor the Portfolio’s positions, market events and diversify investment portfolios within the constraints of the investment guidelines.
(a) Currency riskCurrency risk is the risk that the value of financial instruments denominated in currencies, other than the functional currency of the Portfolio, will fluctuate due to changes in foreign exchange rates. Investments in foreign markets are exposed to currency risk as the prices denominated in foreign currencies are converted to the Portfolio’s functional currency in determining fair value. The Portfolio may enter into forward currency contracts for hedging purposes to reduce foreign currency exposure or to establish exposure to foreign currencies. The Portfolio’s exposure to currency risk, if any, is further disclosed in Note 8.
(b) Interest rate riskInterest rate risk is the risk that the fair value of the Portfolio's interest-bearing investments will fluctuate due to changes in market interest rates. The Portfolio's exposure to interest rate risk is concentrated in its investment in debt securities (such as bonds, money market investments, short-term investments and debentures) and interest rate derivative instruments, if any. Other assets and liabilities are short-term in nature and/or non-interest bearing. The Portfolio's exposure to interest rate risk, if any, is further discussed in Note 8.
(c) Other market riskOther market risk is the risk that the fair value of a financial instrument will fluctuate as a result of changes in market prices (other than those arising from interest rate risk or currency risk), whether those changes are caused by factors specific to the individual financial instrument or its issuer, or factors affecting all similar financial instruments traded in a market. Other assets and liabilities are monetary items that are short-term in nature, as such they are not subject to other market risk. The Portfolio's exposure to other market risk, if any, is further discussed in Note 8.
(d) Credit riskCredit risk is the risk that a loss could arise from a security issuer or counterparty to a financial instrument not being able to meet its financial obligations. The fair value of debt securities includes consideration of the credit worthiness of the debt issuer. Credit risk exposure for over-the-counter derivative instruments is based on the Portfolio's unrealized gain of the contractual obligations with the counterparty as at the reporting date. The credit exposure of other assets is represented by its carrying amount. The Portfolio's exposure to credit risk, if any, is further discussed in Note 8.
The Portfolio may enter into securities lending transactions with approved counterparties. Credit risk associated with these transactions is considered minimal as all counterparties have a sufficient approved credit rating and the market value of collateral held by the Portfolio must be at least 102% of the fair value of securities loaned, as disclosed in Note 8.
(e) Liquidity riskThe Portfolio's exposure to liquidity risk is concentrated in the daily cash redemptions of units. The Portfolio primarily invests in securities that are traded in active markets and can be readily disposed. In addition, the Portfolio retains sufficient cash and cash equivalent positions to maintain liquidity. The Portfolio may, from time to time, enter into over-the-counter derivative contracts or invest in unlisted securities, which are not traded in an organized market and may be illiquid. Securities for which a market quotation could not be obtained and may be illiquid are identified on the Statement of Investment Portfolio. The proportion of illiquid securities to the NAV of the Portfolio is monitored by the Manager to ensure it does not exceed the regulatory limit and does not significantly affect the liquidity required to meet the Portfolio's financial obligations.
NOTES TO FINANCIAL STATEMENTS(All amounts in thousands of Canadian dollars, except per unit data)June 30, 2015
BMO Private International Equity Portfolio
(formerly BMO Harris International Equity Portfolio) (unaudited)
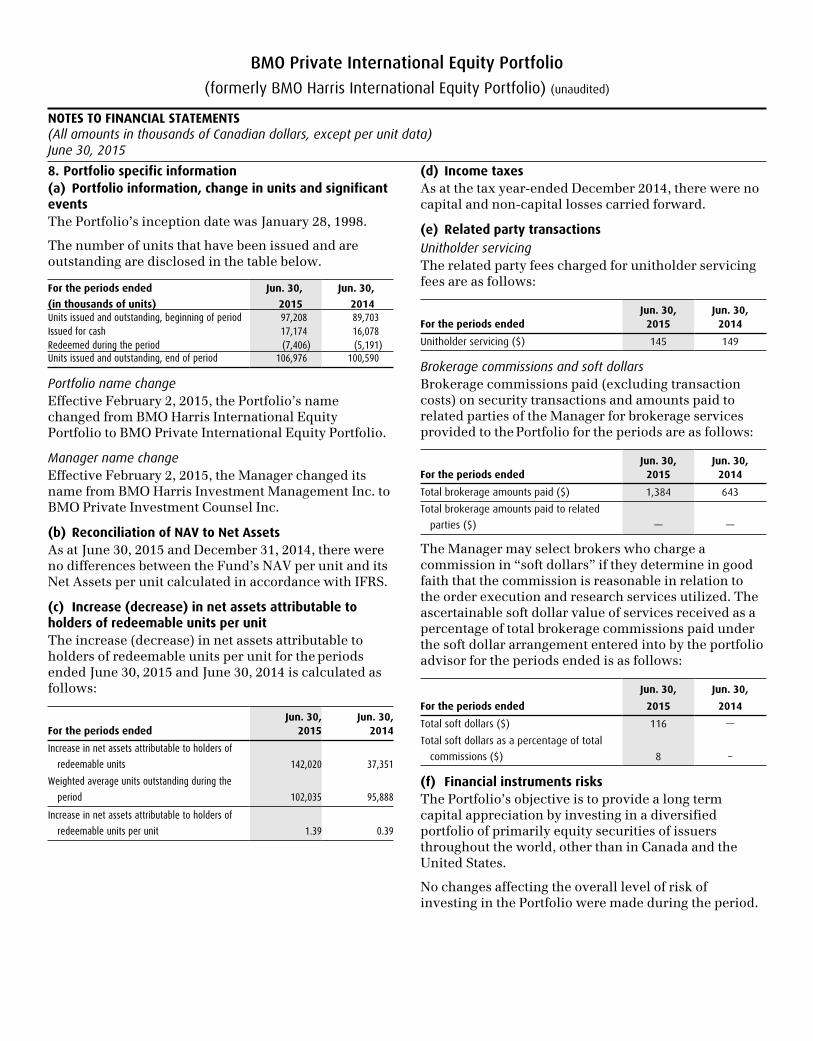
8. Portfolio specific information(a) Portfolio information, change in units and significant eventsThe Portfolio’s inception date was January 28, 1998.
The number of units that have been issued and are outstanding are disclosed in the table below.
For the periods ended (in thousands of units)
Jun. 30,
2015
Jun. 30,
2014Units issued and outstanding, beginning of period 97,208 89,703Issued for cash 17,174 16,078Redeemed during the period (7,406) (5,191)Units issued and outstanding, end of period 106,976 100,590
Portfolio name changeEffective February 2, 2015, the Portfolio’s name changed from BMO Harris International Equity Portfolio to BMO Private International Equity Portfolio.
Manager name changeEffective February 2, 2015, the Manager changed its name from BMO Harris Investment Management Inc. to BMO Private Investment Counsel Inc.
(b) Reconciliation of NAV to Net AssetsAs at June 30, 2015 and December 31, 2014, there were no differences between the Fund’s NAV per unit and its Net Assets per unit calculated in accordance with IFRS.
(c) Increase (decrease) in net assets attributable to holders of redeemable units per unitThe increase (decrease) in net assets attributable to holders of redeemable units per unit for the periods ended June 30, 2015 and June 30, 2014 is calculated as follows:
Jun. 30, Jun. 30,For the periods ended 2015 2014
Increase in net assets attributable to holders of
redeemable units 142,020 37,351
Weighted average units outstanding during the
period 102,035 95,888
Increase in net assets attributable to holders of
redeemable units per unit 1.39 0.39
(d) Income taxesAs at the tax year-ended December 2014, there were no capital and non-capital losses carried forward.
(e) Related party transactionsUnitholder servicingThe related party fees charged for unitholder servicing fees are as follows:
Jun. 30, Jun. 30,For the periods ended 2015 2014
Unitholder servicing ($) 145 149
Brokerage commissions and soft dollarsBrokerage commissions paid (excluding transaction costs) on security transactions and amounts paid to related parties of the Manager for brokerage services provided to the Portfolio for the periods are as follows:
Jun. 30, Jun. 30,For the periods ended 2015 2014
Total brokerage amounts paid ($) 1,384 643
Total brokerage amounts paid to related
parties ($) — —
The Manager may select brokers who charge a commission in “soft dollars” if they determine in good faith that the commission is reasonable in relation to the order execution and research services utilized. The ascertainable soft dollar value of services received as a percentage of total brokerage commissions paid under the soft dollar arrangement entered into by the portfolio advisor for the periods ended is as follows:
Jun. 30, Jun. 30,
For the periods ended 2015 2014
Total soft dollars ($) 116 —
Total soft dollars as a percentage of total
commissions ($) 8 –
(f) Financial instruments risksThe Portfolio’s objective is to provide a long term capital appreciation by investing in a diversified portfolio of primarily equity securities of issuers throughout the world, other than in Canada and the United States.
No changes affecting the overall level of risk of investing in the Portfolio were made during the period.
NOTES TO FINANCIAL STATEMENTS (cont’d)(All amounts in thousands of Canadian dollars, except per unit data)June 30, 2015
BMO Private International Equity Portfolio
(formerly BMO Harris International Equity Portfolio) (unaudited)
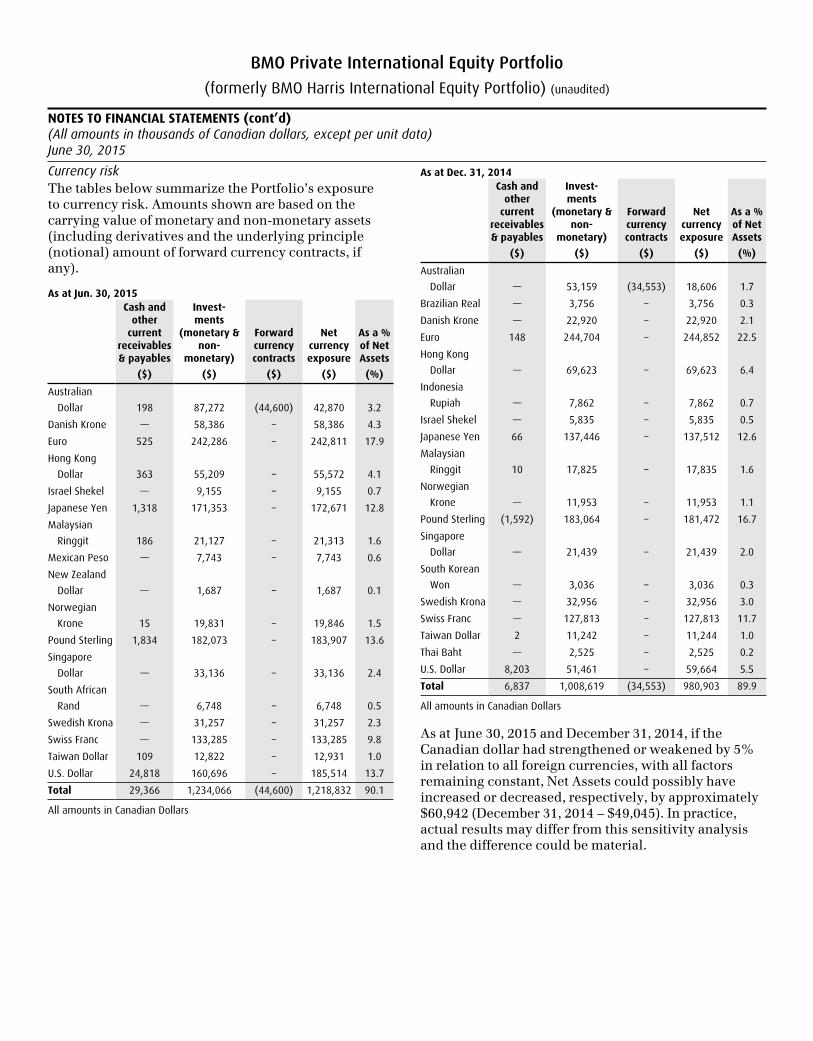
Currency riskThe tables below summarize the Portfolio’s exposure to currency risk. Amounts shown are based on the carrying value of monetary and non-monetary assets (including derivatives and the underlying principle (notional) amount of forward currency contracts, if any).
As at Jun. 30, 2015Cash and
other current
receivables & payables
($)
Invest- ments
(monetary & non-
monetary)
($)
Forward currency contracts
($)
Net currency exposure
($)
As a % of Net Assets
(%)
Australian
Dollar 198 87,272 (44,600) 42,870 3.2
Danish Krone — 58,386 – 58,386 4.3
Euro 525 242,286 – 242,811 17.9
Hong Kong
Dollar 363 55,209 – 55,572 4.1
Israel Shekel — 9,155 – 9,155 0.7
Japanese Yen 1,318 171,353 – 172,671 12.8
Malaysian
Ringgit 186 21,127 – 21,313 1.6
Mexican Peso — 7,743 – 7,743 0.6
New Zealand
Dollar — 1,687 – 1,687 0.1
Norwegian
Krone 15 19,831 – 19,846 1.5
Pound Sterling 1,834 182,073 – 183,907 13.6
Singapore
Dollar — 33,136 – 33,136 2.4
South African
Rand — 6,748 – 6,748 0.5
Swedish Krona — 31,257 – 31,257 2.3
Swiss Franc — 133,285 – 133,285 9.8
Taiwan Dollar 109 12,822 – 12,931 1.0
U.S. Dollar 24,818 160,696 – 185,514 13.7
Total 29,366 1,234,066 (44,600) 1,218,832 90.1
All amounts in Canadian Dollars
As at Dec. 31, 2014Cash and
other current
receivables & payables
($)
Invest- ments
(monetary & non-
monetary)
($)
Forward currency contracts
($)
Net currency exposure
($)
As a % of Net Assets
(%)
Australian
Dollar — 53,159 (34,553) 18,606 1.7
Brazilian Real — 3,756 – 3,756 0.3
Danish Krone — 22,920 – 22,920 2.1
Euro 148 244,704 – 244,852 22.5
Hong Kong
Dollar — 69,623 – 69,623 6.4
Indonesia
Rupiah — 7,862 – 7,862 0.7
Israel Shekel — 5,835 – 5,835 0.5
Japanese Yen 66 137,446 – 137,512 12.6
Malaysian
Ringgit 10 17,825 – 17,835 1.6
Norwegian
Krone — 11,953 – 11,953 1.1
Pound Sterling (1,592) 183,064 – 181,472 16.7
Singapore
Dollar — 21,439 – 21,439 2.0
South Korean
Won — 3,036 – 3,036 0.3
Swedish Krona — 32,956 – 32,956 3.0
Swiss Franc — 127,813 – 127,813 11.7
Taiwan Dollar 2 11,242 – 11,244 1.0
Thai Baht — 2,525 – 2,525 0.2
U.S. Dollar 8,203 51,461 – 59,664 5.5
Total 6,837 1,008,619 (34,553) 980,903 89.9
All amounts in Canadian Dollars
As at June 30, 2015 and December 31, 2014, if the Canadian dollar had strengthened or weakened by 5% in relation to all foreign currencies, with all factors remaining constant, Net Assets could possibly have increased or decreased, respectively, by approximately $60,942 (December 31, 2014 – $49,045). In practice, actual results may differ from this sensitivity analysis and the difference could be material.
NOTES TO FINANCIAL STATEMENTS (cont’d)(All amounts in thousands of Canadian dollars, except per unit data)June 30, 2015
BMO Private International Equity Portfolio
(formerly BMO Harris International Equity Portfolio) (unaudited)
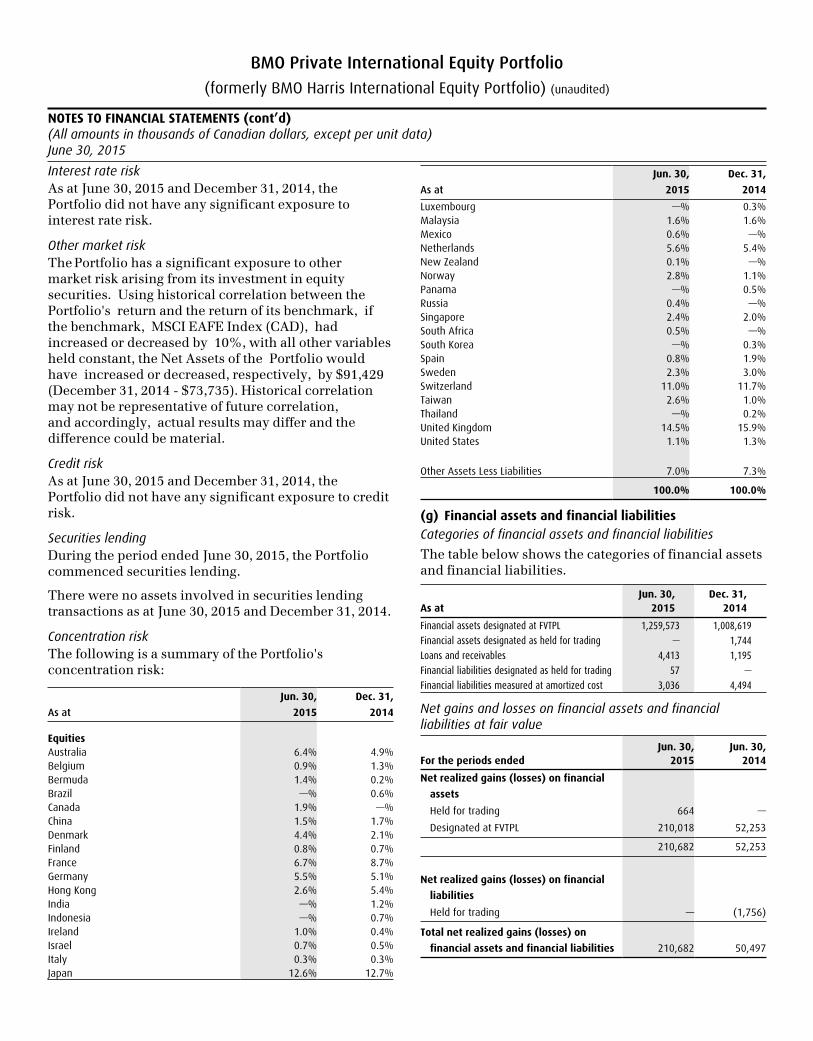
Interest rate riskAs at June 30, 2015 and December 31, 2014, the Portfolio did not have any significant exposure to interest rate risk.
Other market riskThe Portfolio has a significant exposure to other market risk arising from its investment in equity securities. Using historical correlation between the Portfolio's return and the return of its benchmark, if the benchmark, MSCI EAFE Index (CAD), had increased or decreased by 10%, with all other variables held constant, the Net Assets of the Portfolio would have increased or decreased, respectively, by $91,429 (December 31, 2014 - $73,735). Historical correlation may not be representative of future correlation, and accordingly, actual results may differ and the difference could be material.
Credit riskAs at June 30, 2015 and December 31, 2014, the Portfolio did not have any significant exposure to credit risk.
Securities lendingDuring the period ended June 30, 2015, the Portfolio commenced securities lending.
There were no assets involved in securities lending transactions as at June 30, 2015 and December 31, 2014.
Concentration riskThe following is a summary of the Portfolio's concentration risk:
As at
Jun. 30,
2015
Dec. 31,
2014
EquitiesAustralia 6.4% 4.9%Belgium 0.9% 1.3%Bermuda 1.4% 0.2%Brazil —% 0.6%Canada 1.9% —%China 1.5% 1.7%Denmark 4.4% 2.1%Finland 0.8% 0.7%France 6.7% 8.7%Germany 5.5% 5.1%Hong Kong 2.6% 5.4%India —% 1.2%Indonesia —% 0.7%Ireland 1.0% 0.4%Israel 0.7% 0.5%Italy 0.3% 0.3%Japan 12.6% 12.7%
As at
Jun. 30,
2015
Dec. 31,
2014
Luxembourg —% 0.3%Malaysia 1.6% 1.6%Mexico 0.6% —%Netherlands 5.6% 5.4%New Zealand 0.1% —%Norway 2.8% 1.1%Panama —% 0.5%Russia 0.4% —%Singapore 2.4% 2.0%South Africa 0.5% —%South Korea —% 0.3%Spain 0.8% 1.9%Sweden 2.3% 3.0%Switzerland 11.0% 11.7%Taiwan 2.6% 1.0%Thailand —% 0.2%United Kingdom 14.5% 15.9%United States 1.1% 1.3%
Other Assets Less Liabilities 7.0% 7.3%
100.0% 100.0%
(g) Financial assets and financial liabilitiesCategories of financial assets and financial liabilities
The table below shows the categories of financial assets and financial liabilities.
Jun. 30, Dec. 31,As at 2015 2014
Financial assets designated at FVTPL 1,259,573 1,008,619
Financial assets designated as held for trading — 1,744
Loans and receivables 4,413 1,195
Financial liabilities designated as held for trading 57 —
Financial liabilities measured at amortized cost 3,036 4,494
Net gains and losses on financial assets and financial liabilities at fair value
Jun. 30, Jun. 30,For the periods ended 2015 2014
Net realized gains (losses) on financial
assets
Held for trading 664 —
Designated at FVTPL 210,018 52,253
210,682 52,253
Net realized gains (losses) on financial
liabilities
Held for trading — (1,756)
Total net realized gains (losses) on
financial assets and financial liabilities 210,682 50,497
NOTES TO FINANCIAL STATEMENTS (cont’d)(All amounts in thousands of Canadian dollars, except per unit data)June 30, 2015
BMO Private International Equity Portfolio
(formerly BMO Harris International Equity Portfolio) (unaudited)
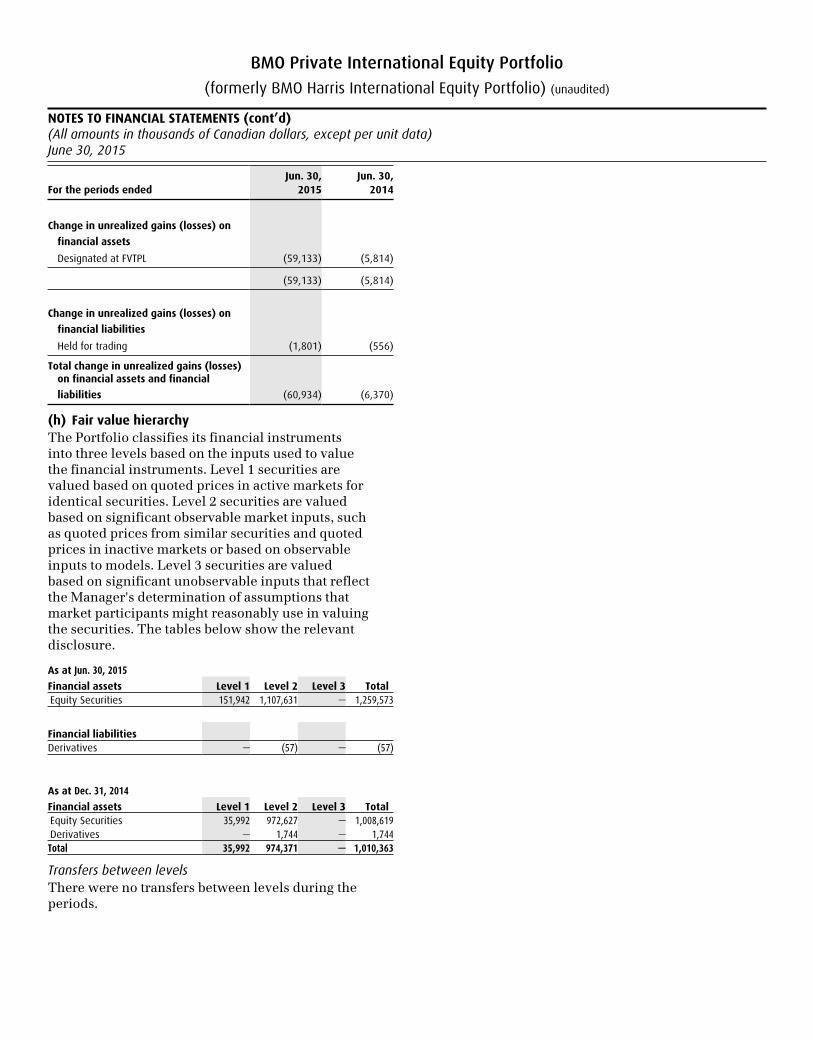
Jun. 30, Jun. 30,For the periods ended 2015 2014
Change in unrealized gains (losses) on
financial assets
Designated at FVTPL (59,133) (5,814)
(59,133) (5,814)
Change in unrealized gains (losses) on
financial liabilities
Held for trading (1,801) (556)
Total change in unrealized gains (losses) on financial assets and financial
liabilities (60,934) (6,370)
(h) Fair value hierarchyThe Portfolio classifies its financial instruments into three levels based on the inputs used to value the financial instruments. Level 1 securities are valued based on quoted prices in active markets for identical securities. Level 2 securities are valued based on significant observable market inputs, such as quoted prices from similar securities and quoted prices in inactive markets or based on observable inputs to models. Level 3 securities are valued based on significant unobservable inputs that reflect the Manager's determination of assumptions that market participants might reasonably use in valuing the securities. The tables below show the relevant disclosure.
As at Jun. 30, 2015
Financial assets Level 1 Level 2 Level 3 Total Equity Securities 151,942 1,107,631 — 1,259,573
Financial liabilitiesDerivatives — (57) — (57)
As at Dec. 31, 2014
Financial assets Level 1 Level 2 Level 3 Total Equity Securities 35,992 972,627 — 1,008,619 Derivatives — 1,744 — 1,744Total 35,992 974,371 — 1,010,363
Transfers between levelsThere were no transfers between levels during the periods.
®”BMO (M-bar roundel symbol) Private Banking” is a registered trade-mark of Bank of Montreal, used under licence. BMO Private Banking is comprised of Bank of Montreal,BMO Private Investment Counsel Inc. and BMO Trust Company. Banking services are offered through Bank of Montreal. Investment management services are offered through BMO Private Investment Counsel Inc.., an indirect subsidiary of Bank of Montreal. Estate, trust, planning, administration and custodial services are offered through BMO Trust Company, a wholly owned subsidiary of Bank of Montreal.
ManagerBMO Private Investment Counsel Inc.1 First Canadian Place100 King St. W., 41st Floor Toronto, Ontario M5X 1A1
TrusteeBMO Trust Company1 First Canadian Place100 King St. W., 41st Floor Toronto, Ontario M5X 1A1
Independent AuditorPricewaterhouseCoopers LLP PwC Tower18 York Street, Suite 2600Toronto, Ontario M5J 0B2
www.bmoprivatebanking.com
For more information please call 1-800-361-1392