annals of nuclear energy - we canfigurethisout.org · simulation of a gas-cooled fluidized bed...
TRANSCRIPT

Annals of Nuclear Energy 37 (2010) 1014–1025
Contents lists available at ScienceDirect
Annals of Nuclear Energy
journal homepage: www.elsevier .com/locate /anucene
Technical note
Simulation of a gas-cooled fluidized bed nuclear reactor – Part II: Stabilityof a fluidized bed reactor with mixed oxide fuels
B.E. Miles *, C.C. Pain, J.L.M.A. GomesDepartment of Earth Sciences and Engineering, Imperial College, London, UK
a r t i c l e i n f o a b s t r a c t
Article history:Received 23 October 2009Received in revised form 14 March 2010Accepted 16 March 2010
Keywords:Fluidized bed reactorCoupled Radiation Transport MultiphaseFluid DynamicsFETCHTransientPlutonium
0306-4549/$ - see front matter � 2010 Elsevier Ltd. Adoi:10.1016/j.anucene.2010.03.009
* Corresponding author.E-mail address: [email protected] (B.E
Fertile materials can be converted by nuclear reaction into a transuranic mixture with a fissile content,mostly plutonium isotopes. Fuel which includes a limited proportion of plutonium is already used insome reactors. Use is restricted by the smaller delayed neutron yield and lower negative temperaturecoefficient of reactivity compared with uranium fuels.
A reactor with an additional stability feedback would make possible an increased use of plutoniumfuels. This feedback mechanism is present in a novel conceptual High Temperature Gas Cooled Reactor(HTGR) where the TRISO particles are fluidized by the coolant gas.
Spatial and time dependent simulations using the coupled Radiation Transport and ComputationalMultiphase Fluid Dynamic code FETCH are applied to investigations of this stability. The reactor has beeninvestigated using plutonium fuel of various isotopic compositions. The temperature coefficient of reac-tivity may not be negative, depending on the isotopic composition of the fuel. The reactor is found stable.The amplitudes of power fluctuations increase however. These cause fluctuations in fuel temperaturewhich can be excessive unless the average power is reduced, compared with that produced from a ura-nium fuel.
The time dependent calculations are repeated using, in the neutron transport, data representing hypo-thetical fuels with zero temperature coefficient and/or zero delayed neutron yield.
� 2010 Elsevier Ltd. All rights reserved.
1. Introduction
1.1. Background
The predicted increase in the consumption of electrical energywill require increased use of nuclear energy. At the same time con-cerns over the disposal of radio-active waste require an environ-mentally responsible fuel cycle. A logical way to achieve this is agreater utilisation of fissile material converted from fertile mate-rial. The conversion process is known as breeding.
235U is the sole fissile isotope which occurs naturally. Naturaluranium contains only 0.7% of this isotope. Because of neutron cap-ture the majority of currently operating reactors require 3–5% fis-sile uranium (Low Enriched Uranium, LEU). In a preceding paper(Miles et al., submitted for publication), firstly the nuclear proper-ties of fuels containing the bred material were compared withthose of LEU. Secondly the types of reactor which can use the con-verted fissile material were compared.
In the 1960s and 1970s there was considerable interest in thebreeding of fissile material (see, for example Glasstone, 1967).Some developments in the commercial energy market in the last
ll rights reserved.
. Miles).
few years make it once again worthwhile to consider the conver-sion of fertile material to fissile. An increased price of enriched ura-nium is an incentive to convert the fertile 238U in depleted uraniumto fissile plutonium. Depleted uranium then becomes an assetrather than a cost.
In reprocessing plants, such as Sellafield and Cap la Hague,spent fuel from power reactors is separated by means of chemicalprocesses into uranium, plutonium (approximately 1% of the total)and fission products. There is also a stock of plutonium containingmore than 90% fissile isotopes, referred to in the literature asWeapons Grade plutonium (WG) (Stacey, 2004).
An example of fissile plutonium recycle is the mixed uraniumand plutonium oxide fuel (MOX) already used to a limited extentin some Light Water Reactors (NEA/OECD, 2006). Some safety re-straints are described in Galperin (1995). They are related to reac-tivity feedback, control rod worth, boron worth, moderatortemperature coefficient (MTC) and shutdown margin (see Frances-chini and Petrovic, 2008).
An international benchmarking exercise certifies codes for theutilisation of WG plutonium in MOX. A basis for benchmarkanalyses (Thilagam et al., 2009) is 1/3 MOX in a typical 1000 MWelectrical VVER PWR. The European Utility Requirements (EUR)document states that the next generation of European reactor coredesign shall be optimised for UO2 fuel assemblies with provision

Nomenclature
x (vector) point in spaceT reactor response time (s)k neutron multiplication factorl prompt neutron lifetime (s)hgs convective heat transfer coefficient, solid to gas
(W m�2 K�1)Re Reynolds numberPr Prandtl numberNu Nusselt number
Ts temperature of a particle surface (K)Tg temperature of the gas surrounding a particle (K)q typical steady fission power in a particle (W)ds diameter of a particle (m)Cps specific heat of the material in a particle (J kg�1 K�1)b delayed neutron yieldqs density of a particle (kg m�3)
B.E. Miles et al. / Annals of Nuclear Energy 37 (2010) 1014–1025 1015
for up to 50% MOX assemblies. In Fetterman (2009) it is demon-strated that the Westinghouse AP1000 is capable of complyingwith this provision without significant design changes. The pluto-nium is from LWR spent fuel and the uranium in this MOX is tailsmaterial. The plutonium content in MOX varies from 9% to 17%. InCuevas Vivas et al. (2002) a method is presented for optimising thedistribution of a range of plutonium contents in MOX fuel ele-ments. Here WG plutonium is used in PWR fuel and ex LWR pluto-nium in BWR fuel. Alternatives to uranium in MOX, neutronicallyinert oxides such as zirconia and alumina, are investigated in Lom-bardi and Mazzola (1996) and Paratte and Chawla (1995). Severalstudies describe possible changes to the design and operation ofreactors, together with the processing of spent fuels, to reducethe volume of the long-life radio-toxicity of the waste by a factorof 100. The residual radioactivity left would then be comparablewith that of the initial natural uranium after several hundred years(Frois, 2008).
The International Reactor Innovative and Secure (IRIS) is a small(1000 MW thermal) advanced Westinghouse Pressurised WaterReactor (PWR). An alternative fuel is a 100% MOX core (Franceschi-ni and Petrovic, 2008). Its fissile content (239Pu and 241Pu) is 5.5%compared with 4.95% 235U. Compared with a typical PWR the ratioof moderator (water) to fuel is increased by 50% because of safetyrestraints. An alternative method of increasing the moderator tofuel ratio in a PWR, by adding graphite in the centre of fuel rods,is described in Jo et al. (2000).
Modifications to the NEA/OECD benchmark fuel in a BoilingWater Reactor (BWR) are proposed in Francois et al. (2002). Themoderator to fuel ratio is increased. The fuel is 100% MOX.
Several studies of the incineration of plutonium and MinorActinides (MA) in HTGR are reported in Kuijper et al. (2006). Theobjective was maximum plutonium incineration. The fuel was pureplutonium oxide. About 70% of the plutonium was fissile (that indi-cates probable ex LWR plutonium). In these analyses high burnupin an HTGR compared with that in an LWR is found possible. Forfirst generation fuel they are in the range of 70 MWd/kg foronce-through fuel. They are very much higher, 700 MWd/kg, whenthe HTGR is a Pebble Bed Reactor (PBR) in which the fuel can becontinuously recycled. Less than 20% of the plutonium remains inthe finally discharged fuel. Temperature coefficients of reactivityremain negative. However, for a plutonium of a second generationthe burn up has to be reduced, to about 440 MWd/kg with morethan 40% of the plutonium remaining. Processing of HTGR spentfuel is described in Masson et al. (2006). After crushing and incin-eration of the PBR or block graphite in a matrix surrounding theTRISO particle, the particles themselves are fragmented and theirkernels are dissolved in nitric acid.
Studies (Hoggett-Jones et al., 2002; Alander et al., 2006; Salvat-ores, 2006) compare reactor and accelerator approaches to spentnuclear fuel management.
Following conversion from fertile material, plutonium togetherwith other transuranic elements can in principle be repeatedly sep-
arated from the fission products in spent fuel and recycled. The iso-topic composition of these mixtures of transuranic elements, inparticular the fissile content, depends on the neutron energy spec-tra in the reactors from which the fuels were recovered.
1.2. Objectives and review
A thermal reactor which can use more fissile transuranic iso-topes would help to make better use of an energy resource andto reduce the radioactivity in nuclear waste.
A reactor which uses helium as a medium to fluidise a bed ofparticles and as a coolant to remove fission heat has been proposed(Rots and van der Hagen, 1996). The fuel is contained in 1 mmdiameter coated particles consisting of a kernel of uranium or plu-tonium oxide with a diameter of 0.2–0.3 mm surrounded by sev-eral layers of graphite and silicon carbide. They are known asTRISO particles (TRistructural ISOtropic).
Stability of a nuclear reactor with respect to short term fluctu-ations of power level depends on reactivity variation with temper-ature. For different MOX fuels, the temperature coefficients ofreactivity and their importance were discussed in a previous paper(Miles et al., submitted for publication). Depending on fuel compo-sition, for example as fission products accumulate with burn up,and on the proportion of fuel and moderator in a pebble, it is pos-sible for a coefficient to occur which is no longer negative.
Time dependent analyses of the fluidized bed reactor are pre-sented in this paper for fuels in which hypothetical propertiesare simulated, including a zero temperature coefficient. Theirbehaviour is discussed and conclusions are drawn, in particularthe fuels’ ability to produce power. Zero delayed neutron fractionsin fuels are also simulated. A feedback mechanism is identifiedwhich is important for stability of the reactor and which resultsfrom an interaction between neutronics and fluid mechanics.
2. Codes
Transient behaviour is analysed using the same deterministictime-dependant code FETCH as used in Miles et al. (submittedfor publication).
Material neutron cross sections for use in FETCH are generatedusing the lattice cell code WIMS9A. Cross sections are self shieldedand collision probabilities (Duderstadt and Hamilton, 1976; Stacey,2004) are calculated. A data base for the material regions is con-densed into six energy groups. The process is repeated at severaltemperature levels. The variation of the effective neutron multipli-cation factor keff with temperature is one of the feedback mecha-nisms which determine the time dependent stability of thereactor. As the temperature coefficient becomes less negative, sta-bility has to be achieved by other means. To test whether this ispossible, in a hypothetical fuel, WIMS data is modified so thatthe group constants produced at each temperature are identical.The time dependent behaviour of a fuel is also influenced by the
1016 B.E. Miles et al. / Annals of Nuclear Energy 37 (2010) 1014–1025
proportion of the fission neutrons which are not prompt but aredelayed. In order to investigate the influence of the fraction of fis-sion neutrons which are produced after a delay, a fuel with thehypothetical property of a zero fraction of such neutrons is speci-fied in FETCH input files.
These two material properties are vital for the stability of con-ventional reactors which have fuels fixed in space. The results oftests in which these properties have been removed from the fueland other materials in this reactor are presented and discussedin Section 3.
3. Time dependent calculations
3.1. Stability
In MOX fuel, 239Pu has a lower delayed neutron yield ðbÞ than241Pu. MOX fuel with WG plutonium has the largest 239Pu content.This fuel is used as basis for hypothetical fuels in which the differ-ent feedback effects are investigated after having been isolatedfrom each other. The conventional stability feedback mechanismsare removed, one by one.
The reactor which is used for this investigation is one alreadyused in Miles et al. (submitted for publication). The introductionof a graphite cylinder into the centre of the fluidized bed was foundto improve neutron economy. This variation in geometry (Fig. 1) ischosen for this investigation.
Firstly, the temperature coefficient of reactivity is set to zero.This coefficient would in reality be influenced during the operationof a reactor by the production of fission products. The fresh fuel hasa negative temperature coefficient at all temperatures. Fissionproducts can have the effect of making the coefficient more posi-tive, at least at lower temperatures. A fuel with a zero coefficientcould therefore have some practical significance. Secondly, the fuelhas its delayed neutron yield set to zero. Even though this yield inMOX fuel with WG plutonium would already be small, setting it tozero is found to have an effect. Thirdly, both of these effects are set
Fig. 1. Fluidized bed reactor schematic, showing an annular cavity between aninside graphite core and an outside reflector. The cavity contains a bed of fluidizedTRISO particles. One of the particles is shown magnified and cut away to display thekernel and outer layers. The radius of the central graphite core is 2.5 m. The outerradius of the fuel bed is 3.5 m. The outer radius of the reflector is 4.5 m. The bottomreflector is 2 m thick. The side reflector extends to 5 m above the floor of the bed.The total height of the reactor is 15 m.
to zero, to see whether a reactor would become completelyunstable.
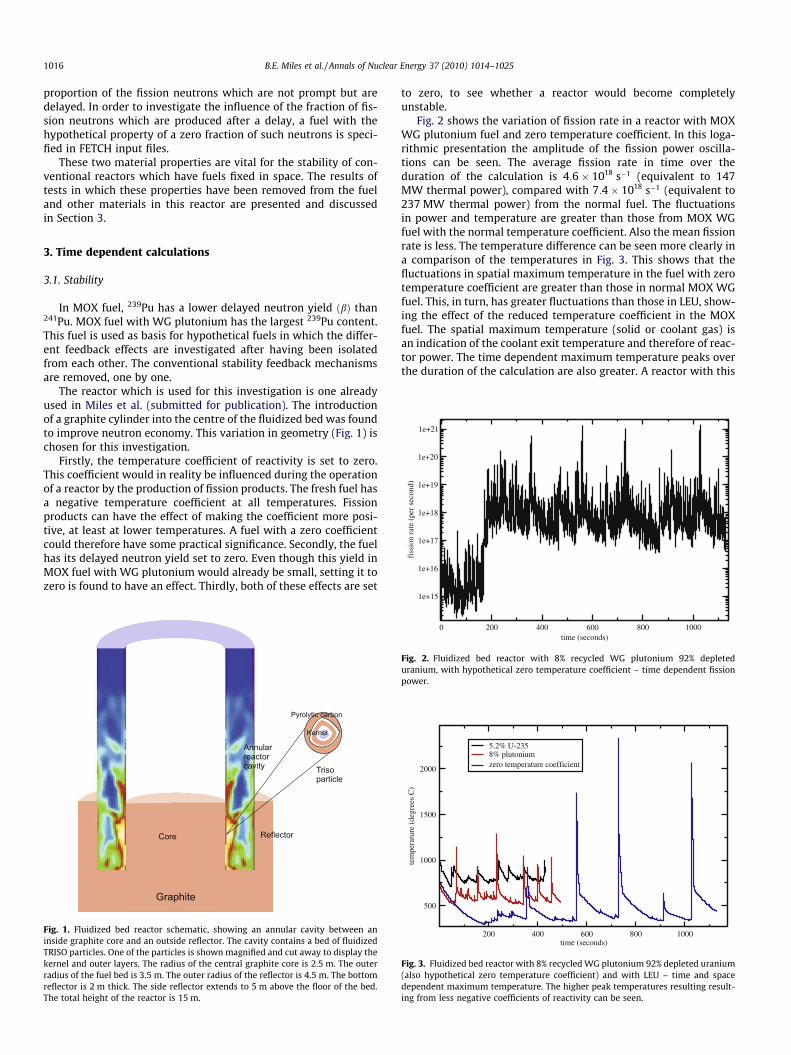
Fig. 2 shows the variation of fission rate in a reactor with MOXWG plutonium fuel and zero temperature coefficient. In this loga-rithmic presentation the amplitude of the fission power oscilla-tions can be seen. The average fission rate in time over theduration of the calculation is 4:6� 1018 s�1 (equivalent to 147MW thermal power), compared with 7:4� 1018 s�1 (equivalent to237 MW thermal power) from the normal fuel. The fluctuationsin power and temperature are greater than those from MOX WGfuel with the normal temperature coefficient. Also the mean fissionrate is less. The temperature difference can be seen more clearly ina comparison of the temperatures in Fig. 3. This shows that thefluctuations in spatial maximum temperature in the fuel with zerotemperature coefficient are greater than those in normal MOX WGfuel. This, in turn, has greater fluctuations than those in LEU, show-ing the effect of the reduced temperature coefficient in the MOXfuel. The spatial maximum temperature (solid or coolant gas) isan indication of the coolant exit temperature and therefore of reac-tor power. The time dependent maximum temperature peaks overthe duration of the calculation are also greater. A reactor with this
Fig. 2. Fluidized bed reactor with 8% recycled WG plutonium 92% depleteduranium, with hypothetical zero temperature coefficient – time dependent fissionpower.
Fig. 3. Fluidized bed reactor with 8% recycled WG plutonium 92% depleted uranium(also hypothetical zero temperature coefficient) and with LEU – time and spacedependent maximum temperature. The higher peak temperatures resulting result-ing from less negative coefficients of reactivity can be seen.

Fig. 6. Fluidized bed reactor with 8% recycled WG plutonium 92% depleteduranium, with hypothetical zero temperature coefficient – a peak temperature at559.2 s.
B.E. Miles et al. / Annals of Nuclear Energy 37 (2010) 1014–1025 1017
hypothetical fuel is less stable than one with the real MOX fueleven though the time averaged power is less. Stability could be im-proved by changes in reflector and core geometry, resulting how-ever in a further reduction in power. Such geometry changesincrease neutron leakage at the greatest bed expansions. Comparedwith Fig. 2, the linear presentation (Fig. 4) shows more clearly thepeaks in fission rate. Fig. 4 shows fission pulses, approximately atintervals of 200 s. The greatest pulse (1:58� 1021 fissions/s,50,000 MW) is at 1027.1 s. A more typical fission pulse, Fig. 5, oc-curs at 558.9 s. It is used as one of the examples to be analysedin detail when attempting to quantify the feedback mechanismwhen reactivity is reduced by dispersal of the fuel particles byheating and expansion of the intervening coolant gas (Fig. 6). Re-sults from a hypothetical fuel with zero yield of delayed neutronsare compared in Fig. 7. A typical fission pulse with this fuel, Fig. 8,occurring at 264.2 s is also used as one of the examples to beanalysed.
A less typical succession of peaks of the reactor fission rate,Fig. 9, resulting in the largest peak of temperature in this calcula-tion, Fig. 10, occurs at 729.6 s. The time delay between peak fissionpower and peak temperature is in all of these examples 0.3 s. Theconvective heat transfer model in FETCH is such that the time dif-
Fig. 4. Fluidized bed reactor with 8% recycled WG plutonium 92% depleteduranium, with hypothetical zero temperature coefficient – peak fission powertrend with time.
Fig. 5. Fluidized bed reactor with 8% recycled WG plutonium 92% depleteduranium, with hypothetical zero temperature coefficient – a typical peak fissionpower, at 558.9 s.
Fig. 7. Fluidized bed reactor with 8% recycled WG plutonium 92% depleteduranium, comparison with hypothetical zero delayed neutron yield.
Fig. 8. Fluidized bed reactor with 8% recycled WG plutonium 92% depleteduranium, with hypothetical zero delayed neutron yield – a typical peak fissionpower, at 264.2 s.

Fig. 11. Fluidized bed reactor with 8% recycled WG plutonium 92% depleteduranium, with hypothetical zero temperature coefficient. The delayed neutronprecursors with the shortest half life are an indication of fission reaction densityaround 730 s at four detection locations. These are at 0.6 m, 1 m, 1.4 m above thefuel cavity floor on the inner wall, at 1 m on the outer wall.
1018 B.E. Miles et al. / Annals of Nuclear Energy 37 (2010) 1014–1025
ference between a peak in solid phase temperature and the corre-sponding peak in gas phase temperature is less than 0.05 s. Heattransfer around a particle is discussed in Section 3.2, based on cal-culations which make use of the constitutive equations as used inFETCH.
The successive pulses can be seen in both the reactor fissionpower and in the local fission rate indicated by the concentrationof the short half life delayed neutron precursors at four locationson the reactor cavity walls (Fig. 11). These are at 0.6, 1 m and1.4 m above the reactor fuel cavity floor on the inner (core) walland at 1m on the outer (reflector) wall, locations where the localfission rate appears greatest.
The effect of the delayed fraction of fission neutrons on the sta-bility of the reactor is investigated by setting the delayed neutronfraction to zero in what otherwise is normal MOX fuel with WGplutonium. The reactivity temperature coefficient is normal for thisfuel. Fig. 7 compares the fission rates in normal MOX WG fuel andin the same fuel with zero delayed neutron yield. The greater fluc-tuations in initial fission rate and subsequent fission peaks fromthe hypothetical fuel are clear. The peak fission rates, even onthe logarithmic scale, appear greater. The average fission rate overthe duration of the calculation is approximately the same.
Fig. 10. Fluidized bed reactor with 8% recycled WG plutonium 92% depleteduranium, with hypothetical zero temperature coefficient – temperature peakdevelopment at 729.9 s.
Fig. 12. Fluidized bed reactor with 8% recycled WG plutonium 92% depleteduranium, comparison with hypothetical zero delayed neutron yield.Fig. 9. Fluidized bed reactor with 8% recycled WG plutonium 92% depleted
uranium, with hypothetical zero temperature coefficient – fission peak develop-ment showing smaller peaks building up to a maximum at 729.6 s.
Maximum temperatures are compared in Fig. 12. Peak temper-atures occur at intervals which have a mean period of about 40 s,becoming longer after 600 s. The peak temperatures exceed thosein the normal fuel. The greatest peak is lower than that which oc-curs when the temperature coefficient of reactivity is zeroalthough the instantaneous peak fission powers are approximatelyequal. The stability worsens up to 270 s, then improves.
Finally both temperature coefficient and delayed neutron yieldare set to zero. Again, when compared with the normal MOX WGfuel, the greater fluctuations in fission rate from the hypotheticalfuel are clear (Fig. 13). The average fission rate over the durationof the calculation remains approximately the same as that of thenormal fuel. However the greatest peak temperature is much high-er than that which occurs with either of the other hypotheticalfuels (Fig. 14). The stability worsens up to 520 s, then improves,with a period of 100 s.
In the cases shown in Figs. 12 and 14, where the temperatureinitially exceeds the target, when the stability has improved thetemperature appears eventually to stay below the target value.The development of temperature with time in the fuel with zerotemperature coefficient dose show increasing peaks in tempera-ture up to 729.9 s, possibly downwards thereafter. Calculation over

Fig. 13. Fluidized bed reactor with 8% recycled WG plutonium 92% depleteduranium, comparison with hypothetical zero delayed neutron yield and zerodelayed neutrons – time dependent fission power.
Fig. 14. Fluidized bed reactor with 8% recycled WG plutonium 92% depleteduranium, comparison with hypothetical zero delayed neutron yield and zerodelayed neutrons – time dependent temperature. The greater temperature peakscan be seen.
B.E. Miles et al. / Annals of Nuclear Energy 37 (2010) 1014–1025 1019
a longer time would show whether the downward trends in peakvalues would continue.
3.2. Heat transfer in and around a particle
The heat transfer inside a particle and from particle to gas dur-ing the typical peak of fission rate, such as shown in Figs. 5 and 8,can be analysed in a simplified model. At the same time the rate ofincrease of fission rate can be related to the response of the reactoras predicted by the ‘‘Inhour” equation. These are in fuels with zerotemperature coefficient of reactivity (Fig. 5) and zero delayed neu-tron yield (Fig. 8) respectively. The response time of the heat inputfrom fission in the approach to both peaks is about 0.1 s. The fissionrate response of the reactor is determined by the neutron lifetimedivided by the surplus reactivity. When the surplus reactivity isless than the delayed neutron yield the effective neutron lifetimeincludes this delay and becomes therefore long. The reactor re-sponse is then slow, a time constant of several seconds.
The prompt neutron lifetime is 1� 10�6 s in the fuel bed, basedon the macroscopic absorption cross section and neutron velocitiesin the two highest energy groups as calculated by WIMS for EVENTand FETCH. This compares with 1� 10�5 s in the reflector. Duders-
tadt and Hamilton (1976, Fig. 6-3) includes, for various neutronlifetimes, graphs of response time against surplus reactivity in fuelwhere 239Pu is the fissile isotope. A response time of 1� 10�1 s insuch a fuel would imply a surplus reactivity of one dollar. In ahypothetical fuel with zero delayed neutron yield, Eq. (3-28) in He-trick (1993) for a fast response with large reactivity, comes toresemble Eq. (6-47) in Duderstadt and Hamilton (1976), for asuperprompt-critical step positive reactivity insertion.
T ¼ lk� 1
ð1Þ
The surplus reactivity is k� 1. The period of the response T ofthe reactor is the solution to the ‘‘Inhour” equation when it ignoresdelayed neutrons. It would be, when b ¼ 0 and l ¼ 1� 10�6 s,1� 10�1 s for a positive step reactivity of 1� 10�5. The responsetime in these numerical analyses is not determined by the reactiv-ity of a uniformly arranged fuel. The spatial distribution of parti-cles, the fast neutron leakage, the resonance escape probabilityand the thermal utilization in the fuel bed are not uniform. The re-sponse time is determined by the movement of particles, possiblyadjacent to a bubble. This dispersal is discussed in Section 3.3.
An instantaneous reciprocal period of fission power is given inFig. 10a of Pain et al. (2003). This has a maximum of 35 s�1 at startup, thereafter about 10 s�1 or less.
A steady nominal reactor power is typically 375 MW. There are4:4� 1010 particles in a reactor. The steady fission heat q per par-ticle is 0.0085 W. The heat transfer from a particle to the gas phaseis defined in a constitutive relation, the convective heat transferequation in Table 3 of Pain et al. (2002). For an isolated TRISO par-ticle as defined in Miles et al. (submitted for publication), the coef-ficient is
hgs ¼ 5400 W m�2 K�1
and the non-dimensional groups
Re ¼ 188; Pr ¼ 0:64; Nu ¼ 25
The particle diameter ds is 1:03� 10�3 m. The temperature dif-ference Ts � Tg between the particle surface and gas in these steadyconditions is
Ts � Tg ¼ q= pd2s hgs
� �¼ 0:47 �C ð2Þ
A step change from zero to a fission heat rate, a factor n com-pared with the steady average power per TRISO kernel, would leadto rate of temperature rise
dx=dt ¼ axþ b
where x ¼ Tg � Ts, a ¼ 6hgs=ðCpsqsdsÞ and b ¼ 6nq= Cpsqspd3s
� �. Cps,
the particle heat capacity, is 1400 J kg�1 K�1 and qs, the particledensity, is 2060 kg m�3 (Miles et al., submitted for publication).
x ¼ bað1� e�atÞ ð3Þ
Ts � Tg ¼ 0:47nð1� e�t=ts Þ �C ð4Þ
where
ts ¼ 1=a ¼ ðCpsqsdsÞ=6hgs ¼ 0:092 s
The gas temperature Tg is assumed constant. Ts is the surfacetemperature of the particle. This will be same as the TRISO shelltemperature, since the difference between the temperature of theoutside surface of the kernel and Ts is small compared withTs � Tg . After a step change a steady value of Ts � Tg is re-estab-lished in a fraction of a second. The gas surrounding the particleis heated rapidly locally and expands.
The fission rate is assumed uniform within the kernel. The tem-perature difference between the centre of the kernel and its surface

1020 B.E. Miles et al. / Annals of Nuclear Energy 37 (2010) 1014–1025
in the steady heat flow 0.0085 W is 1.64 �C. The corresponding fis-sion rate of the reactor is 1:2� 1019 s�1. In a reactor with zero tem-perature coefficient a fission rate peak can reach a maximum of1� 1021 s�1 (Fig. 2). Since such a fission rate fluctuation wouldbe about 100 times the time average fission power, the centre ofthe kernel will be 164 �C hotter than its surface. In a real fuel thiswould not be favourable for the integrity of the particle. The tem-perature difference at the surface of the particle would then be47 �C.
3.3. Power oscillations
It can be seen, for example from an examination of the peaks inFig. 5 compared with Fig. 6 and in Fig. 15 compared with Fig. 16,that each peak in the hottest temperature occurs up to a secondafter a peak in fission power. In most cases the delay is much short-er. Particles are heated during the fission peak. The gas surround-ing a particle is rapidly heated as shown in the example inSection 3.1 and expands. In a simplified model of the momentumtransfer between expanding gas and a single particle the accelera-
Fig. 15. Fluidized bed reactor with 8% recycled WG plutonium 92% depleteduranium, with hypothetical zero delayed neutron yield and zero temperaturecoefficient – development of fission power over 36 s around a fission peak at516.3 s.
Fig. 16. Fluidized bed reactor with 8% recycled WG plutonium 92% depleteduranium, with hypothetical zero delayed neutron yield and zero temperaturecoefficient – maximum temperature development with time around a peaktemperature at 516.5 s.
tion and displacement of the particle can be estimated within thetime scale of the duration of a peak in fission power. This is an at-
Fig. 17. Fluidized bed reactor with 8% recycled WG plutonium 92% depleteduranium, with hypothetical zero delayed neutron yield and zero coefficient – fissionpeak over 1 s.
Fig. 18. Fluidized bed reactor with 8% WG MOX, with hypothetical zero temper-ature coefficient – period analysis of fission rate – Fast Fourier Transform from 215
measured time values (magnitude of the sums of coefficients).
Fig. 19. Fluidised bed reactor with 30% recycled LWR plutonium 70% depleteduranium – initial fission power peak ð1:1019 � 320 MWÞ.

Fig. 20. Fluidized bed reactor with 8% recycled WG plutonium 92% depleted uranium, with hypothetical zero temperature coefficient, in a fuel bed extending from 2.5 mradius to 3.5 m, height 13 m – solid fraction at 1 s and 2 s.
Fig. 21. Fluidized bed reactor with 8% recycled WG plutonium 92% depleted uranium, with hypothetical zero temperature coefficient, in a fuel bed extending from 2.5 mradius to 3.5 m, height 13 m – solid fraction and fission at 3 s.
B.E. Miles et al. / Annals of Nuclear Energy 37 (2010) 1014–1025 1021

1022 B.E. Miles et al. / Annals of Nuclear Energy 37 (2010) 1014–1025
tempt to quantify the possible stability feedback by dispersal of themass of particles undergoing a neutron chain reaction.
An example is shown in Fig. 6 where solid and gas phase tem-peratures rise from 1000 �C to 1600 �C in 0.2 s. In a real fuel itwould be doubtful whether a particle would survive this transient.Particles disperse as they accelerate rapidly, with a radial acceler-ation of about 2 m s�2 to a radial component of solid velocity ofabout 1 m s�1 after 0.5 s, when the gas radial velocity is 2 m s�1.The development of fission power shown in Fig. 5 is only about afactor of 7 in the same time interval, from 2� 1020 at 558.3 s to1:4� 1021 at 558.8 s.
The relative importance of the feedback mechanisms can bejudged from the behaviour of the reactor when the relevantfuel properties are hypothetically removed. Figs. 5 and 6 illustratethe effect of removal of a negative reactivity temperaturecoefficient.
When the temperature coefficient of reactivity is set to zero thehighest peak temperature in Fig. 3 is 2339 �C. When the delayedneutron yield is set to zero (Fig. 12) it is 1761 �C. The doubling timeof the fission rate in the approach to this peak is 0.07 s. It should benoted that a calculation with no delayed neutron yield never rep-resents a real fuel. It is a tool for investigation of stability.
When both these fuel properties are set to zero (Figs. 13 and 14)the highest peak temperature in this unreal fuel would be 6525 �C,a temperature much greater than would be tolerable in practice.Although the peak fission rate is reached in several stages(Fig. 15), the temperature rise is continuous and rapid (Fig. 16 un-like Fig. 10). The subsequent cooling of the fuel bed is determinedby its mass and specific heat. The doubling time of the heat inputfrom fission in the approach to the peak is 0.05 s (Fig. 17). This re-sponse is quicker than that when only the reactivity coefficient ismade zero. Perhaps more important is the more gradual build up
Fig. 22. Fluidized bed reactor with 8% recycled WG plutonium 92% depleted uranium,radius to 3.5 m, height 13 m – solid fraction and radial component of velocity at 4 s.
of fission power in the previous 7 s from 508 s to 515 s shown inFig. 15.
The power spectrum can be examined for evidence of possibleperiodicity of the fission peaks. A Fast Fourier Transform (FFT) of215 fission power measurements in the WG MOX reactor, withhypothetical zero reactivity temperature coefficient (Fig. 18)shows a range of larger Fourier coefficients around a period of 3–10 s and again 60–200 s but no period is dominant. This compareswith the fission peaks spaced at about 200 s in Fig. 4.
3.4. Initial conditions and first peak in fission power
The initial coolant flow is instantaneously the same value as atfull power. The bed starts already partly expanded, with uniformdistribution of the solid phase. The iteration process described inMiles et al. (submitted for publication), to determine the reactorgeometry for a time dependent calculation, can result in differentinitial conditions and different time dependent behaviours overthe following few seconds. With a typical MOX fuel (ex LWR Pu)there is an early fission rate peak, after 1.2 s. This is shown in detailin Fig. 19. The chosen temperature at time zero is 727 �C. The localtemperature, where a prompt critical response has occurred, risesto a peak of 1171 �C after 1.4 s.
The doubling time of the fission rate in the approach to the fis-sion peak in Fig. 19 indicates a characteristic reactor response timeof approximately 0.05 s. (That is an increase in the neutron popu-lation due to fission by a factor exp(1), see Stacey, 2004[23, Exam-ple 5.3].) Such a reactor period would imply a surplus promptreactivity, derived from Duderstadt and Hamilton (1976, Fig. 6-3)of one dollar. This can be compared with the much greater promptsurplus reactivity at 0 s, 0.0065, as determined in a static calcula-tion with the same material constants and geometry.
with hypothetical zero temperature coefficient, in a fuel bed extending from 2.5 m

B.E. Miles et al. / Annals of Nuclear Energy 37 (2010) 1014–1025 1023
In 239Pu, usually the dominant fissile isotope, the delayed neu-tron fraction is 0.0022 and in 241Pu it is 0.0054. The delayed neu-trons from MOX fuel are largely from 239Pu. When they are takenin account, the total positive step reactivity insertion is approxi-mately 0.009. The reduction in fission rate after 1.2 s shows thetime scale of the non-uniform redistribution of the particles inthe fluidized bed. In comparison the initial prompt surplus reactiv-ity with LEU fuel is much greater, +0.019 according to a static cal-culation. In spite of the greater surplus reactivity the first peakoccurs only after 48 s (Fig. 3). This must be explained by the greaternegative temperature coefficient of a fuel with fissile uraniumcompared with one containing fissile plutonium.
The behaviour of a reactor during the first few seconds can beexamined with the aid of frequent snapshots. The initial transientbehaviour has been examined in this way for a fuel which is hypo-thetical, with zero temperature reactivity coefficient. The choice ofinitial temperature has in this case no effect on reactivity. In fact anelevated temperature is chosen in order to save computer time. Acold bed would require minutes to be heated to operating temper-ature by the average fission heat. It is initially expanded to 2.9 m,compared with a packed height of 2.1 m. At this expansion the ei-gen value is 0.987. In a time dependent calculation a typical expan-sion after 300 s, up to 1200 s, is between 5 m and 9 m. In auniformly expanded bed the Eigen value increases with expansion.If these were really uniform expansions to 5 m or 9 m the eigenvalues would be approximately 1.05 or 1.09. The change in soliddistribution during the first 5 s is shown, once per second, in Figs.20, 21a, 22a and 23a.
The side reflector and the core extend to 5 m above the bottomof the cavity. Fission might be expected to take place up to the topof the reflector. In fact, as indicated by the delayed neutron precur-
Fig. 23. Fluidized bed reactor with 8% recycled WG plutonium 92% depleted uranium, wradius to 3.5 m, height 13 m – solid fraction and fission at 5 s.
sors (see Fig. 21b), it extends only to 3 m height, even when thebed has expanded beyond the height of the reflector. At 1 s the spa-tial distribution of the delayed neutron precursors in all delayedgroups resembles the fast flux distribution in a static calculation.Later, after 3 s (Fig. 21b) and after 5 s (Fig. 23b), it is limited bythe changed distribution of the solid phase. At 3 s there is still nodifference between the spatial distribution of the precursors inthe six delayed groups. At 5 s the short term precursors extendto 3 m (see Fig. 23b) but the long term precursors extend from2.5 m to 6 m (see Fig. 24), indicating how the particles undergoingfission in the first 3 s have travelled in the following 2 s. This spa-tial distribution of the long term precursors can be compared withthat of the solid in general, Fig. 23a. At most times these spatial dis-tributions would be identical, but not at start up. The particleswhich have recirculated down into the lowest part of the cavity(the solid phase from cavity floor to a height of 2.5 m) have onlystarted to undergo fission. The solid phase distribution after 1 sshows a flat slug which has developed in the lower part of the reac-tor. This slug breaks through the top of the bed at 4 s. Meanwhile asecond slug develops below it, which breaks up into bubbles beforeit reaches the top of the bed. The top of the bed reaches two-thirdsof the height of the reactor at 4 s and falls back to about one-thirdof the height at 5 s, when the slugs have all been replaced by bub-bles. The fuel cavity is 14 m tall. At all times the exit gas containsno more than the contour value of 0.0032 solids. A detector at gasexit records a value briefly up to 2 � 10�4 at the inner wall duringthe first fission peak and less than 2 � 10�9, in the centre or at theouter wall, during peaks thereafter.
A long term calculation with the same fuel shows that the firstfission peak is not until 356 s. Contour plots are available at 20 sintervals. A plot of solid fraction at 340 s shows a bed which is ex-
ith hypothetical zero temperature coefficient, in a fuel bed extending from 2.5 m

1024 B.E. Miles et al. / Annals of Nuclear Energy 37 (2010) 1014–1025
panded up to 5 m, with small bubbles. At 360 s the solid fractionagain reaches 5 m but with large bubbles. This is some evidence
Fig. 24. Fluidized bed reactor with 8% recycled WG plutonium 92% depleteduranium, with hypothetical zero temperature coefficient, in a fuel bed extendingfrom 2.5 m radius to 3.5 m, height 13 m. Concentration of delayed neutronprecursors, longest time group, at 5 s extends from 2.5 m to 6 m.
Fig. 25. Fluidized bed reactor with 8% recycled WG plutonium 92% depleted uranium,radius to 3.5 m, height 13 m – axial components of velocities at 4 s.
to support the hypothesis that smaller bubble size results in great-er reactivity and that a subsequent generation of heat by greaternuclear fission reaction produces larger bubbles or slugs in the flu-idized bed, reducing reactivity.
Recirculation of solids is shown by Fig. 25a, the axial componentof solid phase velocity. A greatest downward velocity can be seenagainst both walls from about 5 m down. This can even be seenin the axial component of the gas phase velocity (Fig. 25b), wheregas against the same walls is dragged downwards by falling solidphase. Solids in the uppermost 6 m of cavity have at this instantin time a smaller downwards velocity, zero at the upper boundaryof the cavity. The greatest upwards velocity of both phases is atmid height of the cavity, away from the walls. The radial compo-nent of solid phase velocity (Fig. 22b) indicates eddies at locationswhere the gradients of the axial component are greatest.
4. Summary and conclusions
Stability of a nuclear reactor with respect to short term fluctu-ations of power level depends on reactivity variation with temper-ature. Stability feedback associated with a change in fueltemperature in a reactor takes place essentially instantaneously.A significant part of prompt feedback usually comes from thechange in resonance escape probability due to Doppler broadeningof resonances. The moderator may also contribute a reactivity tem-perature coefficient by changes in its scattering and thermalisationof neutrons. The change in reactivity with temperature may not bein the desired direction, especially with plutonium fuel. Dependingon fuel composition, for example as it changes with burn up, andon the proportion of fuel and moderator in a pebble, it is possiblefor a positive coefficient to occur. An additional means of removing
with hypothetical zero temperature coefficient, in a fuel bed extending from 2.5 m

B.E. Miles et al. / Annals of Nuclear Energy 37 (2010) 1014–1025 1025
excess reactivity would offer the possibility of using fissile materialwith a positive temperature coefficient.
The fluidized bed reactor may have this additional means of sta-bility feedback. It is important to understand in some detail thefeedback mechanisms in this reactor. They are investigated indi-vidually in time dependent calculations using hypothetical fuelswith
� no temperature coefficient of reactivity (no Dopplerbroadening),� no delayed neutrons,� neither temperature coefficient nor delayed neutrons.
The real fuel which is used as a basis for these investigations isMOX with 8% WG plutonium. Compared with other MOX fuels thishas the smallest delayed neutron fraction, since 239Pu has a smallerdelayed neutron fraction than 241Pu.
Major fission rate peaks are accompanied by peaks of tempera-ture. A reduction to zero of the fraction of neutrons which isdelayed increases peak temperatures. The period between temper-ature peaks remains unchanged compared with that of the realfuel, between 30 s and 60 s. The amplitudes of the fluctuations be-tween minimum and maximum temperature increase.
A negative coefficient of reactivity with temperature aids shortterm stability. Without it the fluctuations in fission rate and tem-perature are greater. The period between temperature peaks in-creases greatly, to between 120 s and 200 s. They remain stillstable. Maximum temperature increases while mean fission powerdecreases.
When both of these mechanisms are set to zero the maximumtemperature becomes much greater than would be tolerable inpractice. However the calculations show that the reactor doesnot become unstable. This large, rapid increase in temperature iscaused by an increase of fission rate in stages over a period of about10 s. The fluctuations in temperature become greater. The timeintervals between peak values are between 80 s and 180 s.
One stability feedback mechanism is sufficient. On the otherhand each additional mechanism increases stability and thereforethe available fission power within the limits of the reactor con-struction materials and its fuel.
When the temperature reactivity coefficient is not zero, it is theobvious link between bed thermal inertia, long term temperatureperiod and reactivity. Otherwise the link is probably the effect oftemperature on bubble size and therefore on the chance of favour-able geometry occurring in the fuel bed (thermal utilization, reso-nance escape probability and neutron escape). The short termperiod of temperature fluctuation is caused by bubble movementin a region where fission is taking place, especially when the bub-ble size is large.
The behaviour of the fluidized bed reactor just after start up hasbeen investigated in some detail. During the first few seconds afterthe start of gas flow the type of fluidization changes. Initially a flat
slug begins to move up from the bottom of the fuel bed. Theslug becomes axial and recirculation of solids begins at 4 s. Inplutonium fuels the initial peak is very sensitive to the initialreactivity.
Further investigation of the behaviour of the reactor just before,during and after a major peak in fission rate should provide moreinsight into stability feedback.
References
Alander, A. et al., 2006. From once-through nuclear fuel cycle to accelerator-driventransmutation. Nuclear Physics A 562, 630–633.
Cuevas Vivas, G.F. et al., 2002. Optimisation of MOX enrichment distributions intypical LWR assemblies using a simplex method-based algorithm. Annals ofNuclear Energy 29, 2001–2017.
Duderstadt, J.J., Hamilton, L.J., 1976. Nuclear Reactor Analysis. John Wiley and Sons,New York.
Fetterman, R., 2009. AP1000 core design with 50% MOX loading. Annals of NuclearEnergy 36, 324–330.
Franceschini, F., Petrovic, B., 2008. Core physics analysis of 100% MOX core in IRIS.Annals of Nuclear Energy 35, 1587–1597.
Francois, J.L. et al., 2002. Design of an overmoderated fuel and a full MOX core forplutonium consumption in boiling water reactors. Annals of Nuclear Energy 29,1953–1965.
Frois, B., 2008. Nuclear energy in a global context. Nuclear Physics A 805, 320c–327c.
Galperin, A., 1995. Utilization of light water reactors for plutonium incineration.Annals of Nuclear Energy 22, 507–511.
Glasstone, S., 1967. Sourcebook on Atomic Energy. Van Nostrand Reinhold, NewYork.
Hetrick, D.L., 1993. Dynamics of Nuclear Reactors. American Nuclear Society, LaGrange Park, Illinois.
Hoggett-Jones, C. et al., 2002. Modelling the inventory and impact assessment ofpartitioning and transmutation approaches to spent nuclear fuel management.Annals of Nuclear Energy 39, 491–508.
Jo, C.K. et al., 2000. Graphite-filled mixed-oxide fuel design for fully loaded PWRcores. Annals of Nuclear Energy 27, 819–829.
Kuijper, J.C. et al., 2006. HTGR reactor physics and fuel cycle studies. NuclearEngineering and Design 236, 615–634.
Lombardi, C., Mazzola, A., 1996. Exploiting the plutonium stockpiles in PWR’s byusing inert matrix fuel. Annals of Nuclear Energy 23, 1117–1126.
Masson, M. et al., 2006. Block-type HTGR spent fuel processing: CEA investigationprogram and initial results. Nuclear Engineering and Design 236, 516–525.
Miles, B.E. et al., 2010. Simulation of a gas-cooled fluidized bed nuclear reactor. Part1: Mixed oxide fuels. Annals of Nuclear Energy 37, 999–1013.
NEA/OECD, 2006. French R and D on the Partitioning and Transmutation of Long-lived Radionuclides. An International Peer Review of the 2005 CEA Report,Number 6210.
Pain, C.C. et al., 2002. Space-dependent kinetics simulation of a gas-cooled fluidizedbed nuclear reactor. Nuclear Engineering and Design 219, 225–245.
Pain, C.C. et al., 2003. An investigation of power stabilisation and space-dependentdynamics of a nuclear fluidized-bed reactor. Nuclear Science and Engineering144, 242–257.
Paratte, J.M., Chawla, R., 1995. On the physics feasibility of LWR plutonium fuelswithout uranium. Annals of Nuclear Energy 22, 471–481.
Rots, P.E.A., van der Hagen, T.H.J.J., 1996. Fluidized bed nuclear fission reactor.Chemical Engineering Science 51 (11), 2763–2768.
Salvatores, M., 2006. Fuel cycle strategies for the sustainable development ofnuclear energy: the role of accelerator driven systems. Nuclear Physics A 562,578–584.
Stacey, Weston M., 2004. Nuclear Reactor Physics. Wiley-VCH Verlag, Weinheim,Germany.
Thilagam, L. et al., 2009. A VVER-1000 LEU and MOX assembly computationalbenchmark analysis using the lattice burnup code EXCEL. Annals of NuclearEnergy 36, 505–519.