anl-mgr-md-000001, rev 01/icn 00, 'input …recommended parameter values ..... 38 november 2000...
TRANSCRIPT

OFFICE OF CIVILIAN RADIOACTIVE WASTE MANAGEMENT ANALYSIS/MODEL COVER SHEET
Complete Only Applicable Items
fJ Analysis Check all that apply
Type of El Engineering Analysis Z Performance Assessment
El Scientific
Intended Use [
of Analysis
F1
Input to Calculation
Input to another Analysis or Model
Input to Technical Document
Describe use:
Parameter values defined in this report will be used to
calculate biosphere dose conversion factors
3. [-] Model Check all that apply
1. QA: QA
Page: 1 of. 54
Type of [1 Conceptual Model EL Abstraction Model
Model E Mathematical Model [j System Model
El Process Model
Intended Use Model
of
LI
Input to Calculation
Input to another Model or Analysis
Input to Technical Document
Describe use:
4. Title:
Input Parameter Values for External and Inhalation Radiation Exposure Analysis
5- Document Identifier (including Rev. No. and Change No., if applicable):
ANL-MGR-MD-000001, REV 01/ ICN 00
6. Total Attachments: 7. Attachm
0
8. Originator
9. Checker
10. Lead/Supervisor
11. Responsible Manager
ent Numbers - No. of Pages in Each:
N/A
Printe.d Name SignaturePrne Name, ~
Kurt R. Rautenstrauch
Kaylie E. Rasmuson
Kurt R. RautenstrauchI +
Ronald A. Green
12. Remarks:
INFOMATION COPY
I IVEAS DOCUMENT CONTROL
Enclosure 2
V
7�, �z�zc 1 �
Date
�ŽX�1U4x\
-I7/0OC/1/7/0
1/ 7/00
rA

OFFICE OF CIVILIAN RADIOACTIVE WASTE MANAGEMENT ANALYSIS/MODEL REVISION RECORD
Complete Only Applicable Items 1- Page: 2 of. 54
2. Analysis or Model Title:
Input Parameter Values for External and Inhalation Radiation Exposure Analysis
3. Document Identifier (including Rev. No. and Change No., if applicable):
ANL-MGR-MD-000001, REV 01 / ICN 00
4. Revision/Change No. 5. Description of Revision/Change
REV 0, ICN 1
REV 1, ICN 0
Changed verification status of climate data (Table 1 and DIRS) and added justification for use of Q-VL2 data (p. 7); added data tracking numbers for data accepted since release of REV 00 (Table 1; pp. 9, 10, 17, 19, 21; DIRS); used modified crop coefficients for turf grass, which resulted in diffferent values for irrigation rate (Tables 1, 3, 4 and pp. 10, 19); modified justification for selecting climate and air quality data from site 9 (pp. 7, 8, 9); added statement that ingested dust is considered in ingestion pathway (p.
7); replaced reference to unfinished AMR with reference to Census Bureau data (pp. 6, 9, 10, 11, 12,
16); modified assumption 2 in Section 5.5 to address DIR associated with CAR LVMO-99-C-001 (p. 13); added required statement about tracking input status (p. 22); used electronic DIRS; and modified references to match electronic DIRS (pp. 22-25).
Added parameter values for analysis of volcanic eruption and climate change (throughout). Revised inputs and parameter values for mass loading to reflect a farming community and to base values on total
suspended particles (Sections 4.1.1, 5.1.1, and 6.1.1). Added key technical issues and acceptance criteria (Section 4.2). Revised assumptions for time spent outdoors (Section 5.2.3) and parameter values for inhalation exposure time (Section 6.2) and external exposure time (Section 6.4). Corrected
average annual precipitation value used in calculation of home irrigation rate (Section 6.5 and Appendix B). Updated format throughout.
I- I

CONTENTS Page
1. PURPO SE .................................................................................................................................. 7
2. QUALITY A SSURAN CE ................................................................................................... 9
3. COMPUTER SOFTWARE AND MODEL USAGE .......................................................... 9
4. INPUTS .................................................................................................................................... 10 4.1 DATA .............................................................................................................................. 10
4.1.1 M ass Loading ................................................................................................ 10
4.1.2 Inhalation Exposure Tim e ............................................................................ 12
4.1.3 Chronic Breathing Rate ................................................................................ 12
4.1.4 Soil Exposure Tim e ....................................................................................... 12
4.1.5 Hom e Irrigation Rate ................................................................................... 12
4.1.6 Duration of Hom e Irrigation ....................................................................... 14
4.2 CRITERIA ....................................................................................................................... 14
4.3 CODES AN D STAN DARD S .................................................................................... 15
5. ASSUM PTION S ...................................................................................................................... 15
5.1 M A SS LOADIN G ....................................................................................................... 15
5.1.1 Maximum Exposure to PM10 Following a Volcanic Eruption ...................... 16
5.1.2 M ass Loading Decay Function ...................................................................... 17
5.1.3 M ass Loading Decay Rate ........................................................................... 18
5.1.4 Ratio of TSP to PM jo A fter a Volcanic Eruption ........................................ 20
5.2 IN HALATION EXPO SURE TIM E ................................................................................ 20
5.2.1 Shielding Factor ........................................................................................... 20
5.2.2 Tim e Spent Recreating Outdoors ................................................................ 20
5.2.3 Tim e Spent at W ork ..................................................................................... 21
5.3 CHRON IC BREATHIN G RATE ............................................................................... 22
5.4 SOIL EXPO SURE TIM E .......................................................................................... 22
5.5 HOM E IRRIGATION RATE ..................................................................................... 22
5.5.1 Deep Percolation ......................................................................................... 22
5.5.2 Multiplication Factor for Bounding Irrigation Rate ..................................... 23
5.6 DURATION OF HOM E IRRIGATION ................................................................... 23
6. ANALY SIS .............................................................................................................................. 23
6.1 M A SS LOADIN G ..................................................................................................... 23
6.1.1 N om inal Perform ance .................................................................................. 24
6.1.2 Volcanic Eruption ....................................................................................... 28
6.2 IN HALATION EXPOSURE TIM E .......................................................................... 29
6.2.1 Am argosa Valley Residents .......................................................................... 30
6.2.2 Farm ers and Other Outdoor W orkers .......................................................... 31
6.3 CHRONIC BREATHIN G RATE ............................................................................... 31
6.4 SO IL EXPOSU RE TIM E .......................................................................................... 32
6.4.1 Am argosa V alley Residents .......................................................................... 33
ANL-MGR-MD-000001 REV 01 / ICN 00 3 November 2000

6.4.2 Farm ers and Other Outdoor W orkers .......................................................... 33 6.5 H OM E IRRIGATION RATE ..................................................................................... 33 6.6 DURA TION OF H OM E IRRIGA TION ................................................................... 37
7. CON CLU SION S ...................................................................................................................... 37
8. REFEREN CES ........................................................................................................................ 39 8.1 D OCUM EN TS CITED ............................................................................................. 39
8.2 CODES, STANDARDS, AND REGULATIONS ..................................................... 44 8.3 PROCED URE S ............................................................................................................... 44 8.4 SOURCE DA TA ....................................................................................................... 44 8.5 DEV ELO PED D ATA ................................................................................................ 46
A PPEN DIX A ................................................................................................................................ 47
A PPEN DIX B ............................................................................................................................... 51
ANL-MGR-MD-00000I REV 01 / ICN 00 November 20004

FIGURES
Page
1. Concentrations ([g/m3) of TSP at three sites in Washington before and after the eruption of
Mount St. Helens in May 1980 ......................................................................................... 19
TABLES
1. Features, events, and processes (FEPs) addressed in this analysis .................................... 8
2. Summary of data inputs used in this analysis .................................................................. 11
3. Air quality monitoring sites in agricultural, rural settings ................................................ 25
4. Annual average PMj0 concentrations at arid agricultural sites ......................................... 26
5. Time (hours/year) spent in contaminated and uncontaminated areas based on three
em ploym ent scenarios ....................................................................................................... 30
6. Average monthly temperature and solar radiation at YMP Site 9, monthly reference
evapotranspiration (ETr), and monthly crop coefficients and evapotranspiration for
berm udagrass and tall fescue ........................................................................................... 35
7. Recommended parameter values ....................................................................................... 38
November 2000ANL-MGR-MD-00000I REV 01 / ICN 00 5

ACRONYMS
AMR
CFR
CRWMS M&O
DOE
DTN
EPA
ET
FEPs
FR
IAEA
ICRP
NRC
OCRWM
PMI0
QARD
TSP
USCB
USGS
Analysis and model report
Code of Federal Regulations
Civilian Radioactive Waste Management System Management and Operating Contractor
U.S. Department of Energy
Data tracking number
U.S. Environmental Protection Agency
Evapotranspiration
Features, events, and processes
Federal Register
International Atomic Energy Agency
International Commission on Radiological Protection
U.S. Nuclear Regulatory Commission
Office of Civilian Radioactive Waste Management
Inhalable particulate matter <10 ptm
Quality Assurance Requirements and Description
Total suspended particles
U.S. Census Bureau
U.S. Geological Survey
ANL-MGR-MD-00000I REV 01 / ICN 00 November 20006

1. PURPOSE
The purpose of this analysis and model report (AMR) is to select and justify values for six input
parameters required by the computer code GENII-S (Leigh et al. 1993) to calculate radionuclide
specific biosphere dose conversion factors. These dose conversion factors will be used to
calculate potential radiation doses to a hypothetical human receptor group as part of the post
closure Total System Performance Assessment. Although the parameter values defined in this
analysis are intended for use in the biosphere model and associated GENII-S software, that
model and software were not used directly in the development of this analysis.
The parameter values developed in this analysis are intended for use in an evaluation of the
nominal performance of a repository and for an evaluation of the consequences of a volcanic
eruption at Yucca Mountain. When necessary, separate parameter values were developed for
each evaluation. In addition, separate values were developed for those parameters that would be
affected by an increase in precipitation and decrease in temperature caused by long-term change
to a glacial-transition climate (hereafter called climate change analysis), as described in U.S.
Geological Survey (USGS 2000, Section 6.6.2).
The six parameters evaluated in this analysis are for two of the three exposure pathways to
humans being considered to calculate biosphere dose conversion factors: inhalation and external
exposure. The inhalation pathway evaluates inhalation of respirable, resuspended dust from
contaminated soils. The external exposure pathway evaluates potential radiation exposure from
living and working in an environment contaminated with radionuclides. External exposure is
often referred to as groundshine. The six parameters evaluated are:
1. Mass Loading (g/m3 ) - Mass loading is the mass of suspended particles per volume of air.
This parameter is used to calculate the concentration of radionuclides in the air resulting from
resuspension of contaminated soil or ash.
2. Inhalation Exposure Time (hours/year) - Inhalation exposure time is the amount of time
a person inhales contaminated, resuspended dust or ash.
3. Chronic Breathing Rate (m3/day) - Chronic breathing rate is the volume of air inhaled by
a person per unit of time. This parameter is used to calculate the volume of resuspended
particles that are inhaled.
4. Soil Exposure Time (hours/year) - Soil exposure time is the amount of time a person
spends outside on contaminated soil.
5. Home Irrigation Rate (inches/year) - Home irrigation rate is the amount of contaminated
groundwater applied to the home environment. This parameter is used to determine the level
of contamination of the soil.
6. Duration of Home Irrigation (months/year) - Duration of home irrigation is the number
of months during a year that groundwater is applied to the home environment.
November 2000ANL-MGR-MD-000001 REV 01 / ICN 00 7

This analysis addresses eight of the primary features, events, and processes (FEPs) that might affect the performance of a geologic repository at Yucca Mountain (Table 1). See Civilian Radioactive Waste Management System Management and Operating Contractor (CRWMS M&O, 2000e) for information on the entire list of FEPs being considered during performance analysis.
Three estimates of each parameter for each applicable analysis (i.e., nominal performance, volcanic eruption, climate change) were developed. First, a distribution for each parameter was selected based on characteristics of the parameter and available data, and then reasonable, conservative estimates of the values required to define the distribution were selected that account for the uncertainties and variabilities in the parameter. Data distributions were selected from those that can be handled by the GENII-S computer code: fixed, normal, lognormal, triangular, uniform, loguniform, and empirical (Leigh et al. 1993, p. 5-33). Reasonable is defined as being reasonably expected to occur, based on present knowledge of the reference biosphere and current behaviors and characteristics of the critical group, as described in U.S. Department of Energy (DOE) guidance (Dyer 1999) on 10 Code of Federal Regulations (CFR) 63 regulations proposed by the U.S. Nuclear Regulatory Commission (NRC; 64 Federal Register [FR] 8640-8679). Conservative is defined as a value or behavior that would result in a higher biosphere dose conversion factor. For example, applying 90 inches of water per year to a lawn is more conservative than applying less water because it would result in a greater concentration of radionuclides being deposited in the home environment. The second estimate for each parameter is a single, reasonably expected value to be used in a deterministic run of the GENII-S code, and was based on the type of distribution. The third estimate, to be used in an additional
Table 1. Features, events, and processes (FEPs) addressed in this analysis. I
ANL-MGR-MD-000001 REV 01 / ICN 00
FEPs Number FEPs Name Parameter name
1.3.01.00.00 Climate Change Home Irrigation Rate Duration Of Home Irrigation
2.3.11.01.00 Precipitation Home Irrigation Rate
2.3.13.01.00 Biosphere Characteristics Mass Loading
2.3.13.02.00 Biosphere Transport Mass Loading Breathing Rate
2.4.04.01.00 Human Lifestyle Inhalation Exposure Time Soil Exposure Time
2.4.01.00.00 Human Characteristics Breathing Rate
2.4.07.00.00 Dwellings Inhalation Exposure Time Home Irrigation Rate Duration Of Home Irrigation Mass Loading
3.3.04.02.00 Inhalation Mass Loading Breathing Rate Inhalation Exposure Time
3.3.04.03.00 External Exposure Home Irrigation Rate Duration Of Home Irrigation Soil Exposure Time
November 20008

deterministic run of the GENII-S code, is a single, high (i.e., conservative) bounding value that could occur based on extreme behaviors or conditions.
This analysis was conducted according to AP-3.1OQ (Revision 2/ICN 3), Analyses and Models, and an approved development plan (CRWMS M&O 2000a). This report deviates from that plan in two ways. First, the plan did not mention development of parameter values to evaluate climate change because the need to conduct that evaluation was identified after the plan was completed. Second, the plan was for an interim change of this report; however, after making the required changes, it was decided that the number of changes were sufficient to require a revision. The only constraints, caveats, or limitations common to the entire analysis are those described above for reasonable/conservative and bounding values.
2. QUALITY ASSURANCE
The analyses in this AMR have been determined to be Quality Affecting in accordance with CRWMS M&O procedure AP-2.16Q, Activity Evaluations, because the information will be used to support Performance Assessment and other quality-affecting activities. Therefore, this AMR is subject to the requirements of the Quality Assurance Requirements and Description (QARD) document (DOE 2000). This AMR is covered by the Activity Evaluation for Environmental Sciences Biosphere/SR Support (CRWMS M&O 2000d).
Personnel performing work on this analysis were trained and qualified according to Office of Civilian Radioactive Waste Management (OCRWM) procedures AP-2. IQ, Indoctrination and Training of Personnel, and AP-2.2Q, Establishment and Verification of Required Education and Experience of Personnel. Preparation of this analysis did not require the classification of items in accordance with CRWMS M&O procedure QAP-2-3, Classification of Permanent Items. This analysis is not a field activity. Therefore, a Determination of Importance Evaluation in accordance with CRWMS M&O procedure NLP-2-0 was not required. The governing procedure for preparation of this AMR is OCRWM procedure AP-3.0 OQ, Analyses and Models.
Data used in this analysis was controlled in accordance with the methods specified in the development plan (CRWMS M&O 2000a, p. 5). All data used as inputs were stored in the Technical Data Management System or Technical Information Center to ensure long-term protection and retrievability. Data were obtained using the transfer protocols specified in APSIII.3Q, Submittal and Incorporation of Data to the Technical Data Management System. These data were stored temporarily on network drives with restricted access. New data obtained during this activity, and resulting output data, were submitted per AP-SIII.3Q.
3. COMPUTER SOFTWARE AND MODEL USAGE
No models, developed software, or software routines were used or developed in this analysis. Standard functions in Microsoft Excel 97 SR-2 were used to calculate summary statistics; no routines or macros were used. Although the parameter values defined in this analysis are intended for use in the GENII-S biosphere model and associated software, that model and software were not used directly in the development of this analysis.
ANL-MGR-MD-000001 REV 01 / ICN 00 November 20009

4. INPUTS
The inputs for each parameter are described and justified below and summarized in Table 2. Because biosphere transport and uptake are not considered principal factors (AP-3.15Q, Managing Technical Product Inputs, Attachment 6), data collected prior to June 30, 1999, under a YMP program that met the requirements of the QARD (DOE 2000) have been classified Qualified-Verification Level 2. See the Document Input Reference System for the status of all inputs and references.
All references cited in this document and listed in Section 8, other than those identified as inputs in this section, were included only to support or corroborate the assumptions, methods, and conclusion of the analyses and were not inputs required to produce the parameter values.
4.1 DATA
4.1.1 Mass Loading
1. Resuspended Particles - Yucca Mountain (See Table 2 for list of 14 data tracking numbers [DTN]). Twenty-four measurements of airborne particulate matter •<10 ptm (PM 10, jIg/m 3) and total suspended particles (TSP) at Yucca Mountain were used to calculate a ratio of TSP to PM10 to be expected for a farming community in Amargosa Valley. These are the best available data because they were collected in northern Amargosa Valley and at Yucca Mountain in areas with soils typical of those in Amargosa Valley (CRWMS M&O 1999b, Figure 1 on pp. 2 and 3) and therefore are consistent with the current conditions of the Yucca Mountain region (per Section 63.115 of proposed 10 CFR 63, Dyer 1999, pp. 19 and 20). These measurements are comparable with data collected elsewhere in the United States because they were taken in accordance with U.S. Environmental Protection Agency (EPA) requirements for methodology and quality control.
2. Inhalable Suspended Particles - United States (DTN: MO0007SPAAPMOO.012). Annual average concentrations of PM10 for sites throughout the United States during 1994-1999 were used to determine mass loading of a farming community. The data were obtained from the EPA Office of Air Quality Planning and Standards AIRSData database (EPA 2000). This database contains measurements on pollution concentrations collected by federal, state, and local government agencies to track compliance with emission standards. These data were collected and reported in accordance with EPA requirements for methodology and quality control and therefore were collected using consistent methods that meet federal quality control standards. See Section 6.1 for additional information on the appropriateness of these data for their intended use.
ANL-MGR-MD-00000I REV 01 / ICN 00 November 200010

Table 2. Summary of data inputs used in this analysis. See Sections 4.1.1 through 4.1.6 for justification of
the use of these inputs.
Analysis Parameter Name (and
Parameter Input Number)
Data
Mass Loading PMlo and TSP
Mass Loading PM 10
Mass Loading TSP
Mass Loading and Home Irrigation Rate
Inhalation and Soil Exposure Times
Chronic Breathing Rate
Home Irrigation Rate
Home Irrigation Rate
Home Irrigation Rate
Home Irrigation Rate
Home Irrigation Duration
Weather data
Behavioral characteristics
Breathing Rate
Average monthly temperature
Average monthly solar radiation
Average monthly precipitation
Crop coefficient (K.):
Duration of Irrigation
Particle Characteristics (1078)
Particle Characteristics (1078)
Particle Characteristics (1078)
Data Tracking Numbers or Citation
MO98PSDALOG111.000 TM000000000001.039 TM000000000001 .041 TMOOOOOOO00001.042 TMOOOOOOO00001.043 TMOOOOOOO00001.079 TM000000000001.082 TMOOOOOOO00001.084 TMOOOOOOO00001.096 TM0000000000011.097 TM0000000000011.098 TMOOOOOOO00001 .099 TMOOOOOOOOOOO1 .105
TMOOOOOOO00001.108
MO0007SPAAPMOO.012
QualificationQualification Status
Qualified
Accepted
MO0008SPATSPOO.013 Accepted
Precipitation Rate (557) GS000100001 221.001 Accepted
Temperature (595)
Census Data (6923) M0991 1ANLMGRMD.003 Accepted
Chronic Breathing Rate (P6824'
M0001SPACBRO1.004 Accepted
Temperatur 1:95) MO9903CLIMATOL.001 Q-VL2a
Solar Flux (594) MO9903CLIMATOL.001 Q-VL2a
Precipitation Quantity (553)
Crop Coefficient (6952)
Duration of Home Irrigation (6827)
MO9903CLIMATOL.001 I Q-VL2a
MO0001 SPABCCO1.002 Accepted
MOOOSPATFCO0.003
M09911ANLMGRMD.000
M09911ANLMGRMD.001
Accepted
Notes: aQualified - Verification Level 2
3. Total Suspended Particles -Washington (DTN: MO0008SPATSPOO.013). Twenty-four
hour concentrations of TSP during 1979-1982 from air quality monitoring sites in
Washington with high ash fall from the eruption of Mount St. Helens were used to develop
an assumption of the amount of time it would take for mass loading to return to background
November 2000ANL-MGR-MD-000001 REV 01 / ICN 00 I1I
I
Qualified
Accepted

levels following a volcanic eruption. These data were obtained from the EPA AIRSData database and therefore were collected using consistent methods that meet federal quality control standards. See Section 6.1 for caveats about the interpretation of these data for their intended use.
4. Temperature and Precipitation - United States (DTN: GS000100001221.001). Western U.S. weather data were used to aid in selecting analog air quality monitoring sites representative of arid farming communities Lnd to compare Yucca Mountain to sites near Mount St. Helens. These data were reported by the National Oceanic and Atmospheric Administration, National Climatic Data Center, and were collected using the standardized methods and equipment required by that agency. They are therefore valid for comparison among sites in the United States.
4.1.2 Inhalation Exposure Time
Information from the 1990 census (U.S. Census Bureau [USCB] 1999; DTN: M0991 1ANLMGRMD.003) on employment, occupational, and other behavioral characteristics of people living in Amargosa Valley were used to develop an assumption about the amount of time the receptor population would spend indoors and outdoors in contaminated areas. These are the best available and most site-specific data because this the is most complete and recent data set available on the employment and occupational characteristics of the Amargosa Valley population. The behaviors and characteristics summarized in this data set therefore are consistent with the current conditions in the region surrounding the Yucca Mountain site (per Section 63.115(b)(2) of proposed 10 CFR 63, Dyer 1999, p. 19).
4.1.3 Chronic Breathing Rate
The recommended chronic breathing rates were derived from data developed by the International Commission on Radiological Protection (ICRP) (1975, pp. 346 and 347; DTN: MO0001SPACBRO1.004). As described in Section 6.3, these values are consistent with present knowledge of adults (per Section 63.115(b)(5) of proposed 10 CFR 63, Dyer 1999, p. 20).
4.1.4 Soil Exposure Time
Same as Inhalation Exposure Time.
4.1.5 Home Irrigation Rate
1. Average Monthly Temperature (*F) (DTN: MO9903CLIMATOL.001). Averages were calculated from five years (1993-1997) of data collected at YMP meteorological monitoring Site 9. This site is at an elevation of 838 m (2,750 feet) (CRWMS M&O 1999a, Table 1-1 on p. 6), near the southwestern comer of the Nevada Test Site and 3.1 km north of the proposed location of the critical group at the intersection of U.S. Highway 95 and Nevada Route 373 (per Section 63.115(b)(1) of proposed 10 CFR 63, Dyer 1999, p. 19).
These data were selected because they were collected at the southernmost Yucca Mountain meteorological site, located in the valley bottom in northern Amargosa Valley and are therefore consistent with the arid conditions of the Yucca Mountain region (per Section
ANL-MGR-MD-000001 REV 01 / ICN 00 12 November 2000

63.115(a) of proposed 10 CFR 63, Dyer 1999, p. 19). In addition, these data were collected under a YMP program that met the requirements of the QARD (DOE 2000). The data are presented in CRWMS M&O (1999a, Table A-9 on p. A-10). For use in the Jensen-Haise equation (see Appendix A), temperatures were converted from the measured units of degrees Celsius ('C) to degrees Fahrenheit (0F) using the equation 'F = (9/5 'C) + 32.
2. Average Daily Incoming Solar Radiation Per Month (langleys/day) (DTN: MO9903CLIMATOL.001). Averages were calculated from five years of data collected at YMP Site 9. These data were selected because they are consistent with the arid conditions of the Yucca Mountain region (per Section 63.115(a) of proposed 10 CFR 63, Dyer 1999, p. 19) and because the data were collected under a YMP program that met the requirements of the QARD (DOE 2000). The data are presented in CRWMS M&O (1999a, Table A-9 on p. A10). For the calculation of evapotranspiration (ET), the data were converted from the measured units of megajoules/m /day to langleys/day using the equation langleys/day =
23.89 (megajoules/m2/day).
3. Average Annual Precipitation (DTN: MO9903CLIMATOL.001). Averages were calculated from five years of data collected at YMP Site 9. These data were selected because they are consistent with the arid conditions of the Yucca Mountain region (per Section 63.115(a) of proposed 10 CFR 63, Dyer 1999, p. 19) and because the data were collected under a YMP program that met the requirements of the QARD (DOE 2000). The data are presented in CRWMS M&O (1999a, Table A-9 on p. A-10).
4. Crop Coefficient (IK) Monthly crop coefficients for bernudagrass (DTN: MOOO 1 SPABCCO1.002) and tall fescue (MOOO 1SPATFCO1.003) are as recommended by the Nevada Cooperative Extension for southern Nevada and are based on values reported in Devitt et al. (1992, Table 3 on p. 722; 1995b, Figure 2 on p. 56). These values are presented in Table 6 of Section 6.5.
Crop coefficient is an expression of the ET of a plant species relative to the potential ET of a reference species. Crop coefficients are commonly used in calculations of ET because field measurements of potential ET for an area only are needed for one reference crop (Martin et al. 1991a, p. 201).
The crop coefficients for low maintenance bermudagrass and tall fescue were derived from studies of bermudagrass ET conducted in Las Vegas, Nevada (Devitt et al. 1992, Table 3 on p. 722; 1995b, Figure 2 on p. 56). These values were selected because they come from peerreviewed, published studies conducted closer to Yucca Mountain than any other published values (e.g., Devitt et al. 1995a, Table 2 on p. 68). The studies were conducted using widely accepted methods for measuring ET by scientists that have experience using these methods.
These coefficients were developed using a reference crop of cool-season grass, whereas the Jensen-Haise ET equation used in this analysis is for a reference crop of alfalfa. Snyder et al. (1987, p. 6) state that "Several agencies and researchers have recommended using ET, [i.e., from grass] directly as a method to estimate alfalfa ETc [i.e., crop coefficient for alfalfa]." Conversely, Martin et al. (1991 a, p. 202) state that grass usually uses 10-15% less water than alfalfa; thus, using a grass-based coefficient with an alfalfa-based estimate of ET may result
ANL-MGR-MD-000001 REV 01 / ICN 00 November 200013

in an 10-15% overestimate of water requirements. Therefore, this is an acceptable, conservative input for this analysis.
5. Temperature and Precipitation - United States (DTN: GS000100001221.001). Western U.S. weather data were used to estimate changes in evapotranspiration that would result from a change to a glacial-transition climate. These data were reported by the National Oceanic and Atmospheric Administration, National Climatic Data Center, and were collected using the standardized methods and equipment required by that agency.
4.1.6 Duration of Home Irrigation
Estimates of the number of months that bermudagrass (M099 11 ANLMGRMD.000) and tall fescue (M0991 1ANLMGRMD.001) should be watered are based on recommendations from the Nevada Cooperative Extension (Morris and Johnson 1991, pp. 3 and 4; Morris and Van Dam 1989, pp. 3 and 4) for southern Nevada. These data are appropriate for their intended use because they are consistent with the arid conditions of the Yucca Mountain region and current behaviors of the critical group (per Section 63.115 of proposed 10 CFR 63, Dyer 1999, pp. 19 and 20).
4.2 CRITERIA
The NRC Key Technical Issues and their associated subissues and technical acceptance criteria that are most applicable to this analysis are described in the Issue Resolution Status Report-Key Technical Issue: Total System Performance Assessment and Integration (NRC 2000, Section 4). The acceptance criteria that are applicable to the selection of inhalation and external exposure parameters in this analysis address the following concepts. These concepts are addressed throughout this AMR.
"* The pedigree of data is clearly identified.
"* Input parameter development and basis for their selection is described.
"* Sufficient data are available to adequately define relevant parameters and conceptual models.
"• Parameter values, assumed ranges, probability distributions, and bounding assumptions are technically defensible and reasonably account for uncertainties and variability.
Because BDCFs are used to evaluate the consequences of volcanic activity at Yucca Mountain, the following acceptance criterion from the Issue Resolution Status Report Key Technical Issue: Igneous Activity (NRC 1999, p. 86) for estimating dose consequences from igneous activity also is applicable to this analysis.
The parameters are constrained by data from Yucca Mountain Region igneous features and from appropriate analog systems such that the effects of igneous activity on waste containment are not underestimated.
ANL-MGR-MD-000001 REV 01 / ICN 00 14 November 2000

The criteria identified in the development plan (CRWMS M&O 2000a) for selection of three
estimates of each parameter are discussed in Section 1 of this AMR.
4.3 CODES AND STANDARDS
DOE interim guidance for pending issuance of new NRC regulations for 10 CFR 63 (Disposal of
High-Level Radioactive wastes in a Geologic Repository at Yucca Mountain, Nevada) (Dyer
1999) were considered in this analysis. Two sections of those regulations are directly applicable
to the selection of input parameter values for the biosphere model. Section 63.114 states that:
"Any performance assessment used to demonstrate compliance ... shall ... (b) Account for
uncertainties and variabilities in parameter values and provide the technical basis for
parameter ranges, probability distributions, or bounding values used in the performance
assessment."
Section 63.115 defines the proposed required characteristics of the reference biosphere and
critical group. That section includes the following applicable concepts.
"* Features, events, and processes that describe the reference biosphere shall be consistent with
present knowledge of the conditions in the Yucca Mountain region.
"* Biosphere pathways shall be consistent with arid or semi-arid conditions.
"* The critical group shall reside within a farming community located in the general vicinity of
the intersection of U.S. Highway 95 and Nevada Route 373.
" Behaviors and characteristics of the farming community shall be consistent with current
conditions of the Yucca Mountain region. Changes over time in the behaviors and
characteristics of the critical group including, but not necessarily limited to, land use, lifestyle, diet, human physiology, or metabolics; shall not be considered.
"* The behaviors and characteristics of the average member of the critical group shall be based
on the mean value of the critical group's variability range, which shall not be unduly biased
by the extreme habits of a few individuals.
"* Metabolic and physiological characteristics of the average member of the critical group shall
be consistent with present knowledge of adults.
5. ASSUMPTIONS
5.1 MASS LOADING
Mass loading following a volcanic eruption was calculated for the range of predicted ash depths
described in CRWMS M&O (2000f, Section 3.10.5.1) by multiplying predicted outdoor average
concentrations of PM 10 by a ratio of TSP to PM10, as described in Section 6.1. Four assumptions
were developed to support those calculations.
ANL-MGR-MD-000001 REV 01 / ICN 00 November 200015

5.1.1 Maximum Exposure to PM10 Following a Volcanic Eruption
Average annual outdoor concentrations of PM1 0 during the first year after a volcanic eruption will be no higher than 1,000 iLg/m 3.
This assumption is based on the few measurements of PM10 that have been taken following volcanic eruptions and the premise that people will modify their behavior to avoid health hazards from exposure to very high levels of PM 10.
An annual average concentration of 1,000 jig/m3 is within the range of PMj 0 concentrations measured after other volcanic eruptions. For example, the average concentration of respirable particles to which agricultural workers were exposed during the month after the eruption of Mount St. Helens was 440 jig/m 3 (Buist et al. 1986, Table 2 on p. 41). Concentrations inside combines and farm trucks averaged 2,240 and 350 ýtg/m , respectively. Average concentrations for other outdoor occupations ranged from 50 [tg/m 3 (cleanup crew-manual hosing) to 670 jig/in 3
(rubbish worker). Respirable dust concentrations in homes during that time averaged 30 [tg/m 3
(Buist et al. 1986, Table 2 on p. 41). Baxter (in McKague 1998, Enclosure 3 - unnumbered table on last page) reported personal exposure levels to PM10 in areas with "moderate ash" following the Monsterrat Volcano of 300 [ig/mi3 for background environment; 1,000 Pg/m 3 for indoor housework and outdoor walking/driving; and 5,000 Jig/m 3 for outdoor play and dusty occupations. Levels in areas with "high ash" for the same locations and activities were 1,000; 5,000; and 10,000 [tg/m 3 , respectively.
These measurements may be overestimates, or at least conservative estimates, of PM 10
concentrations expected after an eruption at Yucca Mountain. The predicted distribution of the average size of ash particles resulting from a volcanic eruption at Yucca Mountain is log triangular with a minimum of 10 Jim, a mode of 100 Jim, and a maximum of 1,000 Jim (CRWMS M&O 2000c, Section 6.5.1). Thus, at the smallest predicted average ash size (which has a very low probability of occurrence), no more than half of the particles would be directly inhaled into
the pulmonary regions of the lungs, and at the most probable (i.e., modal) mean particle size of 100 pm, a small portion of the particles would be inhaled into the lungs. This distribution was based in part on measurements of particle size distributions from Cerro Negro, which was a violent strombolian eruption, the type of eruption predicted at Yucca Mountain (CRWMS M&O 2000c, Section 6.5.1). In contrast, 94 to 99% of the particles (by count) from the Mount St. Helens eruption were of respirable size (Buist et al. 1986, p. 40). Baxter (in McKague 1998, Enclosure 3 - Item 17) stated that "For exposure estimates, the [PM 10] results obtained from Mount St. Helens and Monsterrat will almost certainly need to be reduced by a factor to allow for the coarser material emitted at Cerro Negro." Therefore, a maximum annual average PM10
concentration of 1,000 jig/m3 is conservative relative to measurements taken after those two volcanoes.
Outdoor concentrations of PMl0 to which the receptor group would be exposed following a volcanic eruption may be higher for short periods than those used in the above calculation, especially in areas with thick ash deposits. However, it is very likely that people exposed to average levels greater than 1,000 jig/mi3 for a year will modify their behavior or environment (e.g., wear a mask, spend less time outdoors, wet or remove ash) to reduce the amount of dust
they are inhaling because chronic exposure to such high levels of respirable dust will affect their
ANL-MGR-MD-000001 REV 01 / ICN 00 16 November 2000

health. Numerous studies have documented the relationship between daily PMI0 levels and mortality and morbidity rates (see Dockery and Pope 1996, pp. 123-147, for a review). The general trend among mortality studies is a 1% increase in mortality rates for each 10 [tg/m 3
increase in PM 10. The relationship between PMI0 and mortality documented in those studies needs to be interpreted carefully for this analysis of a volcanic eruption because the PMI0
concentrations studied generally were less than 100 ug/mr3 (Dockery and Pope 1996, Table 6.1 on p. 127) and most PMIo particles in the urban settings studied were combustion byproducts such as sulfates, nitrates, and acidic fine particles. However, Choudhury et al. (1997, pp. 113117) showed a clear relationship between morbidity and PMI0 concentrations in Anchorage Alaska, where a primary source of PM1 0 was volcanic ash. Based in part on these studies, the EPA has established a National Ambient Air Quality Standard for annual average PM 10
concentrations of 50 jig/m 3 (40 CFR 50.7) and considers a 24-hour average of 600 gg/m 3 as the significant harm level (the level at which serious and widespread health effects occur to the general population, EPA 1994, p. 13). EPA issues a public alert when a 24-hour average PM1 0
level reaches 350 jig/m3, issues a public warning when a daily average reaches 420 jig/m3, and declares a public emergency when a daily average exceeds 500 [ig/m 3 (EPA 1994, p. 13). Given that daily average concentrations in the range of 400-600 jig/m3 are considered harmful, and increases in PM10 at average concentrations of less than 100 [ig/mi3 cause an increase in morbidity and mortality, an annual average concentration of 1,000 pg/m 3 is a very conservative upper value that is valid for the maximum ash depths predicted to occur at Yucca Mountain.
This assumption does not require confirmation because it is based upon a conservative interpretation of analog data and human health studies that bounds the uncertainties and variability in mass loading.
5.1.2 Mass Loading Decay Function
The concentration of resuspended ash particles decreases exponentially after a volcanic eruption.
This assumption is based on commonly used equations for predicting the change or decay in concentrations of resuspended particles and radionuclides through time.
Dahneke (1975, p. 194) developed a generalized exponential equation for particle resuspension of Nt = N0e-kt, where Nt = concentration at time t, No = initial concentration, k = resuspension factor (i.e., an estimate of how quickly the decay occurs), and t = time. Anspaugh et al. (1975, p. 577-578) modified that equation to predict resuspension of plutonium in desert soils on the Nevada Test Site. The exponential equation of Anspaugh et al. (1975, p. 577-578) is used in the ingestion pathway analysis of GENII-S to calculate resuspension of particles deposited on crops (and can be used as part of the inhalation pathway) (Napier et al.. 1988, p. 4.64). Similar exponential decay equations for resuspension are presented in International Atomic Energy Agency (IAEA, 1982, p. 20; 1992, Figure 1 on p. 13) and Till and Meyer (1983, p. 5-32 through 5-33).
Inverse or inverse power functions have also been used to predict concentrations of resuspended radionuclides (e.g., IAEA 1992, Figure 1 on p. 13; Garger et al., 1997, p. 1651). Garger et al. (1997, Figure 3 on p. 1654) compared how 8 equations (six exponential, one inverse power, and one combination) predicted temporal changes in radionuclide concentrations following the
ANL-MGR-MD-00000I REV 01 / ICN 00 17 November 2000

accident at the Chernobyl nuclear power plant. Equations with an inverse time function
generally predicated concentrations better than the exponential equations in that mesic
environment (Garger et al. 1997, p. 1655) because the exponential equations overestimated
concentrations (i.e., did not calculate a rapid enough decay). However, an inverse decay
function is less conservative than an exponential function (because it predicts a more rapid
decrease in concentrations) and may not apply to arid regions such as the Nevada Test Site,
where an exponential equation has proven to be effective (Anspaugh et al. 1975).
This assumption does not need confirmation because it is based a commonly accepted
relationship between airborne particle concentrations and time that was developed for arid
conditions.
5.1.3 Mass Loading Decay Rate
The concentration of resuspended particles decreases to background levels similar to that of a
farming community within 10 years of cessation of a volcanic eruption.
This assumption is based on a conservative interpretation of the decrease in concentrations of
TSP after the eruption at Mount St. Helens in May 1980 (Figure 1). Data were selected from the
cities in Washington with the deepest ash deposits (Bernstein et al. 1986, Figure 1 on p. 26) that
had TSP measurements for 1979 through 1982 and at least one TSP measurement >400 Pg/mr3
during May or June 1980.
Five-reading running averages of TSP measurements during 1979-1982 were calculated to
smooth the trend for easier interpretation (Figure 1).
TSP concentrations at Spokane and Yakima (ash depths of 5-9 mm) decreased to pre-eruption
low concentrations after about six months (i.e., during December 1980) and then fluctuated
within a range similar to that measured prior to the eruption (Figure 1). Initial TSP
concentrations at Longview (ash depth 1-2 mm) were higher than at the other sites, but returned
to background conditions more rapidly. Thus, TSP concentrations following the eruption of
Mount St. Helens decreased to background levels in less than one year.
Concentrations of resuspended ash after Mount St. Helens may have decreased more rapidly than
would occur at Yucca Mountain for the following reasons.
" Precipitation at the Washington sites (Yakima = 8 inches, Spokane = 16 inches, Longview =
45 inches, DTN: GS000100001221.001) is two to eleven times higher than at Yucca
Mountain (annual average = 4 inches, see Section 6.2). Precipitation removes particulate
matter from the air.
" These sites receive an average of 6 to 42 inches of snowfall annually (DTN:
GS 000100001221.001). Snow cover prevents ash from becoming resuspended and increases
the rate of infiltration of fine particles into the soil.
" Ash levels were not as high as the maximum levels predicted at Yucca Mountain (CRWMS
M&O 2000f, Section 3.10.5.1).
November 2000ANL-MGR-MD-000001 REV 01 / ICN 00 18

Longview Site 8
700 600
500
a. 400 300
200
Date
Spokane Site 16
600
500__ _
S300
•" 200
lOOOOKK~
0
Date
Yakima Site 1006
300
250
200
13- Ir
50 0
\Kb Q K K'b\I \I b lb K t
Date
Figure 1. Concentrations (pg/m 3) of TSP at three sites in Washington before and after the eruption
of Mount St. Helens in May 1980. TSP is presented as the running average of 5 consecutive measurements (DTN: MO0008SPATSPOO.013).
ANL-MGR-MD-000001 REV 01 / ICN 00 November 200019

To conservatively interpret this data, it was assumed that TSP concentrations at Yucca Mountain would decrease to background levels within 10 years, at least an order of magnitude more slowly than TSP concentrations decreased after Mount St. Helens.
This assumption does not require confirmation because it is based upon a conservative interpretation of analog data that bounds the uncertainties and variability in mass loading.
5.1.4 Ratio of TSP to PM1 0 After a Volcanic Eruption
The ratio of TSP to PM1 0 following a volcanic eruption is 3.0.
This assumption is based on analog data reported from Mount St. Helens. Buist et al. (1986, Table 2 on p. 41) report concentrations of TSP and PM 10 for various activities and locations during the month following the eruption of Mount St. Helens. The two situations most analogous to the behaviors of the receptor population (agricultural work and within homes) were examined to develop this ratio. The ratio for an agricultural farming was 3.2 (1.42:0.44 [Ig/m 3). The ratio for homes was 3.0 (0.09:0.03 [Ig/m 3). A value of 3.0 was chosen as a representative ratio.
This assumption does not require confirmation because it is based upon analog data that
corresponds to the expected behaviors of the receptor population.
5.2 Inhalation Exposure Time
Three assumptions about the behavior of members of the receptor population were made for the analysis of inhalation exposure time (Section 6.2).
5.2.1 Shielding Factor
When in a contaminated area, the exposure rate experienced while indoors conducting household activities and inside a vehicle is half of that experienced while outdoors. This assumption is based on shielding factors recommended by the NRC (Regulatory Guide 1.109, Rev. 1. 1977, p. 1.109-43). It has been used as a shielding factor for inhalation exposure in NRC dose assessments for high-level radioactive waste repositories (LaPlante et al. 1995, p. 2-18; Wescott et al. 1995, p. 7-10; LaPlante and Poor 1997, p. 2-23). Because this is a commonly accepted shielding factor developed by the NRC, this assumption does not need to be confirmed. Note
that this assumption is extremely conservative for the very high mass loading values used for the first years following a volcanic eruption.
5.2.2 Time Spent Recreating Outdoors
Time spent outdoors tending a garden plot and participating in other outdoor recreational
activities within the hypothetical farming community by members of the receptor population is
assumed to be 827 hours/year (EPA 1997a, Table 15-120 on p. 15-136). This value is the amount of time "spent at home in the yard or other areas outside the home" based on a nationwide survey of 1,301 adults. This EPA survey is the most comprehensive and best available information on time activity budgets of people in the United States. The value of 827 hours/year
ANL-MGR-MD-000001 REV 01 / ICN 00 November 200020

is more conservative and more age-specific than 548 hours/year from a California study of 1,762 people 12 years of age or older (EPA 1997a, Table 15-7 on p. 15-25) or 450 hours/year from a nationwide survey of 2,762 people 12 years of age or older (EPA 1997a, Table 15-7 on p. 1525). There is no site-specific information upon which to base this assumption.
This assumption does not need to be confirmed because it is based on a conservative selection of available information (i.e., the highest value was selected) that bounds the uncertainties and variability of the current behavior of residents in the region surrounding Yucca Mountain.
5.2.3 Time Spent at Work
Assumptions about three employment scenarios were made to develop distributions of inhalation exposure time (Section 6.2) and soil exposure time (Section 6.4) for potential receptor populations.
1. Commuter-A person that commutes to work is employed 35 hours/week, 50 weeks/year either indoors or outdoors in a non-contaminated work area distant from the farming community. This is 1,750 hours/year (where one year equals 8,760 hours). The amount of time spent working is based on the modal number of hours worked per week by employed residents of Amargosa Valley in 1989 (USCB 1999). Commuting time to and from work was assumed to be five minutes in the contaminated area (41.67 hours/year) and 30 minutes in non-contaminated areas each way (250 hours/year), based on the median travel time to work for the area (USCB 1999). This scenario is intended to be similar to the employment behavior of workers in the manufacturing, communication, retail, finance, entertainment, professional, public administration, and similar industries or occupations. Over 50% of 343 Amargosa Valley workers that responded to the 1990 census were employed in these industries (USCB 1999). This scenario also is similar to the employment behavior of miners (38% of employed Amargosa Valley residents, USCB 1999) that work at mines outside of the valley.
2. Construction/Farm Worker-A salaried construction or farm worker is employed 40 hours per week, 50 weeks per year (2,000 hours/year) in an outdoor contaminated area. Commuting time to and from work is within the contaminated area and is assumed to be 5 minutes in each direction (41.67 hours/year), based on the second-most frequently reported travel time to work for the area (USCB 1999). Nine percent of 343 employed respondents in Amargosa Valley did construction or farm work (USCB 1999). This scenario also applies to some miners working in a contaminated area.
3. Farmer-A farmer works outdoors 60 hour/week (12 hours/day, 5 days/week; 52 weeks per year = 3,120 hours/year) in a contaminated area (e.g., an irrigated agricultural area). Commuting time to and from work is within the contaminated area and is assumed to be 5 minutes in each direction (43.33 hours/year) based on the second-most frequently reported travel time to work for the area (USCB 1999). This scenario is intended to bound the lifestyle of a farmer, of which there are relatively few (< 3% of 343 respondents) in Amargosa Valley (USCB 1999). Although it is possible that a farmer could spend more time outdoors in a contaminated area, more extreme values were not considered because Section 63.115(b)(4) of the proposed regulations for 10 CFR 63 (Dyer 1999, p. 20) states that the behaviors and
ANL-MGR-MD-000001 REV 01 / ICN 00 21 November 2000

characteristics of the average member of the critical group should not be unduly biased based on the extreme habits of a few individuals.
These assumptions do not need to be confirmed because they are based in part on current information about the behaviors of residents in the region surrounding Yucca Mountain and because they includes conservative estimates that reasonably account for the uncertainties and variability of time spent outdoors.
5.3 Chronic Breathing Rate
No assumptions were used to develop estimates of chronic breathing rate.
5.4 Soil Exposure Time
The same assumptions about behaviors of the potential receptor population developed for inhalation exposure time (Section 5.2) were made for the analysis of soil exposure time (Section 6.4).
5.5 Home Irrigation Rate
Two assumptions were developed for the analysis of irrigation rate (Section 6.5).
5.5.1 Deep Percolation
Annual deep percolation equals six inches. Deep percolation is the amount of water that passes below the root zone. In mesic regions, deep percolation can result from precipitation or irrigation in excess of ET that percolates beyond the root zone. In arid agricultural systems, deep percolation occurs intentionally during irrigation to leach salts (i.e., flush them below the root zone) that are deposited in the soil from irrigation water and that would decrease plant production. The most accurate way to measure deep percolation is to install underground lysimeters, which measure the amount of water that moves below the root zone (e.g., Devitt et al. 1992, pp. 717 through 723). Review of published literature and discussions with University of Nevada Cooperative Extension personnel indicated that no lysimeter measurements have been performed in the agricultural areas surrounding Yucca Mountain.
In the absence of site specific data, a value of six inches was assumed for this analysis. This value was selected to be consistent with the value of percolation implied in the GENII-S code and to be compatible with other portions of that code (Napier et al. 1988, p. 4.58). The validity of this value for irrigation of tall fescue in Amargosa Valley, which is less salt-tolerant than bermudagrass (Martin et al. 1991a, Table 10-10 on p. 223), was checked using two equations, as shown in Appendix B. These equations use information on salt content of irrigation water and salt tolerance of plants to determine the amount of water required to leach salts. Values of 0.4 and 3.3 inches were calculated (Appendix B), which are substantially below the default value of 6 inches. The higher value of 6 inches is conservative because it results in additional water, and therefore additional radionuclides, being added to the soil.
ANL-MGR-MD-000001 REV 01 / ICN 00 November 200022

This assumption does not need to be confirmed because it conservatively bounds uncertainties and variability in deep percolation and is based on present knowledge of the arid conditions in the region surrounding the Yucca Mountain site.
5.5.2 Multiplication Factor for Bounding Irrigation Rate
The bounding value for irrigation rate is 25% higher than the maximum irrigation rate calculated for tall fescue. Irrigation rates higher than actual requirements would result from such factors as inefficient irrigation systems, intentional or unintentional over-irrigating, and higher leaching requirements on soils with high salt content. Although rates greater than 25% are possible, it is unlikely that someone would reach such an extreme because of the increased cost for pumping or buying groundwater and the detrimental effects that flooding would have on turfgrass and the rest of their landscape. The inputs and methods used to calculate maximum irrigation rate are conservative (e.g., use of high-maintenance turf grass crop coefficients) and result in an irrigation rate about 6% higher than that recommended for Las Vegas (see Section 6.5); thus, an increase of 25% above that maximum is a very conservative assumption.
This assumption does not need to be confirmed because it reasonably bounds uncertainties and variability in turf irrigation practices and is based on present knowledge of the arid conditions in the region surrounding the Yucca Mountain site.
5.6 Duration of Home Irrigation
No assumptions were used to develop estimates of the duration of home irrigation.
6. ANALYSIS
6.1 MASS LOADING
Measurements of the annual average outdoor concentration of TSP from analog sites or situations were used to determine mass loading distributions to account for all resuspended particles inhaled into the respiratory system. Concentrations of TSP for the nominal performance and volcanic eruption scenarios were calculated by first determining a reasonable, conservative distribution of annual average PM 10 concentrations and then multiplying those concentrations by a representative TSP:PM10 ratio. This was done because there is much more data available on PM10 concentrations for farming communities and following volcanic eruptions, and because the health effects of high PM10 concentrations are more clearly understood. Distributions of average annual values were developed, rather than distributions of daily values, because the recommended values will be used to calculate annual exposure rates.
Mass loading distributions could have been developed using a soil resuspension model (e.g., Anspaugh et al. 1975). Although resuspension models were examined to select the shape of the mass load decay function for the volcanic eruption parameters, resuspension models were not
used to calculate mass loading values because available models require numerous site- and
situation-specific parameter values that generally are not available and the accuracy of the
models is not well understood (Garger et al. 1997). In addition, mass loading values based on representative measurements of PM 10 and TSP:PM 10 ratios are more conservative because it is
ANL-MGR-MD-000001 REV 01 / ICN 00 November 200023

assumed that all suspended particles are contaminated. This would not be true, at least for the nominal performance analysis, because airborne particulate matter is generated over a large upwind area, and much of that area would not be contaminated by irrigation water.
Mass loading distributions also could have been developed by multiplying time spent conducting various activities by TSP concentrations typical of those activities (i.e., time-activity exposure budgets). This method was not used because there are few measurements of personal exposure to PM 10 or TSP for many of the activities expected to be conducted by the receptor population (e.g., alfalfa farming, gardening, other outdoor recreation). To avoid introducing these uncertainties into the estimates of mass loading, conservative analog data representative of the reference biosphere were used and exposure time was scaled for indoor and outdoor exposure rates in the calculation of inhalation exposure time (Section 6.2).
Distributions of mass loading were developed separately for the nominal performance and volcanic eruption evaluations because release of ash during a volcanic eruption would increase the mass loading of contaminated particles.
An increase in precipitation resulting from climate change likely would cause a decrease in mass loading (e.g., Bernstein et al. 1986, Table 1 on p. 27). Values developed for the nominal performance evaluation therefore will be conservative and do not need to be modified for an analysis of the effects of climate change.
6.1.1 Nominal Performance
PM10 Concentrations-Average annual outdoor concentrations of PM1 0 from analog arid farming communities were used to develop a distribution of concentrations representative of the reference biosphere farming community. Analog PM10 concentrations were obtained from the EPA Office of Air Quality Planning and Standards AIRSData database (EPA 2000), which contains air quality data collected by state and local agencies and reported to the EPA to monitor compliance with federal air quality standards.
The AIRSData database was queried to obtain annual averages and site descriptions (including state, county, address, land use classification, and location type) for all available PM 10 data reported during 1994-1999. The resulting database of 10,441 entries (DTN: MO0007SPAAPMOO.012) was sorted by land use, location type, and state to identify air quality monitoring sites in arid regions that had a land use classification of agricultural and a location type of rural. Annual average precipitation and snowfall for the 20 rural, agricultural sites (Table 3) (plus one other added later--see below) in states likely to have arid conditions similar to the Yucca Mountain region (California, Arizona, New Mexico, and Texas---no data were available from Nevada or Utah) were then obtained from the National Climatic Data Center, Western U.S. Meteorological Station Weather Data (DTN: GS000100001221.001). Other arid regions (e.g., central Washington) were not considered because they have much higher snow depth than Yucca Mountain, which decreases the level of airborne particulate matter.
Sites with annual average precipitation of •10 inches and average annual snowfall of •5 inches were selected for further consideration. These climatic criteria were selected to match the arid environment of the Yucca Mountain region. Only five sites met these criteria: Westmoreland,
ANL-TMGR-MD-000001 REV 01 / ICN 00 24 November 2000

Imperial County California; Winterhaven, Imperial County, California; Olancho, Inyo County, California; Kettleman City, Kings County, California; and Anthony, Dona Anna County, New Mexico (Table 3). An additional site, Corcoran, Kings County, California, was added to Table 3
based on information discussed below. Selection of data from arid sites was conservative; all arid sites had weighted annual averages of >35 .tg/m 3 and all mesic sites had averages of <30 ýtg/m 3 (Table 3).
To avoid biasing the estimate of mass loading based on site-specific conditions, only one site
from Imperial County California was selected. The Imperial County Air Pollution Control District was contacted for advice on which site, Westmorland or Winterhaven, would be more
Table 3. Air quality monitoring sites in agricultural, rural settings.a
Average Annual (inches)c
Location Years Average PMjob Monitor ID Precipitation Snowfall
Westmorland, CA 1994-1999 40.4 060254003 2.7 0.1
Winterhaven, CA 1994-1998 61.9 060254002 3.5 0.0
Kettleman City, CA 1994-1996 44.8 060311003 6.6 0.0
Olancha, CA 1994-1995 36.4 060270016 6.7 4.2
Corcoran, CAd 1994-1998 43.9 060310003 7.2 0.1
Anthony, NM 1994-1999 48.0 350130016 9.4 4.5
El Rio, CA 1994-1999 26.9 061113001 12.9 0.0
Bethel Island, CA 1994-1999 22.8 060131002 13.7 0.0
Vandenberg AFB, CA 1994-1999 19.1 060834003 14.6 0.0
Piru, CA 1994-1999 28.1 061110004 17.0 0.0
Sacramento, CA 1994-1997 26.2 060675002 17.2 0.1
Jalama, CA 1994-1995 29.0 060831011 17.8 0.0
Concepcion, CA 1994-1998 26.0 060831012 17.8 0.0
Gaviota, CA 1994-1998 17.2 060831015 17.8 0.0
Isla Vista, CA 1994-1998 25.7 060831020 17.8 0.0
Capitan, CA 1994-1999 16.9 060831025 17.8 0.0
Gridley, CA 1994 23.2 060074001 18.1 0.1
Miami, AZ 1994 9.6 040079990 19.3 2.9
Siskiyou County, CA 1994-1999 8.1 060930005 19.8 20.3
Calaveras County, CA 1994-1999 19.6 060090001 22.1 0.0
Midlothian, TX 1994-1996 23.0 481390007 32.3 1.0
DTN: M0007SPAAPMOO.012 GS000100001221.001
Notes: a Sites used in this analysis are shown in bold. b Weighted (by number of measurements per year) annual average, pg/m 3. Highest readings
per year were selected for sites with more than one monitor. c Based on all years of data available in DTN GS000100001221.001. d Land use and setting listed as not available in DTN M0007SPAAPMOO.012, Reclassified
as agricultural and rural based on phone conversation with regional air quality district (Rautenstrauch 2000).
ANL-MGR-MD-00000I REV 01 / ICN 00 25 Novemnber 2000

appropriate for this analysis (Rautenstrauch 2000). The Deputy Air Pollution Control Officer stated that Winterhaven, which has the second highest annual average of all agricultural/rural sites in DTN MO0007SPAAPMOO.012, is polluted by industry from the adjacent city of Mexicali, Mexico (population approximately 900,000) and does not have air quality representative of a farming community. She recommended that Westmorland, which is a small town surrounded by agriculture, would be the better choice. The Winterhaven site was eliminated from consideration based on this information.
The San Jouquin Air Pollution Control District also was contacted (Rautenstrauch 2000) because one potentially suitable site (Corcoran) in the San Jouquin Valley had no land use or setting classification in the EPA AIRSdata database. An employee of that district recommended using data from Corcoran instead of Kettleman City or any other site because Corcoran is a small community surrounded by agriculture and Kettleman City is adjacent to Interstate 5. He also stated that a study being conducted by the San Jouquin Air Pollution Control District of the sources of particulates has documented that agriculture is the source of dust for Corcoran. Average annual PM10 concentrations were very similar for both sites (Table 3). The Corcoran site therefore was added and the Kettleman City site was eliminated from consideration.
The distribution of mass loading was based on the 19 annual average PM1 0 concentrations available for the four analog sites (Table 4). If more than one annual average was available for a
site (some sites had colocated samplers), the higher value was used. Irl -P.. + . L1' 17 V1UA
(rounded to the nearest jig) is 42 ,, _/ 3 •A I-.. A - AA .- • . ; : .
8.8 jig/m 3 (Table 4).
This distribution of average annual PM 10 concentrations is high, and therefore conservative, relative to other values in the AIRSdata database (DTN: MO0007SPAAPMOO.0 12), which includes measurements taken in industrial, commercial, residential, agricultural, and other land use settings. Of 10,442 annual averages in that database, 95.7% are less than or equal to the distribution mean of 42 lag/m 3 and 99.7% are less than the 99.9 percentile of 69 jag/m 3 . It is also high compared to values reported by the Air Resources Board, California Environmental Protection Agency (1999) for desert regions of that state.
ANL-MGR-MD-000001 REV 01 / ICN 00
Table 4. Annual average PM10 concentrations at arid agricultural sites.
City Year Mean Maximur Anthony, NM 1994 40.0 126
1995 53.1 149 1996 55.9 129 1997 41.6 135 1998 38.2 98 1999 48.6 152
Westmorland, CA 1994 38.0 120 1995 38.9 107 1996 49.3 229 1997 40.1 118 1998 29.8 68 1999 43.8 126
Olancha, CA 1994 20.4 262 1995 42.0 2252
Corcoran, CA 1994 49.6 129 1995 50.5 279 1996 40.7 143 1997 45.4 154 1998 28.9 78
Average 41.8 Standard Deviation 8.8
DTN: M0007SPAAPMOO.012
November 200026
n

The distribution also is very high compared to concentrations of PM10 measured at Yucca Mountain. Average annual concentrations of PMI0 at Air Quality and Meteorological Monitoring Site 9, located in Amargosa Valley about 3 km north of the intersection of U.S. Highway 95 and Nevada Route 373, ranged from 7 to 10 V.g/m 3 from 1993 through 1997 (CRWMS M&O 1999a, Table 2-3 on p. 13). Low values at Yucca Mountain likely were due in part to the lack of soil disturbing activities, although concentrations at Site 1 (located about 1 km from the Exploratory Studies Facility) during the peak of ground disturbing activities at Yucca Mountain (1993-1994) averaged 10 pig/m 3 per year (CRWMS M&O 1999a, Table 2-3 on p. 13). Low PM10 concentrations in Amargosa Valley and Yucca Mountain may also be because the common soils in the area are gravelly or cobbly sandy loams with a low clay content (CRWMS M&O 1999b, Figure 1 and Appendix C) that do not generate large amounts of inhalable particles when eroded by wind or otherwise disturbed.
TSP:PM1 0 Ratio-The ratio of TSP to PMI0 was based on simultaneously collected measurements of TSP and PMl0 at Yucca Mountain (see Table 2 for list of DTNs). Twelve ratios of less or equal to 1.0 (i.e., PMIO concentrations the same as or higher than TPS) were omitted from consideration. Eleven of these 12 ratios had very low values of TSP and PM1 0 (<10 .g/rm3) or very small differences between TPS and PM10 (•2 [Ig/m 3). Thus, most of these incorrect ratios likely were the result of normal measurement error for the equipment used. The average TSP:PM1o ratio for the remaining 1,276 measurements was 2.46 (standard deviation = 1.03). The median value was 2.22 and the ratios ranged from 1.0 to 12.57. The data were skewed toward small values; 84% of ratios were <4.0 and 94.3% were <5.0. Based on this information, a TSP:PM10 ratio of 2.5 was selected to calculate TSP concentrations.
These data were collected in areas with soils typical of those in northern Amargosa Valley (CRWMS M&O 1999b, Figure 1 on pp. 2 and 3) and therefore are consistent with the current arid conditions of the Yucca Mountain region. Multiplying this ratio by PM 10 concentrations typical of arid farming communities results in TSP concentrations consistent with the arid conditions at Yucca Mountain and the expected characteristics of the reference biosphere farming community.
Mass Loading Parameter Values-Based on the central limit theorem (i.e., the distribution of sample means will tend toward normality as the number of samples increases), the reasonable, conservative distribution of mass loading is normally distributed because it is based on a series of average annual values (Table 4). The variation in the distribution is a function of differences among farming communities and is intended to bound the uncertainties in the characteristics of the reference biosphere farming community. The average of that distribution is 105 pig/m 3, calculated by multiplying the average of the 19 farming-community PM10 concentrations (42 pg/m3) by the TSP:PMIo ratio of 2.5. The 0.1% and upper 99.9% of the distribution are 38 and 173 pig/m 3, respectively (calculated as [PM 1O average + 3.09 x PM10 standard deviation] x TSP:PMI0 ratio = [42 + 27 pIg/m 3] x 2.5). Converted to g/m 3, the units required by GENII-S for mass loading, this distribution has a mean of 1.05 x 10⁴ g/m3, 0.1th percentile of 3.8 x 10⁻⁵ x g/m 3, and 99.9th percentile of 1.73 x 10 4 g/m 3.
The 99.9t" percentile of the distribution (173 pig/m 3 or 1.73 x 10 4 g/m 3) should be used as a bounding value. This value is very conservative and reasonably bounds the uncertainties in mass
ANL-MGR-MD-000001 REV 01 / ICN 00 November 200027

loading, as it is based on a PM1 0 concentration that is higher than 99.7% of the annual average measurements reported in DTN MO0007SPAAPMOO.012.
The average of the TSP distribution (105 tg/m 3 or 1.05 x 10⁻⁴ g/m 3) should be used as a reasonably expected estimate for a deterministic run. This value was chosen because the average is the best estimate of central tendency for normally distributed data and the value therefore is the single value most representative of the reference biosphere farming community.
6.1.2 Volcanic Eruption
Two distributions of mass loading are presented in this section. The first is applicable to deep ash deposits and varies over time through a 10-year transition period. This distribution is intended to bound uncertainties in mass loading due to variation in ash depth, the characteristic of a volcanic eruption likely to have the greatest influence on mass loading. Values of mass loading are presented as annual averages. The second varies with ash depth and is intended to account for uncertainties in mass loading due to variation over all predicted ash depths. Values are reported as transition-period (i.e., 10-year) averages. Both distributions are intended for use over the 10-year transition period; applying them to longer periods will result in greater conservatism. If periods of analysis longer than 10 years are considered, the transition-period distributions should be combined with the farming-community distribution described in Section 6.1.1.
Depth of ash 20 km south of Yucca Mountain has been predicted based on two conditions: variable winds matching current, local conditions and southerly winds (a conservative scenario resulting in more ash being transported toward the receptor population) (CRWMS M&O 2000f, Section 3.10.5.1). Under variable wind conditions, the minimum predicted ash depth was less than 1 x 10⁻⁸ cm and the maximum was about 10 cm. About 80% of predicted depths were <0.1 cm, and an additional 15% were 0.1 to 1 cm. With southerly winds, the minimum depth was less than 10-2 cm and the maximum was 36 cm. About 20-25% of predicted depths were < 0.1 cm, 40% were 0.1 to 1 cm, 30-35% were 1 to 10 cm, and 5% were >10 cm (CRWMS M&O 2000f, Section 3.10.5.1).
Mass Loading for Maximum Ash Depth-Based on the four assumptions in Section 5.1, mass loading that would be experienced at the maximum ash depths decreases exponentially from an annual average of 3,000 jig/m 3 the first year following an eruption to 105 pig/m 3 within 10 years. The maximum value of 3,000 pig/m 3 was calculated as the maximum PM1 0 value of 1,000 [tg/m 3
assumed in Section 5.1.1 multiplied by the TSP:PM10 ratio of 3.0 assumed in Section 5.1.4. This change is expressed by the equation from Anspaugh et al. (1975: p. 577):
St = Smaxe-kt
where:
S, = annual average mass loading in year t,
Smax = annual average mass loading at year 0 = 3,000 pg/m3,
k = exponential resuspension factor, calculated as [ln(Sm.)-ln(Smin)]/10 years = 0.335,
ANL-MGR-MD-000001 REV 01 / ICN 00 November 200028

Smin = minimum annual average mass loading = 105 jig/m3, and
t = year.
Exponential functions have a log-uniform probability distribution; therefore, if a one-year period for which exposure is to be calculated is selected at random (uniformly) from the 10-year transition period following a volcanic eruption that deposits a large amount of ash at the receptor-group location, then the distribution of mass loading is log uniform with a minimum of 105 jIg/m 3 (1.05 x 10 -4 g/m 3) and a maximum of 3,000 jg/m3 (3.0 x 10⁻³ g/m 3). The single average value representing this 10-year period that should be used in a deterministic run is 864 jig/mr (8.64 x 10⁴ g/m3). That value was calculated by integrating the above exponential equation for 0 to 10 years and dividing the result by 10 years. This distribution and fixed value are intended to represent the 10-year period following an eruption that deposits a large amount of ash at the location of the receptor population. The maximum value in this distribution, 3,000 jig/mr3 (3.0 x 10⁻³ g/m 3), is intended for use as the bounding value in sensitivity analyses and for the first 1-2 years following an eruption. This value should be used with caution as the bounding value for the entire 10-year period, and especially to represent all ash-depth scenarios, as it is improbable that concentrations of airborne ash will remain at that high level.
Mass Loading for All Ash Depths-The maximum mass loading for the distribution of transition-period values applicable to all ash depths is 864 jig/m3 (8.64 x 10.4 g/m3 ), the average of the distribution for maximum ash depths. Predicted minimum ash depths are so small (10-5 to 10-2 cm) that they will cause no detectable change in mass loading; therefore, the minimum value for this distribution is the same as the average mass loading for a farming community presented in Section 6.1.1 (105 jig/mi3 or 1.05 x 10⁴ g/m 3). The distribution of predicted ash depths is approximately exponential; therefore, the appropriate shape of this probability distribution is log uniform. The average value of the distribution (calculated by integration) is 360 jig/m3 (3.60 x 10. g/m3), and should be used as the reasonably expected value in a deterministic run intended to consider the uncertainty and variability of all predicted ash depths. The bounding value for the distribution of transition-period values is the maximum of the distribution (864 jig/m3 or 8.64 x 1 0 . g/m3).
6.2 INHALATION EXPOSURE TIME
Based on the assumptions in Section 5.2 about three employment scenarios, time activity budgets were developed for two potential receptor groups, residents of Amargosa Valley and farmers and other outdoor workers (Table 5). These distributions account for uncertainties in inhalation exposure time due to variation in occupation and other behavioral characteristics of Amargosa Valley residents.
The inhalation exposure time category in Table 5 is an index of the amount of time in hours per year that a member of the receptor population is assumed to be exposed to, and will be inhaling, aerosolized radioactive material (i.e., dust). Inhalation exposure time was calculated as the sum of time spent outdoors in a contaminated area plus 50% of time spent indoors in a contaminated area. This equation is based on assumption 5.2.1 that the exposure rate while conducting household activities is one-half of that experienced outdoors.
ANL-MGR-MD-00000I REV 01 / ICN 00 29 November 2000

employment scenarios.
Contaminated Non-contaminated Areas Areas
Outdoors plus Inhalation
Scenario Activity Outdoors Indoors Indoors Exposure Timea
Commuter At work 0.00 0.00 1750.00 Commuting 0.00 41.67 250.00
At home 827.00 5891.33 0.00
Total 827.00 5933.00 2000.00 3793.50
Construction/ At work 2000.00 0.00 0.00 Farm Worker Commuting 0.00 41.67 0.00
At home 827.00 5891.33 0.00 Total 2827.00 5933.00 0.00 5793.50
Farmer At work 3120.00 0.00 0.00 Commuting 0.00 41.67 0.00 At home 827.00 4771.33 0.00 Total 3947.00 4813.00 0.00 6353.50
Notes: a Calculated as 100% of time spent outdoors in a contaminated area plus 50% of time spent indoors in a contaminated area (Regulatory Guide 1.109, Rev. 1. 1977, p. 1.109-43).
The values presented in this section can be used for analysis of nominal performance, a volcanic eruption, and climate change because ash deposits (CRWMS M&O 2000f, Section 3.105.1) would not be deep enough to cause the receptor population to modify their behavior after the eruption has stopped and because Section 63.115(b)(2) of proposed 10 CFR 63 (Dyer 1999, p. 19) states that changes over time in the behaviors and characteristics of the critical group should not be considered.
6.2.1 Amargosa Valley Residents
Over 50% of workers in Amargosa Valley have occupational characteristics similar to those of a "commuter" (see Section 5.2.3); therefore, a distribution of inhalation exposure time based only on employed residents would be skewed toward low values. However, 114 of 489 Amargosa Valley residents that responded to the 1990 census were unemployed and 18 of 343 employed residents worked at home (USCB 1999). To account for those people, and to ensure that the distribution is conservative (i.e., not skewed toward low values), a uniform probability distribution is recommended for the receptor group of Amargosa Valley residents. All members of this receptor group are assumed to spend 827 hours/year outdoors tending a garden or engaging in other recreational activities in the contaminated area (Assumption 5.2.2). The minimum value of the distribution is based on the employment behavior of a commuter (3,793.50 hours/year) and the maximum is based on the employment behavior of a farmer (6,353.5 hours/year). The reasonably expected value to use in a deterministic run of the GENII-S code is the median value of 5,073.5 hours/year. This value, which is representative of the mean
ANL-MGR-MD-00000I REV 01 / ICN 00
Table 5. Time (hours/year) spent in contaminated and uncontaminated areas based on three
30 November 2000

value of this receptor group's variability range (per Section 63.115(b)(4) of proposed 10 CFR 63,
Dyer 1999, p. 20) is not unduly biased by extreme habits because it is based on common
behaviors reported in USCB (1999) and reasonable assumptions about employment and
recreational behaviors.
The maximum estimate (6,353.5 hours/year) is a very conservative bounding value. It is based
on assumptions that a farmer would work outdoors 12 hours per day, 5 days a week, 52 weeks
per year and then spend more than 2 hours per day recreating outdoors. Therefore, it does not
account for time spent repairing equipment indoors, conducting business away from the farm,
illnesses, vacations, or other weekday activities that would occur indoors or away from the
farming community. This bounding value is higher than the values from two other recent Yucca
Mountain biosphere or performance assessment analyses. The NRC, in their Iterative
Performance Assessment Phase 2 (Wescott et al. 1995, p. 7-10), used a lower value by assuming
that farmers spent only 27% of their time outdoors (6.48 hours/day or 2,365 hours/year),
resulting in an inhalation exposure time of 5,563 hours/year. LaPlante and Poor (1997, p. 2-23)
assumed that time spent outdoors for a "resident farmer" who was employed outside of the
contaminated area (2,080 hours/year) would equal 100 hours/year in a garden and 1,700
additional hours outdoors. This scenario results in an inhalation exposure time of 4,200
hours/year (LaPlante and Poor 1997, p. 2-23).
6.2.2 Farmers and Other Outdoor Workers
The reasonable, conservative distribution of inhalation exposure time for the receptor group of
farmers and other outdoor workers has a uniform probability function, with a minimum value
based on the employment behavior of a salaried construction/farm worker (5,793.5 hours/year)
and a maximum based on the employment behavior of a farmer (6,353.5 hours/year). A uniform
distribution is recommended because there is no site-specific data to determine whether one set
of behaviors is more likely than others. All members of this receptor group are also assumed to
spend 827 hours/year outdoors tending a garden or engaging in other recreational activities in the
contaminated area.
The reasonably expected value to use in a deterministic run of the GENII-S code is the median of
6,073.5 hours/year. This value, which is the mean value of this receptor group's variability
range (per Section 63.115(b)(4) of proposed 10 CFR 63, Dyer 1999, p. 20) is not unduly biased
by extreme habits because it is based on reasonable assumptions about employment and
recreational behaviors.
The bounding value for this receptor group is 6,353.5 hours/year, based on the employment
behavior of a farmer.
6.3 CHRONIC BREATHING RATE
Estimates of chronic breathing rates were selected based on a literature review of the breathing
rates of adults. Only adults were considered because Section 63.115(b)(5) of proposed
regulations for 10 CFR 63 (Dyer 1999, p. 20) state that metabolic and physiological
considerations shall be consistent with present knowledge of adults.
November 2000ANL-MGR-MD-00000 I REV 01 / ICN 00 31

Several breathing rates have been used to assess exposure to airborne contaminants (reviewed in EPA 1997b, pp. 5-1 through 5-27). The following are examples of the range of values previously used.
" The EPA Exposure Factors Handbook recommends a value of 15.2 m3/day for an adult male, 19 to 65 years of age (reviewed in EPA 1997b, p. 5-24). However, EPA (1997b, p. 5-1) states that a value of 20 m3/day is used as the default value for the EPA Integrated Risk Information System.
"* ICRP (ICRP 1975, p. 346), uses a value of 23 m3/day for a 70-kg adult male. This value is based on eight hours each of resting, work, and nonoccupational activity.
"* ICRP (1975, p. 346) also identifies a value of 31 m3/day (i.e., 35% more than the 23 m3/day for an average lifestyle) for a 70-kg adult male that is engaged in more strenuous activities.
" Based on the information in ICRP (1975, pp. 346 and 347), an adult male engaging in moderate to heavy activity for 16 hours/day and resting for 8 hours/day would consume approximately 42 m3/day.
Chronic breathing rate was considered to have a fixed distribution because the GENII-S code treats this input as a fixed value. The ICRP value of 23 m3/day was selected as the reasonable, conservative estimate and as the reasonably expected value to use in a deterministic run of GENII-S. This value was selected primarily because it is based on a scenario that matches the behavioral characteristics of the critical group (per Section 63.115(b) of proposed 10 CFR 63, Dyer 1999, pp. 19 and 20). In addition, ICRP (1975) is considered the international standard for physical and physiological characteristics of "reference man."
The ICRP value of 31 m3/day was selected as the bounding value because it matches a likely extreme annual average for a farmer and is not unduly biased by extreme habits. The high value of 42 m3/day was considered an unreasonable annual average because it is doubtful that a person could sustain the level of activity required to maintain this high breathing rate.
Characteristics of the receptor group would not change as a result of a volcanic eruption or climate change; therefore, the values presented above can be used for analysis of nominal performance, a volcanic eruption, and climate change.
6.4 SOIL EXPOSURE TIME
The assumptions, scenarios, and much of the analyses for determining soil exposure time are the same as those for determining inhalation exposure time (see Section 6.2), and are not repeated here. The only difference between these parameters is that inhalation exposure time includes time spent indoors in a contaminated environment; soil exposure time does not. Thus, the values presented in Table 5 for time spent outdoors in a contaminated environment are equal to the soil exposure time.
The values presented in this section can be used for analysis of nominal performance, a volcanic eruption, and climate change because ash deposits (CRWMS M&O 2000f, Section 3.105.1) would not be deep enough to cause the receptor population to modify their behavior after the
ANL-MGR-MD-00000 I REV 01 / ICN 00 November 200032

eruption has stopped and because Section 63.115(b)(2) of proposed 10 CFR 63 (Dyer 1999, p.
19) states that changes over time in the behaviors and characteristics of the critical group should not be considered.
6.4.1 Amargosa Valley Residents
Based on the information presented in Section 6.2, the reasonable, conservative distribution of
soil exposure time for the receptor group of Amargosa Valley Residents is uniform with a minimum of 827.00 hours/year and maximum of 3947.0 hours/year. The reasonably expected
value to use in a deterministic run of GENII-S is the average of 2,387.0 hours/year. The
bounding value is the maximum of 3,947.0 hours/year.
6.4.2 Farmers and Other Outdoor Workers
The reasonable, conservative distribution for the receptor group of farmers and other outdoor workers is uniform with a minimum of 2,827.0 hours/year and maximum of 3947.0 hours/year. The reasonably expected value to use in a deterministic run of GENII-S is the median of 3,387.0 hours/year. The bounding value is the maximum of 3,947.0 hours/year.
6.5 HOME IRRIGATION RATE
The irrigation rate of turfgrass was calculated for this analysis. Turf was chosen because lawns are common in southern Nevada; turf requires year-round irrigation in this region; and turf has a
high water requirement relative to commercial crops, garden crops, and ornamental plants.
Therefore, rates based on turf irrigation requirements result in realistic and conservative estimates of external exposure that are based on the current, arid conditions in the Yucca
Mountain region and expected behaviors of the critical group. The data listed in Section 4.1.5
were used as inputs for temperature, solar radiation, precipitation, and crop coefficients.
Assumptions were developed for deep percolation (Section 5.5.1) and the bounding value (Section 5.5.2).
Irrigation rate of turfgrass at a location is influenced primarily by the type of grass grown and the
maintenance regime followed (Devitt et al. 1992, pp. 717 through 723); therefore, variation in
irrigation rates is a function of those factors. Two combinations of turf and maintenance regimes
were analyzed to develop a range of home irrigation rates that accounts for the uncertainty in turf
irrigation rate due to the variability in those factors. For a low estimate, irrigation rate was
calculated for warm-season bermudagrass overseeded with perennial ryegrass during winter and
grown in a low-maintenance (e.g., low rate of fertilizer application, low mowing frequency, high
mowing height) park setting, as described by Devitt et al. (1992, pp. 717 through 723). For a
high estimate, irrigation rate was calculated for cool-season tall fescue grass grown under a
relatively high-maintenance regime as described by Devitt et al. (1995b, pp. 47 through 63).
Irrigation requirements for low-maintenance bermudagrass and high-maintenance tall fescue
bound the reasonable, conservative range of irrigation rates for turfgrass in southern Nevada.
Bermudagrass is a commonly used, drought adapted turfgrass in southern Nevada (Morris and
Johnson 1991, p. 1). Although maintenance regimes resulting in lower irrigation rates often are
used in southern Nevada (e.g., no winter overseeding or irrigation, and allowing grass to die back
ANL-MGR-MD-000001 REV 01 / ICN 00 33 November 2000
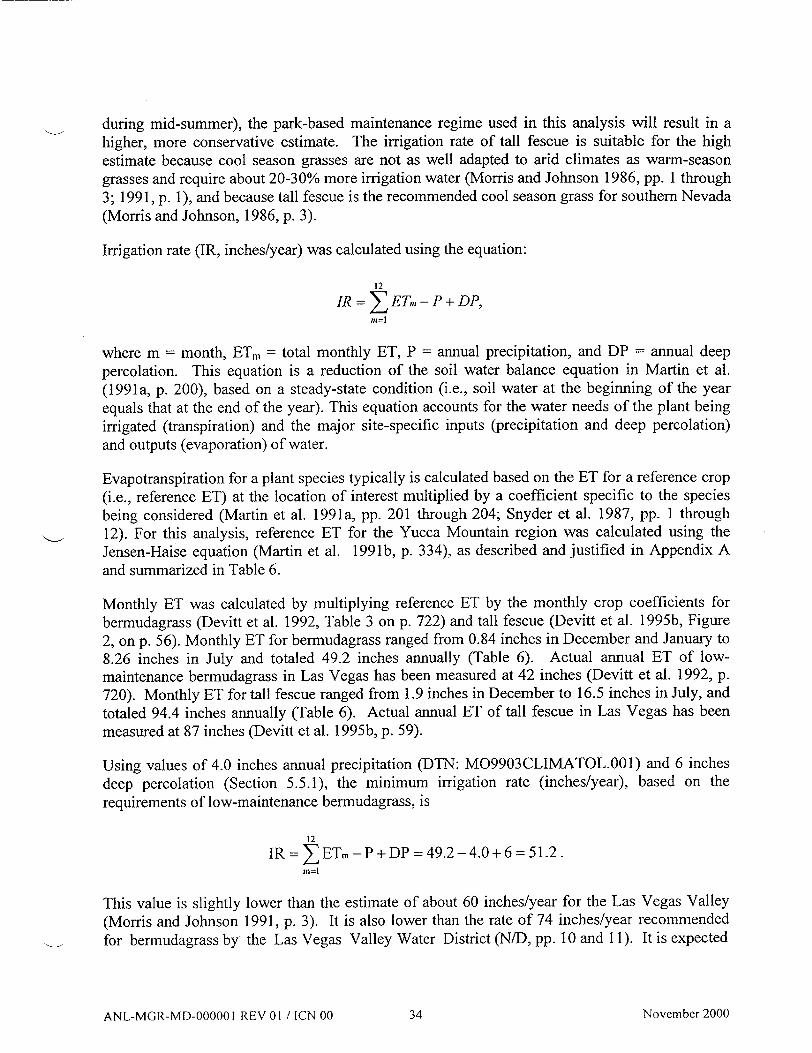
during mid-summer), the park-based maintenance regime used in this analysis will result in a higher, more conservative estimate. The irrigation rate of tall fescue is suitable for the high estimate because cool season grasses are not as well adapted to arid climates as warm-season grasses and require about 20-30% more irrigation water (Morris and Johnson 1986, pp. 1 through 3; 1991, p. 1), and because tall fescue is the recommended cool season grass for southern Nevada (Morris and Johnson, 1986, p. 3).
Irrigation rate (IR, inches/year) was calculated using the equation:
12
IR = Z ET,, - P + DP, P1=1
where m = month, ETm = total monthly ET, P = annual precipitation, and DP = annual deep percolation. This equation is a reduction of the soil water balance equation in Martin et al. (1991a, p. 200), based on a steady-state condition (i.e., soil water at the beginning of the year equals that at the end of the year). This equation accounts for the water needs of the plant being irrigated (transpiration) and the major site-specific inputs (precipitation and deep percolation) and outputs (evaporation) of water.
Evapotranspiration for a plant species typically is calculated based on the ET for a reference crop (i.e., reference ET) at the location of interest multiplied by a coefficient specific to the species being considered (Martin et al. 1991a, pp. 201 through 204; Snyder et al. 1987, pp. 1 through 12). For this analysis, reference ET for the Yucca Mountain region was calculated using the Jensen-Haise equation (Martin et al. 199 lb, p. 334), as described and justified in Appendix A and summarized in Table 6.
Monthly ET was calculated by multiplying reference ET by the monthly crop coefficients for bermudagrass (Devitt et al. 1992, Table 3 on p. 722) and tall fescue (Devitt et al. 1995b, Figure 2, on p. 56). Monthly ET for bermudagrass ranged from 0.84 inches in December and January to 8.26 inches in July and totaled 49.2 inches annually (Table 6). Actual annual ET of lowmaintenance bermudagrass in Las Vegas has been measured at 42 inches (Devitt et al. 1992, p. 720). Monthly ET for tall fescue ranged from 1.9 inches in December to 16.5 inches in July, and totaled 94.4 inches annually (Table 6). Actual annual ET of tall fescue in Las Vegas has been measured at 87 inches (Devitt et al. 1995b, p. 59).
Using values of 4.0 inches annual precipitation (DTN: MO9903CLIMATOL.001) and 6 inches deep percolation (Section 5.5.1), the minimum irrigation rate (inches/year), based on the requirements of low-maintenance bermudagrass, is
12
IR = ETm - P + DP = 49.2 -4.0+6 = 51.2. m=[
This value is slightly lower than the estimate of about 60 inches/year for the Las Vegas Valley (Morris and Johnson 1991, p. 3). It is also lower than the rate of 74 inches/year recommended for bermudagrass by the Las Vegas Valley Water District (N/D, pp. 10 and 11). It is expected
ANL-MGR-MD-000001 REV 01 / ICN 00 November 200034

( ( (
z ,r
0
0 0
m 0
z
Table 6. Average monthly temperature and solar radiation at YMP Site 9, monthly reference evapotranspiration (ETr), and monthly crop
coefficients and evapotranspiration for bermudagrass and tall fescue. Values presented are rounded. Calculations were done using more precise values from the original data sources.
Average Monthly Average Daily
Temperature Solar Radiation ET Crop Coefficient Evapotranspiration (inches)9
Month OCa OFb mj/m 2/daya langleys/dayc (inches)d Bermudagrasse Tall Fescuef Bermudagrass Tall Fescue
January 7.1 44.8 9.5 227.0 2.04 0.41 0.95 0.84 1.94
February 9.6 49.3 13.9 332.1 3.09 0.41 0.95 1.27 2.94
March 13.6 56.5 19.4 463.5 5.73 0.41 0.95 2.35 5.45
April 16.7 62.1 24.6 587.7 7.95 0.55 0.95 4.37 7.55
May 22.1 71.8 27.5 657.0 11.02 0.55 0.95 6.06 10.47
June 27.4 81.3 29.9 714.3 13.49 0.55 1.1 7.42 14.84
July 31.0 87.8 29.4 702.4 15.02 0.55 1.1 8.26 16.52
August 30.5 86.9 27.0 645.0 13.63 0.55 1.1 7.49 14.99
September 25.4 77.7 22.6 539.9 9.66 0.55 0.95 5.31 9.18
October 17.7 63.9 17.4 415.7 6.03 0.55 0.95 3.31 5.73
November 10.6 51.1 11.9 284.3 2.98 0.55 0.95 1.64 2.83
December 6.9 44.4 9.6 229.3 2.04 0.41 0.95 0.84 1.94
Annual Sum 92.69 49.17 94.37
a DTN: MO9903CLIMATOL.001.
b Converted as (9/5)0C+32.
0 1 megajoule/m2 = 23.89 langleys. d See Appendix A for details about the calculation of reference evapotranspiration.
e DTN: MO0001SPABCCO1.002, Devitt et al. (1992, Table 3 on p. 722).
SDTN: MO0001SPATFC01.003.
9 Evapotranspiration = ETr x crop coefficient.

that these published estimates are somewhat higher than the estimate calculated for this analysis because the published estimates are based on a high-maintenance regime. They also use a higher deep percolation rate (15% of annual irrigation = 9 or 13 inches, respectively) because of the high salinity of the Colorado River water used in Las Vegas (Las Vegas Valley Water District N/D, pp. 10 and 11). Thus, a rounded estimate of 51 inches/year based on site-specific information reasonably bounds the minimum turf irrigation rate for the Yucca Mountain region.
The maximum irrigation rate (inches/year), based on the requirements of tall fescue, is
12
IR Y ETm - P + DP = 94.4 - 4.0 + 6 = 96.4. m=l
This value is slightly higher than 91 inches/year recommended for tall fescue by the Las Vegas Valley Water District (N/D, pp. 12 and 13). Thus, 96 inches/year reasonably bounds the maximum turf irrigation rate for the Yucca Mountain region.A uniform probability function is
recommended for the reasonable, conservative distribution of home irrigation rate. The actual rate at which turfgrass is irrigated is dependent upon numerous decisions made by the residents, such as fertilization rates, frequency of mowing, and the efficiency of irrigation equipment. These choices are dependent upon the quality of grass residents desire and the amount of effort and money they are willing to expend on maintaining their lawn. Because the range of these choices is based on personal preference, and all choices are equally likely, a uniform distribution was selected.
Based on this analysis, the reasonable, conservative distribution of home irrigation rate has a
uniform probability distribution with a minimum of 51 inches/year and a maximum of 96
inches/year. The reasonably expected value to be used in a deterministic run of GENII-S is 74 inches/year, the midpoint between the minimum and maximum values. Based on the assumption in Section 5.5.2, the bounding value is 120 inches/year (25% greater than the maximum of the distribution).
Home irrigation rate would not change after a volcanic eruption; therefore, the values presented above are valid for the nominal performance and volcanic eruption analyses.
A change to a glacial-transition climate (USGS 2000, Section 6.6.2) would result in a decrease in
home irrigation rate. Evapotranspiration in Spokane, Washington (an analog site for those
climatic conditions, USGS 2000, Section 6.6.2) during April-September, the months that turf
would have to be irrigated, is 48 inches (DTN: GS00010001221.001), approximately half the
annual evapotranspiration rate at Yucca Mountain (Table 6). Therefore, home irrigation rate
with a cooler wetter climate would be approximately half required for current conditions. Based
on this, the distribution of home irrigation rate for a climate change analysis is uniform with a
minimum of 26 and a maximum of 48 inches/year. The reasonably expected value to be used in
a deterministic run of GENII-S is the median of 37 inches/year. Based on the assumption in Section 5.5.2, the bounding value is 60 inches/year.
ANL-MGR-MD-000001 REV 01 / ICN 00 November 200036

6.6 DURATION OF HOME IRRIGATION
For the reasons described in the analysis of home irrigation rate (Section 6.5), the irrigation
requirements of turfgrass were considered in this analysis. A literature review was conducted to
determine the irrigation requirements of turfgrass species.
The Las Vegas Valley Water District (N/D, pp. 10 through 13) and the University of Nevada
Cooperative Extension (Morris and Johnson 1991, pp. 3 and 4; Morris and Van Dam 1989, pp. 3
and 4) recommend that cool and warm season grasses be irrigated throughout the year in
southern Nevada.
Based on these recommendations, the reasonable, conservative distribution is a fixed value of 12
months. The reasonably expected and bounding values to be used in deterministic runs of
GENII-S also are the maximum possible value of 12 months.
Duration of home irrigation would not change after a volcanic eruption; therefore, the values
presented above are valid for the nominal performance and volcanic eruption analyses.
A change to a glacial-transition climate (USGS 2000, Section 6.6.2) would result in a decrease in
duration of home irrigation. Temperature and evapotranspiration in Spokane, Washington (an
analog site for those climatic conditions, USGS 2000, Section 6.6.2) is high enough to require
irrigation only during about mid-April to mid-October (DTN: GS00010001221.001); thus, duration of home irrigation rate for a climate change analysis is 6 months.
7. CONCLUSIONS
This analysis report documents the selection of the recommended reasonable, conservative
distribution; reasonably expected value; and bounding value for six parameters needed to
calculate biosphere dose conversion factors (Table 7). These recommended distributions and
values are based on present knowledge of the arid conditions of the Yucca Mountain region and
behaviors and characteristics of the critical group consistent with DOE guidance on NRC
proposed rules for 10 CFR 63 (Dyer 1999) and current conditions of that region.
The primary uncertainty associated with these recommendations is the definition and
characteristics of the reference biosphere and critical group, which are based on DOE guidance
on rules proposed by the NRC for 10 CFR 63 (Dyer 1999). If DOE guidance or the final NRC
rules differ substantially, revision of this analysis will have to be considered.
ANL-MGR-MD-000001 REV 01 / ICN 00 November 200037

Table 7. Recommended parameter values.a
Pathway Reasonably
Parameter Distribution Expected Valueb Bounding Value
Exposure from Inhalation
Mass Loading - Nominal Performance and Climate Change (grams/m3)
Normal: 0.1 percentile =3.8 x 10-, 1.05 x 10⁻⁴ 1.73 x 10⁻⁴ 99.9 percentile = 1.73 x 10⁻⁴
Mass Loading - Volcanic Eruption, Deep Ash Depths (grams/m3)c
Log uniform: min = 1.05 x 10⁻⁴, 8.64 x 10⁻⁴. 3.00 x 10⁻³
max = 3.00 x 10⁻³
Mass Loading - Volcanic Eruption, All Ash Depths (grams/m 3)d
Log uniform: min = 1.05 x 10⁻⁴, 3.60 x 10 8.64 x 10max = 8.64 x 10⁻⁴
Inhalation Exposure Time - Amargosa Valley Residents (hours/year) Uniform: min = 3,793.5, 5073.5 6,353.5 max = 6,353.5
Inhalation Exposure Time - Farmers and Other Outdoor Workers (hours/year) Uniform: min = 5,793.5, 6073.5 6,353.5 max = 6,353.5
Chronic Breathing Rate (m3/day) Fixed: 23 23 31
External Ground Exposure
Soil Exposure Time - Amargosa Valley Residents (hours/year) Uniform: min = 827, max = 3,947 2,387 3,947
Soil Exposure Time - Farmers and Other Outdoor Workers (hours/year) Uniform: min = 2,827, 3,387 3,947 max = 3,947
Home Irrigation Rate - Nominal Performance and Volcanic Eruption (inches/year)
Uniform: min = 51, max = 96 74 120
Home Irrigation Rate - Climate Change (inches/year)
Uniform: min = 26, max = 48 37 60
Duration of Home Irrigation - Nominal Performance and Volcanic Eruption (months/year) Fixed: 12 12 12
Duration of Home Irrigation - Climate Change (months/year) Fixed: 6 6 6
DTN: MO0010SPAAAM01.014
NOTES: a Values are recommended for analysis of nominal performance, volcanic eruption, and climate change, unless separate values are presented. Input values to be used in a deterministic run.
C Annual average, intended for use in analysis of deep ash depth scenario. d 10-year average, intended for use in analysis of all predicted ash depths.
ANL-MGR-MD-00000I REV 01 / ICN 00 November 200038

8. REFERENCES
8.1 DOCUMENTS CITED
Air Resources Board, California Environmental Protection Agency 1999. "California PM10 Monitoring Data Summaries (1988-1997)." [Sacramento, California]: Air Resources Board, California Environmental Protection Agency. Accessed 06/06/2000. TIC: 248167. http://www.arb.ca.gov/aqd/pm 10/pmgeosel.htm
Anspaugh, L.R.; Shinn, J.H.; Phelps, P.L.; and Kennedy, N.C. 1975. "Resuspension and Redistribution of Plutonium in Soils." Health Physics, 29, (4), 571-582. New York, New York: Pergamon Press. TIC: 248619.
Bernstein, R.S.; Baxter, P.J.; Falk, H.; Ing, R.; Foster, L.; and Frast, F. 1986. "Immediate Public Health Concerns and Actions in Volcanic Eruptions: Lessons from the Mount St. Helens Eruptions, May 18-October 18, 1980." Chapter 3 of Health Effects of Volcanoes: An Approach to Evaluating the Health Effects of an Environmental Hazard Buist, A.S. and Bernstein, R.S., eds. American Journal of Public Health, Volume 76, Supplement. Washington, D.C.: American Public Health Association. TIC: 246811.
Buck, A.L. 1982. "New Equations for Computing Vapor Pressure and Enhancement Factor." Journal of Applied Meteorology, 20, (12), 1527-1532. Boston, Massachusetts: American Meteorological Society. TIC: 239065.
Buist, A.S.; Martin, T.R.; Shore, J.H.; Butler, J.; and Lybarger, J.A. 1986. "The Development of a Multidisciplinary Plan for Evaluation of the Long-Term Health Effects of the Mount St. Helens Eruptions." Chapter 4 of Health Effects of Volcanoes: An Approach to Evaluating the Health Effects of an Environmental Hazard Buist, A.S. and Bernstein, R.S., eds. American Journal of Public Health, Volume 76, Supplement. Washington, D.C.: American Public Health Association. TIC: 246677.
Choudhury, A.H.; Gordian, M.E.; and Morris, S.S. 1997. "Associations Between Respiratory Illness and PM10 Air Pollution." Archives of Environmental Health, 52, (2), 113-117. [Washington, D.C.: Heldref Publications]. TIC: 248130.
CRWMS M&O [Civilian Radioactive Waste Management System Management and Operating Contractor] 1999a. Environmental Baseline File for Meteorology and Air Quality. BOOOOOOOO01717-5705-00126 REV 00. Las Vegas, Nevada: CRWMS M&O. ACC: MOL.19990302.0186
CRWMS M&O 1999b. Evaluation of Soils in the Northern Amargosa Valley. BOOOOOOOO01717-5705-00084. REV 00. Las Vegas, Nevada: CRWMS M&O. ACC: MOL. 19990224.0268.
CRWMS M&O 2000a. AP-3. IOQ Analysis Input Parameter Values for External and Inhalation Radiation Exposure Analysis. Development Plan TDP-MGR-MD-000001 REV 0 ICN 3. Las Vegas, Nevada: CRWMS M&O. ACC: MOL.20000710.0525.
ANL-MGR-MD-000001 REV 01 / ICN 00 November 200039

CRWMS M&O 2000c. Characterize Eruptive Processes at Yucca Mountain, Nevada. ANLMGR-GS-000002 REV 00. Las Vegas, Nevada: CRWMS M&O. ACC: MOL.20000517.0259.
CRWMS M&O 2000d. Environmental Sciences Biosphere/SR Support. Activity Evaluation, July
10, 2000. Las Vegas, Nevada: CRWMS M&O. ACC: MOL.20000731.0150.
CRWMS M&O 2000e. The Development of Information Catalogued in REVOO of the YMP FEP Database. TDR-WIS-MD-000003 REV 00. Las Vegas, Nevada: CRWMS M&O. ACC: MOL.20000705.0098.
CRWMS M&O 2000f. Total System Performance Assessment for the Site Recommendation. TDR-WIS-PA-000001 REV 00. Las Vegas, NV: CRWMS M&O. ACC: MOL.20001005.0282.
Dahneke, B. 1975. "Resuspension of Particles." Journal of Colloid and Interface Science, 50, (1), 194-196. Orlando, Florida: Academic Press. TIC: 224931.
Devitt, D.A.; Morris, R.L.; and Bowman, D.C. 1992. "Evapotransportation, Crop Coefficients, and Leaching Fractions of Irrigated Desert Turfgrass Systems." Agronomy Journal, 84, (4), 717723. Madison, Wisconsin: American Society of Agronomy. TIC: 244677.
Devitt, D.A.; Kopec, D.; Robey, M.J.; Morris, R.L.; Brown, P.; Gibeault, V.A.; and Bowman,
D.C. 1995a. "Applied Turfgrass Science, Climatic Assessment of the Arid Southwestern United States for Use in Predicting Evapotranspiration of Turfgrass." Journal of Turfgrass Management,
"1, (2), 65-8 1. Binghamton, New York: Haworth Press. TIC: 245203.
Devitt, D.A.; Neuman, D.S.; Bowman, D.C.; and Morris, R.L. 1995b. "Comparative Water Use
of Turfgrasses and Ornamental Trees in an Arid Environment." Journal of Turfgrass Management, 1, (2), 47-63. Binghamton, New York: Haworth Press. TIC: 244814.
Dockery, D. and Pope, A. 1996. "Epidemiology of Acute Health Effects: Summary of TimeSeries Studies." Chapter 6 of Particles in Our Air: Concentrations and Health Effects. Wilson, R., and Spengler, J.D., eds. [Cambridge, Massachusetts]: Harvard School of Public Health, Harvard University. TIC: 248127.
DOE (U.S. Department of Energy) 2000. Quality Assurance Requirements and Description. DOE/RW-0333P, Rev. 9. Washington, D.C.: U.S. Department of Energy, Office of Civilian Radioactive Waste Management. ACC: MOL. 19991028.0012.
Donahue, R.L.; Miller, R.W.; and Shickluna, J.C. 1977. Soils: An Introduction to Soils and
Plant Growth. 4 th edition. Englewood Cliffs, New Jersey: Prentice Hall. TIC: 242506.
Dyer, J.R. 1999. "Revised Interim Guidance Pending Issuance of New U.S. Nuclear Regulatory Commission (NRC) Regulations (Revision 01, July 22, 1999), for Yucca Mountain, Nevada." Letter from J.R. Dyer (DOE/YMSCO) to D.R. Wilkins (CRWMS M&O), September 3, 1999, OL&RC:SB-1714, with enclosure, "Interim Guidance Pending Issuance of New NRC Regulations for Yucca Mountain (Revision 01)." ACC: MOL.19990910.0079.
ANL-MGR-MD-000001 REV 01 / ICN 00 Novemnber 200040

EPA (U.S. Environmental Protection Agency) 1994. Measuring Air Quality: The Pollutant Standards Index. EPA 451/K-94-001. [Washington, D.C.]: U.S. Environmental Protection Agency. TIC: 248508.
EPA 1997a. "Activity Factors." Volume 3 of Exposure Factors Handbook. EPA/600/P95/002Fc. Washington, D.C.: U.S. Environmental Protection Agency. TIC: 241062.
EPA 1997b. "General Factors." Volume 1 of Exposure Factors Handbook EPA/600/P95/002Fa. Washington, D.C.: U.S. Environmental Protection Agency. TIC: 241060.
EPA 2000. "AIRSData, Monitor All Columns Report, United States Air Quality Monitors for Particulate Matter (All Years)." Research Triangle Park, North Carolina: U.S. Environmental Protection Agency, Office of Air Quality Planning and Standards. Accessed 6/16/2000. TIC: 248091. http://www.epa.gov/airsdata/moncols.htm
Garger, E.K.; Hoffman, F.O.; and Thiessen, K.M. 1997. "Uncertainty of the Long-Term Resuspension Factor." Atmospheric Environment, 31, (11), 1647-1656. Oxford, United Kingdom: Elsevier Science. TIC: 246785.
ICRP (International Commission on Radiological Protection) 1975. Report of the Task Group on Reference Man: A Report Prepared by a Task Group of Committee 2 of the International Commission on Radiological Protection. ICRP Number 23. Tarrytown, New York: Elsevier Science. TIC: 237218.
IAEA (International Atomic Energy Agency) 1982. Generic Models and Parameters for Assessing the Environmental Transfer of Radionuclides from Routine Releases -- Exposures of Critical Group. IAEA SS-57. Vienna, Austria: International Atomic Energy Agency. TIC: 232649.
IAEA (International Atomic Energy Agency) 1992. Modelling of Resuspension, Seasonality and Losses During Food Processing. First Report of the VAMP Terrestrial Working Group. IAEATECDOC-647. Vienna, Austria: International Atomic Energy Agency. TIC: 243498.
LaPlante, P.A.; Maheras, S.J.; and Jarzemba, M.S. 1995. Initial Analysis of Selected Site-Specific Dose Assessment Parameters and Exposure Pathways Applicable to a Groundwater Release Scenario at Yucca Mountain. CNWRA 95-018. San Antonio, Texas: Center for Nuclear Waste Regulatory Analyses. ACC: MOL. 19981014.0140.
LaPlante, P.A.; and Poor; K. 1997. Information and Analyses to Support Selection of Critical Groups and Reference Biospheres for Yucca Mountain Exposure Scenarios. CNWRA 97-009. San Antonio, Texas: Center for Nuclear Waste Regulatory Analyses. TIC: 236454.
Las Vegas Valley Water District N/D. The All Seeing All Knowing Desert Lawn Care Manual. Las Vegas, Nevada: Las Vegas Valley Water District. TIC: 244376.
ANL-MGR-MD-00000I REV 01 / ICN 00 November 200041

Leigh, C.D.; Thompson, B.M.; Campbell, J.E.; Longsine, D.E., Kennedy, R.A.; and Napier, B.A. 1993. User's Guide for GENII-S. A Code for Statistical and Deterministic Simulations of Radiation Doses to Humans From Radionuclides in the Environment. SAND91-0561. Albuquerque, New Mexico: Sandia National Laboratories. TIC: 231133.
LeStrange, S.L. 1998. Contact Report: Discussion of the Calculations of Evapotranspiration that Mr. McCurdy did for the Yucca Mountain Project. Telephone conversation from Susan LeStrange (SAIC) to G.D. McCurdy (Western Regional Climate Center), February 11, 1998, with attachments. ACC: MOL. 19990323.0175.
Martin D.L.; Gilley, J.R.; and Skaggs, R.W. 1991a. "Soil Water Balance and Management" Managing Nitrogen for Groundwater Quality and Farm Profitability, Proceedings of a Symposium Sponsored By Division A-5 of the American Society of Agronomy, Anaheim, California, 1988. Follett, R.F.; Keeney, D.R.; and Cruse, R.M., eds. 199-235. Madison, Wisconsin: Soil Science Society of America. TIC: 243453.
Martin D.L.; Gilley, J.R.; and Skaggs, R.W. 1991b. "Appendix II: Evapotranspiration Equations." Managing Nitrogen for Groundwater Quality and Farm Profitability, Proceedings of a Symposium Sponsored By Division A-5 of the American Society of Agronomy, Anaheim, California, 1988. Follett, R.F.; Keeney, D.R.; and Cruse, R.M., eds. 333-338. Madison, Wisconsin: Soil Science Society of America. TIC: 238376.
McKague, H.L. 1998. "Transmittal of Administrative Item, Summary of CNWRA Workshop on the Consequences of Volcanic Activity (Al 20-1402-461-831)." Letter from H.L. McKague (CNWRA) to J. Trapp (NRC), August 17, 1998, NRC-02-97-009, with enclosures. ACC: MOL.19981106.0154; MOL.19981106.0155; MOL.19981106.0156; MOL.19981106.0157.
McKinley, P.W.; Long, M.P; and Benson, L.V. 1991. Chemical Analyses of Water from Selected Wells and Springs in the Yucca Mountain Area, Nevada and Southeastern California. Open-File Report 90-355. Denver, Colorado: U.S. Geological Survey. ACC: NNA. 19901031.0004.
Morris, B. 1997. "Table 3. Mean Monthly Crop Coefficients (Kc) and Uniformity Coefficients (U.C.) for the Two Golf Course Sites Combined Versus the Park Site and Final Kc Monthly Groupings for the Golf Courses and Park Site Based on Maximizing the Uniformity Coefficent (U.C.)" and "Monthly Pet Values for Las Vegas, 1988, 1990-1992." Fax transmittal from B. Morris (UNR) to S. LeStrange, July 28, 1997. ACC: MOL.19990629.0319.
Morris, B. and Johnson, W. 1986. Grass Selection for the Urban Mojave Desert Landscape. Fact Sheet 86-72. Reno, Nevada: University of Nevada, Cooperative Extension. TIC: 244377.
Morris, B. and Johnson, W. 1991. Maintaining Hybrid Bermudagrassfor Urban Mojave Desert Landscapes. Fact Sheet 91-24. Reno, Nevada: University of Nevada, Cooperative Extension. TIC: 244378.
ANL-MGR-MD-000001 REV 01 / ICN 00 42 November 2000

Morris, B. and Van Dam, J. 1989. Maintaining Tall Fescue Turfgrass in Urban Mojave Desert Landscapes. Fact Sheet 89-25. Reno, Nevada: University of Nevada, Cooperative Extension. TIC: 244506.
Napier, B.A.; Peloquin, R.A.; Strenge, D.L.; and Ramsdell, J.V. 1988. Conceptual Representation. Volume I of GENII - The Hanford Environmental Radiation Dosimetry Software System. PNL-6584. Richland, Washington, Pacific Northwest Laboratory. TIC: 206898.
NRC (U.S. Nuclear Regulatory Commission) 1999. "Issue Resoultion Status Report Key Technical Issue: Igneous Activity." Revision 2. Washington, D.C.: U.S. Nuclear Regulatory Commission. Accessed September 18, 2000. TIC: 247987. http://www.nrc.gov/NMSS/DWM/iarev2.htm
NRC 2000. Issue Resolution Status Report Key Technical Issue: Total System Performance Assessment and Integration. Rev. 2. Washington, D.C.: U.S. Nuclear Regulatory Commission. TIC: 247614.
Rautenstrauch, K. 2000. "Phone Contacts, California Air Pollution Control Districts." Interoffice correspondence from K. Rautenstrauch (CRWMS M&O) to R. Green, June 19, 2000, LV.ESD.KRR.06/2000-024. ACC: MOL.20000622.0158.
Regulatory Guide 1.109, Rev. 1. 1977. Calculation of Annual Doses to Man from Routine "Releases of Reactor Effluents for the Purpose of Evaluating Compliance with 10 CFR Part 50, Appendix I. Washington, D.C.: U.S. Nuclear Regulatory Commission. Readily Available.
Snyder, R.L.; Lanini, B.J.; Shaw, D.A.;- and Pruitt, W.O. 1987. Using Reference Evapotranspiration (ETo) and Crop Coefficients to Estimate Crop Evapotranspiration (Etc) for Agronomic Crops, Grasses, and Vegetable Crops. Leaflet 21427. Oakland, California: University of California Cooperative Extension, Division of Agriculture and Natural Resources. TIC: 243488.
Till, J.E. and Meyer, H.R. 1983. Radiological Assessment, A Textbook on Environmental Dose Analysis. NUREG/CR-3332. Washington, D.C.: U.S. Nuclear Regulatory Commission. TIC: 223809.
USCB [U.S. Census Bureau] 1999. "1990 US Census Data, Database: C90STF3A, Summary Level: State--County--County Subdivision, Amargosa Valley Division: FIPS.STATE=32, FIPS.COUNTY90=023, FIPS.COUSUB=94028." Washington, D.C.: U.S. Census Bureau. Accessed November 12, 1999. TIC: 245829. http://venus.census.gov/cdrom/lookup
USGS (U.S. Geological Survey) 2000. Future Climate Analysis. ANL-NBS-GS-000008 REV 00. Denver, Colorado: U.S. Geological Survey. ACC: MOL.20000629.0907.
Wescott, R.G.; Lee, M.P.; Eisenberg, N.A.; McCartin, T.J.; and Baca, R.G., eds. 1995. NRC Iterative Performance Assessment Phase 2: Development of Capabilities for Review of a
ANL-MGR-MD-000001 REV 01 / ICN 00 November 200043

Performance Assessment for a High-Level Waste Repository. NUREG-1464. Washington, D.C.: U.S. Nuclear Regulatory Commission. TIC: 221527.
8.2 CODES, STANDARDS, AND REGULATIONS
40 CFR 50.7. 1999. National Primary and Secondary Ambient Air Quality Standards for Particulate Matter. Readily available.
64 FR 8640. Disposal of High-Level Radioactive Wastes in a Proposed Geologic Repository at Yucca Mountain, Nevada. Proposed rule 10 CFR 63. Readily available.
8.3 PROCEDURES
AP-2. IQ, REV 1 ICN 0, Indoctrination and Training of Personnel
AP-2.2Q, REV 0 ICN 0, Establishment and Verification of Required Education and Experience of Personnel
AP-2.16Q, REV 0 ICN 0, Activity Evaluation
AP-3.10Q, REV 2 ICN 3, Analyses and Models
AP-3.15Q, REV 1 ICN 2, Managing Technical Product Inputs
AP-SIII.3Q, REV 0 ICN 3, Submittal and Incorporation of Data to the Technical Data Management System.
NLP-2-0, REV 5 ICN 1, Determination of Importance Evaluations
QAP-2-3, REV 10 ICN 0, Classification of Permanent Items
8.4 SOURCE DATA
GSOOO 100001221.001. EarthInfo, Inc. Western US Meteorologic Station Weather Data - NCDC Summary of Day (West 1) and NCDC Summary of Day (West 2). Submittal date: 01/25/2000.
MOOOO1SPABCCO1.002. Bermudagrass Crop Coefficient. Submittal date: 1/18/2000.
MOOOO 1 SPACBRO 1.004. Chronic Breathing Rate. Submittal date: 1/18/2000.
MOOOO1SPATFCO1.003. Tall Fescue Crop Coefficient. Submittal date: 1/18/2000.
MO0007SPAAPMOO.012. Air Particulate Matter Concentrations (PM10), United States. Submittal date: 07/19/2000. Submit to RPC
M00008SPATSPOO.013. Total Suspended Particle Concentrations-Washington 1979-1982. Submittal date: 2000/08/02.
ANL-MGR-MD-000001 REV 01 / ICN 00 44 November 2000

MO98PSDALOGI 11.000. Particulate Sampler Data Records and Filter Weight Logs, Oct. - Dec. 97. Submittal date: 01/29/1998.
MO9903CLIMATOL.001. Climatalogical Tables from 1986-1997 Meteorological Data from Site 1 through Site 9 EFPD Meteorological Sites. Submittal date: 03/23/1999.
M0991 1ANLMGRMD.000. Duration of Home Irrigation - Bermuda Grass. Submittal date: 11/29/1999.
M09911ANLMGRMD.001. Duration of Home Irrigation - Tall Fescue. Submittal date: 11/29/1999.
M0991 1ANLMGRMD.003. Selected 1990 Census Data - Amargosa Valley Subdivision, Nye County, Nevada. Submittal date: 11/29/1999.
TM000000000001.039. Particulate Matter Air Quality Data - January 1992 through September 1992. Submittal date: 07/27/1993.
TM000000000001.041. Particulate Air Quality Data Forms, January thru June 1991. Submittal date: 07/27/1993.
TM000000000001.042. Particulate Air Quality Forms, July thru September 1991. Submittal date: 01/23/1992.
TM000000000001.043. Particulate Air Quality Forms, October thru December 1991. Submittal date: 03/09/1992.
TM000000000001.079. Particulate Sampler Data Records and Filter Weight Logs for 1992 through 1995. Submittal date: 03/11/1996.
TM000000000001.082. Particulate Air Quality Data Forms, April 1989 thru December 1990. Submittal date: 03/12/1996.
TM000000000001.084. Particulate Sampler Data Records and Filter Weight Logs, January March 1996. Submittal date: 05/07/1996.
TM000000000001.096. Particulate Sampler Data Records and Filter Weight Logs, April - June 1996. Submittal date: 01/18/1997.
TM000000000001.097. Particulate Sampler Data Records and Filter Weight Logs, July September 1996. Submittal date: 04/18/1997.
TM000000000001.098. Particulate Sampler Data Records and Filter Weight Logs, October December 1996. Submittal date: 04/18/1997.
TM000000000001.099. Particulate Sampler Data Records and Filter Weight Logs, January March 1997. Submittal date: 04/18/1997.
ANL-MGR-MD-00000I REV 01 / ICN 00 November 200045

TMOOOOOOOOOOO1.105. Particulate Sampler Data Records and Filter Weight Logs, April - June 1997. Submittal date: 07/21/1997.
TM000000000001.108. Particulate Sampler Data Records and Filter Weight Logs, July
September 1997. Submittal date: 10/22/1997.
8.5 DEVELOPED DATA
M0010SPAAAM01.014. Input Parameter Values for External and Inhalation Radiation Exposure Analysis. Submittal date: 10/02/2000.
ANL-MGR-MD-000001 REV 01 / ICN 00 November 200046

APPENDIX A
CALCULATION OF REFERENCE EVAPOTRANSPIRATION (ETR)
AND JUSTIFICATION OF THE SELECTED EQUATION.
ANL-MGR-MD-00000I REV 01 / ICN 00 November 200047

APPENDIX A. CALCULATION OF REFERENCE EVAPOTRANSPIRATION (ETR) AND JUSTIFICATION OF THE SELECTED EQUATION.
Calculation
Monthly reference evapotranspiration was calculated using the Jensen-Haise equation (Martin et al. 1991b, p. 334):
ETr - CT(T - Tx)R5 days 1486
where:
CT= 1/(Cl + C 2CH) = 1/{58.10 + 13(1.11)) = 0.014
C1 = 68 - 3.6(elevation in feet)/1,000 = 68 - 3.6(2,750)/1,000 = 58.10
C2 = 13, 'F (a constant)
CH = 50/(e 2 - el), mbars = 50/(70.74 - 25.63) = 1.11
T;= 27.5 - 0.25(e 2 - el) - elevation/I,000 = 27.5 - 0.25(70.74 - 25.63) - 2,750/1,000 =
13.47
e2= saturated vapor pressure (mbars) at the mean maximum air temperature for the hottest month (39.2°C; DTN: MO9903CLIMATOL.001). Calculated using the following equation from Buck (1982, p. 1532):
es 6.1 121 exp( 1 02( J}C - 6.1121{exp(2.45)} : 70.74
el= Saturated vapor pressure (mbars) at the mean minimum air temperature for the hottest month (21.5'C; DTN: MO9903CLIMATOL.001). Calculated using the following equation from Buck (1982, p. 1532):
es = 6.1121 exp 17.502(=C) 4 6.1121{exp(1.43)} = 25.63 ( (240.97 + 'C
R= Incoming solar radiation, langleys/day (See Table 6)
T = Average monthly air temperature, 'F (See Table 6)
days = number of days per month
Example: (average monthly temperature and solar radiation are from Table 3)
January ETr (inches) =
ET, = 0.014(44.8 -13.47)227 31 = 2.04. 1486
ANL-MGR-MD-000001 REV 01 / ICN 00 November 200048

Justification of Jensen-Haise Equation:
The Jensen-Haise equation was chosen for the calculation of reference ET because it is relatively simple to use and is generally reliable for calculating ET over long periods (e.g., weekly) in arid climates using the type of climate data available for the Amargosa Valley region (Martin et al. 1991b, p. 334). This equation accounts for local temperature and solar radiation. However, it does not incorporate the effects of wind, as do more complicated methods such as the modified Penman equation (Martin et al. 1991b, pp. 334 through 336). Devitt et al. (1995a, pp. 75 through 81) demonstrated that high wind runs can influence calculations of ET in the southwestern United States.
To ensure that the Jensen-Haise equation did not underestimate reference ET, the results calculated for this analysis (Table 6) were compared to two unpublished estimates of ET for southern Nevada that used the modified-Penman equation (Figure A-i). The first was calculated from nine years (1986-1994) of climate data from Pahrump, Nevada (LeStrange 1998). The second was based on four years of data (1988, 1990-1992) from Las Vegas (Morris 1997). High and low estimates were considered for Las Vegas.
The Jensen-Haise equation resulted in values that were about 1 inch lower than the modifiedPenman estimates during November-January, but as much as 4 inches higher during June-August (Figure A-i). Annual reference ET calculated for the Yucca Mountain region, (92.7 inches, Table 6) was higher than that calculated for Pahrump (84.8 inches) and near the high end of the range of values calculated for Las Vegas (84.1-96.7 inches). It is expected that ET for the Yucca Mountain region would be slightly lower than the maximum for Las Vegas because the weather data used to calculate ET for Yucca Mountain (838 m; CRWMS M&O 1999a, Table 1-1 on p. 6) came from a site about 180 m higher than the elevation in Las Vegas (659 m; Devitt et al. 1995a, Table 1 on p. 68). The monthly ET values calculated for the Yucca Mountain region using the Jensen-Haise equation also are within the range or higher than those reported for other locations in the southwestern U.S. (Devitt et al. 1992, Table 2 on p. 719; Snyder et al. 1987, Figure 1 on p. 3; Devitt et al. 1995a, Figure 3 on p. 77). Therefore, the results of the Jensen-Haise equation used in this analysis are valid, conservative estimates of monthly reference ET for the reference biosphere.
ANL-MGR-MD-000001 REV 01 / ICN 00 November 200049

16 T
14,
12.
10.
U- 8-
64-
4+
2
0
e Lathrop Wells
- -0- Pahrump
- - * - - Las Vegas low
- -Las Vegas high
Jan Feb Mar Apr May Jun Jul Aug Sep Oct Nov Dec
Month
Figure A-1. Reference evapotranspiration (in inches) estimated at the proposed location of the critical
group (labeled as "Lathrop Wells" in this figure) and measured in Pahrump (LeStrange 1998) and Las
Vegas. (Morris 1997).
November 2000ANL-MGR-MD-000001 REV 01 / ICN 00 50

APPENDIX B
CONFIRMATION OF A DEEP PERCOLATION VALUE
ANL-MGR-MD-000001 REV 01 / ICN 00 November 200051

APPENDIX B. CONFIRMATION OF A DEEP PERCOLATION VALUE
Two equations were used to confirm the validity of a default deep percolation value of 6 inches. These equations use the same data on salt tolerance of crops, but use different methods to determine the leaching requirement (LR), which is the minimum fraction of the total applied water that must pass through the root zone to prevent a reduction in crop yield due to salt accumulation. These calculations were done only for tall fescue, which is less salt tolerant than bermudagrass (Martin et al. 1991a, Table 10-10 on p. 223), and therefore requires a higher level of percolation.
Equation 1. Martin et al. (199 1a, pp. 224 through 226) present a method for approximating LR and using an iterative calculation to determine the total annual irrigation depth required to maintain an appropriate salt balance. Iteration is required because one of the inputs, irrigation depth, is not known. Known values for this equation are:
ETc = evapotranspiration for tall fescue = 85 inches (Table 6)
P = Precipitation = 4.0 inches (DTN: MO9903CLIMATOL.001).
EQ = Electrical conductivity of irrigation water = 0.51 dS/m. Calculated as the average conductivity of water from 31 irrigation or domestic wells (Table B-i) located in the village of Amargosa Valley (formerly Lathrop Wells) or west of State Route 373 and south of Highway 95 in Amargosa Valley (McKinley et al. 1991, pp. 9 through 17). These data are skewed somewhat toward low values; only 9 of the 31 measurements are above the mean. These nine wells are at least 9 km from the intersection of State Route 373 and U.S. Highway 95 and the eight most saline wells are more than 16 km south or southwest of that intersection. These most saline wells are located near the Nevada-California border where the water table is much shallower. Thus, the mean of 0.51 dS/m is a reasonable conservative (i.e., high) estimate of salinity expected within the region being evaluated for the reference group.
ECt = electrical conductivity at salt tolerance threshold = 3.9 dS/m (Martin et al. 1991a, Table 10-10 on p. 223). This is the salinity of irrigation water at which the productivity of tall fescue begins to be affected.
Determination of deep percolation requires the following steps:
1. Calculate the ratio of the electrical conductivity at the salt tolerance threshold to the electrical conductivity of irrigation water: ECt:EC1 = 3.9 dS/m + 0.51 dS/m = 7.65
2. Determine the LR using Figure 10-13 of Martin et al. (1991a, p. 225) =0.05 (Figure 10-13 shows Lr reaching a lower asymptote of about 0.05 at ratios greater than about 3.5).
3. Calculate annual depth (in inches) of irrigation water (Ii) required to prevent a decrease in production:
ET. 85 Ii = - P = 1- 4.0 = 85.5, 1 - L 1 -0.05
ANL-MGR-MD-000001 REV 01 / ICN 00 November 200052

4. Calculate the electrical conductivity of applied water (ECw) (i.e., diluted by rainfall):
ECw - EC1Ii 0.51(85.5) 0.49. Ii + R. 85.5+4.0
5. Determine a new LR based on the ratio of electrical conductivity at the salt tolerance threshold to the electrical conductivity of applied water: ECt:ECw (3.9/0.49 = 8.01). From Figure 10-13 of McKinley et al. (1991), LR =0.05.
6. If necessary, recalculate Ii based on the new LR. Because LR does not change at such high ratios, this step and additional iteration is not necessary. Annual depth of irrigation water required to prevent a decrease in production is 85.5 inches.
Thus, the amount of water required for deep percolation in addition to the 85 inches needed for evapotranspiration is 0.4 inches (85.5 - ETc.).
Equation 2. Donahue et al. (1977, pp. 271 through 273) present an equation for LR that is based on the amount of water needed for leaching salts that is in addition to that needed to wet the root zone. For this equation to be used with the data available, one must assume that irrigation is sufficiently applied so that the entire root zone is wetted. Although this assumption may not always be met, completely wetting the root zone is the most efficient method for irrigating; thus, it is valid to assume that this assumption usually will be met.
This equation requires two inputs.
EQ = Electrical conductivity of irrigation water = 0.51 dS/m (Table B-i).
ECdw = Electrical conductivity causing a 50 percent decrease in yield = 13.33 dS/m. Calculated as yield reduction threshold + (50/yield reduction per unit of salinity increase) = 3.9 dS/m + (50 ÷5.3 dS/m) = 13.3 dS/m. Yield reduction values for tall fescue are from Table 10-10 of Martin et al. (1991a, p. 223).
LR is calculated as: EQi 0.5 ldS /m
LR = - = 0.038 ECdw 13.33dS/m
This value is similar to that approximated above using Martin et al (1991a, Figure 10-10).
The LR is then multiplied by the total amount of water applied via irrigation (0.038 x 85 inches) to obtain a deep percolation value of 3.3 inches.
This value is slightly higher than that obtained above using the equation of Martin et al. (1991 a, pp. 224 through 226) because Martin et al. (1991 a, pp. 224 through 226) account for the addition of salt-free precipitation (in step 3). However, both values are substantially below the default value of 6 inches. Thus, 6 inches is a valid assumption that is consistent with the conditions of Yucca Mountain the region.
ANL-MGR-MD-00000 1 REV 01 / ICN 00 November 200053

Table B-1. Electrical conductivity of 31 wells in Amargosa Valley located in the village of Amargosa Valley (formerly Lathrop Wells) or south and west of the intersection of U.S. Highway 95 and State Route 373 (McKinley et al. 1991, pp. 9 through 17).
Notes: a Distance from the intersection of U.S. Highway 95 and State Route 373 to the well. b Converted from gS/cm (units used by McKinley et al. 1991, pp. 14 through 17) to dS/m using the
equation dS/m = 0.001(gS/cm).
ANL-MGR-MD-00000I REV 01 / ICN 00 54 November 2000
Site Number
37
34
35
36
63
57
60 58
61
59 65 66 53
54
44
43
51
55 77
76
73
56
47
75
42
78
74
39
72
40
89
Average
Distance (km)a
0.09
3.59
4.33
4.87
9.01
9.13
9.73
9.79
9.84
10.18
12.95
13.36
13.86
15.10
15.44
15.96
16.04
16.33
16.77
17.17
17.87
18.03
18.54
18.73 18.74
18.88
18.90
20.04
20.27
20.71
25.60
Electrical Conductivity (dS/m)b
0.49
0.34
0.33
0.34
0.65
0.30
0.43
0.31
0.37
0.32
0.30
0.31
0.32
0.33
0.34
0.37
0.35
0.34
0.80
0.38
0.31
0.83
1.07
0.29
0.95
0.28
0.35
0.98
1.29
0.96
0.70
0.51