anitha swaminathan it architect, computer centre, … · ready-to go templates and best-practices...
TRANSCRIPT

-Anitha SwaminathanIT Architect, Computer Centre, NUS
22nd April 2010

BI for Decision Making
Identify Symptoms
Identify Major Issues
Identify Major
Drivers
Determine Actions
Categorize Actions
Business Intelligence support for decision making
Attack & eliminate
Issues .

Issues & Concerns for Management
Where is my information - I find data sheets all over my place !!
Should I be mining on my reports for making critical decisions ?
Should I be looking into several systems for making my decisions
Why is there a talk about programming every time I ask for a change in report ?
Can I have all my reports and KPIs from a single screen ?
Should I continue using Excel ?

The Value of BI
CompletenessEnd-to-end BI solution incorporating data warehousing, OLAP, data mining, business intelligence tools and pre-defined business content.
OpennessAllows to incorporate data from heterogeneous systems.
Business OrientationIntegrates business processes. Provides a centralized metadata repository with a consistent business semantic. Ready-to go templates and best-practices – horizontal and vertical business content.
Actionable InformationSupports decision-making requirements of every user.

To have ONE version of official information
Vision
1. To build a Data Warehouse to hold integrated institutional information needed for decision making and monitoring purposes.
2. To have a Data Management Policy to manage institutional data to ensure data reliability, accuracy, security and accessibility.
Mission
Vision and Mission
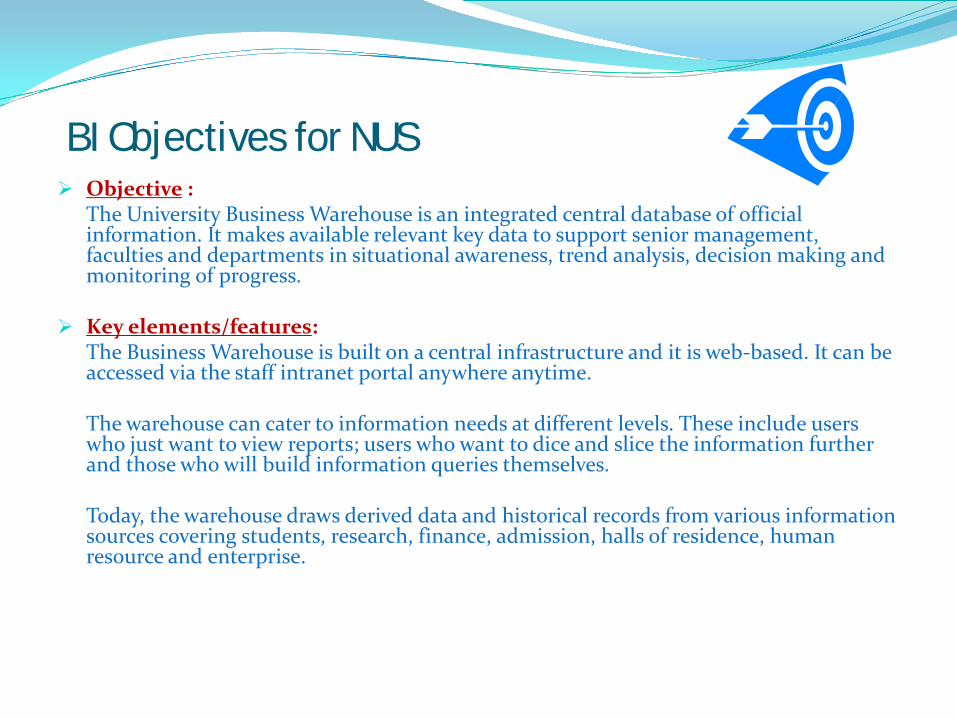
BI Objectives for NUS Objective :
The University Business Warehouse is an integrated central database of official information. It makes available relevant key data to support senior management, faculties and departments in situational awareness, trend analysis, decision making and monitoring of progress.
Key elements/features:The Business Warehouse is built on a central infrastructure and it is web-based. It can be accessed via the staff intranet portal anywhere anytime.
The warehouse can cater to information needs at different levels. These include users who just want to view reports; users who want to dice and slice the information further and those who will build information queries themselves.
Today, the warehouse draws derived data and historical records from various information sources covering students, research, finance, admission, halls of residence, human resource and enterprise.

Key Areas addressed with BIOpenness
• DB Connect – directly access data to relational database tables and OLAP systems• Support of industry standards (e.g. XML, XML for Analysis, JDBC etc.)
Integration• Integration of applications allowing cross-enterprise analytics and closed-loop scenarios• Integration into the Enterprise Portal as single point of entry • Integration of unstructured information such as documents, files, etc.
Web Offering• Interactive analysis of information via web and mobile devices • Intuitive design of web applications• Ad-hoc query design via the web
Advanced Reporting & Analysis• Multidimensional reporting
Consolidation of information Improve OLTP Performance- Relief for reporting from R/3-System

View #1
’04 ‘05 ‘06
Academic Year
Singaporean
Sing PR
Engineering
Bussiness admScience
Forigner
Headcount
Faculty
Nationality
Headcount
EngineeringScience
Bussiness AdminOverall result
200424
102 76202
HC200543
114 92249
HC200664
149 98311
HC
Report:Student Headcount according to Faculty and academic year
Multi-dimensional Reporting
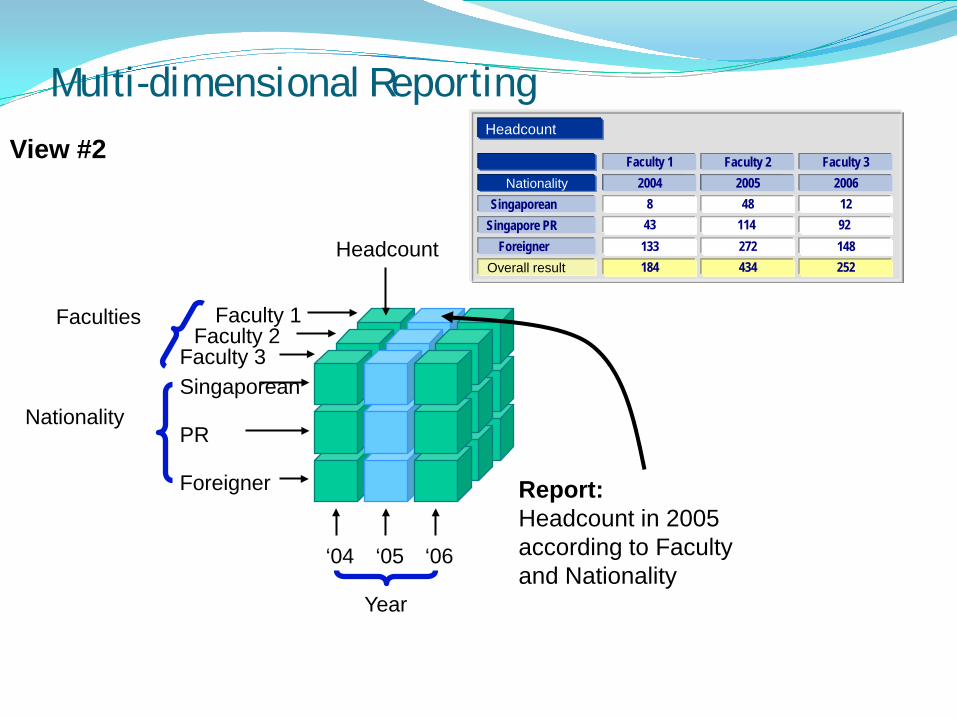
View #2
Nationality
‘04 ‘05 ‘06
Year
Singaporean
PR
Faculty 1
Faculty 3Faculty 2
Foreigner
Headcount
Faculties
Headcount
NationalitySingaporean
Singapore PR Foreigner
Overall result
2004843133184
Faculty 1200548
114 272434
Faculty 220061292 148252
Faculty 3
Report:Headcount in 2005 according to Faculty and Nationality
Multi-dimensional Reporting

View #3
Year
‘04 ‘05 ‘06
Singaporean
Sing PR
Faculty 1
Faculty 3Faculty 2
Foreigner
Headcount
Faculties
Nationality
Headcount
NationalitySingaporean
Singapore PR Forigner
Overall result
199635102244381
Faculty 2199748
114 272434
Faculty 2199857
149 314520
Faculty 2
Report:Headcount at Faculty 2 according to Nationality and year
Multi-dimensional Reporting

Restricted view
‘04 ‘05 ‘06
Year
Singaporean
PR
Faculty 1
Faculty 3Faculty 2
Foreigner
Headcount
Faculties
Nationality
Headcount
Nationality
Singaporean
2006
14
Faculty 3
Report:Headcount of Singaporeans in 2006 in Faculty 3
Multi-dimensional Reporting

A Typical SAP BW Project Lifecycle…
1 2 3 4
Evaluation & Feasibility
Prototyping
Pilot Implementation Go Live
& Support
Planning & Strategy: Concept for Rollout and Further Planning
Implementation Cycle 1
Continuous...Business Information Reengineering
Implementation Cycle 2
Implementation Cycle 3
5
...Roll-Out

BI evolution in NUS
2002
2003
2004
2005
2006
2007
2008
2009
2010
2011

AdmissionBudgeting& ForecastEmploymentEnrolment
& Courses
Others
SINGLE VERSION OF ENTERPRISE INFORMATION
OLTP
R/3 ORACLE EXTERNALLEGACY MSQL EXCELDATA
Enterprise wide information
BI at NUS
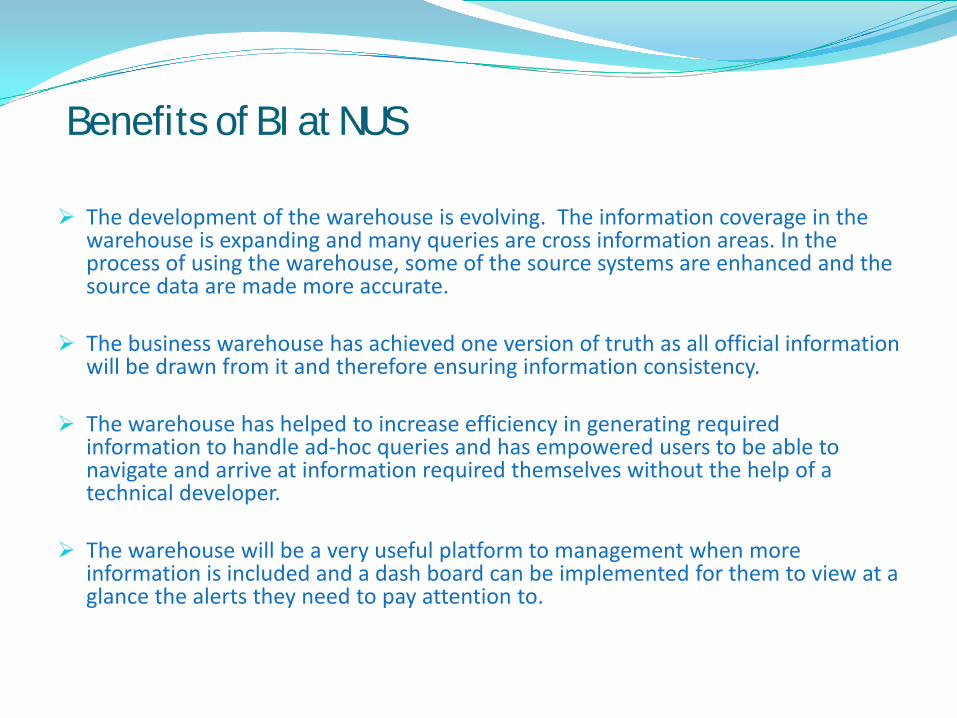
Benefits of BI at NUS
The development of the warehouse is evolving. The information coverage in the warehouse is expanding and many queries are cross information areas. In the process of using the warehouse, some of the source systems are enhanced and the source data are made more accurate.
The business warehouse has achieved one version of truth as all official information will be drawn from it and therefore ensuring information consistency.
The warehouse has helped to increase efficiency in generating required information to handle ad-hoc queries and has empowered users to be able to navigate and arrive at information required themselves without the help of a technical developer.
The warehouse will be a very useful platform to management when more information is included and a dash board can be implemented for them to view at a glance the alerts they need to pay attention to.
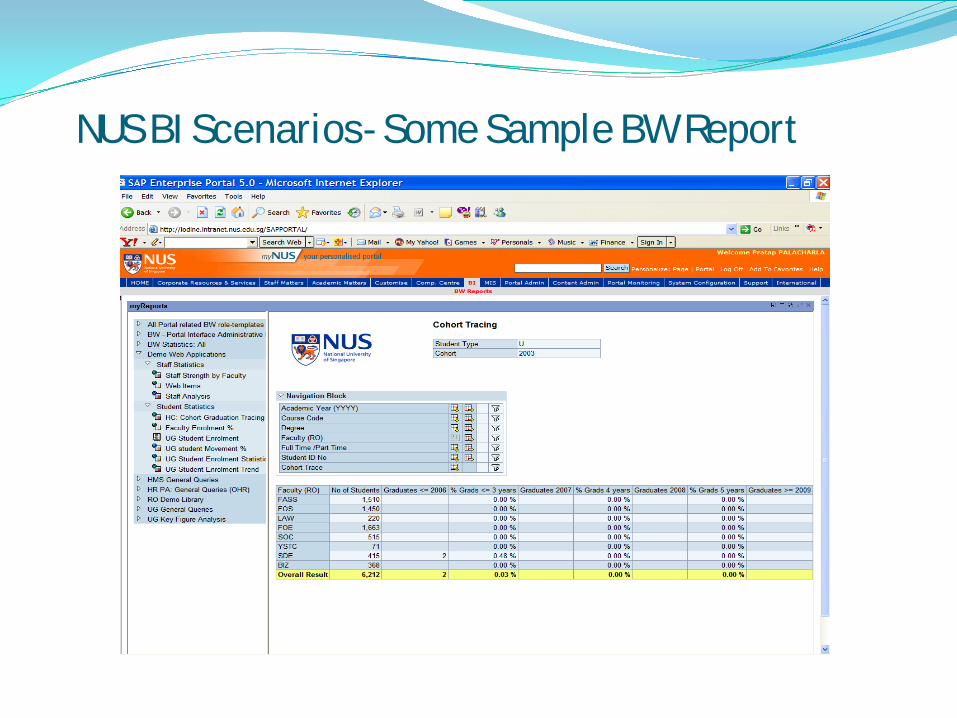
NUS BI Scenarios- Some Sample BW Report

Some Sample BW Report..

NUS BI Scenarios – Student Enrolment Analysis

NUS BI Scenarios – Graduate Analysis

NUS BI Administration- BI usage monitoring

- Fear of Change- Control & Ownership
- Resources Availability- Complexity
Common challenges of BI implementation
Challenges of BI implementation contd.. Most of the times translation of business requirements to BW technical requirements
is difficult and hence requires the assistance of techno-functional consultants.
The other challenge is a need to design reports that are simple yet provide all the necessary information.
While implementing BW especially for HR, we have to consider security policies more closely.
Testing issues: In most cases testing cannot be done on a full scale using real data in several implementations, due to data privacy requirements.
Dynamics: Every time there is a change in the source system adjusting or re-modeling BI is not easy.
BI is not meant to be used as an operational system (OLTP) and hence many times, the user expectation of having one single report to give all the details is not achievable.
The process of managing the link between source and BI is very critical; this constraint of dependency would not be there in case of the reporting being done at the source system.
Value creation for business users
The biggest Return on Investment (ROI) will come from converting the information consumer group into more active users via increased productivity, and also from reducing the work IT must perform to make information consumable.
In order to increase user productivity, BI tools need to deliver greater forms of richness and reach users beyond static reports so that they can accomplish more through ease-of-use and convenience.
A richer user experience might include more visualization, interactivity and instant gratification, while more reach should entail relevant information-delivery channels necessary to make BI omnipresent.

The new Business Intelligence PlatformValue added within an SAP landscape
SAP NetWeaver Portal
SAP NetWeaver Business Warehouse
SAP NetWeaver MDM ERPFinancialsOperations
Human ResourcesCorporate Services
CRM SCM
SRM PLM
Any Portal, Any Destination
SAP BusinessObjects Enterprise
Crystal Reports Web Intelligence Xcelsius
SAP NetWeaver BW Accelerator
Data Services
Data Quality ManagementData Integrator
SAP BEx
Dat
a Fo
unda
tion
Info
rmat
ion
Acc
ess
SAP Business Suite3rd-Party Databases and Applications
Explorer
Data Quality Mgmt

KEY POINTS Enterprise Reporting
OLAP Analysis Query Designer
Adhoc Reporting
Dashboard
CRYSTAL REPORTS to be used for Enterprise Reporting
PIONEER to be used for OLAP analysis Replaced Tools -BEx Analyzer BEx Web Analyzer
BEx Query Designer is not affected by the roadmap.
WEBI Web Intelligenceto be used for Adhoc Reporting Universearchitecture design
Xcelcius + to be used for dashboards. Replaced Tools -Web Application Designer
Crystal Report to be used for highly formatted reporting such as management reports
Pioneer will combine Voyager's intuitive user interface with the powerful OLAP capabilities of today's Bex OLAP tools
All BOBJ tools can or will consume BEx queries either directly (Pioneer, Voyager, Crystal, Xcelsius) or via OLAP universe
Self-service reporting and analysis, autonomy From IT.
Visual Composer will pick-up further Web Application Design features both in the design- as well as in the runtime, in order to support modeling, running & personalization of composites with seamlessly embedded Business Intelligence

WEB Intelligence -Roll out as a pilot
Simple user interface
Combine data from SAP and non SAP in a Single Report
Sits on top of Business Objects Universes.
Universes connect to SAP Net weaver BI via OLAP BAPI

Enterprise self-service (WEB –I)Web-based ad hoc reporting and analysis
On the fly query and analysis- Autonomy from IT!!
Drag-and-drop interface
Prompts and wizards
Seamless transition from querying into analysis
Drill anywhere – no limits, enable drill through from summary to detail

SELF-SERVICE (AD HOC) DIFFERENTIATORS Integrated query and analysis capabilities Create a multi-block report and place objects anywhere on the page; Break
and section is very useful. Apply easy and fast formatting via toolbar- Flexible Formatting like MS
office tools! Add a calculation directly on the report with the use of Comprehensive
formulae like Median, ForEach, ForAll etc

Web Intelligence Demo Web Intelligence reports - Demo

Pain Points… We are facing a limitation to use one universe for one BEx Query as the
query selection is complex and specific Web-I does not allow creation of complex selection of RKF as in BEx Query User exit variable from BEx query is not supported in Web-I report (Web-I
takes the default /Hardcoded value for variable) In BEx we can display from master data even though the value is null
whereas in Web I the null values for master data is always hidden. When we transport the web–I queries from one environment to another,
we need to manually change associated universe connection definition to point to the destination environment.
When we refresh data to fetch data from BW the web-I response time is not good.

Discussion & Feedback

Thank you

Disclaimers:1. The sample reports presented do not show the actual data, as the
reports are extracted from Development Environment.