animal agriculture and global food supply
TRANSCRIPT


Council for Agricultural Science and TechnologyPrinted in the United States of America
Cover design by Lynn Ekblad, Different Angles, Ames, Iowa
ISBN 1-887383-17-4ISSN 0194–408800 01 00 99 4 3 2 1
Library of Congress Cataloging in Publication Data
Animal Agriculture and Global Food Supplyp. cm. — (Task force report, no. 135)Includes bibliographical references (p. ).1. Livestock. 2. Food of animal origin. 3. Food supply. I. Council forAgricultural Science and Technology. II. Series: Task force report(Council for Agricultural Science and Technology) ; no. 135
SF61.A54 1999388.1’760883--dc21 99–36314
CIP
Animal Agriculture and Global Food Supply
Council for Agricultural Science and Technology
Task Force ReportNo. 135 July 1999

Cover
ii
Lower Back and Front Cover
Pastoral scene with sheep grazing in a lush pasture in theUnited States.
Back Cover (Left)
Upper left photograph. Milking a White Fulani cow in Nige-ria. Photograph courtesy of David Elsworth, International Live-stock Research Institute, Nairobi, Kenya.
Upper right photograph. Dung collection to use for fuel and landapplication in Nigeria. Photograph courtesy of David Elsworth,International Livestock Research Institute, Nairobi, Kenya.
Lower right photograph. Buffalo used for transportation in Chi-na. Photograph courtesy of Eric Bradford, University of Cali-fornia, Davis.
Front Cover (Right)
Upper left photograph. Smallholder sheep flock in the HighAtlas Range in Morocco. Photograph courtesy of Eric Bradford,University of California, Davis.
Center photograph. A White Fulani cow, named after the Fu-lani people in Nigeria who herd them. Photograph courtesy ofDavid Elsworth, International Livestock Research Institute,Nairobi, Kenya.
Upper right photograph. Akamba people in the Machakos Dis-trict of Kenya using oxen for plowing. Photograph courtesy ofDavid Elsworth, International Livestock Research Institute,Nairobi, Kenya.
Lower left photograph. Millet transported by oxen near Niam-ey in Niger. Photograph courtesy of David Elsworth, Interna-tional Livestock Research Institute, Nairobi, Kenya.
Lower right photograph. Stall feeding of maize residue in asmallholder dairy in Kenya. Photograph courtesy of DavidElsworth, International Livestock Research Institute, Nairo-bi, Kenya.
Cover collage by Lynn E. Ekblad, Different Angles, Ames, Iowa

Eric Bradford (Chair) , Department of Animal Science, University of California, Davis
R. Lee Baldwin , Department of Animal Science, University of California, Davis
Harvey Blackburn , U.S. Sheep Experiment Station, U.S. Department of Agriculture, Agricultural ResearchService, Dubois, Idaho
Kenneth G. Cassman , Agronomy Department, University of Nebraska, Lincoln
Pierre R. Crosson , Resources for the Future, Washington, D.C.
Christopher L. Delgado , International Food Policy Research Institute, Washington, D.C.
James G. Fadel , Department of Animal Science, University of California, Davis
Henry A. Fitzhugh , International Livestock Research Institute, Nairobi, Kenya
Margaret Gill , Natural Resources International, Chatham, U.K.
James W. Oltjen , Department of Animal Science, University of California, Davis
Mark W. Rosegrant , International Food Policy Research Institute, Washington, D.C.
Martin Vavra , Eastern Oregon Agricultural Research Center, Oregon State University, Burns
Robert O. Wilson , College of Veterinary Medicine, Oregon State University, Corvallis
Task Force Members
iii
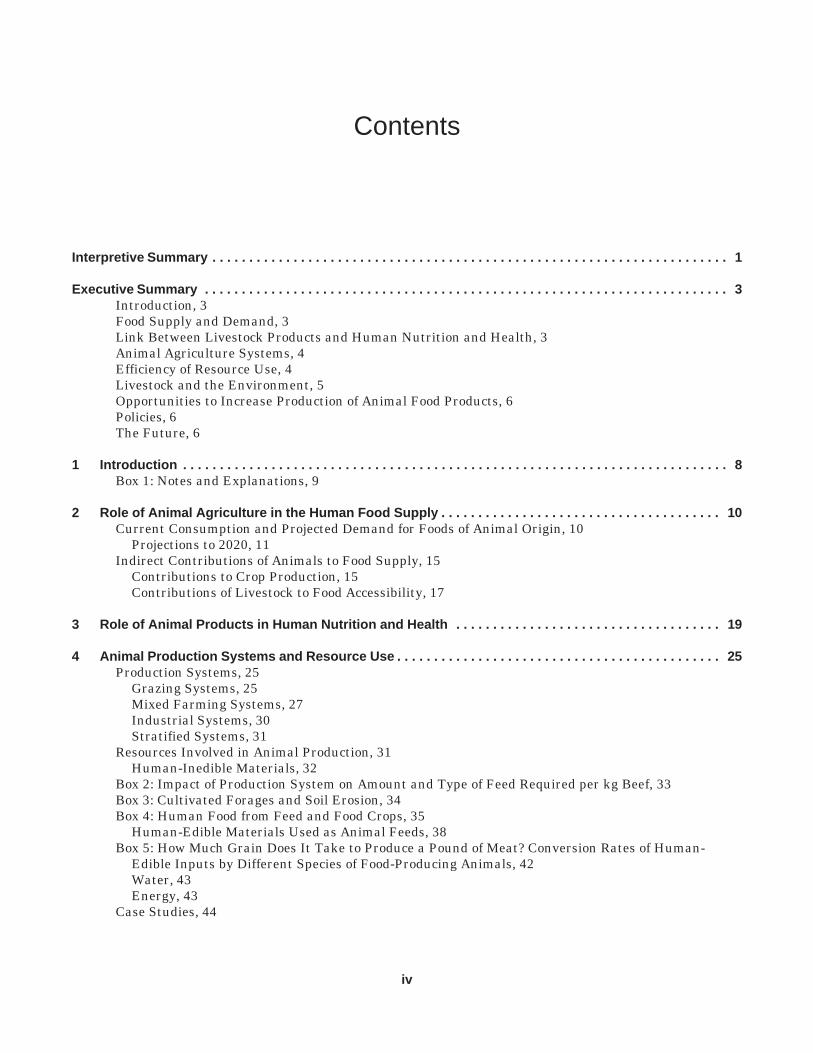
Contents
Interpretive Summary . . . . . . . . . . . . . . . . . . . . . . . . . . . . . . . . . . . . . . . . . . . . . . . . . . . . . . . . . . . . . . . . . . . . . . 1
Executive Summary . . . . . . . . . . . . . . . . . . . . . . . . . . . . . . . . . . . . . . . . . . . . . . . . . . . . . . . . . . . . . . . . . . . . . . . 3Introduction, 3Food Supply and Demand, 3Link Between Livestock Products and Human Nutrition and Health, 3Animal Agriculture Systems, 4Efficiency of Resource Use, 4Livestock and the Environment, 5Opportunities to Increase Production of Animal Food Products, 6Policies, 6The Future, 6
1 Introduction . . . . . . . . . . . . . . . . . . . . . . . . . . . . . . . . . . . . . . . . . . . . . . . . . . . . . . . . . . . . . . . . . . . . . . . . . . 8Box 1: Notes and Explanations, 9
2 Role of Animal Agriculture in the Human Food Supply . . . . . . . . . . . . . . . . . . . . . . . . . . . . . . . . . . . . . . 10Current Consumption and Projected Demand for Foods of Animal Origin, 10
Projections to 2020, 11Indirect Contributions of Animals to Food Supply, 15
Contributions to Crop Production, 15Contributions of Livestock to Food Accessibility, 17
3 Role of Animal Products in Human Nutrition and Health . . . . . . . . . . . . . . . . . . . . . . . . . . . . . . . . . . . . 19
4 Animal Production Systems and Resource Use . . . . . . . . . . . . . . . . . . . . . . . . . . . . . . . . . . . . . . . . . . . . 25Production Systems, 25
Grazing Systems, 25Mixed Farming Systems, 27Industrial Systems, 30Stratified Systems, 31
Resources Involved in Animal Production, 31Human-Inedible Materials, 32
Box 2: Impact of Production System on Amount and Type of Feed Required per kg Beef, 33Box 3: Cultivated Forages and Soil Erosion, 34Box 4: Human Food from Feed and Food Crops, 35
Human-Edible Materials Used as Animal Feeds, 38Box 5: How Much Grain Does It Take to Produce a Pound of Meat? Conversion Rates of Human-
Edible Inputs by Different Species of Food-Producing Animals, 42Water, 43Energy, 43
Case Studies, 44
iv

5 Meeting Future Demand for Livestock Products . . . . . . . . . . . . . . . . . . . . . . . . . . . . . . . . . . . . . . . . . . . 55Feed Supplies, 55
Range Forage, 55Cultivated Forages, 56Crop Residues and By-Products, 56
Box 6: Utilization of Forage Growing under Estate Tree Crops for Livestock Production, 57Feed Grains, 58
Technologies to Improve Animal Production Efficiency, 64Examples of Achieved Efficiency Increases, 64Potential Future Increases from Improved Technologies, 65
Box 7: Stocking Rate, 75Environmental Considerations, 78Policy Issues, 79The Future, 80
Appendix A: Abbreviations, Acronyms, and Symbols . . . . . . . . . . . . . . . . . . . . . . . . . . . . . . . . . . . . . . . . . . 82
Appendix B: Glossary . . . . . . . . . . . . . . . . . . . . . . . . . . . . . . . . . . . . . . . . . . . . . . . . . . . . . . . . . . . . . . . . . . . . 83
Literature Cited . . . . . . . . . . . . . . . . . . . . . . . . . . . . . . . . . . . . . . . . . . . . . . . . . . . . . . . . . . . . . . . . . . . . . . . . . . 84
Index . . . . . . . . . . . . . . . . . . . . . . . . . . . . . . . . . . . . . . . . . . . . . . . . . . . . . . . . . . . . . . . . . . . . . . . . . . . . . . . . . . . 89
Animal Agriculture and Global Food Supply v

Figures
2.1 Annual percent calories per capita from animal products, 10
2.2 Per capita consumption (kg/yr) of selected animal products in developed and developing countries, 11
2.3 Per capita meat consumption (kg/yr), 12
2.4 Total meat consumption (Mt) in the developing and developed world, China, and the United States, 13
2.5 Per capita consumption (kg/yr) of beef, pork, and poultry in the developed and developing world, 13
2.6 Total consumption (Mt) of beef, pork, and poultry in the developed and developing world, 14
2.7 Growth of production (%/yr) of beef, pork, and poultry in the developed and developing world from 1982–1993 and estimated from 1993–2020, 14
2.8 Pigs produce more meat than any other animal species in both developed and developing countries, 15
2.9 Buffalo used in preparation of a paddy for planting rice, Indonesia, 15
2.10 Buffalo used for transportation in China, 15
2.11 Cowpea fodder transported by donkey in Niger, 15
2.12 Camels used for transportation in Senegal, 16
2.13 Millet transported by oxen near Niamey in Niger, 16
2.14 Akamba people in the Machakos District of Kenya using oxen for plowing, 16
2.15 Confinement sheep and goat housing, cut-and-carry system in Indonesia. An important product of thissystem is manure (fertilizer) for food crop production, 17
2.16 Dung collection to use for fuel and land application in Nigeria, 17
3.1 Milk sales in Kenya, 19
3.2 Beef carcass with ribeye exposed, 19
4.1 Extensive sheep and goats grazing in Senegal, 26
4.2 Camels grazing desert rangeland in Kuwait, 26
4.3 Intensive sheep production on seeded pastures in New Zealand, 26
4.4 Milk sheep grazing in the Roquefort region of France, 26
4.5 Hereford calf. Most beef cattle everywhere, whether grazed throughout life or finished in feedlots, areborn and spend most of their life on range or pasture, 26
4.6 Supplementing beef cattle with a molasses/urea mix when grass is scarce, 27
4.7 Tethered goats during the night provide manure fertilizer to land in Kenya, 27
4.8 Donkey transporting forage in Morocco, 27
4.9 Fodder being transported by camels in Niger, 27
4.10 Fodder being transported by donkey in Kenya, 28
vi

4.11 Human transport of forage in Indonesia, 28
4.12 Human transport of forage in Indonesia, 28
4.13 Stall feeding of maize residue in a smallholder dairy in Kenya, 28
4.14 Market sales of livestock in Niger, 29
4.15 Manuring in Kenya, 29
4.16 Night tethering of cows for land fertilization in Kenya, 29
4.17 Fodder storage in Niger, 29
4.18 Feeding crop residues in Kenya, 30
4.19 Jersey dairy cows on high quality pasture, 30
4.20 A modern California dairy in the United States, 30
4.21 Feedlot finishing of beef cattle in the United States. Rations typically contain up to one-third of by-productfeeds as well as grain and forage, 31
4.22 Industrial broiler production involves large numbers of birds, 31
4.23 Cattle grazing shortgrass prairie in eastern Colorado, 32
4.24 Cattle grazing sagebrush-steppe rangeland in Oregon, 32
B2.1 Growth patterns (ages in months and weight in kg) of beef production in three production systems (1 =grazing, 2 and 3 = stratified), 33
4.25 Beef cattle utilizing sorghum stubble following harvest of the grain crop, 34
4.26 Sheep grazing cereal stubble in Morocco, 34
4.27 Almond hulls are a high energy content feed for ruminants, 38
4.28 Dried beet pulp is a good feed for cattle, 38
4.29 Citrus pulp used in dairy cattle rations, 38
4.30 Tomato pomace. Originally a waste product, now used in ruminant rations with feed value similar toalfalfa, 39
4.31 Commodity barn, California dairy. Whole cottonseed in center bay, 39
4.32 Carrot waste by-product from carrot processing being stockpiled for livestock feed, 39
4.33 Chaff dumps are created during wheat combining as a way to accumulate waste material to be consumedby cattle, 39
4.34 Cattle drinking at a waterhole in Niger, 43
4.35 Land utilization (%) in Argentina, Kenya, and South Korea, 45
4.36 Relative contributions (%) of various animal food products to total animal food in Argentina, Kenya, andSouth Korea, 49
5.1 Goats grazing semi-arid brushland in Kenya, 55
5.2 Smallholder sheep flock in the High Atlas Range in Morocco, 55
5.3 Rotational grazing of seeded pastures in New Zealand, 56
5.4 Different environments and forage quality involve different breeds for most efficient production. Dualpurpose (dairy/beef) cattle in a good rainfall area in Germany, 56
Animal Agriculture and Global Food Supply vii

5.5 Crossbred beef cattle in a dry summer climate in California, 56
5.6 Sheep grazing under young rubber trees in North Sumatra, 57
5.7 Goats grazing on a small landowner’s holdings that include banana plants, 57
5.8 Typical intermountain United States cattle operation with cows grazing private meadowland and publicrangeland in the mountains in the background, 58
5.9 Livestock grazing systems can be developed that are compatible with or in some cases may actually ben-efit wildlife. Burrowing owl in western rangeland, 58
5.10 Livestock grazing systems can be developed that are compatible with or in some cases may actually ben-efit wildlife. Elk in western rangeland, 62
5.11 Sagebrush steppe rangeland that has been ungrazed for 60 years on the right side of the fence and prop-erly grazed on the left. Little difference in appearance and ecological condition occurs with proper graz-ing practices, 62
5.12 Maize yield trends in Nebraska from 1983 to 1997 as measured in the annual yield contests sponsored bythe National Corn Growers Association (NCGA) for irrigated and rainfed production systems. The dashedline with an arrow represents the trend line for contest-winning rainfed yields. All yields are adjusted to15.5% moisture content. Yields are verified by independent observers and are obtained from a combinedharvest of fields with a minimum size of 4 ha (data from Duvick and Cassman, 1999), 63
5.13 Beef cow with twin calves. Twinning in beef cattle is normally infrequent but can be increased by genet-ics. In favorable production environments, twinning is a technology that can be used to increase efficien-cy of production substantially, 66
5.14 Genetic potential matched to the production environment and markets of a region are important to effi-cient animal production. Jersey and Friesian cattle in the United Kingdom, 67
5.15 Genetic potential matched to the production environment and markets of a region are important to effi-cient animal production. Red Sindhi (Zebu) cattle in India, 67
5.16 Genetic potential matched to the production environment and markets of a region are important to effi-cient animal production. Zebu ∞ Friesian cow in India, 68
5.17 Zebu cows typically require presence of the calf at milking time for proper milk let-down. This is not thecase for specialized dairy breeds such as Friesians. Zebu cow in India, 69
5.18 The Jamunapari breed of milk goats of India has contributed to the development of breeds, such as theEtawah of Indonesia and Anglo-Nubian, popular in many countries, 70
5.19 Buffalo cow in Egypt. Buffalos are important producers of milk for human consumption in many tropicaland sub-tropical countries, 71
5.20 Sahelian sheep with owner in livestock market in Mali, 72
5.21 Javanese Thin-Tail breed ewe with quintuplets in Indonesia, 73
viii Figures

Tables
ix
2.1 Percent of human food calories and protein from animal products, 1973–1993, 10
2.2 Annual per capita food consumption (kg) and percent of calories from selected livestock products, 1973and 1993, 11
2.3 Past and projected consumption trends of meat, to the year 2020, 12
2.4 Past and projected consumption trends of various meats, to the year 2020, 13
2.5 Past and projected production trends of various meats, to the year 2020, 14
3.1 Per capita consumption of major food groups in Argentina (1993), 20
3.2 Per capita consumption of major food groups in Egypt (1993), 20
3.3 Per capita consumption of major food groups in Kenya (1993), 21
3.4 Per capita consumption of major food groups in Mexico (1993), 21
3.5 Per capita consumption of major food groups in South Korea (1993), 21
3.6 Per capita consumption of major food groups in the United States (1993), 21
3.7 Food consumption per capita per year by major food groups in the United States through time, 22
3.8 Per capita consumption of major food groups by toddlers and school children in Egypt, Kenya, and Mex-ico, 22
4.1 Quantity (1,000 t) and percent of global livestock products produced by the three major production sys-tems, 25
B2.1 Comparison of three strategies for beef production, 33
B3.1 Estimated sheet, rill, and wind erosion by land use in Nebraska, 34
B4.1 Inputs and human food outputs for various crops, 35
4.2 Nutrient composition for ruminants of by-product feedstuffs, dry matter basis, 36
4.3 Crop residue and by-product feedstuff production, metabolizable energy (ME) and protein (CP) contentfor selected countries, 1993, 37
4.4 Cereal grains and other concentrate feeds used in developed/developing countries (1990–1992), 41
4.5 Concentrate feed use and food production (Mt) from animals in developing and developed countries (1992–1993), 41
B5.1 Estimates of the grain fed per unit of carcass weight of four meats produced, in developed and developingcountries, 42
4.6 Land utilization (1993), 44
4.7 United States grain production, export and use for feed and food (1992–1994 average), 45
4.8 Cattle numbers, productivity, and contribution to individual country/state diets, 46

4.9 Swine numbers, productivity, and contribution to individual country/state diets, 46
4.10 Poultry meat production and contribution to individual country diets, 47
4.11 Numbers of laying hens, productivity, and contribution of eggs to individual country/state diets, 47
4.12 Small ruminant numbers, productivity, and contribution to individual country/state diets, 48
4.13 Number of milk cows, milk production, and contribution to individual country/state diets, 48
4.14 Edible nutrients in one kg of carcass, 49
4.15 Dry matter (as fed) metabolizable energy, protein values, and human-edible fractions used in calcula-tions of returns on total and human-edible inputs in livestock production, 50
4.16 Basis for estimates of total and human-edible energy inputs to beef production in Nebraska, 50
4.17 Beef: gross efficiencies of conversion of diet energy and protein to product and returns on human-edibleinputs in products, 51
4.18 Example ingredient compositions of beef cattle finishing rations and fractions of human-edible inputs,51
4.19 Example rations for intensive swine and poultry production systems, 52
4.20 Swine: gross efficiencies of conversion of diet energy and protein to product and returns on human-edibleinputs in products, 53
4.21 Poultry meat: gross efficiencies of conversion of diet energy and protein to product and returns on hu-man-edible inputs in products, 53
4.22 Eggs: gross efficiencies of conversion of diet energy and protein to product and returns on human-edibleinputs in products, 53
4.23 Example rations for dairy production systems, 54
4.24 Milk: gross efficiencies of conversion of diet energy and protein to product and returns on human-edibleinputs in products, 54
5.1 Past and projected trends in use of cereal as feed, to the year 2020, 59
5.2 Estimated increase in feed grain conversion efficiency, 1983 to 1993, 59
5.3 Total percentage changes in projections of aggregate consumption in 2020 due to changes in assump-tions relative to baseline, 60
5.4 Real prices of selected crop and livestock products as projected by the IMPACT model, 61
x Tables

Foreword
xi
Following a recommendation by the CAST NationalConcerns Committee, the CAST Board of Directorsauthorized preparation of a report on animal agricul-ture and the food supply in the world.
Dr. G. Eric Bradford, Department of Animal Sci-ence, University of California, Davis, served as chairfor the report. A highly qualified group of scientistsserved as task force members and participated in thewriting and review of the document. They includeindividuals with expertise in agricultural economics,agronomy, animal sciences, environmental issues, in-ternational food policy, international livestock re-search, nutritional sciences, range science, and vet-erinary medicine.
The task force met and prepared an initial draft ofthe report. They revised all subsequent drafts andreviewed the proofs. The CAST Executive and Edito-rial Review committees reviewed the final draft. TheCAST staff provided editorial and structural sugges-tions and published the report. The authors are re-sponsible for the report’s scientific content.
On behalf of CAST, we thank the chair and theauthors who gave of their time and expertise to pre-pare this report as a contribution by the scientific com-munity to public understanding of the issue. We alsothank the employers of the scientists, who made thetime of these individuals available at no cost to CAST.CAST recognizes and appreciates the financial sup-port of the U.S. Department of Agriculture/Coopera-tive State Research, Education, and Extension Ser-vice (USDA/CSREES) and the USDA/Agricultural
Research Service (ARS) to partially assist in the de-velopment and completion of this report. CAST thanksall members who made additional contributions toassist in the preparation of this document. The mem-bers of CAST deserve special recognition because theunrestricted contributions that they have made insupport of CAST also have financed the preparationand publication of this report.
This report is being distributed to members of Con-gress, the White House, the U.S. Department of Ag-riculture, the Congressional Research Service, theFood and Drug Administration, the EnvironmentalProtection Agency, the Agency for International De-velopment, the Office of Science and Technology Pol-icy, and the Office of Management and Budget, andto media personnel and institutional members ofCAST. Individual members of CAST may receive acomplimentary copy upon request for a $3.00 postageand handling fee. The report may be reproduced inits entirety without permission. If copied in any man-ner, credit to the authors and to CAST would be ap-preciated.
David R. LinebackPresident
Richard E. StuckeyExecutive Vice President
Kayleen A. NiyoManaging Scientific Editor

Acknowledgments
xii
A number of individuals contributed in significantways to the completion of this report. Members of thetask force acknowledge, with appreciation, contribu-tions from the following individuals who have beenhelpful in the preparation of this report: Jamie Ben-nison, Natural Resources Institute, Chatham, Unit-ed Kingdom; K. C. Donovan, Department of AnimalScience, University of California, Davis; SalvadorFernandez-Rivera, International Livestock ResearchInstitute, Nairobi, Kenya; Pierre Hernaux, Interna-tional Livestock Research Institute, Nairobi, Kenya;Lovell Jarvis, Department of Agricultural and Re-source Economics, University of California, Davis;Kirk Klasing, Department of Animal Science, Univer-sity of California, Davis; Terry J. Klopfenstein, De-partment of Animal Science, University of Nebraska,Lincoln; Robert Loomis, Department of Agronomy andRange Science, University of California, Davis; Low-ell E. Moser, Department of Agronomy, University ofNebraska, Lincoln; Brian Perry, International Live-stock Research Institute, Nairobi, Kenya; Ned Raun,Stillwater, Oklahoma; Walter H. Schacht, Depart-ment of Agronomy, University of Nebraska, Lincoln;Calvin Schwabe, School of Veterinary Medicine, Uni-versity of California, Davis; Kenneth P. Vogel, U.S.Department of Agriculture, Agricultural ResearchService; and Timothy O. Williams, International Live-stock Research Institute, Nairobi, Kenya.
We express our sincere appreciation to the severalU.S. universities; the U.S. Department of Agriculture,Agricultural Research Service; and Resources for theFuture, who supported this effort through the serviceof their scientists on the task force. We wish to recog-nize particularly the contributions of three interna-tional organizations—the International Food PolicyResearch Institute in Washington, D.C.; the Interna-tional Livestock Research Institute in Nairobi, Ken-ya; and the United Kingdom government’s Depart-ment for International Development—for financiallysupporting the valuable contributions of personnelworking on this project.
We also thank Fred N. Owens, Des Moines, Iowafor providing a thoughtful review of the manuscript.
We thank Edward O. Price, chair of the Depart-ment of Animal Science at University of California,Davis through August 1998, and Gary B. Anderson,current chair, for hosting the task force and CASTstaff at two task force meetings and for other formsof support.
We are grateful to Eric Bradford, Department ofAnimal Science, University of California, Davis; DavidElsworth, International Livestock Research Institute,Nairobi, Kenya; and Martin Vavra, Oregon StateUniversity, Burns, Oregon for providing photographsfrom many countries for inclusion in this report.

1
Interpretive Summary
Animal agriculture is an integral part of food-pro-ducing systems, with foods of animal origin represent-ing about one-sixth of human food energy and one-third of the human food protein on a global basis.Animals convert forages, crop residues, and food andfiber processing by-products to high quality humanfood; provide draught power for about half the world’scrop production; and provide manure to help main-tain soil fertility. Animal production makes importantcontributions to agricultural economies throughoutthe world and to food security in developing countries.
Animals also consume one-third of the global cere-al grain supply. In a world with human populationforecast to reach 7.7 billion by the year 2020, a fixedor possibly shrinking quantity of arable land, and anestimated 800 million undernourished people, quan-tifying the net contribution of animal production toquantity and quality of the food supply is important.
Current global food supply is sufficient to provideeveryone with an adequate diet. The inequitable dis-tribution of food, which leads to hunger in some ar-eas, is caused by inequities in income distribution, acomplex issue not likely to be addressed effectively bychanges in any one component of agricultural produc-tion systems.
Consumption of meat, milk, and eggs varies wide-ly among countries, reflecting differences in food pro-duction resources, production systems, income, andcultural factors. Per capita consumption of these foodsis much higher in developed countries but the currentrapid increase in many developing countries is pro-jected to continue. Total meat consumption in devel-oping countries is projected to more than double bythe year 2020, while, in developed countries, it is pro-jected to increase no more and, in some cases, lessthan population growth. Because most of the world’spopulation is in developing countries, which are ex-periencing the most rapid growth rates, global de-mand for meat is projected to increase more than 60%of current consumption by 2020.
At low levels of intake of meat, milk, and eggs, anincrease in consumption of these foods is known to benutritionally beneficial, particularly for young chil-dren. These benefits result from the higher content
and nutritional availability of essential amino acidsand several micronutrients, including minerals andvitamins. Thus, if achieved, projected increases in percapita intake of meat and other animal products indeveloping countries should improve people’s nutri-tional status. In developed countries, on the otherhand, intakes of food from animals are higher thanjustified by nutritional grounds alone. Opinions dif-fer as to whether a decrease in intake of these foodswould benefit the health of the general population. Inall countries, the palatability and dietary diversitycontributed by meat, milk, and eggs are undoubtedlyimportant factors, in addition to nutritional content,in determining intake levels.
Conversion rates of the energy and protein in feedsconsumed by animals to human food energy and pro-tein vary, depending on species, production system,feed type, and product. Poultry and pork productionare most efficient on the basis of total food producedfrom total feed intake but, on average, ruminants (cat-tle, sheep, goats) return more human food per unit ofhuman-edible feed consumed because most of theirfeed is obtained from materials that cannot be con-sumed directly by humans. This fact has been over-looked in some assessments of the role of animals infood production.
On a global basis, less than three kilograms (kg) ofgrain are required to produce a kg of meat from anyof the species and less than one kg of grain per kg ofmilk. Less grain is fed to livestock in developing thanin developed countries. It has been estimated that, ona global basis, animals produce a kg of human foodprotein for each 1.4 kg of human-edible protein con-sumed. The biological value of protein in foods fromanimals is about 1.4 times that of foods from plants.Thus, diverting grains from animal production to di-rect human consumption would, in the long term, re-sult in little increase in total food protein and woulddecrease average dietary quality and diversity. Also,feed grains can be and are diverted to direct humanuse during periods of temporary food grain shortage.An additional consideration is that maize, the princi-pal feed grain, yields much more per hectare thanwheat, the number one food grain.

2 Executive Summary2 Interpretive Summary
Recently, conversion rates of grains to meat, milk,and eggs have improved significantly in both devel-oped and developing countries. Applying known tech-nologies to a larger proportion of the world’s animalpopulations offers the potential for substantial addi-tional improvements in efficiency and, with continuedinvestment in research, new technologies undoubted-ly will contribute to additional increases. This sug-gests that grain requirement per unit of animal foodproduct should decrease. However, the largest in-creases in demand are forecast for poultry, pork, andaquaculture products, which are foods from speciesrequiring relatively high human-edible content diets.The net effect on grain demand is, therefore, difficultto predict but it is estimated that an annual rate ofgrowth in cereal production between 1.1 and 1.4%, i.e.,a lower rate than in recent decades, should meet needsfor both food grains and the feed grains required tomeet the projected per capita demand for meat, milk,
and eggs.Livestock have both positive and negative environ-
mental effects. Improved management of livestockgrazing, better management and use of manure, andincreased care in design and siting intensive produc-tion operations will be necessary to maximize benefi-cial effects and minimize detrimental effects of live-stock. Government policies related to land use andeconomic development are important.
Meeting projected demand for foods of both plantand animal origin in 2020, while sustaining the pro-ductive capacity of the land, will be challenging butfeasible. Animal agriculture will continue to be animportant part of food-producing systems. Investmentin agricultural production research and developmentand implementation of policies that encourage produc-tion, while protecting the environment, will be essen-tial to achieving the goal of an adequate global foodsupply.

Animal Agriculture and Global Food Supply 3
Executive Summary
3
IntroductionThe human population is forecast to increase by
33% over the next 20 years. This report takes a glo-bal view of the consequences on the demand for hu-man food and the current and potential contributionsof animal agriculture in meeting that demand. Casestudies from both the developing and developed worldillustrate different types of animal agriculture and thenutrient contributions of animal products to the hu-man diet. Predictions of the demand for and supplyof food on national, regional, and global levels to theyear 2020, generated by the International Food Poli-cy Research Institute’s (IFPRI) IMPACT model, arepresented. The resources used in animal agriculture,based on data from the Food and Agriculture Organi-zation (FAO) of the United Nations (UN), are exam-ined and ways in which efficiency might be improvedto meet predicted demand while limiting negativeenvironmental consequences are discussed. Summa-ries of this report’s key findings follow.
Food Supply and DemandOn a global basis, current food supply ought to be
able to meet demand. However, inequalities in incomedistribution result in more than 800 million peopleremaining hungry. While recognizing the need formore equitable distribution, this report focuses onregional and global production figures for the year2020.
The human population, currently increasing at1.4% per year, is forecast to increase by an average of1.2% per year over the period to 2020, reaching 7.7billion. Urbanization is increasing and incomes arerising in many parts of the world, trends associatedwith increased per capita demand for meat, milk, andeggs. Demand for these food products is, therefore,increasing at a faster rate than population growth.Global demand for meat thus is predicted to be 63%greater in 2020 than in 1993, with 88% of the increasein developing countries and nearly 50% of that inChina. However, the global economy will ensure thatthe consequences also will be evident in the developed
world.Demand for cereals for food and feed also will in-
crease, at an annual rate expected to be between 1.1and 1.4%. Historically in the developed world andcurrently in the developing world, animals are an in-tegral part of food production from crops. More than50% of cropland is cultivated by draught animal pow-er, while the use of manure is estimated to save thepurchase of fertilizer worth $700 million to $800 mil-lion per year in irrigated systems in the humid trop-ics alone. In addition, manure provides cooking fuel,and animals are used for transporting food to markets.
Link Between Livestock Productsand Human Nutrition and Health
On a global basis, foods of animal origin, includingfish, provide about 17% of the energy and more than35% of the dietary protein; however, this averagemasks large variations between countries. Where in-takes of animal products are low, increases in meat(in particular), milk, and eggs in the diets of toddlersand school children have resulted in marked improve-ments in growth, cognitive development, and health,due at least in part to the higher availability of essen-tial amino acids, minerals, and vitamins in food ofanimal, compared to plant, origin. At the higher endof the range, largely in developed countries, someepidemiological studies suggest that high intakes oflivestock products have adverse effects on health;however, the relationships are frequently confound-ed by increased longevity and variation in the intakeof other dietary components. The primary problem ina number of countries seems to be excess total ener-gy intake rather than intake of any one food group.
In the United States, during this century, per cap-ita intake of all fats and oils has increased by 50%,despite a decreased intake of animal fats; that of sug-ars and sweeteners is up 65%. Intake of beef and porkhas decreased by 30% from its highest level.
Analyses of diets in five case study countries (Ar-gentina, Egypt, Mexico, South Korea, and the UnitedStates) demonstrate that humans can thrive on a va-

4 Executive Summary
riety of diets, provided their energy, protein, andmicronutrient intakes are met; data from a sixth casestudy (Kenya) indicate suboptimal nutrition. Theimportance of a nutritionally balanced diet increasesas total food intake decreases, particularly with youngchildren, for whom foods of animal origin can have asignificant beneficial effect.
Animal Agriculture SystemsGrassland accounts for over 30% of the global land
surface. Much of this land, particularly in semi-aridand upland areas, is incapable of supporting crop pro-duction. Thus, livestock may provide the only sourceof local food production in regions where people havelimited income for purchase of food, even for subsis-tence. Only about 10% of global animal protein is pro-duced directly from grazing systems, although, inaddition, animals born and reared on grass may betransferred to other systems for further feeding.
Specialized livestock farms evolved in Europe andNorth America only in the last 50 years; in many coun-tries, especially in the developing world, mixed crop-livestock farms still predominate. These types offarms produce more than 50% of the meat and morethan 90% of the world’s milk production. In develop-ing countries, animals provide power for cultivationand, in all countries, they provide manure for fertili-zation and consume crop residues and by-productsthat would otherwise be wasted and could have ad-verse environmental impacts.
The remaining proportion of livestock products areproduced in intensive (industrial) systems that havebeen described by some as being “unnatural,” ineffi-cient in energetic terms, and unfriendly towards theenvironment. Yet, it is these systems that have con-tributed most to the relatively low-cost meat and milkenjoyed by consumers in developed countries. Suchsystems permit economies of scale, facilitate applica-tion of advanced production and environmental man-agement technologies, and, in general, result in theproduction of meat, milk, and eggs with significantlylower total feed input per unit of production than oth-er systems. They do use more potentially human-ed-ible feeds than other systems and can cause pollutionproblems if the facilities are not well designed andmanaged.
Most poultry and pig production in developed coun-tries—and an increasing percentage in developingcountries—occurs in industrial systems. The largestincreases in demand for food of animal origin are forpoultry meat and pork and, as a result, intensive pro-duction is likely to increase. This is expected to in-
crease global demand for feed grains.
Efficiency of Resource UseIn addition to consuming feed grains and oilseed
products, viewed as being in direct competition withhumans, animals consume vast quantities of human-inedible materials such as grasses and herbaceouslegumes, crop residues, and by-products of food- andfiber-processing industries. The composition of animaldiets varies with region and among species. Sheep,goats, and buffalo are fed very little grain, while thediets of dairy cows may include 10 to 30% of human-edible material and beef feedlot finishing rations, upto two-thirds. Pigs and poultry have limited ability todigest fibrous feeds and thus require diets high inenergy content to perform well. As a result, their di-ets typically contain 50 to 70% of human-edible feed-stuffs, with the balance consisting of milling or otherby-products relatively high in energy, protein, or both.
Globally, humans still directly consume nearly two-thirds of total cereal production, while pigs consumeapproximately 12%, dairy cows 9%, beef cattle 5%,meat chickens 5%, and laying hens 4%. Ruminants inparticular also consume by-products of crop produc-tion that are inedible by humans. For every 100 kg ofhuman food produced from the crops considered inFadel’s analysis (1999), an average of 37 kg of by-prod-ucts are produced, which can either be turned intohuman food by animals or be disposed of, incurringmonetary, fuel, and environmental costs. However,calculation of the net cost or benefit of animal produc-tion requires data on the efficiency with which vari-ous feed sources are converted into food by differentspecies.
Average conversion rates of feed grain to humanfood were calculated from global data on food produc-tion and feed grain use. For beef, pork, sheep and goatmeat, poultry meat, milk, and eggs, the values (kggrain/kg product) were 2.6, 3.7, 0.8, 2.2, 0.3, and 2.2,respectively, for developed countries and 0.3, 1.8, 0.3,1.6, 0.2, and 1.6 for developing countries. Thus, sheep,goats and dairy cattle, and beef cattle in developingcountries, produce more than a kg of human food foreach kg of grain consumed. For the six case studycountries considered in this report, dairy cattle re-turned between 1 and 14 kg of protein in milk for eachkg of protein in the human-edible material consumed.The very low conversion rates, which have been quot-ed in some assessments of animal products, e.g., 0.8to 0.14 kg of beef per kg of grain, ignore the forage andby-products consumed and are extrapolations fromthe final finishing phase of beef cattle in feedlots.

Animal Agriculture and Global Food Supply 5
Thus, they substantially underestimate actualoutput:input ratios for the human-edible feeds eaten.
It also should be noted that the grain fed to live-stock is often of a type or quality that is not in demand,or not fit, for human consumption. The yields of grainsfed to livestock, e.g., maize (corn), are greater thanthose for wheat, which is the leading cereal used inhuman diets when a choice is available. This yieldadvantage also needs to be factored into the assump-tions when comparing the efficiency of wheat versusmeat in feeding the world.
It is recognized that animals are inefficient convert-ers of total energy relative to crops but that efficien-cy is not yet at a maximum. Opportunities to increasethat efficiency are described in this report but success-es already have been achieved. During the decadefrom 1983 to 1993, the amount of meat, milk, and eggsproduced per unit of feed grain fed to animals in-creased approximately 15% in both developed anddeveloping countries.
Policy makers need to reappraise the relative ad-vantages and disadvantages of different types of foodproduction on a regular basis. Production efficiencyis only one of the relevant assessment criteria. Feedgrains provide a buffer for food grain supplies; less isfed to ruminants when grain production is decreaseddue to climatic influences or conflicts that lead to arise in prices. In the current global economic climate,policies to decrease the amount of grain offered to live-stock are unlikely to decrease the number of hungrypeople. A goal of providing food from both plant andanimal sources for those who wish them seems pref-erable.
Livestock and the EnvironmentMost human activities impact the environment;
agriculture is no exception. Animal agriculture fre-quently is blamed for adverse environmental effectsbut, conversely, the positive role of animals in envi-ronmental conservation is rarely emphasized. Forexample, grazing modifies plant communities and canbe managed to sustain or enhance desirable plantsand be neutral or beneficial to watersheds and wild-life. However, it is the improperly managed grazingthat adversely affects watershed function and wild-life habitat that attracts publicity. Recent evidencesuggests that many claimed negative effects of over-grazing have, in fact, been overstated, relative to theimpact of climatic factors, which have not been fullyrecognized. Transhumant systems, involving the sea-sonal movement of animals to take advantage of sea-sonal variation in forage production, have existed for
millennia in parts of Europe, Africa, and Asia andhave been successfully adapted in parts of the Amer-icas. However, increasing human population pressureand associated development have caused grazinglands to be converted to crop production and haverestricted animal movements. Management systemsoften have not been able to adapt to these constraints.Also, the land is often unsuited for cultivation, whichremoves more nutrients from the soil and can lead toerosion when the land is not covered by vegetation infallow periods.
Increasing population pressure is forcing the con-version of rainforest to pasture, most notably in theAmazon basin, a process that has been strongly criti-cized for its impacts on carbon dioxide production andreduced biodiversity. A rapidly expanding humanpopulation in the region is creating need for additionaleconomic development. Preventing further loss ofrainforest will require provision of alternative eco-nomic opportunities for local people as well as chang-es in land use policies.
Mixed crop-livestock systems offer a number ofopportunities for beneficial effects on the sustainabil-ity of food production in these regions and hence onthe environment. Return of manure and urine to thesoil increases both fertility and organic matter con-tent and forage cultivation to provide livestock feedcan decrease or ameliorate erosion. Using animals fordraught power also decreases reliance on fossil fuel.
As animal production systems intensify, there isthe potential for negative environmental impact fromimproper storage or application of manures pollutingsurface of ground waters. Again, the problem resultsfrom improper management rather than from theanimals per se, because the same problem also canoccur with improper use of chemical fertilizers.
Industrial livestock systems present the greatestchallenge in terms of maintaining environmentalquality. In these systems, large quantities of manureare concentrated in small areas, often not adjacent tothe land producing the feed. Technologies such as la-goons, manure drying, solids separation, and biogasproduction have been developed but their implemen-tation generally will require provision of appropriateincentives or development and effective enforcementof regulations to prevent pollution. There is now amuch greater appreciation of the importance of con-sidering environmental factors when deciding on thesite and design of industrial livestock operations.
Water is important environmentally, not just interms of pollution but also in terms of availability. Itis often the first factor limiting food production. Alarge variation exists among the limited number of

6 Executive Summary
estimates of water used for animal production; muchof it is due to differences in assumptions about use ofirrigated crops for feed. A realistic estimate of waterfrom wells or reservoirs used for beef production inthe United States is around 4,000 liters (L)/kg.
Opportunities to IncreaseProduction of Animal Food
ProductsProduction efficiency of animal food products var-
ies greatly around the world. However, increasingefficiency globally is not simply a matter of transfer-ring the technologies developed in intensive systemsto less intensive ones. Technologies must be adaptedto the resources available to the producer and the lo-cal environment, both natural and economic. Recentadvances in the biological sciences, e.g., the potentialfor speeding up genetic modification, provide tremen-dous opportunities for increasing animal productionefficiency. New opportunities include
• more effective matching of genetic potential of an-imals to specific nutritional, environmental, andmarket conditions;
• breeding for disease resistance in animals, togeth-er with improved methods for disease diagnosisand use of more effective vaccines for disease pre-vention;
• genetically improving the nutritional value of an-imal feed;
• increasing understanding of nutrient utilizationby animals, leading to more efficient productionwith less pollution; and
• precision farming involving improved systems forcollating and analyzing information and using theresults for more efficient allocation of resources.
The recent publicity and public interest in new bio-technologies have led to resistance to their adoptionin some countries. Scientists need to be responsiblefor adequate safety testing and for keeping the pub-lic informed.
PoliciesOne current problem in food production is that
while sufficient food to feed the world’s population canbe produced, it is not equitably distributed. There islittle benefit in producing food if it cannot reach amarket that can afford to purchase the products. In-creased food production also will not be sustainable
unless farmers can afford to purchase the necessaryinputs and adopt practices that do not deplete thenatural resource base. Appropriate government poli-cies are therefore vital to ensuring access to resourc-es, the financial viability of agricultural producers,infrastructure to deliver foods to markets, and thepurchasing power of consumers. Although this reportis not about policy per se, it highlights some issuesthat need to be addressed if animal agriculture is todeliver what is expected of it. These include
• food-pricing policies that give farmers a fair re-turn for labor and investment;
• land reform policies that combine the provision ofaccess to resources with incentives to conservethose resources;
• provision of banking and credit services to pasto-ralists and small-scale producers, to enable themto continue to make appropriate use of marginalenvironments; and
• policies to promote more equitable distribution offood in a global economy.
The FutureThis report documents that animal agriculture
makes both positive and negative contributions tototal food supply. On balance, the integration andcomplementarity between crop and livestock produc-tion and the nutrient quality of foods from animalsmake animal agriculture a key component of mostcurrent food production systems. An important ques-tion is whether meeting the projected future increasein demand for animal products is feasible and sustain-able. Economic projections indicate it will be feasible.Furthermore, substantial increases in efficiency ofproduction are possible. Globally, levels of animalproduction are very much below biological potential.For example, global average milk production per cowis currently only 10% of that in the highest-produc-ing herds. Doubling the volume of milk produced with-out increasing the number of cows should be possibleby improving all aspects of management, includingnutrition, breeding, and disease control. The amountof crop residues and by-product feeds will increase ascrop production is increased to meet the demands ofthe increasing population; application of new technol-ogies can improve the nutritional quality and utiliza-tion of these feeds.
Much of the increase in demand for animal prod-ucts is for the outputs of pig and poultry production,which require high nutrient-density diets and thusincreased consumption of feed grain. A primary re-

Animal Agriculture and Global Food Supply 7
quirement for feeding a growing world population isthus to increase crop yield per hectare, because thereis limited opportunity to increase the area of landcultivated without adverse environmental impact. Anincrease in cereal yields of approximately 1.4% peryear to 2020 would be required to meet the projectedneeds for direct cereal consumption and the project-ed increases in feed grain requirement at current con-version rates. Improvement in conversion efficiencyhas been occurring and, if continued, annual increas-es in cereal yields of as low as 1.1% would meet pro-jected food demand. Such yield increases will beachieved only through continued investment in re-search, an appropriate economic climate, and policies
that take account of food security requirements.The events of the last decade have shown the risks
in looking ahead on a 20-year planning horizon; thus,the assumptions made in this report are open to chal-lenge. Nevertheless, the authors are of the view thatanimal agriculture will continue to make importantcontributions to meeting the diversity of human foodneeds without compromising the ability of the worldto feed itself. For the world to be able to feed its grow-ing population, scientists from many disciplines andpoliticians must work together toward a common goal,integrating the experience of our forefathers in pro-ducing food with the responsible application of newtechnologies.

8 Introduction
8
Projected human population trends and the exist-ence of regional and world trade agreements meanthat domestic agriculture, food production, and hu-man food demand need to be considered in a globalcontext.
The current global food supply, evenly distributed,is estimated to be sufficient for an adequate diet forthe world’s nearly six billion people, a fact that wouldsurprise Malthus (1798) and others who, over theyears, have predicted that human population wouldoutstrip the world’s food-producing capacity, with re-sulting famine. However, the unprecedented absoluteincrease in human numbers in recent decades, whichis projected to continue for some time, and recenttrends in crop yields and grain reserves remind usthat the Earth’s carrying capacity is finite. The pos-sibility of food scarcity remains on the global agenda(American Association for the Advancement of Sci-ence, 1997; Brown, 1997; Tweeten, 1999).
Animal agriculture has long been and continues tobe an integral part of food-producing systems through-out the world (Cheeke, 1985; Schwabe, 1984). Animalagriculture provides, in the form of meat, milk, andeggs, approximately one-sixth of all human food en-ergy and more than one-third of human food proteinas well as numerous other valuable goods and servic-es. Interestingly, perceptions of the potential contri-butions of this segment of agriculture to future foodsupplies vary widely. On one hand, per capita demandfor animal food products has expanded rapidly in anumber of developing countries in the past 15 years,and large increases are projected to continue (Delga-do et al., 1999). Because the regions where these in-creases are occurring contain the majority of theworld’s population, as well as the most rapid popula-tion growth rates, a very large increase in global de-mand for animal products is forecast. On the otherhand, those such as Brown (1997), who foresee an im-pending shortage of cereal grains, advocate divertinggrains now fed to animals to direct human use. How-ever, de Haan et al. (1997) note that this shift in grainuse is driven by economic forces and occurs todayduring times of grain shortage. Furthermore, as doc-umented in this report, animal agriculture comple-
ments crop production in a number of ways. Given thisand the complex interactions both within and betweencountries in a global economy, interventions such asproposed by Brown (1997) can have unintended con-sequences.
Feed grains, i.e., grains fed to animals, as opposedto grain directly consumed by humans, represent abuffer against temporary food grain shortages and willno doubt continue to fill that role if not purposely di-verted to food use by structural changes in worldwideagriculture. When fed to animals, feed grains playimportant roles in the ability of animals to producefood from large quantities of plant materials thathumans cannot eat. The contributions of animals torecycling plant nutrients and to using food-process-ing by-products that would otherwise represent awaste disposal problem indicate that a permanentreduction in feed grain use would have multiple ram-ifications for food-production systems.
The nutritional value of animal products is high atlow intakes and an increase in intakes of meat, milk,or eggs, especially among children with currently lowintakes, would improve nutritional status. It wouldbe inappropriate for people from developed countriesto impose their dietary beliefs on people at the oppo-site end of the dietary scale. In addition to the nutri-tional importance of foods of animal origin, many peo-ple desire the dietary variety and palatability obtainedby including some animal products in their diets. AsCohen’s (1995) analyses make clear, the world’s hu-man carrying capacity is not a fixed number but de-pends on the standard of living desired. For manypeople, some foods of animal origin are part of a de-sired standard of living and there seem to be no com-pelling reasons why, if feasible, this desire should notbe met. Important questions, therefore, are whetherthe increased demand for foods from animals can bemet and what impact meeting this demand is likelyto have on other components of the food supply andon sustainability of food-production systems.
This report examines the multiple roles of animalsin food-production systems and documents conversionrates of both human-inedible and human-edible plantmaterials into food by different types of animals in a
1 Introduction

Animal Agriculture and Global Food Supply 9
variety of systems (Box 1). From these results, weestimate potential impacts of alternative productionstrategies on quantity, nutritional quality, and diver-sity of the global food supply. We examine prospects
The report deals primarily with milk, eggs, and meatfrom cattle, sheep and goats, pigs, and poultry. Fish andother freshwater and marine food products are includ-ed in food supply summaries but the report does not dealwith their production. It is recognized that fish and oth-er seafoods are an important source of human food forwhich demand is increasing and that, because currentharvest of many of the world’s fisheries is at or beyondsustainable capacity, increases in production are expect-ed to come from aquaculture (New, 1997). Aquacultureis, in fact, the fastest growing food-production systemglobally (Pinstrup-Andersen et al., 1997). Increasedaquaculture production will compete with the productionof other animals, particularly poultry and pigs, for feedresources. Aquatic species are quite efficient in the useof feed resources but an expansion of aquaculture willrequire increased supplies of feed grains and proteinsupplements.
The important topics of animal well-being and foodsafety have been comprehensively reviewed in recentCAST publications (Council for Agricultural Science andTechnology, 1997b, 1998) and are therefore not includ-ed here.
The terms “animal” and “livestock” are used inter-changeably to refer to the production or product from thefood-producing species listed, including poultry. The in-ternational term “maize” is used for the crop usuallycalled corn in the United States. The unit used for landarea is hectares (ha) (1 hectare = 2.47 acres). The jouleis used as the measure of energy.
Throughout the report, the term “food” refers to hu-man food and “feed” to materials consumed by domesticanimals.
The principal data source used is FAOSTAT (http://apps.fao.org), the database of the Food and AgricultureOrganization of the United Nations. Although later sum-maries are available for a number of items, in the inter-ests of consistency, the year 1993 (in most cases, theaverage of 1992 through 1994) was used in most sum-
maries. It is noted that global production of all edibleanimal products was appreciably higher in 1995 thanin 1993, i.e., beef + 4%; sheep and goat meat + 6%; pork+ 11%; poultry meat + 15%; milk + 4%; eggs + 12%, con-sistent with the recent and projected increases present-ed in the report.
Population projections used were those from theUnited Nations (1996), i.e., 7.67 billion in the year 2020.We note that the 1998 projection has been revised down-ward to 7.50 billion.
The conversion rate of feed resources into usableproduct, i.e., the amount of meat, milk, or eggs per unitof input, is a key factor in determining the net contri-bution of animal agriculture to human food supply. Asshown by the results of the case studies in this report,conversion rates vary among species, production sys-tems, and products. As also shown by those analyses,there are large differences between conversion ratesbased on total inputs and inputs of human-edible ma-terials; it is obviously the latter that determine effecton human food supply.
Conversion rates also depend on the endpoint cho-sen. Animal producers often use “feed consumed perpound of live weight gain,” which is a useful measurefor comparing efficiency of different feeds or groups ofanimals. However, the endpoint, live weight, is greaterthan the amount of human food available. Carcassweight is much closer to the actual amount of food frommeat animals and is the endpoint generally used in thisreport. Obviously, it includes bone and some fat trimthat is not consumed and a case could be made for useof trimmed cuts. However, trimming standards varymarkedly between countries and for different kinds ofmeats and there is no single standard suitable for useon a global basis. Trimming losses from meat are anal-ogous to milling losses from cereal grains and thus useof carcass weight represents a reasonable basis for com-paring amounts of food from meat animals with thatfrom plant sources.
for and means of meeting the projected demand foranimal products, considering also the goals of ensur-ing adequate supplies of other foods and maintainingrural livelihoods and the resource base on which fu-ture food production depends.
Notes and Explanations
Box 1

10 Role of Animal Agriculture in the Human Food Supply
30
20
10
0
Per
cent
60
1973 1993
50
40
Developed world
1973 1993
Developing world
CaloriesProtein
Year
World population is projected to increase to 7.7 bil-lion by the year 2020 (United Nations, 1996; mediumvariant), equivalent to an average annual compoundgrowth rate of approximately 1.2% for the period 1995to 2020. Thus, total food supply must increase at leastthis rapidly to maintain current per capita supplies.However, the majority (95%) of the population in-crease is forecast to occur in developing countries,where 77% of people live and where the recent trendof increased per capita consumption of meat, milk, andeggs is predicted to continue. Thus, demand for foodsof animal origin is expected to increase more rapidlythan total population.
Livestock have long played a key role in supplyingcalories and protein for human food in virtually allparts of the world, both directly (in the form of ani-mal products) and indirectly (from the contributionof manure and draught power to crop production andthe generation of income to enable purchase of food).
Current Consumption andProjected Demand for Foods of
Animal OriginIn the first half of the 1990s, residents of developed
countries consumed as food 78 kg of meat and 22 kgof fish per capita, with higher amounts of meat in theUnited States and higher amounts of fish in Japan.The corresponding figures for SubSaharan Africawere 12 kg of meat and 8 kg of fish. In developingAsian countries, people ate 18 kg of meat and 11 kgof fish, compared to 46 kg of meat and 9 kg of fish inLatin America (Food and Agricultural Organizationof the United Nations, 1997; Westlund, 1995). Global-ly, average per capita intakes were approximately 35and 14 kg for meat and fish, respectively.
Table 2.1 depicts the proportion of human dietarycalories and protein from animal products in 1973 and1993 in developed and developing countries (Figure2.1). As this table emphasizes, animal products pro-vide a significant proportion of human dietary protein.These data also illustrate that, while current con-sumption of animal products is much lower in devel-
2 Role of Animal Agriculture in the Human Food Supply
Figure 2.1. Annual percent calories per capita from animal prod-ucts. Source: FAO data reported in Delgado et al.,1998.
10
Table 2.1. Percent of human food calories and protein from ani-mal products, 1973–1993 a
Percent of calories Percent of proteinfrom animal productsb from animal products
Region 1973 1983 1993 1973 1983 1993
(%)
China 6 8 15 12 14 28India 5 6 7 12 14 15Other East Asia 7 11 15 21 29 38Other South Asia 8 7 9 19 19 22Southeast Asia 6 6 8 22 23 25Latin America 16 17 18 39 42 46WANAc 10 11 9 21 25 22Sub-Saharan Africa 7 7 7 21 23 20Developing world 8 9 11 19 21 26Developed world 28 28 27 55 57 56United States 31 29 28 68 66 64World 15 15 16 34 34 36
aSource: Delgado et al., 1998. Raw data from FAOSTAT 9/17/97.bAnimal products, using the FAO definition, includes meat and meatproducts, dairy and egg products, and freshwater and marineanimal products. Calculated from three-year moving averages.
cWANA = western Asia and North Africa.

Animal Agriculture and Global Food Supply 11
oping countries, it is increasing much more rapidlythan in developed countries. Table 2.2, showing percapita consumption of selected animal products for thetwo groups of countries, underscores this trend (Fig-ure 2.2). Except for poultry meat, per capita consump-tion of meat, milk, and eggs has changed little overthese two decades in developed countries; in fact, percapita beef consumption has declined. However, indeveloping countries, per capita consumption of all
animal foods has gone up, with that for pork, poultrymeat, and eggs approximately doubling and that formilk increasing nearly 50%.
Projections to 2020Presently, there are no reliable projections of fish
consumption on a global scale for more than a fewyears into the future. The best available projection formilk is an estimated growth rate for total dairy prod-ucts production and consumption in developing coun-tries of about 3.2% per annum through the year 2020(Delgado et al., 1999). This estimate is consistent withan annual per capita growth rate of roughly 1.4%. Asimple projection for fish through 2010 suggests thatconsumption in developing countries will grow from9.3 kg/capita in 1988 to 1990 to 13.7 kg/capita in 2010,a 1.8% per capita growth rate per annum (Westlund,1995).
For meat, the International Food Policy ResearchInstitute (IFPRI) has developed IMPACT, an econo-metric simulation model of world crop and livestockmarkets that predicts demand to the year 2020 (Del-gado et al., 1998; Rosegrant et al., 1995, 1997). Fea-tures of this model are (1) it incorporates detailed in-formation from both developed and developingcountries about present food consumption and supplyrelationships, (2) the livestock sector is relatively dis-aggregated by product, (3) the cereals feed marketsand livestock markets are linked by specified relation-ships, and (4) both feed and meat prices are endoge-nously determined. These features allow the model tomore closely simulate the real world livestock system,where livestock production is tied to the availabilityand cost of feed, yet consumption can be satisfied bytrade, with repercussions for prices and quantities ofcereals and livestock products worldwide.
Total and per capita consumption of meat for 1983(average of 1982 through 1984) and 1993 (average of1992 through 1994) and projected for 2020, based onthe IMPACT model, are shown in Table 2.3 (Figures2.3 and 2.4) for developed and developing countriesand for the United States and China as the most pop-ulous countries in these two groups, respectively. Al-though as recently as the 1980s, people in the devel-oping world consumed just over one-third of the globalsupply of meat, they are now consuming close to half.By 2020, this group is forecast to be consuming 63%of the total. Per capita consumption is forecast tochange little in the developed world and actually todecrease slightly in the United States, while it is pro-jected to increase more than 50% in the developingworld, with a forecast 91% increase in China from
15
10
5
0
kg/y
r/ca
pita
30
1973 1993
25
20
Developed world
1973 1993
Developing world
Mutton & goatBeef
PorkPoultryEggs
Year
Figure 2.2. Per capita consumption (kg/yr) of selected animalproducts in developed and developing countries.Source: FAO data reported in Delgado et al., 1998.
Table 2.2. Annual per capita food consumption (kg) and percentof calories from selected livestock products, 1973 and1993a
Developed countries Developing countries
1973 1993 1973 1993
Commodity kg % kg % kg % kg %
Beef 26 3 25 3 4 1 5 1Mutton and goat 3 1 3 1 1 0b 1 0b
Pork 26 4 29 5 4 2 9 3Poultry 11 1 20 2 2 0b 5 1Eggs 13 2 13 2 2 0b 5 1Milk and products excluding butter 188 9 195 9 29 2 40 3
Meat subtotal 67 10 78 11 11 3 21 6
Totals 268 20 285 21 42 6 65 9
aSources: Delgado et al., 1998. Raw data from FAOSTAT 12/10/97and Rosegrant et al., 1997.
bLess than half a percent.

12 Role of Animal Agriculture in the Human Food Supply
1993 to 2020.Several factors are driving this increased demand
in developing countries. One is their current relativelylow meat, milk, and egg intake levels. Animal prod-ucts are highly nutritious and palatable and add va-riety to diets. As documented in the next chapter, thenutritional benefits of an increase in animal food in-take, where initial levels are low, are substantial, es-pecially for young children. Throughout their evolu-tionary history, humans have consumed foods ofanimal origin, obtained originally by hunting and fish-ing, then for several millennia from domestic animals.Thus, a desire for such foods in the diet is, quite liter-ally, natural.
The proportion of people living in cities, which isincreasing in developing countries at an average rateof 3.5% per year (vs. 0.75% in developed countries),consistently is found to be positively associated withdemand for animal products. For example, per capi-ta consumption of milk and meat is much higher inLatin America, which has a proportion of urban dwell-ers similar to developed countries, than in other de-veloping countries with similar income levels but low-er urban population concentrations. Europeaninfluence and a long tradition of stock raising are like-ly additional factors.
Per capita income is undoubtedly one of the mostimportant factors affecting this demand. Throughoutthe world, as incomes rise, consumption of animalproducts increases, until some “satiety” point is
20400
140
Year
kg/y
r
1980 2000 2020
80
20
60
100
120
40
Developing worldDeveloped worldChinaU. S.
reached, as perhaps is the case in developed countries(Figure 2.3). Industrialization and resulting risingincomes have been greatest in Asia in the past twodecades, which is where the largest increases in ani-mal product consumption, particularly meat, haveoccurred. From the early 1980s to the early 1990s, theannual rate of increase in demand for meat was 5.4%in all of Asia, except India and China, and 8.3% inChina, compared to 1.8% in the United States andeven less in Europe. With its huge population andprojected per capita meat consumption of 63 kg in
Figure 2.3. Per capita meat consumption (kg/yr). Source: FAOdata reported in Delgado et al., 1998.
Table 2.3. Past and projected consumption trends of meat, to the year 2020 a
Annual growth Projected annualof meat growth of meat Total meat consumption Per capita meat consumption
consumption consumption1982–1993 1993–2020 1983 1993 2020 1983 1993 2020
Region (%/yr) (Mt) (kg)
China 8.3 3.2 17 39 89 16 33 63India 3.1 3.0 3 4 8 4 4 7Other East Asia 5.4 2.6 2 4 8 22 44 70Other South Asia 5.4 3.3 1 2 5 6 7 10Southeast Asia 5.4 3.6 4 7 18 11 15 28Latin America 3.2 2.2 15 21 38 40 46 57WANAb 2.6 2.7 5 7 15 20 20 23Sub-Saharan Africa 2.1 3.4 4 5 11 10 9 11Developing world 5.3 2.9 50 89 194 15 21 31Developed world 1.2 0.5 88 99 113 74 78 81United States 1.8 0.6 25 31 37 107 118 114World 2.8 1.8 139 188 306 30 34 40
aSources: Delgado et al., 1998. Raw data prior to 1995 from FAOSTAT (9/17/97) and projections to 2020 from the IFPRI IMPACT model(Rosegrant et al., 1997).
bWANA = western Asia and North Africa.

Animal Agriculture and Global Food Supply 13
Developing world
Developed world
China
U. S.
20400
250
Year
Mt
1980 2000 2020
150
50
100
200
2020, China clearly will be a dominant factor in de-termining global demand for livestock products.
IFPRI projections to 2020 are based on the assump-tion that India, for religious and cultural reasons, willretain its preference for vegetarian diets. If this shouldchange to any significant extent, India, with a popu-lation rapidly approaching one billion, would have amajor effect on world livestock markets.
Recent growth in consumption of different meatsand consumption in 2020 projected from the IMPACTmodel are presented by region in Table 2.4 and Fig-
ures 2.5 and 2.6. In both developed and developingcountries, the largest recent increase and the largestprojected increase are in poultry meat. Total produc-tion of each of the three major meats (beef, pork, poul-try) is forecast to increase in both regions. Table 2.5presents rates of growth in production and total pro-duction (Figure 2.7). The very high annual rates ofincrease from 1983 to 1993 in production of pork, poul-try, and total meat in developing countries, i.e., 6.1,7.4, and 5.2%, respectively, are not expected to besustained, although rates above 2% per year are pro-
Figure 2.4. Total meat consumption (Mt) in the developing anddeveloped world, China, and the United States.Source: FAO data reported in Delgado et al., 1998.
Figure 2.5. Per capita consumption (kg/yr) of beef, pork, andpoultry in the developed and developing world.Source: FAO data reported in Delgado et al., 1998.
Table 2.4. Past and projected consumption trends of various meats, to the year 2020 a
ProjectedAnnual growth annual growth Total consumption Per capita consumption
of meat consumption of meat consumption1982–1993 1993–2020 1983 1993 2020 1983 1993 2020
Region (%/yr) (Mt) (kg)
Developed world Beef 0.1 0.3 32 32 35 27 25 25 Pork 0.9 0.2 34 38 40 29 29 29 Poultry 3.3 0.9 19 26 33 16 20 24 Meat 1.2 0.5 88 99 113 74 78 81
Developing world Beef 3.1 2.8 16 22 47 5 5 7 Pork 6.1 3.0 20 39 85 6 9 13 Poultry 7.4 3.1 10 22 50 3 5 8 Meat 5.3 2.9 50 89 194 15 21 31
aSources: Delgado et al., 1998. Raw data prior to 1995 from FAOSTAT (12/10/97) and projections to 2020 from the IFPRI IMPACT model(Rosegrant et al., 1997).
10
5
0
kg/y
r
35
Beef Poultry
30
25
20
15
PorkDeveloped world
Beef PoultryPorkDeveloping world
19931983
2020

14 Role of Animal Agriculture in the Human Food Supply
jected for each in these countries through 2020. As aresult, developing countries are projected to be pro-ducing by the year 2020 slightly more beef, double thepork, and a fourth more poultry meat than developedcountries (Figure 2.8).
Higher demand in developing countries is expect-ed to increase imports from developed countries. Netimports from developed to developing countries pro-jected by the IMPACT model represent about 13% ofbeef, 2% of pork, and 8% of poultry production in de-veloping countries by 2020.
Figure 2.6. Total consumption (Mt) of beef, pork, and poultry inthe developed and developing world. Source: FAOdata reported in Delgado et al., 1998.
Figure 2.7. Growth of production (%/yr) of beef, pork, and poul-try in the developed and developing world from1982–1993 and estimated from 1993–2020. Source:FAO data reported in Delgado et al., 1998.
Whether or not these projections for regional andglobal demand are met will depend on many factors.The recent economic downturn in several Asian econ-omies may well slow the rate of growth in demand, atleast temporarily. The feasibility of meeting the pro-jected increases and the implications for other com-ponents of the food supply are discussed later in thisreport. What seems clear from these and other pro-jections (U.S Department of Agriculture, EconomicResearch Service, 1996; Food and Agriculture Orga-nization of the United Nations, 1997) is that (1) a very
Table 2.5. Past and projected production trends of various meats, to the year 2020 a,b
ProjectedAnnual growth annual growth Total production Per capita productionof production of production1982–1993 1993–2020 1983 1993 2020 1983 1993 2020
Region (%/yr) (Mt) (kg)
Developed Beef 0.4 0.8 32 33 40 27 25 29 Pork 0.9 0.4 35 37 41 29 29 30 Poultry 2.8 1.2 17 26 37 14 20 27 Meat 1.2 0.8 92 100 124 77 78 89
Developing Beef 2.8 2.4 17 22 42 4 5 7 Pork 6.1 2.8 21 39 84 6 9 13 Poultry 7.4 3.0 9 21 46 3 5 7 Meat 5.2 2.7 51 88 182 15 21 29
aSources: Delgado et al., 1998. Raw data prior to 1995 from FAOSTAT (9/17/97) and projections to 2020 from the IFPRI IMPACT model(Rosegrant et al., 1997).
bMeat includes beef, pork, mutton and goat, and poultry. Annual growth of meat production 1982–1993 is the compound growth rate fromregressions fitted to FAO annual data. Metric tons and kilograms are three-year moving averages centered on the year shown.
30
20
10
0
Mt
90
60
Beef Poultry
80
70
50
40
PorkDeveloped world
Beef PoultryPorkDeveloping world
19931983
2020
3
2
1
0
perc
ent/
year
6
Beef Poultry
8
7
5
4
PorkDeveloped world
Beef PoultryPorkDeveloping world
1982 - 19931993 - 2020

Animal Agriculture and Global Food Supply 15
large increase in demand for foods of animal originover the next two decades is highly probable; (2) de-mand is expected to increase for all of the major meats,milk, and eggs; (3) nearly all (95%) of the increase indemand is expected to occur in developing countries;and (4) although most of the production to meet thisdemand is expected to occur within the countries gen-erating the demand, significant increases in interna-tional trade in animal food products and in feed grainsalso are forecast.
Indirect Contributions of Animalsto Food Supply
Contributions to Crop Production
Draught PowerHorses were used as the main source of power for
cultivating land in developed countries, e.g., the Unit-ed States and western Europe, until the twentiethcentury, when they were replaced by motorized pow-er. In contrast, draught animals (usually cattle, buf-falo, donkeys, horses, mules, or camels) and even hu-mans still provide the major source of power forcultivation in many developing countries—enough tocultivate at least 320 million ha (Food and Agricul-tural Organization of the United Nations, 1997) (Fig-ures 2.9–2.14). In some countries, donkeys are impor-tant for transport (Zenebe and Fekade, 1997).Although use of animals for transportation is impor-tant, provision of draught power remains much moreso; it is estimated that for every 10 African farmers
Figure 2.8. Pigs produce more meat than any other animal spe-cies in both developed and developing countries.
Figure 2.9. Buffalo used in preparation of a paddy for plantingrice, Indonesia. Photograph courtesy of EricBradford, University of California, Davis.
Figure 2.10. Buffalo used for transportation in China. Photo-graph courtesy of Eric Bradford, University of Cali-fornia, Davis.
Figure 2.11. Cowpea fodder transported by donkey in Niger.Photograph courtesy of David Elsworth, Interna-tional Livestock Research Institute, Nairobi, Kenya.

16 Role of Animal Agriculture in the Human Food Supply
Figure 2.12. Camels used for transportation in Senegal. Pho-tograph courtesy of Eric Bradford, University ofCalifornia, Davis.
Figure 2.13. Millet transported by oxen near Niamey in Niger.Photograph courtesy of David Elsworth, Interna-tional Livestock Research Institute, Nairobi, Kenya.
Figure 2.14. Akamba people in the Machakos District of Kenyausing oxen for plowing. Photograph courtesy ofDavid Elsworth, International Livestock ResearchInstitute, Nairobi, Kenya.
using animal power in crop production, only one usesa cart for transportation (Dawson and Barwell, 1993).
Farmers owning draught animals tend to have larg-er farms than those not owning animals, suggestingthat access to draught animals increases the area thatcan be cultivated (Francis, 1988; Sumberg and Gilbert,1992). This may be due to labor savings associatedwith the use of draught animals. In central Nigeria,for example, draught animals decrease the time forland preparation for rice production from 315 hours/ha to 94 hours/ha (Lawrence et al., 1997). However,draught animals also can impose additional laborcosts. Delgado and McIntire (1982) concluded that themain barrier to draught animal adoption is the costof the extra labor associated with maintaining the oxteam. Panin (1987), on the other hand, comparedmanual hoeing to bullock traction and concluded that
the latter was technically and economically superior.Bullock traction reduced labor bottlenecks and short-ened fieldwork time. One constant between thesestudies is that sufficient land must be available topermit expansion of cropping activities, notably cashcrops such as groundnuts or cotton. In Ethiopia, Gry-seels et al. (1984) observed a positive relationshipbetween the number of oxen owned by a farmer andboth the area cultivated and the percentage of landsown to marketable cereals. However, extending cul-tivation into less suitable, marginal land may lead toenvironmental degradation and poor crop yields(Kruit, 1994).
Continuing to use animal power instead of pro-gressing to fossil-fueled mechanized power has savedmillions of dollars in foreign exchange. Ramaswamy(1985) estimated that 30 million tractors would berequired to replace the 300 million draught animalsused on small farms in Asia. In some systems, e.g.,Southeast Asia, draught animal power has been partlyor largely replaced by mechanical equipment. This isparticularly true wherever irrigation becomes avail-able and the intensity of production, in combinationwith favorable crop prices, ensures the viability ofmechanization (Bunyavejchewin et al., 1993). A num-ber of other factors seem to be associated with theadoption of machinery, such as improvements in ru-ral infrastructure, especially road construction, andraising educational standards. For example, in Nige-ria, the promotion of primary school education hasdecreased the time children can spend caring for an-imals and thus has increased the cost of keeping cat-tle in tethered or cut-and-carry systems (ResourceInventory and Management, Ltd., 1992).

Animal Agriculture and Global Food Supply 17
Figure 2.15. Confinement sheep and goat housing,cut-and-carry system in Indonesia. An importantproduct of this system is manure (fertilizer) for foodcrop production. Photograph courtesy of EricBradford, University of California, Davis.
Figure 2.16. Dung collection to use for fuel and land applicationin Nigeria. Photograph courtesy of David Elsworth,International Livestock Research Institute, Nairobi,Kenya.
It should be noted that, in many countries, draughtanimals are not kept solely for traction. There is in-creasing interest in using milking cows for draughtpurposes (Zerbini et al., 1996). Draught animals alsoare crucial to manure production, which becomes in-creasingly important as fallow periods decrease andaccess to commercial fertilizers is limited. Crop resi-dues and agricultural by-products are a major sourceof feed for draught animals; in some regions, remov-al of these waste products may be an added advan-tage.
Nutrient RecyclingMost soils lack sufficient native fertility to sustain
efficient crop production. While global fertilizer useincreased from 81 to 96 kg/ha of cropland, fertilizeruse in subSaharan Africa in 1988 to 1990 was estimat-ed to be only 11 kg/ha of harvested land, a rate pro-jected to increase to only 21 kg/ha harvested land by2020 (Food and Agricultural Organization of the Unit-ed Nations, 1993). Crop response to manure variesaccording to plant and soil types, agro-ecologicalzones, and manure quality (Figure 2.15). McIntire etal. (1992) estimated increases in grain yield rangingfrom 15 to 86 kg grain per ton of manure applied tocropland. Powell (1986) reported a response of 180 kgmaize grain per ton of manure applied in the subhu-mid zone of Nigeria. An added benefit is the residualpositive effect of manure, which may persist for up tothree cropping seasons after application (Ikombo,1989; Powell et al., 1998).
Smaling et al. (1992) compared the effects on maizeyield of manure and chemical fertilizers, separatelyand in combination. Manure increased yields similarly
to the best chemical fertilizer treatment on two ofthree soil types. On all three soil types, highest yields,but not consistently the highest economic returns,resulted from the chemical/manure combination.
The economic value of manure is recognized notonly in developing countries but in developed coun-tries as well (Mullinax et al., 1998).
More information on the contributions of animalagriculture to recycling plant nutrients and maintain-ing soil fertility is provided by Romney et al. (1994),de Haan et al. (1997), and Powell et al. (1995, 1998).
Contributions of Livestock to FoodAccessibility
Livestock as a Cash SourceIn many countries, access to food is limited not by
availability but by purchasing power. For example,grain production in Ethiopia has increased and thecountry has become a net exporter. Yet, some of theirexport has been purchased by the European Commu-nity (EC) for distributing to poor Ethiopians!
Livestock frequently are sold by poor people to gen-erate cash to purchase food in times of stress, such asduring a drought. In Kenya, farmers use cash gener-ated from dairy cattle production to purchase inputs,e.g., fertilizer, for crop production. The purchased fer-tilizer and manure from the animals can contributeto improved soil fertility and higher crop yields.
Livestock as a Balance for Crop ProductionGrain prices and levels of production fluctuate from
year to year. Livestock serve to balance fluctuations

18 Role of Animal Agriculture in the Human Food Supply
by providing a means of using excess grains in timesof surplus. Therefore, livestock help to support a baseprice for grains and a reserve that can be shifted tohuman use if there are shortages. Livestock representa principal means of using and “storing” residues, by-products, and grains when there are surplus suppliesand prices are low. The potential human food repre-sented by animals “on the hoof” is an important as-pect of food security where other food reserves maynot be available.
Manure as FuelIn some countries, notably in South Asia, animal
dung has an important use as cooking fuel. The de-sired consistency of the dung influences the diet se-lected by farmers for their cattle (Figure 2.16) (Thorneand Herrero, 1998).
Nonfood Livestock Products as a Cash SourceIn addition to food products, livestock produce fi-
ber, skins, draught power, and manure, which can besold if not used by the owner.

Animal Agriculture and Global Food Demand 19
19
The relationship between consumption of animalproducts and human nutrition and health in highlydeveloped western countries, particularly the UnitedStates, has been widely debated for a number of years.A recent publication from the Council on Agricultur-al Science and Technology (CAST) discussed theseissues in depth (Council for Agricultural Science andTechnology, 1997a). Favorable contributions to healthfor which there seems to be general agreement includethe fact that animal products are quantitatively im-portant sources of energy and protein in both devel-oped and developing country diets—27 and 63%, re-spectively, in the United States and 16% and 36%,respectively, on a global basis (Table 2.1, Figure 2.1,Figures 3.1–3.2). Animal proteins have higher digest-ibilities (96 to 98%) than most plant proteins (65 to70%). Furthermore, the amino acid composition ofanimal proteins is superior to that of plants. The bio-logical values of animal proteins range from 90 to 100,relative to egg protein—the reference protein set to100 by convention—while values for plant proteinsrange from 50 to 70%. The bioavailabilities of impor-tant minerals (including calcium, phosphorus, iron,zinc, magnesium, and manganese) and vitamins (thi-amin [B1], riboflavin [B2], niacin, pyridoxine [B6], andB12) are much higher in animal as opposed to most
3 Role of Animal Products in Human Nutritionand Health
plant products.Negative concerns regarding foods of animal origin
center on cholesterol and saturated fatty acid content.Implications of these issues regarding human healthhave been publicized and remain highly controversial(Council for Agricultural Science and Technology,1997a). It should be noted that the favorable charac-teristics of animal products are based on strong, rig-orous experimental data, while the negative effectsattributed to animal products are and have long beenbased on statistical inference. As is appropriate inscience, statistical inference must be questioned un-til experimental data establishing direct cause andeffect relationships are available. This point was madestrongly in the 1980 publication of the Food and Nu-trition Board of the National Research Council (NRC)entitled Toward Healthful Diets and renewed byHarper in his 1993 publication, “Challenge of DietaryRecommendations to Curtail Consumption of AnimalProducts.” The point was that “Association amongdiet, serum cholesterol, and HD [heart disease] mor-tality have proven weak. Interventions to lower serumcholesterol have reduced HD mortality only margin-ally and have not reduced total mortality” (Harper,1993). The continuously changing recommendationsarising from statistical inference reinforce the weak-
Figure 3.1. Milk sales in Kenya. Photograph courtesy of DavidElsworth, International Livestock Research Institute,Nairobi, Kenya.
Figure 3.2. Beef carcass with ribeye exposed. Photographcourtesy of Martin Vavra, Oregon State University,Burns, Oregon.
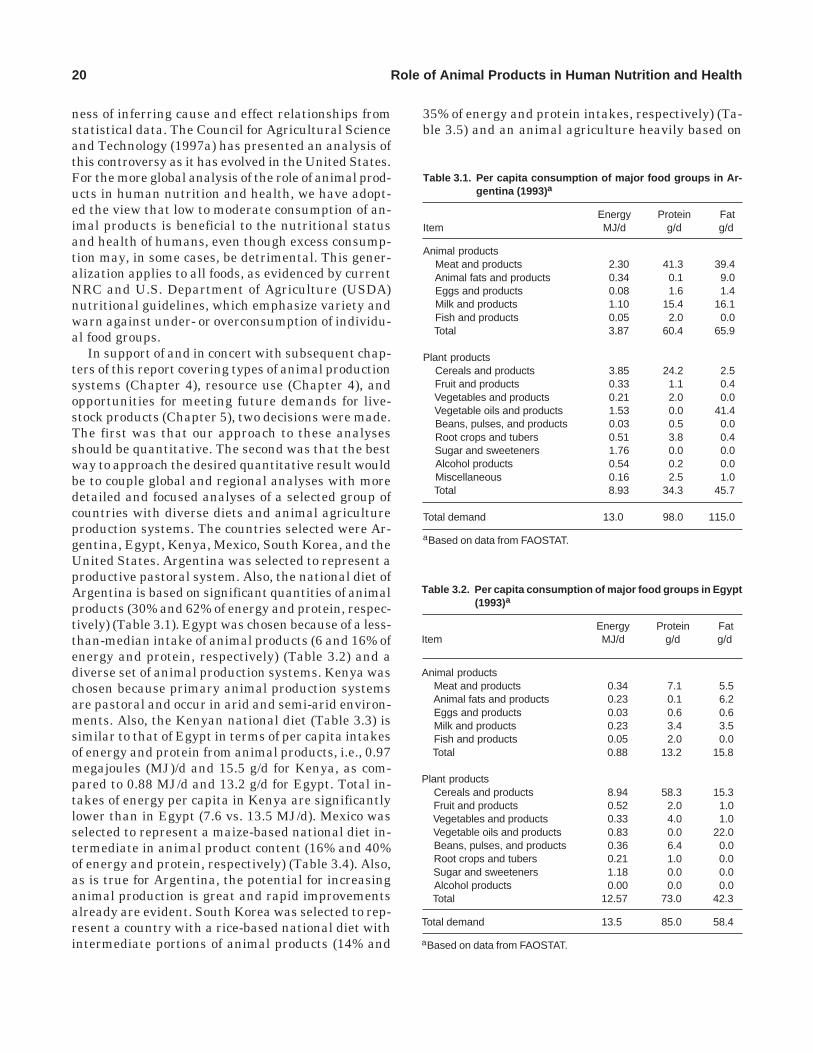
20 Role of Animal Products in Human Nutrition and Health
ness of inferring cause and effect relationships fromstatistical data. The Council for Agricultural Scienceand Technology (1997a) has presented an analysis ofthis controversy as it has evolved in the United States.For the more global analysis of the role of animal prod-ucts in human nutrition and health, we have adopt-ed the view that low to moderate consumption of an-imal products is beneficial to the nutritional statusand health of humans, even though excess consump-tion may, in some cases, be detrimental. This gener-alization applies to all foods, as evidenced by currentNRC and U.S. Department of Agriculture (USDA)nutritional guidelines, which emphasize variety andwarn against under- or overconsumption of individu-al food groups.
In support of and in concert with subsequent chap-ters of this report covering types of animal productionsystems (Chapter 4), resource use (Chapter 4), andopportunities for meeting future demands for live-stock products (Chapter 5), two decisions were made.The first was that our approach to these analysesshould be quantitative. The second was that the bestway to approach the desired quantitative result wouldbe to couple global and regional analyses with moredetailed and focused analyses of a selected group ofcountries with diverse diets and animal agricultureproduction systems. The countries selected were Ar-gentina, Egypt, Kenya, Mexico, South Korea, and theUnited States. Argentina was selected to represent aproductive pastoral system. Also, the national diet ofArgentina is based on significant quantities of animalproducts (30% and 62% of energy and protein, respec-tively) (Table 3.1). Egypt was chosen because of a less-than-median intake of animal products (6 and 16% ofenergy and protein, respectively) (Table 3.2) and adiverse set of animal production systems. Kenya waschosen because primary animal production systemsare pastoral and occur in arid and semi-arid environ-ments. Also, the Kenyan national diet (Table 3.3) issimilar to that of Egypt in terms of per capita intakesof energy and protein from animal products, i.e., 0.97megajoules (MJ)/d and 15.5 g/d for Kenya, as com-pared to 0.88 MJ/d and 13.2 g/d for Egypt. Total in-takes of energy per capita in Kenya are significantlylower than in Egypt (7.6 vs. 13.5 MJ/d). Mexico wasselected to represent a maize-based national diet in-termediate in animal product content (16% and 40%of energy and protein, respectively) (Table 3.4). Also,as is true for Argentina, the potential for increasinganimal production is great and rapid improvementsalready are evident. South Korea was selected to rep-resent a country with a rice-based national diet withintermediate portions of animal products (14% and
35% of energy and protein intakes, respectively) (Ta-ble 3.5) and an animal agriculture heavily based on
Table 3.1. Per capita consumption of major food groups in Ar-gentina (1993) a
Energy Protein FatItem MJ/d g/d g/d
Animal products Meat and products 2.30 41.3 39.4 Animal fats and products 0.34 0.1 9.0 Eggs and products 0.08 1.6 1.4 Milk and products 1.10 15.4 16.1 Fish and products 0.05 2.0 0.0 Total 3.87 60.4 65.9
Plant products Cereals and products 3.85 24.2 2.5 Fruit and products 0.33 1.1 0.4 Vegetables and products 0.21 2.0 0.0 Vegetable oils and products 1.53 0.0 41.4 Beans, pulses, and products 0.03 0.5 0.0 Root crops and tubers 0.51 3.8 0.4 Sugar and sweeteners 1.76 0.0 0.0 Alcohol products 0.54 0.2 0.0 Miscellaneous 0.16 2.5 1.0 Total 8.93 34.3 45.7
Total demand 13.0 98.0 115.0
aBased on data from FAOSTAT.
Table 3.2. Per capita consumption of major food groups in Egypt(1993)a
Energy Protein FatItem MJ/d g/d g/d
Animal products Meat and products 0.34 7.1 5.5 Animal fats and products 0.23 0.1 6.2 Eggs and products 0.03 0.6 0.6 Milk and products 0.23 3.4 3.5 Fish and products 0.05 2.0 0.0 Total 0.88 13.2 15.8
Plant products Cereals and products 8.94 58.3 15.3 Fruit and products 0.52 2.0 1.0 Vegetables and products 0.33 4.0 1.0 Vegetable oils and products 0.83 0.0 22.0 Beans, pulses, and products 0.36 6.4 0.0 Root crops and tubers 0.21 1.0 0.0 Sugar and sweeteners 1.18 0.0 0.0 Alcohol products 0.00 0.0 0.0 Total 12.57 73.0 42.3
Total demand 13.5 85.0 58.4
aBased on data from FAOSTAT.

Animal Agriculture and Global Food Demand 21
by-products and imports. The United States was in-cluded as a representative developed country, withrelatively high intakes of animal products (27% and63% of energy and protein, respectively). In addition
to the current U.S. food intake patterns (Table 3.6),data on dietary trends in the United States during thetwentieth century are presented in Table 3.7.
The countries selected cover a range of diets that
Table 3.5. Per capita consumption of major food groups in SouthKorea (1993) a
Energy Protein FatItem MJ/d g/d g/d
Animal products Meat and products 0.99 11.1 21.0 Animal fats and products 0.19 0.1 5.1 Eggs and products 0.15 2.9 2.6 Milk and products 0.12 2.0 1.0 Fish and products 0.39 14.0 3.0 Total 1.84 30.1 32.7
Plant products Cereals and products 6.61 31.0 4.0 Fruit and products 0.28 1.0 0.0 Vegetables and products 0.62 9.0 2.0 Vegetable oils and products 1.00 0.0 27.0 Beans, pulses, and products 0.15 3.0 1.0 Root crops and tubers 0.14 1.0 0.0 Sugar and sweeteners 1.21 0.0 0.0 Alcohol products 1.05 1.0 0.0 Total 11.39 53.0 39.0
Total demand 13.5 86.0 74.0
aBased on data from FAOSTAT.
Table 3.3. Per capita consumption of major food groups in Kenya(1993)a
Energy Protein FatItem MJ/d g/d g/d
Animal products Meat and products 0.31 6.4 5.1 Animal fats and products 0.04 0.0 1.2 Eggs and products 0.01 0.3 0.2 Milk and products 0.58 6.8 7.6 Fish and products 0.04 2.0 0.0 Total 0.97 15.5 14.1
Plant products Cereals and products 3.78 24.0 9.0 Fruit and products 0.22 1.0 0.0 Vegetables and products 0.06 1.0 0.0 Vegetable oils and products 0.66 0.0 18.0 Beans, pulses, and products 0.18 3.0 0.0 Root crops and tubers 0.66 2.0 0.0 Sugars and sweeteners 0.75 0.0 0.0 Alcohol products 0.11 0.0 0.0 Total 6.61 31.0 29.0
Total demand 7.58 47.0 43.1
aBased on data from FAOSTAT.
Table 3.6. Per capita consumption of major food groups in theUnited States (1993) a
Energy Protein FatItem MJ/d g/d g/d
Animal products Meat and products 1.77 38 28 Fats and products 0.50 0 14 Eggs and products 0.21 4 4 Milk and products 1.52 22 21 Fish and products 0.09 5 1 Total 4.09 69 68
Plant products Cereals and products 3.53 25 3 Fruit and products 0.52 1 1 Vegetables and products 0.26 3 1 Vegetable oils and products 2.39 0 65 Beans, pulses, and products 0.45 2 0 Root crops and tubers 0.42 3 0 Sugar and sweeteners 2.58 0 0 Alcohol products 0.66 1 0 Total 10.91 40 76
Total demand 15.1 109 145
aBased on data from FAOSTAT.
Table 3.4. Per capita consumption of major food groups inMexico (1993) a
Energy Protein FatItem MJ/d g/d g/d
Animal products Meat and products 0.93 14.0 16.4 Animal fats and products 0.30 0.0 8.1 Eggs and products 0.18 3.3 2.8 Milk and products 0.66 9.9 7.9 Fish and products 0.09 3.0 1.0 Total 2.16 30.0 36.2
Plant products Cereals and products 6.10 38.0 13.0 Fruit and products 0.44 2.0 1.0 Vegetables and products 0.10 1.0 0.0 Vegetable oils and products 1.22 0.0 33.0 Beans, pulses, and products 0.48 6.0 0.0 Root crops and tubers 0.10 0.0 1.0 Sugar and sweeteners 2.11 0.0 0.0 Alcohol products 0.26 0.0 0.0 Total 10.99 49.0 50.0
Total demand 13.2 83.0 87.0
aBased on data from FAOSTAT.

22 Role of Animal Products in Human Nutrition and Health
reflect a diversity of agricultural, particularly animal,production systems (see Chapter 4). Another reasonfor including Egypt, Kenya, and Mexico is that anexcellent, complete, cooperative study of diets of chil-dren in Egypt, Kenya, and Mexico has been carriedout. This study, the Human Nutrition CollaborativeResearch Support Program (NCRSP) sponsored by theOffice of Nutrition, Bureau for Science and Technol-ogy, U.S. Agency for International Development (Cal-loway et al., 1992), was selected to help focus our dis-
cussion of several critical issues relevant to nutritionalbenefits potentially arising from consumption of ani-mal products by children. Several data from this studyare summarized in Table 3.8.
Taken in aggregate, the countries selected (Tables3.1–3.6) present a wide range of national diets. Aver-age daily per capita intakes of total energy, protein,and fat were highest in the United States at 15 MJ,109 g, and 145 g, respectively. The other countriesranged from 7.6 (Kenya) to 13.5 MJ/d (Egypt andKorea) for total energy, from 47 (Kenya) to 98 g/d (Ar-gentina) for protein, and from 43 (Kenya) to 115 g/d(Argentina) for fat. Percentages of energy from fatranged from 16 (Egypt) to 36 (United States), whilepercentages of total energy from animal fats rangedfrom 4 (Egypt) to 19 (Argentina). Percentages of totalprotein from animal sources ranged from 16 (Egypt)to 63 (United States); the contribution of meat rangedfrom 8 (Egypt) to 42 (Argentina), milk from 2 (Korea)to 20 (United States), eggs from 1 (Egypt, Kenya) to 4(Mexico, United States), and fish from 2 (Argentina)to 16 (Korea). Thus, the data presented in Tables 3.1–3.6 illustrate that a range of national diets exists andthat these can, for the most part, satisfy the nutrition-al needs of a population. Basically, the national dietsreflect the agricultural opportunities for food produc-tion in each region and the balancing of food produc-tion opportunities with human nutritional needs.
Table 3.7. Food consumption per capita per year by major foodgroups in the United States through time a
Food Group 1909–1913 1957–1959 1977 1986 1993
Meatb 64 65 73 55 51Poultry 8.2 15.4 24.5 21.4 27.7Fish 5.9 5.9 7.7 7 6.8Eggs 16.8 21.3 15.4 14.8 13.7Total dairyc 161 217 204 269 260Butter 8.2 3.6 1.8 2.1 2Fats and oils 18.6 22.2 26.8 29.2 29.5Total cereals 132 67.2 64.9 73.5 85.8Sugars and sweeteners 40.4 48.1 59.4 58.8 66.7
aSources: USDA Statistics. All values in kg/year.bLargely ruminant and pig meats.cIncludes all dairy products (fluid milk, cheese, butter, etc.).
Table 3.8. Per capita consumption of major food groups by toddlers and school children in Egypt, Kenya, and Mexico a
Toddlers (18–30 months) School children (7–9 years)
Item Egypt Kenya Mexico Egypt Kenya Mexico
Animal products (% energy) Meat and products 5.8 0.5 2.8 5.5 0.7 2.3 Animal fats and products 6.2 0.1 1.5 5.6 0.1 1.3 Eggs and products 1.1 0.2 2.5 0.7 0.0 1.9 Milk and products 4.8 6.8 6.3 4.1 2.4 2.1
Plant products (% energy) Cereals and products 48.2 52.5 58.0 57.4 65.8 70.6 Fruit and vegetable 4.3 3.1 1.3 4.5 3.3 1.4 Legumes and nuts 4.2 9.9 7.4 4.0 13.8 6.5 Vegetable fats 7.4 3.2 7.3 7.3 2.7 5.7 Root crops and tubers 3.2 17.9 2.0 3.0 7.8 1.2 Sugar, etc. 14.8 5.8 10.3 7.9 3.6 6.2
Totals Energy (MJ/d) 5.0 3.5 4.6 7.4 6.0 7.8 Proteins (g/d) 35.8 23.1 33.1 54.3 42.5 53.2 Animal protein (g/d) 13.5 3.8 9.6 17.5 2.9 10.1
aData from Beaton et al., 1992 and Murphy et al., 1995.

Animal Agriculture and Global Food Demand 23
These adaptations of human populations to local foodproduction and distribution opportunities will contin-ue, economic necessities, drought, global warming,and other factors notwithstanding. However, modernagricultural and human nutritional research can andshould provide the bases for more appropriate adap-tations to optimize nutrition and health. Energy in-takes in the several countries are all between 12 and15 MJ/d, with the exception of Kenya, where energyintakes calculated from available data are only 7.6 MJ/d, a surprisingly low value. Protein intakes in mostcountries are in the 80 to 100 g/d range, with 30% ormore derived from animal products, indicating pro-tein and amino acid adequacy. Of concern is Egypt,where only 16% of protein is derived from animalproducts; however, the Egyptian intake of 85 g totalprotein/d should be adequate, even given the lowlysine content of cereal grain-derived products thatcontribute 69% of the total diet protein. A more prom-inent concern is the low protein intake of 47 g/d inKenya, despite an appropriate balance between ani-mal and plant proteins. The marginal total proteinintake in Kenya, coupled with the low energy intake,suggests that protein would be used as a source ofenergy, which could result in deficiencies in specificor limiting amino acids. This danger would be great-est in growing children and is a common situation ina number of low-income African and Asian countries.
The data presented in Table 3.8 from the HumanNutritional Collaborative Research Support Program(NCRSP) study (1992) illustrate the diets available totoddlers and schoolchildren in three example coun-tries where growth and development of children arebelow reference values. In addition to reduced growth,Kenyan children exhibited diet-associated depres-sions in the development of cognitive abilities (Sigmaet al., 1989). Energy intake by Kenyan toddlers was68% of average intakes by Egyptian and Mexican tod-dlers that are, on average, normal and consideredadequate. Similarly, energy intake by Kenyan school-children was below those in Egypt and Mexico, con-sidered adequate to support normal growth. Both to-tal protein and animal protein intakes in Kenyanchildren were marginal, especially when most of theanimal protein was from milk and milk products (Ta-ble 3.8), foods particularly low in methionine, zinc, andiron. Total protein and amino acid intakes of Egyp-tian and Mexican children were deemed adequate tosupport normal growth, according to the NCRSP sum-mary report. This observation led to a very detailed,multivariate analysis of nutrients potentially limitingto growth in the three countries. In Kenya, it wasdetermined that increasing energy intake was most
important. Additional nutrient inadequacies identi-fied in the Kenyan diet were iron, zinc, calcium, andvitamins B12, D, and E. Nutrient inadequacies identi-fied in the Mexican diet were iron, zinc, vitamins A,B12, C, D, E, and riboflavin. Deficiencies in Egypt wereiron, calcium, and vitamins A and D. The high avail-abilities of iron, zinc, vitamin B12, and riboflavin inmeat and calcium in milk led to a general recommen-dation in the NCRSP report that animal products—meat in particular—be increased in the diets of chil-dren in these countries. These data and observationsclearly illustrate the value of animal products in thediet for human growth, health, and well-being.
Authors of a recent CAST report (Council for Agri-cultural Science and Technology, 1997a) emphasizedthat, although overconsumption of saturated fats inruminant meat generally is recognized as being un-desirable, total fat consumption is the primary healthconcern with regard to heart disease, atherosclerosis,and other vascular diseases. Although statistical in-ference, e.g., on saturated fatty acid intake vs. prema-ture death, polyunsaturated fatty acid intake vs.breast cancer, is suspect, let us accept the assumptionthat excessive saturated fat and high total fat intakecan negatively impact human health. Fat intakes inEgypt, Kenya, Mexico, and South Korea range be-tween 16 and 25% of total energy intake (Tables 3.3–3.5), well within the range of current NRC and USDArecommendations, as are intakes of animal fats of notmore than 10% of total energy. Residents of thesecountries do not seem to be at risk because of theirfat intakes. In Argentina, fats provide 33% of totalenergy intake, of which 57% is of animal origin (cor-responding U.S. values are 36 and 47%). These val-ues are on the high side but fit well with current foodproduction practices in these countries.
Considerable attention has been focused on con-sumption of ruminant and pig meats in the UnitedStates over the past 30 years. This has led to a de-crease in per capita consumption of these meats from65 to 75 kg/yr from 1909 to 1977 to 51 kg/yr in 1993(Table 3.7). In contrast, consumption of poultry meatshas increased from 8.2 kg/yr in 1909 to 27.7 kg/yr in1993, while consumption of fish remained approxi-mately constant. Egg consumption decreased from ahigh of 21.3 kg/yr to a current low of 13.7 kg/yr. Themost dramatic change in animal products in the U.S.diet has been the drop in per capita butter consump-tion, from 8.2 kg/yr in 1909 to 3.6 in 1957—coincidentwith the availability of margarine—and to 2.0 kg/yrin 1997. The decreases in ruminant meat and butterconsumption are considered beneficial by many nu-tritionists. However, what frequently is not noted is

24 Role of Animal Products in Human Nutrition and Health
that total consumption of fats and oils increased from18.6 to 29.5 kg/yr between 1909 and 1993, cereal con-sumption has decreased from 132 to 85.8 kg/yr, andconsumption of sugars has increased from 40.4 to 66.7kg/yr (Table 3.7). Based on current NRC and USDArecommendations, all these changes are undesirable.
It should become clear when comparing the trendsin food intakes presented in Table 3.7 that currentdietary recommendations of national agencies and
views promulgated by advocate organizations havenot defined an optimum nutritional strategy for hu-mankind. In context with the brief discussion present-ed here with regard to diets of children and the largevariance in national diets, any number of diets areavailable that can satisfy human requirements as longas they supply adequate amounts of energy, aminoacids, and micronutrients.

Animal Agriculture and Global Food Supply 25
Domestic animals evolved initially as scavengers,obtaining their food from materials not otherwiseusable by humans and converting these into food, fi-ber, work, and other products useful to humans. Thisbasic role of domestic animals (i.e., extracting andconcentrating value from low-cost inputs) remainsimportant today. As animal agriculture has evolvedin response to market requirements, the nutritionaldensity and quality of diets has been improved. Nev-ertheless, even in market-oriented production sys-tems, the value of the product far exceeds the valueof the inputs.
Production SystemsAnimal production systems have been classified
(Seré and Steinfeld, 1996) into three broad categories:grazing, mixed crop-livestock, and industrial (land-less). Stratified systems combine elements of two orall three. These systems often involve different spe-cies of animals, use different resources, and differgreatly in animal productivity. All contribute usefulproducts or services. Table 4.1 presents the quantityof livestock products produced by grazing, mixed crop-livestock, and industrial systems. Globally, mixedcrop-livestock systems produce the largest quantities
of animal products. Only in poultry meat and egg pro-duction does the industrial system surpass the mixedsystem.
De Haan et al. (1997) have estimated the growthrates for these systems from 1982–1983 to 1992–1993and found that mixed systems are growing most rap-idly. However, it is uncertain if the predominance ofthe mixed system will prevail over the long term. Forexample, with rapid economic growth in the develop-ing world and increased demand for pork and poul-try products, there may be a greater shift toward in-dustrial systems. In the Organization for EconomicCooperation and Development (OECD), i.e., the mostindustrialized countries, the amount of pig meat andeggs produced in the industrial system has increasedto 54.2 and 87.9% vs. the 39.3 and 67.9%, respective-ly, in the global total (Table 4.1). This indicates that,as urbanization occurs and the demand for meat prod-ucts increases, industrial systems are capable of fill-ing newly generated demand.
Grazing SystemsBy definition, grazing systems involve herbivores
grazing native rangelands, tame grasslands, and oth-er lands that usually are not suited for food crop pro-
4 Animal Production Systems and Resource Use
25
Table 4.1. Quantity (1,000 t) and percent of global livestock products produced by the three ma-jor production systems a
Grazing Mixed crop-livestock Industrial
Product 1,000 t % 1,000 t % 1,000 t %
Beef and veal 12,289 23.4 34,249 65.1b 6,055 11.5Buffalo 0 0.0 2,652 100.0b 0 0.0Sheep and goat 2,981 30.0 6,860 69.0b 100 1.0Pig meat 685 1.0 42,821 59.8b 28,163 39.3Poultry meat 796 1.8 10,469 24.2b 31,967 73.9Eggs 524 1.3 12,289 30.8b 27,071 67.9Dairy milk 38,775 8.2 434,332 91.8b 0 0.0
aSource: Seré and Steinfeld, 1996.bThe authors list intensive dairy systems as part of mixed crop-livestock systems, which in generalthey are. However, some modern dairy production could also be classified as industrial.

26 Animal Production Systems and Resource Use
duction. Domesticated herbivores (ruminants—cattle,sheep, goats, buffalo; camelids—camels, llamas, alpac-as; equines—horses, mules, donkeys) and, to a lesserextent, harvested game constitute the animal compo-nent in grazing systems (Figures 4.1–4.6). Grazingsystems occur in a wide range of ecozones: arid, semi-arid, tropical/subtropical, and temperate. Livestockproduction in these ecozones is conducted under awide array of production practices stemming fromnatural resource differences and methods of resourceuse. From these various resources, significant portionsof ruminant products are produced (Table 4.1).
Globally, increasing pressures are being placed ongrazing resources as a result of increased human pop-ulation. For example, traditional grazing lands arebeing brought into cultivation to produce food crops,and as a result, livestock use grazing areas for longerperiods each year. This and other factors are leading
Figure 4.1. Extensive sheep and goats grazing in Senegal. Pho-tograph courtesy of Eric Bradford, University ofCalifornia, Davis.
Figure 4.3. Intensive sheep production on seeded pastures inNew Zealand. Photograph courtesy of HowardMeyer, Oregon State University, Corvallis.
Figure 4.2. Camels grazing desert rangeland in Kuwait. Photo-graph courtesy of Martin Vavra, Oregon State Uni-versity, Burns, Oregon.
Figure 4.5. Hereford calf. Most beef cattle everywhere, whethergrazed throughout life or finished in feedlots, areborn and spend most of their life on range or pas-ture. Photograph courtesy of John Dunbar, Univer-sity of California, Davis.
Figure 4.4. Milk sheep grazing in the Roquefort region ofFrance. Photograph courtesy of Eric Bradford, Uni-versity of California, Davis.

Animal Agriculture and Global Food Supply 27
to concern about environmental impacts of grazing onbiodiversity, water resources, and other resources.These issues are discussed further in Chapter 5.
Mixed Farming SystemsMixed crop-livestock systems are the largest ani-
mal production systems in terms of animal numbers,total production, and number of people served (Fig-ures 4.7–4.18). The complementarities between cropsand livestock are critical to ecological and economicstability of farming systems in many regions wherehuman population and demand for food are increas-ing but technology and inputs are not readily avail-able. Key elements in the contribution of livestock aretraction (power), manure (fertilizer), and enhancedincome (cash) (Winrock International, 1992). Moving
Figure 4.7. Tethered goats during the night provide manure fer-tilizer to land in Kenya. Photograph courtesy ofDavid Elsworth, International Livestock ResearchInstitute, Nairobi, Kenya.
Figure 4.6. Supplementing beef cattle with a molasses/urea mixwhen grass is scarce. Photograph courtesy of JohnDunbar, University of California, Davis.
Figure 4.8. Donkey transporting forage in Morocco. Pho-tograph courtesy of Eric Bradford, Universityof California, Davis.
Figure 4.9. Fodder being transported by camels in Niger. Pho-tograph courtesy of David Elsworth, InternationalLivestock Research Institute, Nairobi, Kenya.
across agro-ecosystems and phases of socioeconomicdevelopment, the intensity of technology and the in-teraction with the environment dramatically changethe manner in which mixed systems are constructed.Mixed systems have the capacity to change rapidly as

28 Animal Production Systems and Resource Use
Figure 4.11. Human transport of forage in Indonesia. Photo-graph courtesy of Luis Iniguez, ICARDA, Aleppo,Syria.
Figure 4.10. Fodder being transported by donkey in Kenya.Photograph courtesy of David Elsworth, Interna-tional Livestock Research Institute, Nairobi, Kenya.
Figure 4.13. Stall feeding maize residue in a smallholder dairyin Kenya. Photograph courtesy of David Elsworth,International Livestock Research Institute, Nairobi,Kenya.
Figure 4.12. Human transport of forage in Indonesia. Photo-graph courtesy of Luis Iniguez, ICARDA, Aleppo,Syria.
markets, infrastructure, and income grow. In manyinstances, mixed systems serve as a bridge betweengrazing and industrial systems. Furthermore, theyalso can serve as an element of the stratified system.Generally, as rural population pressure increases andless land becomes available, both crop and livestockproducers need to intensify. McIntire et al. (1992)showed that, as population pressure increases, cropand livestock activities often integrate.
Mixed crop-livestock systems encompass approxi-mately 2.5 billion ha of land, of which 1.1 billion ha isarable rainfed, 0.2 billion ha is irrigated land, and 1.2billion ha is grassland. These systems use both rumi-nants and nonruminants (poultry, pigs). On a globalbasis, mixed farming systems are the principal sourceof meat (54%) and milk (90%). Mixed farming systemsare most successful where rainfall, soil fertility, and
other environmental factors enable successful cropproduction, with livestock as an important but gen-erally secondary element of the system. Animals addvalue to low-opportunity cost inputs, including feed(roadside forages, crop residues, by-products) and la-bor. Animals also provide important nutrient cyclingfunctions, for example, by collecting and transportingnutrients from rangelands to croplands and by theirdigestive processes, especially rumination, a particu-larly effective composting mechanism.
Some 80% of farmers in Africa and Asia (includingnot only crop producers but even the landless) keepsmall flocks of poultry that survive largely throughscavenging. From a biological viewpoint, this type ofproduction is sustainable, because all of the inputscome from renewable resources, although off-takerates are low.

Animal Agriculture and Global Food Supply 29
Figure 4.15. Manuring in Kenya. Photograph courtesy of DavidElsworth, International Livestock Research Insti-tute, Nairobi, Kenya.
Figure 4.14. Market sales of livestock in Niger. Photographcourtesy of David Elsworth, International LivestockResearch Institute, Nairobi, Kenya.
Figure 4.17. Fodder storage in Niger. Photograph cour-tesy of David Elsworth, International Live-stock Research Institute, Nairobi, Kenya.
Figure 4.16. Night tethering of cows for land fertilization inKenya. Photograph courtesy of David Elsworth,International Livestock Research Institute, Nairobi,Kenya.
As described in Chapter 2, in developing countries,animals are a primary source of power for cultivation,a means of “storing” residues and by-products, and asource of savings that can be cashed in when needed(e.g., for purchase of seed, fertilizer, and other cropinputs, or for food). In developing countries, popula-tion pressure, poverty, and underdeveloped infra-structure are the fundamental factors affecting thesuccess of mixed farming systems. Soil nutrient de-pletion can occur and lead to involution of the mixedsystem, which manifests itself as a downward spiralresulting in monoculture cropping systems, lower-quality food crops being produced, and increased un-dernutrition and famine (Cleaver and Schneiber,1994).
Environmentally, at its best, the mixed farmingsystem can maintain soil fertility by recycling soil
nutrients and allowing the introduction and use ofrotations between various crops, forage legumes, andfallow periods. Incorporation of livestock into thefarming system also can maintain soil biodiversity,

30 Animal Production Systems and Resource Use
minimize soil erosion, increase water conservation,and provide suitable habitat for birds.
Mixed systems can challenge environmental stabil-ity by causing soil nutrient depletion when populationpressure becomes too high, thus placing excess de-mands on the resource base. In developed countries,on the other hand, heavy commercial fertilizer appli-cation and increased numbers of animals can resultin nutrient surpluses on the land.
Industrial SystemsIndustrial production of pork, poultry, and feedlot
beef and lamb is the fastest growing form of livestockproduction (Figures 4.20–4.22). In 1996, it provided79% of the poultry meat and 39% of the pork producedglobally (de Haan et al., 1997). This type of produc-tion system has to date been adopted to a greater ex-tent in developed countries.
The growth of these systems has been stimulatedby the market opportunity from urbanized popula-
tions and income growth. Industrial systems gener-ally concentrate large numbers of livestock in a smallarea, intensify feed input over a short period of time,and exercise tight management control over the pro-duction and processing activities to increase produc-tivity and reduce wastage. Industrial systems specif-ically take advantage of scale economies to reducecosts of production, processing, and marketing. Theyalso depend on access to capital and development andimplementation of new technologies that can reducecosts or add value to the product.
Principal types are meat production from pigs andpoultry, large-scale dairy operations, and beef feed-lots. For beef production, the industrial system is of-ten the final component of stratified systems in whichlivestock are finished to market requirements beforeslaughter.
The added value to the final product, plus the fi-
Figure 4.18. Feeding crop residues in Kenya. Photographcourtesy of David Elsworth, InternationalLivestock Research Institute, Nairobi, Kenya.
Figure 4.20. A modern C alifornia dairy in the United States.Photograph courtesy of Thomas Shultz, Universityof California, Cooperative Extension, Tulare.
Figure 4.19. Jersey dairy cows on high quality pasture. Photo-graph courtesy of Thomas Shultz, University ofCalifornia, Cooperative Extension, Tulare.

Animal Agriculture and Global Food Supply 31
nancial savings from shortening time to slaughter,make it profitable to utilize concentrate feeds, includ-ing feed grains, oilseed meals, and other food-process-ing by-products, some of which could be consumed byhumans. Industrial systems drive trade in feed grainsand other feed sources, providing an opportunity tocrop farmers for diversification and additional income.However, as for expansion of any crops, care is need-ed to avoid cultivation of erosion-prone soils. Thegreatest environmental concern about industrial sys-tems is the concentration of large amounts of manureand urine in small areas and the resulting potentialfor pollution of soil, water, and air, unless wastes arecarefully managed and monitored. On the other hand,industrial systems, due to intense use of capital andeconomies of scale, have the greatest capacity to pro-cess wastes to minimize negative impacts.
Stratified Systems
These stratified systems are characterized by mov-ing livestock from site to site, often with change ofownership, typically linking and taking advantage ofthe lower-cost opportunities in grazing, mixed farm-ing, and industrial systems. In the United States, thetypical example is beef production, in which calfproduction is from cows kept on low-cost grazing lands(including relatively dry rangelands in the west andpasturelands in other regions). After weaning, calvesmay be moved to better-quality grazing, such as cul-tivated forages or winter wheat grazing, before fin-ishing on predominantly concentrate diets (e.g., feedgrains, milling by-products) in commercial feedlots.
The development of stratified systems is driven byopportunities for cost reduction. Typically, the live-stock elements of the system move to where inputs areless expensive. For example, some vertically integrat-ed poultry and pig operations contract with growersto utilize low-cost family labor. Another example of astratified system involves production of replacementdairy heifers on family farms in the central and north-ern United States for large-scale industrialized dairyoperations in California and Florida. Stratified sys-tems also may improve product quality, by controllingthe finishing stage to ensure a more uniform productthat meets market requirements for quality and hy-giene. Stratified systems generally locate the finish-ing operation close to the point of slaughter, to mini-mize stress and transportation costs before slaughter.
The animals involved in “finishing” systems areoften by-products of another major animal system.Examples include feeding of male calves from dairysystems and terminal cross-bred lambs from meatbreed sires from wool production systems. These by-products of the primary system generally are pur-chased by operators who specialize in the feeding andfinishing of these types of animals for meat produc-tion. (Systems 2 and 3, described in Box 2, representexamples of stratified systems.)
Resources Involved in AnimalProduction
The feeds used for animal production in these dif-ferent systems are numerous and varied. Althoughmuch of the feed used consists of materials that hu-mans cannot consume directly, some is human-edible.Meat, milk, or eggs produced entirely from human-inedible feedstuffs clearly add to human food supply.Feeding human-edible materials to animals can either
Figure 4.22. Industrial broiler production involves large num-bers of birds. Photograph courtesy of Ralph Ernst,University of California, Davis.
Figure 4.21. Feedlot finishing of beef cattle in the United States.Rations typically contain up to one-third ofby-product feeds as well as grain and forage. Pho-tograph courtesy of John Dunbar, University ofCalifornia, Davis.

32 Animal Production Systems and Resource Use
decrease or increase the total human food supply.Reductions result from feed-to-food conversion ratesless than 100%; increases result from the increasedefficiency of utilization of the human-inedible portionof the diet as a consequence of providing the animalswith nutritionally better balanced diets. The net ef-fect is influenced by the proportions of human-edibleand -inedible materials fed, species of animal, produc-tion system, and product, all of which vary widelywhen all of animal production is considered. In allcases, the nutrient density and variety of the humanfood supply are increased.
Human-Inedible MaterialsForage from Rangelands
Globally, 3.35 billion ha of land are grazed by live-stock (Seré and Steinfeld, 1996) (Figures 4.23–4.24).Most of this land is too arid, steep, rocky, or infertileto permit crop production and would produce no hu-man food if not grazed by animals. These lands are oflow productivity, compared to arable land, but, collec-tively, they support about 360 million cattle and morethan 600 million sheep and goats (de Haan et al.,1997), plus lesser numbers of other species. Grazinglands supply only about 23% of the world’s beef pro-duction and 30% (Table 4.1) of the world’s sheep andgoat meat but, because they complement and makepossible other livestock production systems, theirimportance is not fully indicated by the amount ofmeat produced directly from them. For example, theU.S. stratified beef production system (Box 2) wouldnot be feasible if there were not a supply of calves forfurther feeding coming from cow herds maintained ongrazing lands.
Production of meat and milk from this source ob-viously adds to the food supply. However, as the pop-ulation increases, there is greater pressure for otherpotential functions of the world’s grazing lands, suchas crop production or recreational use. Some alterna-tives are compatible with well-managed grazing; oth-ers are not. There is concern about deleterious effectsof heavy livestock grazing pressure on biodiversityand sustainability of ecosystem function (see Chap-ter 5). It is generally accepted that, on significant por-tions of the world’s grazing lands, improved manage-ment practices need to be implemented to ensure thelong-term sustainability of this feed resource and topreserve other environmental services provided bythese lands. Some strategies for such improved man-agement are described briefly in Chapter 5 and arecovered in more detail by Humphreys (1994) and deHaan et al. (1997).
Cultivated ForagesCultivated forages include grazed forages (rainfed
or irrigated pastures) and harvested forages (hays andsilages). In some cases, these crops are grown on landsuitable for food crop production. More often, they aregrown on steeper or otherwise more erodible arablelands where they reduce erosion (see Box 3), on lessproductive soils, or in rotation with food crops to im-prove the soil’s organic content and condition. Foragelegumes grown in rotation with other crops not onlydo not require nitrogen fertilizer but also some of theatmospheric nitrogen they fix in the soil is availableto subsequently planted food crops. Growing foragecrops in rotation with other crops can help break pestor disease cycles and provide other agronomic bene-fits. Thus, cultivated forages represent an important
Figure 4.23. Cattle grazing shortgrass prairie in eastern Colo-rado. Photograph courtesy of Martin Vavra, OregonState University, Burns, Oregon.
Figure 4.24. Cattle grazing sagebrush-steppe rangeland in Or-egon. Photograph courtesy of Martin Vavra, Or-egon State University, Burns, Oregon.

Animal Agriculture and Global Food Supply 33
Three strategies for beef production used in differentcountries or at different times or places within countries,depending on availability of feeds and their prices, werecompared.
1. Range forage only; no supplemental feeds. For sixmonths of each year, forage is sufficient to supportmodest levels of reproduction and growth; for the re-maining six months, animals, on average, simplymaintain weight. Calves wean at 150 kg at sixmonths of age, gain 0.5 kg/d for each six-month for-age growth season, reaching 420 kg at 42 monthsor 510 kg at 54 months. Annual calf crop is 65 calvesweaned per 100 cows.
2. Cows are supplemented sufficiently to wean a 90%calf crop (90 calves/100 cows) of 240 kg calves at sev-en months. Calves are carried as stockers, i.e., foran additional growing period, on grass, gaining 0.5kg/d to 370 kg, then finished in a feedlot on a high-concentrate diet (e.g., Nebraska diet, Table 4.16) to510 kg.
3. The cow herd is managed as in Number 2 but calvesgo directly to the feedlot at weaning and are fed to510 kg.
The growth patterns for the three systems are illus-trated in the figure.
0
Age (months)
Wei
ght (
kg)
Birth 6
400
100
300
500
600
200
12 18 24 30 36 42 48 54 60
#1#2#3
Figure B2.1. Growth patterns (ages in months and weight inkg) of beef production in three production sys-tems (1 = grazing; 2 and 3 = stratified).
Impact of Production System on Amount and Type of Feed Required per kg Beef
Box 2
Total energy required for cows and bulls, replacementanimals (20%/year), and for market animals to slaugh-ter weight was calculated using the program describedby Oltjen et al. (1992). Estimated proportions of human-edible feedstuffs fed were based on the values in Table4.18. Results were as follows, with inputs and outputscalculated per cow in the herd per year:
The results are consistent with the efficiencies report-ed in Table 4.17, which were calculated from nationaldata on inputs and outputs. They illustrate clearly theincrease in efficiency of total feed use by raising thenutrient density of the diet. With 16 to 20% of the totalfeed energy coming from human-edible sources, the to-tal energy required per kg of meat produced is reducedby 37 to 40%. Choice of system is determined primarilyby economic factors but there are, potentially, substan-tial environmental implications of the tradeoffs amongthe systems.
System
1 2 3
Slaughter wt. (kg) 420 510 510 510
Carcass wt. (kg) obtained from Young animals 113 142 221 221 Cull cows 45 45 52 52 Total 158 187 273 273Feed energy (MJ x 103) Total 59.3 71.4 65.8 62.8 Human-edible 0 0 10.8 12.5MJ in feed/kg carcass Total 377 381 241 230 Human-edible 0 0 39.5 46.0

34 Animal Production Systems and Resource Use
Cultivated forages grown to provide feed for livestockinclude grasses, legumes, and mixtures of these two.Most forage crops are perennials, forming a sod thatreduces water and wind erosion. An example of the im-pact on soil loss is shown in the table below. Also of in-terest from these data is the relatively low soil loss, com-pared to that with cultivated crops, on rangeland(natural plant community), and the decrease in recentyears in soil loss on cropland, most probably associatedwith adoption of conservation tillage practices such asno-till and reduced tillage cropping practices, which pro-tect the soil from erosion by leaving more crop residueon the soil surface.
Cultivated Forages and Soil Erosion
Box 3
part of the complementarity of livestock and cropsdescribed for mixed farming systems.
Forage crops fed to livestock can, in some cases,yield more human food per hectare than food cropsfor direct human consumption (see Box 4).
Crop ResiduesLarge amounts of plant materials associated with
the production of food crops are not edible by humansbut can be used as animal feed (Figures 4.25–4.26).These include crop residues (e.g., straws, stovers, etc.associated with the production of cereal grains andother feed and food crops) and food and fiber process-ing by-products such as oilseed meals (cakes), brew-ers grains, sugar beet pulp, and numerous other re-siduals from food and fiber production, which are not
suitable as human food. Some of the more importantcrop residues and by-products available for animalfeed are listed in Table 4.2, along with average drymatter, energy, and protein contents.
As shown in the table, nutritive value, as indicat-ed by metabolizable energy and crude protein content,varies widely among these products. Brans, brewersgrains, and oil seed meals (cakes) are good sources ofprotein and these, along with molasses and beet pulp,are also good sources of livestock feed energy; wholecottonseed is quite high in both energy and protein.
Crop residues, on the other hand, are generallyquite low in both digestible energy and protein, al-though, in some cases, they can be improved in feed-ing value by chemical treatment. Treated or not, cropresidues constitute the basic feed supply in many live-
Figure 4.25. Beef cattle utilizing sorghum stubble followingharvest of the grain crop. Photograph courtesy ofJohn Dunbar, University of California, Davis.
Figure 4.26. Sheep grazing cereal stubble in Morocco. Photo-graph courtesy of Eric Bradford, University of Cali-fornia, Davis.
Estimated sheet, rill, and wind erosion by land use inNebraska a
Cultivated FallowYear crop land crop land Pasture Rangeland
Soil loss in tons/hectare/year
1982 7.2 1.5 1.2 1.31987 6.7 1.3 1.0 1.21992 5.8 1.1 1.0 1.2
aSource: USDA Soil Conservation Service. 1992 nationalresources inventory. USDA-SCS, Washington D.C.

Animal Agriculture and Global Food Supply 35
Some crops grown to feed livestock are raised on ara-ble land that could be used to grow food crops for directhuman consumption. A common assumption is thatgrowing food crops will result in more human food, be-cause it avoids the losses resulting from the fact thatanimals convert feed to meat, milk, or eggs with less than100% efficiency. In some cases, that assumption is val-id, but because of the high nutritional quality and pal-atability of the foods produced by animals, the tradeoffis generally considered worthwhile. However, theamount of meat, milk, or eggs produced from a unit ofland is a function of crop yield as well as conversion rateby the animal. A crop such as alfalfa, for example, yieldsmuch more tonnage than any food crop that might re-place it, while dairy cattle convert their feed to milk withrelatively high efficiency. As shown by the example inthe table below, in California, more human food energyand protein (of higher quality) is obtained per hectarefrom growing alfalfa and feeding it to dairy cows thanby growing wheat. The alfalfa requires more water butless nitrogen fertilizer. Tomatoes and grapes, two high-value crops more likely than wheat to be grown on land
Human Food from Feed and Food Crops
Box 4
suitable for alfalfa, produce only a fraction of the foodenergy or protein of either wheat or milk from alfalfa.
A second example of a difference in yield betweencrops that relates to human food supply also is shownin the table. Maize (Nebraska data) produces more thantwice as much grain per hectare as wheat. Most maizeis used as livestock feed, while most wheat is used forhuman food, with the result that, on average, wheat willproduce more human food per acre than maize. Howev-er, the variety added to diets by the animal products frommaize makes this tradeoff generally acceptable. An ad-ditional important point relates to calculations of thenumber of people that could be fed with the grain usedto feed livestock (Pimentel et al., 1997). Implicit—if notexplicit—in such calculations is the assumption that oneton of human food would be available for each ton ofgrain not fed to animals. Given people’s preference forwheat vs. maize, expansion of wheat area at the expenseof area cropped to maize would not give an equivalentincrease in human food because of the lower yields ofwheat.
Inputs and human food outputs for various crops (human food energy and protein from maize and wheat calculated assuming 20%milling losses) a
Inputsb Outputsc
Yield DM Human
N P K Water DE CP
Location Crop kg/ha cm t/ha MJ x 103/ha t/ha
Calif., Central Valley (irrigated) Alfalfa 0 67 90 146 16.25 — —
Milk (from alfalfa) 0 67 90 146 2.89 62 0.80Wheat 134 34 0 61 4.05 51 0.46Tomato 224 34 56 122 0.54 8 0.09Grape 34 0 34 91 1.25 19 0.04
Nebraska Maize 157 15 5 34 7.41 100 0.58 (irrigated) Wheat 90 12 4 8 3.49 44 0.40Nebraska Maize 125 13 5 0 5.25 71 0.41 (dryland) Wheat 40 6 0 0 1.92 24 0.22
aData compiled by J. W. Oltjen and K. G. Cassman.bInputs: N = nitrogen; P = phosphorous; K = potassium.cOutputs: DM = dry matter; DE = digestible energy; CP = crude protein.

36 Animal Production Systems and Resource Use
stock production systems (e.g., rice straw as the prin-cipal forage for dairy rations in many Asian countries;wheat and barley straws as the principal forages forsummer, autumn, and winter feeding, particularly forsheep, throughout the Mediterranean region). In thelatter region, many farmers consider the stubble graz-ing and conserved straw from cereal crops to be atleast as important as grain production; even in yearswhen they fail to get a grain crop due to lack of rain,the crop usually produces some forage to help main-tain their livestock.
Food and Fiber Processing By-ProductsData on total amounts of the two major classes of
by-products listed in Table 4.2 and on crop residuesfrom four major cereal crops are presented in Table4.3 for selected countries and the entire world. The
crop residues were calculated from the production ofwheat, rice, maize, and barley, assuming 55% of eachcrop is residue and 45% is grain and that 50% of theresidue is left in the field for soil cover and to providesoil organic matter (Loomis and Connor, 1996). Addi-tional production details for specific by-products andcrop residues in the listed countries are reported byFadel (1999).
The data in Table 4.3 indicate marked variationamong countries in total and in per capita supplies ofthese major classes of feedstuffs. For example, Ken-ya has below-average per capita supplies of each ofthe groups of feedstuffs, reflecting and contributingto the lower-than-average per capita food supply de-scribed earlier (Chapter 3).
The United States produces less total quantity ofeach of these classes of feedstuffs than China except
Table 4.2. Nutrient composition for ruminants of by-product feedstuffs, dry matter basis (fromNational Research Council, 1989)
Dry matter Metabolizable Crude proteinBy-product feedstuffs (g/100 g) (MJ/kg) (g/100 g)
Miscellaneous Almond hulls 90 7.7 2.1 Bagasse 90 6.3 1.5 Beet pulp 91 12.6 9.7 Brans 90 12.8 17.2 Brewers grains 21 10.4 25.4 Citrus pulp 21 12.6 7.3 Whole cottonseed 92 16.0 23.0 Molassesa 76 11.8 7.2
Cakes Soybean 89 13.8 49.9 Ground nut 92 12.5 52.3 Sunflower seed 93 10.3 49.8 Rape and mustard seed 91 11.0 40.6 Cottonseed 91 12.3 45.6 Palm kernelb 91 11.0 40.6 Copra 91 12.1 23.4 Sesame seed 93 12.5 49.1 Miscellaneous cakesb 91 11.0 40.6 Corn germ meal 91 11.9 22.3 Corn gluten feed and mealc 90 13.8 33.9 Soap stock oils 100 30.6 0.0
Crop Residues Wheat 89 6.3 3.6 Riced 91 6.2 4.3 Barley 91 7.2 4.3 Maize 85 7.4 5.9
aAverage of low quality sugar cane molasses and molasses from sugar beets.bSame as rape and mustard seed composition.cAssume 20% corn gluten meal and 80% corn gluten feed.dNational Research Council (1984) used for rice crop residue.

Animal Agriculture and Global Food Supply 37
for oilseeds, the latter due to the very large U.S. soy-bean production. Soybean meal represents a specialcase as a by-product feed; for most crops, the food croprepresents the larger and the by-product the lesserproportion of the crop. However, for soybeans, theoilmeal used for livestock feeding represents thegreater portion, with the primary food product, cur-rently soybean oil, the lesser portion. This situationcould change in the future, as more of the soybeanprotein could be used for direct human consumption.However, processing soybeans into products such astofu also results in by-products useful for livestockfeeding. Whole cottonseed and cottonseed oil mealcontain a compound, gossypol, which is toxic to hu-mans, pigs, poultry, and horses, but which is detoxi-fied in the rumen of cattle, sheep, and other rumi-nants. As a result of this detoxification and its highprotein and energy content, cottonseed, where avail-able, is an important ruminant feed.
Grasser et al. (1995) reported on the feeding anddollar values of by-products sold to the Californiadairy industry. Total annual dollar value of just nineby-products in 1992 was $232 million, representingmore that one-fourth of the total concentrate feed usedannually in the state’s dairy industry. Cottonseed
alone was worth $125 million. Applying Grasser’smethods of estimation to the global supply of by-prod-ucts (excluding crop residues) in Table 4.3 indicatesthese would energetically support over 500 milliontons of milk production, nearly equal to current totalworld milk production. Conversion rates would, ofcourse, vary depending on the feeding, management,and genetics of the animals involved, with high con-version rates facilitated by the availability of high-quality forage, as in the system evaluated. Also, by-product use may be spread across several animalspecies, not just dairy.
The totals in Table 4.3 represent an underestimateof the total by-products available, because numerousadditional crops such as cassava, sweet potato, andmany fruit and vegetable crops yield by-products thatcan be excellent feed (cull broccoli and carrots are ex-amples). Bakery waste, where available, is a valuablesource of high-energy feed. These by-products aregenerally less important in terms of tonnage than theones listed, less accurately reported, and their nutri-tive values are often less well defined, but where avail-able, they can be a key source of feed for animals. Totalcrop residues also would be much higher than thoseshown in Table 4.3, because the latter are based only
Table 4.3. Crop residue and by-product feedstuff production, metabolizable energy (ME) and protein (CP) content for selected coun-tries, 1993 a
Argentina China Egypt Kenya Korea Republic Mexico United States World
Miscellaneousb
Prodn, 103 t 2,557 40,389 2,890 596 893 6,183 15,030 221,084 kg/capita 75 34 48 23 20 70 57 40
ME, 109 MJ 24.5 497.3 31.2 5.3 11.4 56.0 177.3 2,301
CP, 103 t 219 6,387 337 44 152 473 2,041 23,767
Cakesb
Prodn, 103 t 322 12,019 602 34 2,658 2,891 23,374 124,105 kg/capita 10 10 10 1 60 33 89 22
ME, 109 MJ 3.9 154.9 8.0 0.4 34.4 38.4 317.3 1,612
CP, 103 t 148 5,661 290 14 1,174 1,324 11,377 56,522
Crop Residuesb
Prodn, 103 t 6,530 163,444 5,286 434 3,643 4,720 60,377 651,498 kg/capita 193 137 88 17 83 54 230 118
ME, 109 MJ 43.2 1,039.4 34.0 3.1 22.7 33.1 410.9 4,194
CP, 103 t 277 6,945 224 23 157 237 2,789 27,393
aData summarized from Fadel (1999).bSee Table 4.2 for feedstuffs within each group.

38 Animal Production Systems and Resource Use
Figure 4.28. Dried beet pulp is a good feed for cattle. Photo-graph courtesy of John Dunbar, University of Cali-fornia, Davis.
Figure 4.27. Almond hulls are a high energy content feed forruminants. Photograph courtesy of John Dunbar,University of California, Davis.
Figure 4.29. Citrus pulp used in dairy cattle rations. Photographcourtesy of Eric Bradford, University of California,Davis.
on wheat, rice, maize, and barley.For the by-products (excluding crop residues, soap
stocks, and molasses) in Table 4.2, Fadel (1999) hascalculated that, as a weighted world average, every100 kg of food produced yields 37 kg of animal feedby-product. This re-emphasizes the importance of in-tegration of crop and animal production in food pro-duction systems.
Animal by-products also are recycled through ani-mals (Figures 4.27–4.33). For every 100 kg of ediblemeat, about 100 kg of animal by-products are gener-ated, with about half typically fed to animals (Romanset al., 1994), with leathers, glues, pharmaceuticals,and many other useful products coming from the re-mainder. With regard to feeding animal by-products,the outbreak of bovine spongiform encephalopathy(BSE) in cattle in Britain emphasizes the need for
special care in the feeding of animal by-products, par-ticularly to the same species or class of animal.
As an example of the value of feeding animal by-products, a rice straw-based livestock diet, even sup-plemented with adequate protein, is too low in ener-gy to support efficient milk production. Supplement-ing such feeds with animal fat helps convert them toa productive diet, facilitating the use of an abundantbut low-quality residue with the addition of anotherhuman-inedible material.
The waste disposal function of animals in utilizingthese many by-products also represents a valuableservice. There is some residual waste in terms of ma-nure (which itself is valuable if properly used) but thevolume is greatly reduced. If by-products such as cit-rus pulp, nonfood-grade molasses, and wet brewersgrains were not used for feeding livestock, the cost ofthe food products with which they are associatedwould be higher, both because of lost income from thesale of by-products and much higher waste disposalcosts. In countries with strict environmental regula-tions, there is a strong effort on the part of industriesproducing by-products with potential animal feedvalue to have these products tested and, if acceptable,registered as feedstuffs, as this can greatly reduce thecost of disposing of a product otherwise consideredwaste.
Human-Edible Materials Used as AnimalFeeds
Domestic animals convert a wide variety of human-inedible materials into high-quality human food butthey also consume approximately one-third of the glo-bal cereal grain supply. Although the proportion of the

Animal Agriculture and Global Food Supply 39
Figure 4.30. Tomato pomace. Originally a waste prod-uct, now used in ruminant rations with feedvalue similar to alfalfa. Photograph cour-tesy of John Dunbar, University of Califor-nia, Davis.
Figure 4.31. Commodity barn, California dairy. Whole cotton-seed in center bay. Photograph courtesy of ThomasShultz, University of California, Cooperative Exten-sion, Tulare, California.
Figure 4.33. Chaff dumps are created during wheat combiningas a way to accumulate waste material to be con-sumed by cattle. Photograph courtesy of MartinVavra, Oregon State University, Burns, Oregon.
Figure 4.32. Carrot waste by-product from carrot processingbeing stockpiled for livestock feed. Photographcourtesy of Martin Vavra, Oregon State University,Burns, Oregon.
world’s population that is undernourished is decreas-ing (American Association for the Advancement ofScience, 1997), more than 800 million people do notyet have an adequate diet. It has been suggested (e.g.,Brown, 1997) that grain now used to feed animalsshould be used for direct human consumption. Thisshift can and does occur in times of local or temporaryfood grain shortages but the use of high-energy feeds,in combination with forages and by-products, hasimportant implications for overall efficiency of animalproduction and thus for quantity and quality of thehuman food supply.
The first demand on nutrients from the feed con-sumed by animals is for maintenance, i.e., for vitalfunctions such as respiration, and digestion and ab-sorption of nutrients. Nutrients in excess of mainte-nance requirements are available for productive func-tions: growth, reproduction, lactation, fiberproduction, and work. If animals consume a low nu-trient-density diet, for example, a low quality forage,they may have only enough digestive capacity to meet

40 Animal Production Systems and Resource Use
their maintenance needs (or even less, in which casethey can survive only by drawing on body reserves infat or muscle). In this situation, productive functionscannot occur until the nutrient content of the feed isincreased. Thus, a key principle in improving the pro-ductivity of animals is to increase the proportion ofnutrients going to productive functions and therebyreduce the proportion used for maintenance. Provid-ing adequate nutrients is, of course, also a key tenetof good animal husbandry.
Providing adequate nutrients may require increas-ing the quantity of feed or the nutrient density, orboth, depending on what is limiting. This may beachieved by moving animals to a new location at theend of the growing season in one area, as is routinelydone in transhumant systems; controlling stockingrate so that each animal has adequate forage (al-though this may not solve forage quality problemsduring dry seasons); providing cultivated forages; orby feeding higher nutrient-density diets containingcereal grains or by-product feeds. The choice amongthese options depends on the species of animals in-volved, which have different digestive systems, andon the availability and costs of alternative feed sourcesin relation to potential returns.
Nonruminant animals, such as pigs and poultry, donot digest fibrous feeds well, so they must have bal-anced, high-energy diets at all times if they are toachieve their productive potential. For example, scav-enging chickens might produce 50 or fewer eggs perhen per year; modern strains of laying chickens fedto meet their nutrient requirements average in excessof 250 eggs per hen per year. This level cannot beachieved on a scale approaching that required to meetglobal demand without use of cereal grains and pro-tein supplements.
Ruminant animals can digest high-fiber feeds suchas grasses and crop residues but their productivity isgreatly enhanced by including higher-energy (andprotein, if needed) feeds in their diets. For example,cattle in pastoral systems in many developing coun-tries depending only on natural forage, may gainweight just during the forage growing season, oftenonly three to six months of the year, and maintain oreven lose weight the remainder of the year. Thus, theytypically do not reach slaughter weight until three tofive years of age. In contrast, calves put into a feedlotat weaning and fed a high-energy diet may reachslaughter weight at 14 to 16 months of age, reducingthe maintenance period for the animal by two-thirdsor more. Also, in a pastoral system with no supple-ments provided, many cows produce a calf only everyother year; where better forage and/or supplemental
feed (usually hay or by-products) are supplied to thebreeding herd during periods of natural forage defi-ciency, more than 90% of the cows produce a calf eachyear. The difference between the two systems in pro-portion of total feed going to maintenance (i.e., in grossfeed conversion efficiency) is substantial (see Box 2).However, as described in Box 2 and in subsequentsections, the system with the more favorable total feedconversion efficiency generally involves use of human-edible materials as a part of the animals’ diets.
The feeding of substantial quantities of grain tobeef cattle in large feedlots is a relatively recent prac-tice, confined largely to developed countries and stim-ulated by the fact that grain yields per hectare in-creased much more rapidly than demand for grain forhuman food from the 1950s through the 1980s, result-ing in surpluses. Prices of grains in constant 1990dollars declined 78% from 1950 to 1992 (Mitchell andIngco, 1993). Feedlot feeding has, in fact, been animportant buffer for grain prices and, if real prices ofgrains rise in the future, alternative systems usingless grain will be adopted.
One such system, outlined in Box 2, involves calvesgrazing on improved range or pasture for a periodafter weaning, with only a short period in the feedlotprior to slaughter. This practice will increase slaugh-ter age but uses less grain than when animals are fedfrom weaning in the feedlot. This system is followedwhen grain prices rise; during the 1970s, when worldgrain prices increased sharply, feeding of grain to cat-tle in feedlots in the United States decreased 50% inone year.
The relationship between nutrient density of thediet and overall efficiency of production leads to anumber of tradeoffs. Higher nutrient-density diets areobtained by using some human-edible feed inputs butresult in more production of food from fewer animals,occupying less land, producing less waste, and in thecase of ruminants, producing less methane. Intensi-fication of animal as well as crop production is poten-tially an important means of reducing human pres-sure on land (Waggoner et al., 1996).
Estimates of the amounts and types of concentratefeeds (which include human-inedible as well as hu-man-edible feedstuffs) used for different types of an-imal production in developed and developing coun-tries were compiled from FAO data sources by Hendyet al. (1995). These data are summarized in Tables 4.4and 4.5, along with FAO data on amounts of the dif-ferent products.
Approximate conversion rates for grain to meat,milk, or eggs for developing and developed countrieswere calculated from the totals in Table 4.5 and in-

Animal Agriculture and Global Food Supply 41
cluded in the table. The assumption made that cerealgrain content of the concentrate ration for all of thespecies is the same is probably not correct; it is likelyto be higher for poultry and pigs and lower for rumi-nants, due to the inclusion of more by-products for thelatter. Even without adjustment for this possible bias,the grain/product ratios for ruminants compare favor-ably with those for poultry and pigs. The data in Ta-ble 4.5 document the lower use of feed grains in de-veloping vs. developed countries.
For additional information on conversion rates byfood animals and on reasons for variation in reportedestimates of conversion rates, see Box 5.
A fact often overlooked in the feed grain/food graindebate is that the most important feed grain, maize,yields substantially more per hectare than the mostimportant food grains, wheat and rice. Maize is con-sumed directly by humans but wheat and rice are
strongly preferred in much of the world. Most landused to grow maize is not suited for rice, so a shift inuse from feed grain to food grain would undoubtedlyresult in a shift from maize to wheat. Such a shift inthe United States would lower total yield by about 4tons/ha (see Box 4). Shifting half the 27 million ha ofmaize to wheat, in the United States alone, wouldreduce total grain production by an estimated 50 mil-lion metric tons (Mt) annually, which may be com-pared with total U.S. wheat production of about 65 Mtper year. Thus, the net increase in human food calo-ries from this shift would be only a fraction of thatprojected from the assumption of a 1:1 replacementof feed grain by food grain.
The primary reason for the apparent failure ofgrain to be used to satisfy all human needs before anyis used for animals is an income problem; people incountries where food shortages occur lack the means
Table 4.5. Concentrate feed use and food production (Mt) from animals in developing and developed countries (1992–1993)
Developing countries Developed countries
Concentrate Grain/ Concentrate GrainProduct Productiona feedb Grainc product Productiona feedb Grainc product/
Beef, veal, and buffalo meat 22.2 14.5 6.8 0.31 32.1 118.1 83.9 2.61Sheep and goat meat 6.1 4.2 2.0 0.33 3.9 4.3 3.1 0.78Pig meat 38.5 144.2 67.8 1.76 36.8 190.3 135.1 3.67Poultry meat 18.8 62.9 29.6 1.57 26.0 78.8 55.9 2.15
Four meats 85.6 225.8 106.2 1.24 98.8 391.5 278.0 2.81Milk 177.1 81.7 38.4 0.22 352.8 162.9 115.7 0.33Eggs 23.6 78.1 36.7 1.56 18.1 55.7 39.5 2.18
aFAOSTAT, 1997.bHendy et al., 1995, Table 11.cAssuming proportion of concentrate feed made up of cereal grains is 47% and 71% for developing and developed countries, respectively(see Table 4.4), and is the same for all classes of animals (see text).
Table 4.4. Cereal grains and other concentrate feeds used in developed/developing countries(1990–1992)a
World total Developing countries Developed countries
Feeds Mt Mt % of world total Mt % of world total
Cereals 600.5 186.8 31.1 413.7 68.9Brans 118.9 88.7 74.6 29.2 24.6Oilseeds and cakes 132.7 49.5 37.3 81.5 61.4Roots and tubers 129.9 76.1 58.6 54.6 42.0
Total 982.0 401.1 41 579.0 59
a Source: Hendy, 1995: 1. Table 3. 2. Table 6.

42 Animal Production Systems and Resource Use
Widely varying estimates of the amount of grain re-quired to produce a pound of meat from different spe-cies have been reported in recent years in both the pop-ular press and in some scientific journals. Unfortunately,some of the estimates are incorrect, in some cases by atwo- to four-fold margin.
Estimates (from Table 4.5) of the grain fed per unitof carcass weight of four meats produced, in developedand developing countries, are as follows:
These results from global summaries of grain fed andmeat produced are consistent with the results of detailedanalyses of inputs and outputs for different countriesand production systems reported in Chapter 4 of thisreport.
A global estimate of conversion rate of human-ediblefeed to human food was presented by Steinfeld et al.(1997), who calculated that, worldwide, animals con-sumed 74 million tons of human-edible protein and pro-duced 54 million tons of human food protein. This givesan input:output ratio of 1.4:1. As it happens, the ratioof biological value of animal protein to that of plant pro-tein is, on average, also 1.4:1. On this basis, from the per-spective of human protein nutrition, the use of animalsdoes not decrease the amount of protein available forhumans, which has been an issue of concern.
The grain:product ratios above may be contrastedwith the values of 12:1 for beef and 2:1 for poultry usedby Waggoner (1998), or the values of 8:1 for beef, 3:1 forpork and 2:1 for poultry presented in a recent issue ofNational Geographic (October 1998). Clearly, the larg-est differences are in conversion rates reported for beefcattle.
There are several reasons for the discrepancies. Themost common is the assumption that the feed fed to an-imals is 100% grain. As documented in the case studiesin this report, diets of all species of food-producing ani-mals include some materials not edible by humans; for
ruminants, the human-inedible portion is often 100%and always more than 50%, on a life-cycle basis. Theamount of grain required to produce meat from rumi-nants such as beef cattle is therefore seriously overesti-mated by neglecting the forage and by-products thatmake up the largest part of their diet.
A second source of discrepancy is consideration of onlya portion of the life cycle. Beef cattle in U.S. feedlots typ-ically require five to seven pounds of feed to produce onepound of gain; 50 to 70% of the feed may be human-edi-ble, giving a human-edible input:product ratio of 2.5 to5:1 for this part of the production cycle. However, theanimals have reached 50 to 70% of final live weight (45to 65% of carcass weight) when they enter the feedlot,with the gain up to that time coming entirely or almostentirely from forage (see Box 2 and Table 4.16). In otherwords, only 35 to 55% of the meat produced by the ani-mals is produced during the period when human-edibleinputs are fed. Thus, the grain:beef ratio is between 0.9and 2.8:1, based on final live weight of the animal, orbetween 1.4 and 4.4:1, based on carcass weight, consis-tent with the average developed country value of 2.6:1in the table.
A third factor contributing to discrepancies in report-ed conversion rates is variation in choice of end point,e.g., live weight, carcass weight, boneless cuts (see Box1).
The fact that several of the input:output ratios aregreater than 1:1 does mean that feeding less grain to an-imals would translate to somewhat more total food forhumans. It would also mean a food supply with less va-riety and lower nutrient density. As noted elsewhere inthis report, grains fed to animals represent a buffer forhuman food grain supplies; whenever grain becomesscarcer and more expensive, less is fed to animals. Grainsand protein supplements fed to animals also improve theconversion rates of forages and by-products to humanfood.
The efficiency with which animals convert human-ed-ible inputs to human food is a factor to be considered indetermining policy related to human food supply. Bet-ter policy decisions will result if the discussions on thesubject are based on actual conversion rates and not onestimates from assumptions that ignore what animalsactually eat.
How Much Grain Does It Take to Produce a Pound of Meat? Conversion Rates of
Human-Edible Inputs by Different Species of Food-Producing Animals
Box 5
Grain Per Unit of Product
Product Developed countries Developing countries
Beef 2.6 0.3Sheep and goat meat 0.8 0.3Pork 3.7 1.8Poultry Meat 2.2 1.6
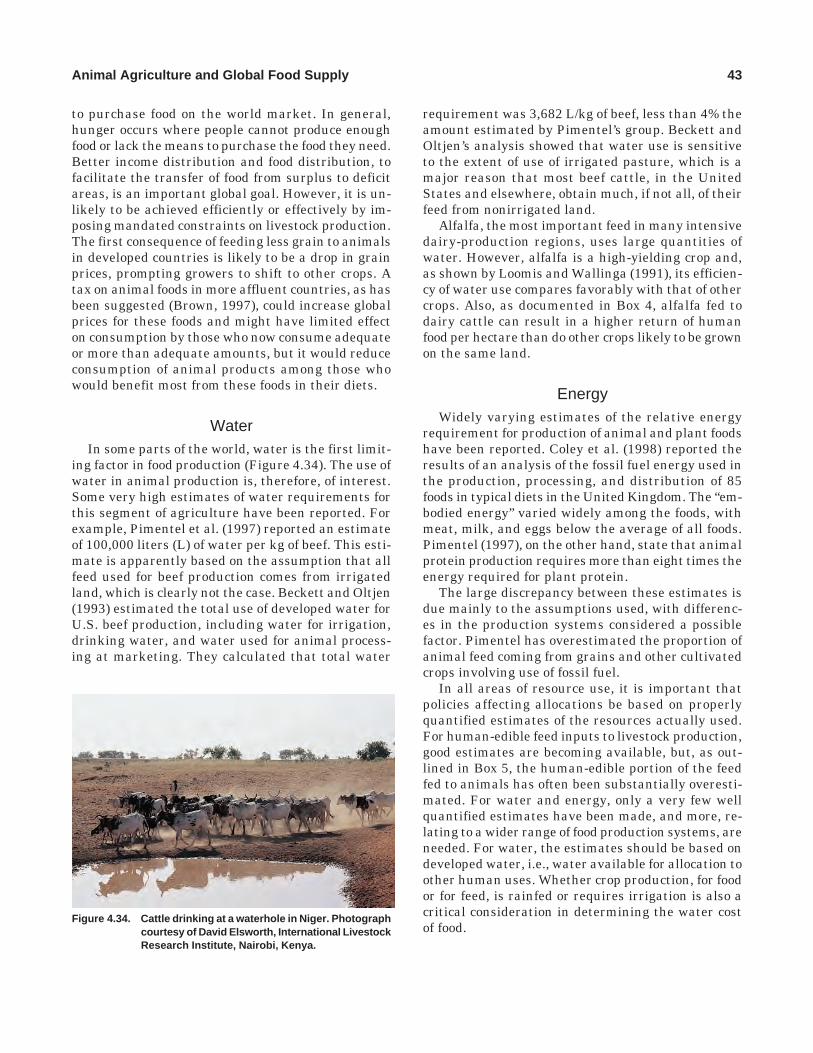
Animal Agriculture and Global Food Supply 43
to purchase food on the world market. In general,hunger occurs where people cannot produce enoughfood or lack the means to purchase the food they need.Better income distribution and food distribution, tofacilitate the transfer of food from surplus to deficitareas, is an important global goal. However, it is un-likely to be achieved efficiently or effectively by im-posing mandated constraints on livestock production.The first consequence of feeding less grain to animalsin developed countries is likely to be a drop in grainprices, prompting growers to shift to other crops. Atax on animal foods in more affluent countries, as hasbeen suggested (Brown, 1997), could increase globalprices for these foods and might have limited effecton consumption by those who now consume adequateor more than adequate amounts, but it would reduceconsumption of animal products among those whowould benefit most from these foods in their diets.
WaterIn some parts of the world, water is the first limit-
ing factor in food production (Figure 4.34). The use ofwater in animal production is, therefore, of interest.Some very high estimates of water requirements forthis segment of agriculture have been reported. Forexample, Pimentel et al. (1997) reported an estimateof 100,000 liters (L) of water per kg of beef. This esti-mate is apparently based on the assumption that allfeed used for beef production comes from irrigatedland, which is clearly not the case. Beckett and Oltjen(1993) estimated the total use of developed water forU.S. beef production, including water for irrigation,drinking water, and water used for animal process-ing at marketing. They calculated that total water
requirement was 3,682 L/kg of beef, less than 4% theamount estimated by Pimentel’s group. Beckett andOltjen’s analysis showed that water use is sensitiveto the extent of use of irrigated pasture, which is amajor reason that most beef cattle, in the UnitedStates and elsewhere, obtain much, if not all, of theirfeed from nonirrigated land.
Alfalfa, the most important feed in many intensivedairy-production regions, uses large quantities ofwater. However, alfalfa is a high-yielding crop and,as shown by Loomis and Wallinga (1991), its efficien-cy of water use compares favorably with that of othercrops. Also, as documented in Box 4, alfalfa fed todairy cattle can result in a higher return of humanfood per hectare than do other crops likely to be grownon the same land.
EnergyWidely varying estimates of the relative energy
requirement for production of animal and plant foodshave been reported. Coley et al. (1998) reported theresults of an analysis of the fossil fuel energy used inthe production, processing, and distribution of 85foods in typical diets in the United Kingdom. The “em-bodied energy” varied widely among the foods, withmeat, milk, and eggs below the average of all foods.Pimentel (1997), on the other hand, state that animalprotein production requires more than eight times theenergy required for plant protein.
The large discrepancy between these estimates isdue mainly to the assumptions used, with differenc-es in the production systems considered a possiblefactor. Pimentel has overestimated the proportion ofanimal feed coming from grains and other cultivatedcrops involving use of fossil fuel.
In all areas of resource use, it is important thatpolicies affecting allocations be based on properlyquantified estimates of the resources actually used.For human-edible feed inputs to livestock production,good estimates are becoming available, but, as out-lined in Box 5, the human-edible portion of the feedfed to animals has often been substantially overesti-mated. For water and energy, only a very few wellquantified estimates have been made, and more, re-lating to a wider range of food production systems, areneeded. For water, the estimates should be based ondeveloped water, i.e., water available for allocation toother human uses. Whether crop production, for foodor for feed, is rainfed or requires irrigation is also acritical consideration in determining the water costof food.
Figure 4.34. Cattle drinking at a waterhole in Niger. Photographcourtesy of David Elsworth, International LivestockResearch Institute, Nairobi, Kenya.
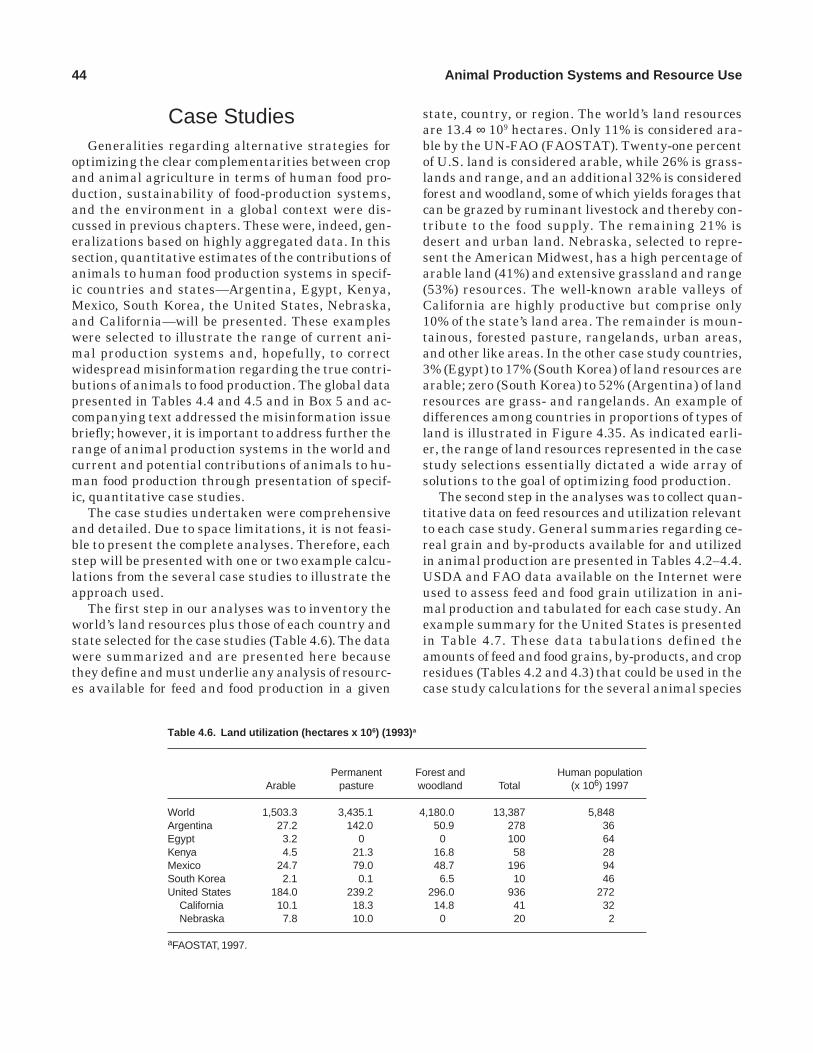
44 Animal Production Systems and Resource Use
Case StudiesGeneralities regarding alternative strategies for
optimizing the clear complementarities between cropand animal agriculture in terms of human food pro-duction, sustainability of food-production systems,and the environment in a global context were dis-cussed in previous chapters. These were, indeed, gen-eralizations based on highly aggregated data. In thissection, quantitative estimates of the contributions ofanimals to human food production systems in specif-ic countries and states—Argentina, Egypt, Kenya,Mexico, South Korea, the United States, Nebraska,and California—will be presented. These exampleswere selected to illustrate the range of current ani-mal production systems and, hopefully, to correctwidespread misinformation regarding the true contri-butions of animals to food production. The global datapresented in Tables 4.4 and 4.5 and in Box 5 and ac-companying text addressed the misinformation issuebriefly; however, it is important to address further therange of animal production systems in the world andcurrent and potential contributions of animals to hu-man food production through presentation of specif-ic, quantitative case studies.
The case studies undertaken were comprehensiveand detailed. Due to space limitations, it is not feasi-ble to present the complete analyses. Therefore, eachstep will be presented with one or two example calcu-lations from the several case studies to illustrate theapproach used.
The first step in our analyses was to inventory theworld’s land resources plus those of each country andstate selected for the case studies (Table 4.6). The datawere summarized and are presented here becausethey define and must underlie any analysis of resourc-es available for feed and food production in a given
state, country, or region. The world’s land resourcesare 13.4 ∞ 109 hectares. Only 11% is considered ara-ble by the UN-FAO (FAOSTAT). Twenty-one percentof U.S. land is considered arable, while 26% is grass-lands and range, and an additional 32% is consideredforest and woodland, some of which yields forages thatcan be grazed by ruminant livestock and thereby con-tribute to the food supply. The remaining 21% isdesert and urban land. Nebraska, selected to repre-sent the American Midwest, has a high percentage ofarable land (41%) and extensive grassland and range(53%) resources. The well-known arable valleys ofCalifornia are highly productive but comprise only10% of the state’s land area. The remainder is moun-tainous, forested pasture, rangelands, urban areas,and other like areas. In the other case study countries,3% (Egypt) to 17% (South Korea) of land resources arearable; zero (South Korea) to 52% (Argentina) of landresources are grass- and rangelands. An example ofdifferences among countries in proportions of types ofland is illustrated in Figure 4.35. As indicated earli-er, the range of land resources represented in the casestudy selections essentially dictated a wide array ofsolutions to the goal of optimizing food production.
The second step in the analyses was to collect quan-titative data on feed resources and utilization relevantto each case study. General summaries regarding ce-real grain and by-products available for and utilizedin animal production are presented in Tables 4.2–4.4.USDA and FAO data available on the Internet wereused to assess feed and food grain utilization in ani-mal production and tabulated for each case study. Anexample summary for the United States is presentedin Table 4.7. These data tabulations defined theamounts of feed and food grains, by-products, and cropresidues (Tables 4.2 and 4.3) that could be used in thecase study calculations for the several animal species
Table 4.6. Land utilization (hectares x 10 6) (1993)a
Permanent Forest and Human populationArable pasture woodland Total (x 106) 1997
World 1,503.3 3,435.1 4,180.0 13,387 5,848Argentina 27.2 142.0 50.9 278 36Egypt 3.2 0 0 100 64Kenya 4.5 21.3 16.8 58 28Mexico 24.7 79.0 48.7 196 94South Korea 2.1 0.1 6.5 10 46United States 184.0 239.2 296.0 936 272 California 10.1 18.3 14.8 41 32 Nebraska 7.8 10.0 0 20 2
aFAOSTAT, 1997.

Animal Agriculture and Global Food Supply 45
these are important to ruminant production. FAO andUSDA data available for some countries seemed fair-ly complete, based on cropping strategies used, e.g.,ha in various crops and yields, as revealed by the na-tional diets summarized in Tables 3.1–3.6. For sever-al case studies, the data were not reported or wereclearly incomplete. When complete, these data wereused in formulating national livestock diets. In theother cases, it was necessary to consider harvestedforages as dietary components comparable in qualityto grassland and range forages. Errors associated withthis assumption are small, because countries in whichmaize silage, which is higher in quality than averageforages, is utilized, quantities produced were report-ed.
The major sources of nutrients in most ruminantanimal production systems are pasture, range, andwoodland or forest forages. Forage yields and animalintakes of forage from these sources often are notavailable or reported and are generally suspect be-cause of the difficulty of obtaining accurate data. Be-cause of this uncertainty, the usual approach is tocalculate intakes of grazing animals based on theirestimated maintenance energy requirements, preg-nancy and lactation requirements, rates of gain, andranging activity needs. This approach was used in thecalculations presented here.
Based on land resources (Table 4.6) and productionsystems characteristic of each country or state select-ed for the case studies, feed resources utilized in ani-mal production were computed from data on cerealgrain, by-product, conserved forage, and crop residuesupplies (Tables 4.2–4.4), when the latter were avail-able. Calculations of pasture, rangeland, and wood-land forage yields and animal feed intakes were based
Figure 4.35. Land utilization (%) in Argentina, Kenya, and SouthKorea in 1993 (FAOSTAT, 1997).
Table 4.7. United States grain production, export and use for feed and food (1992–1994 average) a
Domestic use
Total production Net export (import) Feed Food, seed, alcohol
Crop Mt % % %
Wheat 65.1 49 22 78Rice 8.1 44 0 100Corn 219.4 20 76 24Sorghum 17.5 34 98 2Barley 8.9 5 56 44Oats 3.5 (34) 37 63Rye .3 (36) 43 57
Total 322.8 27 67 33
aSource: U.S. Department of Agriculture, 1997. http://www.usda.gov/NASS/pubs/agstats.htm.
Forest and woodland18%
Desert,urban and
other21%
Arable 10%
Permanentpasture
51%Argentina
Kenya
South Korea
Forest and woodland29%
Desert, urbanand other 26%
Arable 8%
Permanentpasture
37%
Forest andwoodland
65%Desert,
urban andother 13%
Arable 21%
Permanentpasture 1%
and production strategies.Available data on harvested forages—silages, hay,
straws, or crop residues—also were tabulated, as

46 Animal Production Systems and Resource Use
on estimated animal requirements for reported stock-ing and production rates.
The next step was to tabulate the number of ani-mals of each livestock species in each country, ratesof turnover as indicated by numbers of animalsslaughtered each year and total production in termsof meat (carcass weights), eggs, and milk (Tables 4.8–4.13). The data presented in these tables are largelyself explanatory but a few summary comments are
appropriate. Comparisons of the total stocks of eachspecies, numbers slaughtered each year, and totalproduction (carcass yields) allow calculations of per-centages of each group slaughtered each year, or theinverse, average ages of animals at slaughter. Forexample, respective average ages at slaughter for cat-tle for Argentina, Egypt, Kenya, Mexico, South Ko-rea, and the United States are 4.4, 2.3, 7.1, 5.3, 3.6,and 3.0 yr. Respective numbers of swine slaughtered
Table 4.8. Cattle numbers, productivity, and contribution to individual country/state diets a
PercentageTotal of total
Country Stocksb Slaughteredb productionc productiond Energye Proteine
Argentina 52.7 11.9 2,508 74 23.3 348.6Egypt 3.0 1.3 175 20 1.4 26.7Kenya 13.0 1.8 230 63 1.9 35.0Mexico 30.7 5.8 1,256 38 11.7 174.6South Korea 2.8 0.8 204 15 1.9 28.4United States 99.2 33.3 10,584 34 103.7 1,471.2 California 4.6 0.9 280 — 2.7 38.9 Nebraska 5.9 6.6 2,090 — 20.5 290.5
aBased on FAO and USDA (1993) data from the World Wide Web.bValues expressed in millions (106) of animals.cTotal production reflects total carcass weights in thousands (103) of metric tons.dPercentage of total animal carcass production of all species including beef and dairy cattle, swine, buffalo, poultry meat, small ruminants,equids, rabbits, and game.
eHuman-edible energy outputs in billions (109) of MJ and protein outputs in millions (106) of kg. Based on data presented in Table 4.14.
Table 4.9. Swine numbers, productivity, and contribution to individual country/state diets a
PercentageTotal of total
Country Stocksb Slaughteredb productionc productiond Energye Proteine
Argentina 2.85 2.08 177.3 5.2 2.29 20.21Egypt 0.03 0.07 2.9 0.3 0.04 0.33Kenya 0.10 0.08 5.0 1.4 0.06 0.57Mexico 16.83 12.46 821.6 24.9 10.60 93.66South Korea 5.93 9.68 786.0 57.9 10.14 89.60United States 57.90 93.07 8,041.0 25.8 103.73 916.67 Californiaf 0.26 — 18.4 — 0.24 2.10 Nebraska 4.30 5.62 476.8 — 6.15 54.36
aBased on FAO and USDA (1993) data from the World Wide Web.bValues expressed in millions (106) of animals based upon a census taken annually.cTotal production reflects total carcass weights in thousands (103) of metric tons.dPercentage of total animal carcass production of all species including beef and dairy cattle, swine, buffalo, poultry meat, small ruminants,equids, rabbits, and game.
eHuman-edible energy outputs in billions (109) of MJ and protein outputs in millions (106) of kg. Values were calculated from carcass weightsand yields of energy and protein in ready to eat, trimmed cuts tabulated in USDA Handbook 8. Based on data presented in Table 4.14.
f Many of the swine slaughtered in California are imported. Therefore outputs were calculated on the basis of locally produced animals.

Animal Agriculture and Global Food Supply 47
each year per 100 census animals are 73, 248, 77, 74,163, and 161 in the six countries. The data in Tables4.6–4.13 allow calculation of average carcass weightsof animals slaughtered and, from these values, esti-mates of live weights of the several species at slaugh-ter can be derived. Calculated live weights (in kg) atslaughter for cattle were 384 for Argentina, 237 forEgypt, 230 for Kenya, 394 for Mexico, 467 for SouthKorea, and 527 for the United States; swine weightswere 114, 58, 87, 88, 108, and 115 kg, respectively. Theestimates of time to slaughter and live weights atslaughter were essential to calculations of rates ofgain, maintenance requirements, and, finally, to es-timates of total feed inputs required for the produc-tion of meat, milk, and eggs. Also presented in Tables4.8–4.10 and 4.12 are percentage contributions of each
species to total carcass weights of animals slaughteredin each country for meat. Although carcass yields fromspecies such as rabbits, horses, mules, and game wereincluded in the calculations, their relative (%) contri-butions are not presented because they are minor. Theestimates of human-edible outputs of energy and pro-tein from the several animal industries presented inTables 4.8–4.13 were calculated from data in Table4.14 derived from Agriculture Handbook 8 (U.S. De-partment of Agriculture, 1975, 1979, 1990, 1992).These data complement the data on meat consump-tion in the several country tabulations presented inTables 3.1–3.6 in that they further break down thetypes of animal products available in each country.For example, in Argentina and Kenya, beef is themajor meat produced, at 74 and 63%, respectively,
Table 4.10. Poultry meat production and contribution to individual country diets a
Total Percentagecarcass of total
Country Stocksa yieldb productionc Energyd Proteind
Argentina 51.3 550 16.1 3.68 80.8Egypt 51.8 339 38.8 2.27 49.8Kenya 24.0 47 12.9 .31 6.9Mexico 296.3 1,071 32.5 7.18 157.4South Korea 73.9 366 27.0 2.45 53.8United States 1,790.3 12,400 39.8 83.08 1,822.8
aPoultry meat production is sum of broilers, turkeys, ducks, and geese. Stocks expressed in millions. Based on FAO and USDA (1993) data fromthe World Wide Web.bTotal carcass yield in thousands (103) of metric tons.cPercentage of total animal carcass production of all species including beef and dairy cattle, buffalo, poultry meat, small ruminants, swine,equids, and game.
dHuman-edible energy outputs in billions (109) of MJ and protein outputs in millions (106) of kg. Based on data presented in Table 4.14.
Table 4.11. Numbers of laying hens, productivity, and contribution of eggs to individual country/state diets a
Eggs/bird/year TotalCountry Laying stockb (at 50 g/egg) productionc Energyd Proteind
Argentina 19.0 240 228.9 1.56 26.3Egypt 19.0 147 140.0 1.02 16.1Kenya 16.8 48 40.3 0.40 4.6Mexico 126.0 196 1,233.6 8.63 141.6South Korea 46.7 192 448.0 3.14 51.4United States 284.7 253 3,601.7 24.44 413.5 California 28.0 251 350.9 2.38 40.3 Nebraska 7.9 257 101.5 0.69 11.6
aBased on FAO and USDA (1993) data from the World Wide Web.bValues expressed in millions (106) of animals.cValues expressed in thousands (103) of metric tons.dHuman-edible energy outputs in billions (109) of MJ and protein outputs in millions (106) of kg. Based on data presented in Table 4.14.

48 Animal Production Systems and Resource Use
while Egypt, Mexico, and the United States are inter-mediate at 20 to 38%, and South Korea is low in beefproduction at 15%. Swine production and consump-tion are very low in Argentina, Egypt, and Kenya (0.3to 5.2%); very high in South Korea (57.9%); and about25% in Mexico and the United States. Poultry meatproduction is higher in the United States, Korea, andMexico, than in the other countries. Small ruminantcontributions are largest in Egypt and Kenya. Thesestatistics, along with other data presented in Tables4.8–4.13, reflect a wide range in national preferenc-es, resources available, and allocations to the severalnational livestock production enterprises. Differenc-
es among three of the countries in proportion of ani-mal proteins provided by different foods from animalsare illustrated in Figure 4.36.
Several simplifications are implicit in the summa-ries presented in these tables. Data on broilers, tur-keys, ducks, and geese were combined in Table 4.10.Sheep and goat production data were combined assmall ruminants in Table 4.12. Slaughter data report-ed by FAO do not distinguish sources or previous usesof the animals slaughtered within a species. For ex-ample, dairy cattle and hens slaughtered at the endof their milk and egg production careers are incor-
Table 4.13. Number of milk cows, milk production, and contribution to individual country/state diets a
Milk cow Milk yield TotalCountry stockb (kg/cow/year) productionc Energyd Proteind
Argentina 2.20 3,282 7,220 18.4 237.5Egypt 1.47 679 1,000 2.8 34.9Kenya 4.25 489 2,080 5.7 72.8Mexico 6.48 1,178 7,630 20.8 267.2South Korea 0.32 5,806 1,806 5.1 65.0United States 9.66 7,123 68,800 175.6 2,263.3 California 1.20 8,595 10,310 26.3 339.3 Nebraska 0.09 6,223 530 1.3 17.4
aBased on FAO and USDA (1993) data from the World Wide Web.bValues expressed in millions (106) of animals.cValues expressed in thousands (103) of metric tons.dHuman-edible energy outputs in billions (109) of MJ and protein outputs in millions (106) of kg. Milk fat percentages used were 3.3% forArgentina and United States, 3.5% for South Korea and Mexico, and 3.7% for Egypt and Kenya. Based on data presented in Table 4.14.
Table 4.12. Small ruminant numbers, productivity, and contribution to individual country/state diets a
PercentageTotal of total
Country Stocksb Slaughteredb productionc productiond Energye Proteine
Argentina 28.2 5.50 72.2 2.1 621.1 10.1Egypt 6.7 4.56 94.0 10.8 808.6 13.2Kenya 12.8 4.44 50.7 14.0 435.7 7.1Mexico 16.3 4.95 70.2 2.2 603.5 9.8South Korea 0.6 0.17 2.6 0.2 22.0 0.4United States 12.0 5.46 162.4 0.5 1,397.4 22.7 California 1.1 0.96 18.1 NAf 156.0 2.5 Nebraska 0.2 0.16 2.4 NAf 20.9 0.3
aSmall ruminants refer to sheep and goats. Based on FAO and USDA (1993) data from the World Wide Web.bValues expressed in millions (106) of animals.cTotal production reflects total carcass weights in thousands (103) of metric tons.dPercentage of total animal carcass production of all species including beef and dairy cattle, swine, buffalo, poultry meat and eggs, smallruminants, equids, rabbits, and game.
eHuman-edible energy and protein outputs are in millions (106) of MJ and kg, respectively. Based on data presented in Table 4.14.f NA = not available.

Animal Agriculture and Global Food Supply 49
porated into cattle and poultry slaughter statistics.Sheep kept for wool production are incorporated intosheep slaughter data, while beef cow and bull slaugh-ter data are not separated from total beef slaughterdata. These limitations in available data dictated howcosts of animal production were assigned in calcula-tions to be presented. In a previous analysis, Bywa-ter and Baldwin (1980) incorporated feed costs asso-ciated with pregnancy and raising of replacementheifers and energy and protein yields from the slaugh-ter of calves and cull cows arising from the dairy en-terprise in their calculations of input:output relation-ships for this industry. This was possible becausespecific statistics were available for California but wasnot feasible in the case study calculations presentedhere. Therefore, nutrient costs associated with preg-nancy in dairy cattle were accounted as costs of meatproduction and only direct costs associated with thegrowth of replacement heifers and milk productionwere assigned in calculations of the efficiency of milkproduction. Similarly, costs of growing replacementhens, sows, wool-bearing sheep, and other like ani-mals were assigned to the meat-production enterpris-es.
The next steps in the case study analyses requiredthat animal populations be subdivided in terms of age,gender, size, and rates of production, to enable theenergy and protein inputs required to produce theoutputs of the several animal industries presented inTables 4.8–4.13 to be estimated. Energy and protein
Figure 4.36. Relative contributions (%) of various animal foodproducts to total animal food in Argentina, Kenya,and South Korea. Based on FAO and USDA (1993)data from the World Wide Web.
Table 4.14. Edible nutrients in one kg of carcass a
MJ g Protein g Fat
Beef Choice 9.8 139 193 Select 9.3 139 180 Utility 8.3 152 148
Pork 12.9 114 287
Poultry meat 6.7 147 107
Lambs Choice 9.3 139 179 Good 8.6 140 162
Eggsb
Whole 6.1 115 102
Milk Whole (3.5%) 2.72 35 35
aValues from USDA Handbook 8 on nutrient composition of foods.bEgg values corrected for weight of shell.
requirements of animals were calculated using appro-priate data from NRC publications on the nutrientrequirements of domestic animals. These data, alongwith information on feed resources available for eachcountry, prevailing animal production practices basedon available literature, and, often, personal commu-nications were used to formulate appropriate diets.Also, because human-edible inputs to animal agricul-ture are essential to calculations of the net contribu-tions of animals to the food supply, estimates of theproportions of human-edible energy and protein infeedstuffs used to formulate diets used in animal pro-duction were calculated. Data on the total and human-edible energy and protein contents of feeds often usedin livestock diets and incorporated into our calcula-tions are presented in Table 4.15.
An example of how animal populations were sub-
Eggs 3%Dairy26%
Swine 4%
Poultry 11%
Beef 51%
Sheep and goat2%
Fish3%
Argentina
Eggs 2%
Dairy 43%
Swine<1%
Poultry 6%
Beef 29%
Sheep and goat6%
Fish 13%
Kenya
Eggs 10%Dairy 7%
Swine 20%
Poultry 10%
Beef 6%Sheep and goat
<1%
Fish 46%
South Korea

50 Animal Production Systems and Resource Use
divided and their energy and protein intakes wereaccounted is presented in Table 4.16 for beef cattle inNebraska. This state posed a problem in that many
of the animals finished and slaughtered there are bornelsewhere and shipped in as either weaned calves oryearlings (see footnote to the table). This fact forced
Table 4.15. Dry matter (as fed) metabolizable energy, protein values, and human-edible fractions used in calculations of returns on to-tal and human-edible inputs in livestock production a
Human-edible fraction
Feedstuff % DMb MJ/kgc % Crude proteinc Energy Protein
Barley 89 11.0 10.0 0.7 0.6Bransd 89 10.5 17.1 nil nilCorn 89 14.0 8.5 0.8 0.6Cottonseed oil meald 91 12.1 45.0 nil nilForagesd 30–90 6.7–10.0 5–23 nil nilMeatmeald 93 59.0 50.0 nil nilOats 89 10.7 10.0 0.7 0.7Poultry by-products 93 12.3 60.0 nil nilSorghum 87 13.8 8.8 0.6 0.6Soybean oil meald 90 10.2 48.5 0.7 0.7Whole cottonseed 92 14.6 23.9 nil nil
aValues derived from various National Research Council publications.bUsed for calculation of dry matter (DM) in diets formulated by linear programs on an as fed basis.cExpressed on dry matter basis.dBrans includes cereal brans, distiller grains and other high quality plant by-products. Forage values used vary dependent on region and time ofyear and crop, e.g., grass hay, corn silage, etc. Meat meal value is for meat and bone meal.
Table 4.16. Basis for estimates of total and human-edible energy inputs to beef production in Nebraska
kg human-Energy Human-edible edible protein/ Human-edible
requirement Total energy Fraction energy energy input MJ human- protein inputAnimal Numbera (MJ/animal) input (MJ) human-edible (MJ) edible input (kg)b
Cows (calving) 5.580 34.1 190.00 0.10 19.00 0.003 57Cows (dry) 0.150 21.5 3.22 nil — — —Calf feed intakes to weaning at 240 kg 5.580 04.7 026.06 nil — — —Weaned calves to feedlot (240 to 535 kg) 2.790 23.7 066.18 0.40 26.50 0.014 371Stockers to 370 kg 2.790 12.7 035.54 nil — — —Stockers to feedlot (370 to 535 kg) 2.790 15.6 043.52 0.58 25.24 0.014 353Replacements 0.382 26.0 9.9 0.10 0.99 0.001 1
Total 374.40 71.73 782
aNumbers of animals in millions (106). Total number of cows calving includes 1.76 x 10⁶ cows in Nebraska and 3.82 x 10⁶ cows that producedcalves elsewhere. The calves produced elsewhere were then imported to Nebraska as weaned calves @ 240 kg (2.64 million) or as yearlings@ 370 kg (1.146 million). Dry cows represent only those in Nebraska. Estimates (Cassman, 1998) indicate that the sum of local and importedweaned calves entering feedlots directly was 2.79 million while 1.644 million of Nebraska’s weaned calves were grown on range to 370 kgbefore entering the feedlot. Feed costs for replacements are only those of Nebraska as only cows and bulls from Nebraska are represented inslaughter statistics.
bEnergy requirements in thousands (103) calculated according to National Research Council (1984). Requirements for cows calving includecosts of maintenance, activity, pregnancy, and lactation. Requirements for dry cows are costs of maintenance and activity. Energy requirementsfor replacements represent costs for maintenance and growth to maturity (545 kg). Total and human-edible energy inputs in billions (109).Human-edible protein input in millions (106).

Animal Agriculture and Global Food Supply 51
a decision to aggregate to a “greater Nebraska.” Thus,nutrient requirements for all cows producing calveslater slaughtered in Nebraska were considered in thecalculations ([1.76 ∞ 106 + 3.82 ∞ 106] ∞ [costs of cowmaintenance + pregnancy + lactation] 34.06 ∞ 103 MJ/cow year = 190 ∞ 109 MJ). The fraction of human-edi-ble energy intake for beef cows was calculated at 0.1of total intake. This is probably an overestimate, assupplements for late pregnant and lactating cowsunder pasture and range conditions are most oftencrop residues and by-products. This value reflects thedecision to present conservative estimates of returnson human-edible inputs. Forages were considered thesole inputs to dry cows and nursing and weaned calvesto the average weight of 240 kg. According to Nebras-ka estimates, half of these calves go directly into feed-lots and are fed to a finished weight of 535 kg. About40% of the several diets fed to these calves from wean-ing to finishing are human-edible. The other weanedcalves are raised as stockers on rangeland and pas-ture to 370 kg and then moved to feedlots for finish-ing. Fifty-eight % of the diets fed to these cattle dur-ing the feedlot phase are human-edible. Total energyinputs to beef production in “greater Nebraska” were374.4 ∞ 109 MJ in 1993. Of this, 19.2% (71.73 ∞ 109 MJ)was human-edible. Human-edible outputs as beef (Ta-ble 4.8) were 20.5 ∞ 109 MJ giving an estimate of grossefficiency of 6% (20.5/374.4) and an estimated returnon human-edible energy input of 29% (20.5/71.7).Comparable calculations of efficiencies of conversionof total and human-edible protein inputs yield esti-mates of 8.0% and 37% (Table 4.17).
Sample calculations of the human-edible fractionsof feedlot diets used in finishing cattle in Nebraska,California, and South Korea are presented in Table4.18. As noted earlier, Nebraska has a high percent-age (41%) of arable land and extensive pasture andrangeland. Thus, it follows that a large proportion ofbeef production is based on grazing animals and thatfeedlot rations are based heavily on maize and soy-bean oil meal. Efficiencies of forage conversion to meatare low, so the gross efficiency of energy use for pro-duction (6%) is lower than that for the United Statestaken in aggregate (Table 4.17). Similarly, the heavyuse of human-edible feeds in finishing rations loweredthe estimates of human-edible returns for energy andprotein reported in the same table. Feedlot rationsused in California (Table 4.18) are characteristicallyhigher in by-products and forage, lower in cerealgrains relative to Nebraska, and also incorporate cot-tonseed oil meal instead of soybean oil meal as theprimary protein supplement. As a result, the human-edible portion of the rations is less, at 46%. South
Table 4.17. Beef: gross efficiencies of conversion of diet energyand protein to product and returns on human-edibleinputs in products a
Energy Protein
Gross Human Gross HumanCountry efficiency edible return efficiency edible return
Argentina 0.02 3.19 0.02 6.12Egypt 0.03 NCb 0.02 NCKenya 0.01 NCb 0.01 NCMexico 0.06 16.36 0.02 4.39South Korea 0.06 3.34 0.06 6.57United States 0.07 0.65 0.08 1.19 California NC NCb NCb NCb
Nebraska 0.06 0.29 0.08 0.37
aGross efficiencies calculated as outputs of human-edible energyand protein (Table 4.8) divided by total energy and protein inputs(Table 4.16). Human-edible returns calculated as human-edibleoutputs divided by human-edible inputs (Tables 4.8 and 4.18).
bNC = not calculated. California was not calculated because manybeef calves produced in Northern California are shipped from thestate for finishing. As a result, a large portion of the cattle fed inCalifornia arise from the dairy industry. Human-edible returns forEgypt and Kenya were not calculated because human-edibleinputs are very low or nil, which would have resulted in valuesapproaching infinity.
Table 4.18. Example ingredient compositions of beef cattle fin-ishing rations and fractions of human-edible inputs
State/Country
Ingredient Nebraska California S. Korea
Barley — 5.0 —By-productsa 10.0 14.0 51.1Corn/wheat 70.0 48.0 14.3Corn silage 7.0 — —Cottonseed oil meal — 7.0 14.7Forage 5.0 20.0 13.4Soybean oil meal 5.0 — —Tallow — 3.0 4.3Minerals, etc. 3.0 3.0 2.2
Total MJ/kg 11.8 12.0 10.5
Fraction human-edible energyb 0.69 0.46 0.12
aInclude cereal brans, molasses and, in the case of South Korea,corn gluten feed, copra, and palm meals.
bCalculated as the sum of human edible constituents of diets timesmetabolizable energy value of each ingredient times the human-edible fraction of each (Table 4.17) divided by the metabolizableenergy value of the diet. For example, barley and corn are the onlyhuman-edible in the California diet. Thus, the fraction of human-edible energy in the diet is calculated as (11.0 x 0.7 x 0.05 [barley]+ 14.0 x 0.8 x 0.48 [corn])/12.0 = 0.48. Without rounding used intabular values, actual answer is 0.46.

52 Animal Production Systems and Resource Use
Korean rations for beef production are very high inby-product feeds and low in cereal grains, resultingin a slightly lower metabolizable energy density (10.5MJ/kg) than for Nebraska and California, very lowhuman-edible inputs (12%) and very high returns forhuman-edible inputs of 460 and 600% for energy andprotein, respectively. Beef production systems in Ar-gentina, Mexico, Egypt, and Kenya are largely pasto-ral in nature, so gross efficiencies are low and returnson human-edible inputs are high (Table 4.17). Human-edible inputs in Egypt and Kenya are very low, soratios of output/input approach infinity and, thus,were not calculated. Similarly, small ruminants areeither minor contributors of meat (Table 4.12) or areproduced on forage diets in the case study countries,so a table showing returns from human-edible inputsis not presented.
Swine and poultry convert feeds to products moreefficiently than do ruminants (excluding dairy cattle)but require higher quality diets and, therefore high-er human-edible inputs to perform adequately. Ra-tions formulated for swine, broilers, and layers arepresented in Table 4.19. All diets are high in metabo-lizable energy/kg (11.0 to 13.4), as are fractions ofhuman-edible energy content (0.58 to 0.73). The low-er value for the fraction of human-edible energy inSouth Korean swine diets reflects a greater use of by-products.
Swine-production systems in the United States andSouth Korea are clearly intensive in nature. Rates ofturnover of the swine populations are high, at about160%/year, indicating two farrowings per sow yearand high rates of gain due to high-quality manage-ment and the use of high-energy diets (Table 4.19).
Gross efficiencies for energy and protein inputsranged from 16 to 21%; returns on inputs of human-edible energy and protein ranged from 26 to 51%, re-spectively (Table 4.20). Swine in Argentina and Mex-ico are managed less intensively. Stock numbers andproductivity (Table 4.9) indicate a rate of turnover inthe swine population of 75%, consistent with one far-rowing per sow per year or an older age at slaughter.This results in lower efficiencies of utilization of totaland human-edible inputs (Table 4.20). Swine produc-tion in Egypt and Kenya makes small contributionsto total meat production in these countries (Table 4.9).Diets are low in nutrient density, leading to low ratesof production and, in turn, low gross efficiencies and
Table 4.19. Example rations for intensive swine and poultry production systems a
Swine Broilers Layers
Ingredient United States S. Korea California S. Korea United States
Barley/oats 33.0 — — — 2.0By-products 1.8 20.2 10.7 7.9 13.6Corn/wheat 49.2 59.1 68.3 71.2 65.6Soybean oil meal 12.0 14.2 15.9 16.7 14.8Tallow/fat 1.0 3.5 2.1 1.0 1.0Minerals, etc. 3.0 3.0 3.0 3.2 3.0
Total MJ/kg 11.7 11.0 13.4 13.2 12.0
Fraction human-edible energy 0.73 0.58 0.62 0.65 0.62
aRations for gestation, lactation, growing and lactation in intensive production facilities for swine are very similar within most countries incomposition and fractions of human-edible energy and protein. Therefore, a single ration was used for all swine in each country. Rations forthe United States and California were formulated using linear programs and ingredient prices as of November 1997. Rations for South Koreawere provided by W. J. Maeng, 1998.
Table 4.20. Swine: gross efficiencies of conversion of diet energyand protein to product and returns on human-edibleinputs in products a
Energy Protein
Gross Human- Gross Human-Country efficiency edible return efficiency edible return
Argentina 0.15 0.24 0.07 0.11Egypt 0.16 0.64 0.09 0.43Kenya 0.16 0.54 0.10 0.39Mexico 0.13 0.25 0.08 0.21South Korea 0.20 0.35 0.16 0.51United States 0.21 0.31 0.19 0.29 California 0.18 0.26 0.19 0.30 Nebraska 0.21 0.28 0.17 0.29
a Gross efficiencies calculated as outputs of human-edible energyand protein (Table 4.8) divided by total energy and protein inputs(Table 4.16). Human-edible returns calculated as human-edibleoutputs divided by human-edible inputs (Tables 4.9 and 4.19).

Animal Agriculture and Global Food Supply 53
relatively high returns on human-edible inputs (Ta-ble 4.20).
Poultry meat and egg production systems follow avery similar pattern to that observed with swine.Countries with abundant cereal grains and those thatchoose to divert their more limited cereal grain re-sources to poultry meat production utilize diets rang-ing from 11.5 to 13.4 MJ/kg (Table 4.19). Gross effi-ciencies of energy and protein conversion for thesediets range from 15 to 23% and 24 to 38%, respective-ly, while returns on human-edible energy and proteininputs range from 28 to 89% and 69 to 224%, respec-tively (Table 4.21). Relatively high quality poultryrations are used in Argentina but gross efficienciesand human-edible returns are somewhat lower thanin, for example, South Korea and the United States.This seems to be attributable to significantly higheraverage live weights at slaughter. Poultry rations inEgypt and Kenya are significantly lower in quality butare still of good quality, resulting in similar gross ef-ficiencies of energy and protein conversion of 15 and24% and 23 and 38%, respectively. Returns on human-edible inputs in these two countries were quite high,at 68 and 163% and 89 and 224%, respectively, reflect-ing low human-edible inputs (Table 4.21).
Laying hens in Argentina, Mexico, South Korea,and the United States are of high genetic merit andare fed high-quality diets. This is reflected in eggyields per bird year of 190 to 250. Eggs per bird yearin Egypt are lower at 147, probably reflecting dietssomewhat lower in quality, given established relation-ships between energy density of diets and productiv-ity. Egg yields by hens in Kenya are very low (48 perbird year), probably reflecting an extensive manage-
Table 4.21. Poultry meat: gross efficiencies of conversion of dietenergy and protein to product and returns on human-edible inputs in products a
Energy Protein
Gross Human- Gross Human-Country efficiency edible return efficiency edible return
Argentina 0.18 0.28 0.30 0.69Egypt 0.15 0.68 0.24 1.63Kenya 0.23 0.89 0.38 2.24Mexico 0.20 0.34 0.33 0.83South Korea 0.21 0.30 0.34 1.04United States 0.19 0.28 0.31 0.62
aGross efficiencies calculated as outputs of human-edible energyand protein (Table 4.8) divided by total energy and protein inputs(Table 4.16). Human-edible returns calculated as human-edibleoutputs divided by human-edible inputs (Tables 4.10 and 4.19).
Table 4.22. Eggs: gross efficiencies of conversion of diet energyand protein to product and returns on human-edibleinputs in products a
Energy Protein
Gross Human- Gross Human-Country efficiency edible return efficiency edible return
Argentina 0.17 0.26 0.23 0.45Egypt 0.12 0.57 0.15 0.88Kenya 0.06 0.23 0.04 0.22Mexico 0.14 0.25 0.19 0.38South Korea 0.14 0.20 0.19 0.31United States 0.17 0.24 0.24 0.36 California 0.17 0.27 0.23 0.47 Nebraska 0.18 0.23 0.24 0.33
aGross efficiencies calculated as outputs of human-edible energyand protein (Table 4.8) divided by total energy and protein inputs(Table 4.16). Human-edible returns calculated as human-edibleoutputs divided by human-edible inputs (Tables 4.11 and 4.19).
ment system wherein low-quality diets are fed to birdsof lower-than-average genetic merit (Table 4.11). Asimilar pattern is evident in the efficiency data pre-sented in Table 4.22. Gross efficiencies of energy andprotein conversion in countries with intensive produc-tion systems were 14 to 17% and 19 to 24%, respec-tively. Returns on human-edible energy and proteininputs in these countries were 20 to 26% and 31 to45%, respectively. Returns on human-edible energyand protein inputs in Egypt were high at 57 and 88%,reflecting low human-edible feed inputs, as indicatedpreviously.
Dairy cows are characteristically fed diets contain-ing high percentages of forage, as indicated in Table4.23. As a result, fractions of human-edible energy indiets are low, even for high-producing animals. U.S.diets have the highest fraction of human-edible input(30%) among the case study countries, due to cerealgrain content and widespread use of soybean oil mealas a protein supplement. The value for California issomewhat lower at 23% due, in part, to the use ofwhole cottonseed in the rations. Values for Argenti-na (19%) were lower yet, because of lower cereal grainuse and higher forage utilization. The human-ediblefraction of 9% for South Korea reflects high use of for-age and by-products. Rations used in Mexico were alsolow in human-edible inputs, while those in Egypt andKenya included none.
Milk yields per cow varied greatly in the severalcase studies, from a low of 489 kg/yr in Kenya to a highof 8,595 kg/yr in California. These differences can beattributed to differences in genetic potential and di-ets, and to alternative uses of the cattle, particularlyin Egypt and Kenya, where very little genetic im-

54 Animal Production Systems and Resource Use
provement has occurred in the national herds andcattle are used for multiple purposes (see Chapter 2on indirect contributions of animals to food produc-tion). Major differences are attributable to differenc-es in rations offered to lactating cows. California hasthe highest milk production of any state, due mostlyto the availability of very high-quality alfalfa andwhole cottonseed. The genetic potential of dairy cowsin South Korea is comparable to that of dairy cattlein the United States. Thus, the difference in milk pro-duction is almost totally due to the lower metaboliz-able energy of diets fed, 8 MJ/kg compared to 10.9 MJ/kg. Rations fed in Argentina are relatively high inmetabolizable energy at 10 MJ/kg but metabolizableenergy derived from forages and by-products (89% ofration) is not utilized as efficiently for lactation as isenergy derived from cereal grains. Indeed, all newsystems for formulating diets for dairy cattle, e.g., U.S.National Research Council, U.K. Agricultural Re-search Council (ARC), correct for this difference. Dairycows in Argentina may be somewhat lower in geneticpotential than those in the United States but support-ing data are lacking. Milk production in Egypt and
Table 4.24. Milk: gross efficiencies of conversion of diet energyand protein to product and returns on human-edibleinputs in products a
Energy Protein
Gross Human- Gross Human-Country efficiency edible return efficiency edible return
Argentina 0.19 4.61 0.16 1.64Egypt 0.09 NCb 0.10 NCKenya 0.07 NCb 0.09 NCMexico 0.12 0.79 0.11 1.06South Korea 0.26 3.74 0.19 14.30United States 0.25 1.07 0.21 2.08 California 0.27 1.16 0.23 2.26 Nebraska 0.23 1.07 0.20 2.04
aGross efficiencies calculated as outputs of human-edible energyand protein (Table 4.8) divided by total energy and protein inputs(Table 4.16). Human-edible returns calculated as human-edibleoutputs divided by human-edible inputs (Tables 4.13 and 4.23).
bNC = not calculated.
Kenya reflects, in part, the low quality of forages avail-able. Respective gross efficiencies of conversion of dietenergy and protein to milk energy and protein were25 and 26% in the United States, 19 and 21% in SouthKorea, and very low in Egypt and Kenya (Table 4.24).Human-edible returns in the United States were allhigher than 1.0, indicating that dairy cows add to thesupply of energy and protein for human consumption.Values for South Korea and Argentina were 3.74 and4.61, indicating that dairy cattle make a major addi-tion to the human energy supply. Because human-edible inputs in Egypt and Kenya are very small, hu-man-edible returns would be extremely high and arenot presented because the numbers are meaningless.In the United States, returns on protein inputs wereessentially 200% and, in Argentina, 164%. Human-edible protein inputs in South Korea are low. As aresult, the return on inputs was 14-fold, indicating amajor contribution of the dairy industry to the sup-ply of high-quality protein for the country’s popula-tion.
Table 4.23. Example rations for dairy production systems a
Ingredient Argentinab United States California S. Koreab
By-products 19.0 10.0 11.0 —Cereal grains 6.0 20.0 25.0 10.0Foragec 70.0 60.0 54.0 85.0Oil mealsd 2.0 8.0 8.0 3.0Other 3.0 2.0 2.0 2.0Total MJ/kg 10.0 10.9 10.9 8.0Fraction human- edible energy 0.19 0.3 0.23 0.09
aRations described are weighted averages of several used atdifferent stages of a one-year lactation cycle.
bBased on information provided by Daniel Rearte of INTA forArgentina and by W. J. Maeng for South Korea.
cForages include alfalfa, corn silage, grass hay, and pasture.dOil meals include sunflower, soybean and cottonseed oil meals,and whole cottonseed.

Animal Agriculture and Global Food Supply 55
Meeting the projected global demand for foods ofanimal origin in the year 2020 will require a produc-tion increase of more than 50% for meat, milk, andeggs. This calls for an increase in the feed supply orin the efficiency with which animals convert feed tofood or, most probably, both.
Feed SuppliesAs detailed in the preceding section, many types of
feedstuffs are used for animal production. Potentialincreases in the amounts of different groups of feed-stuffs vary and, particularly for ruminants, ampleopportunity exists to substitute one type of feed foranother. We consider here the prospects for increas-ing the feed supply in different categories, noting thatan increase in feed quality, e.g., higher energy andprotein contents, would increase nutrients availableto the animal and therefore be equivalent to an in-crease in feed supply.
Range ForageNearly all grazable areas, particularly in develop-
ing countries, are now grazed (Figures 5.1–5.5). Aninteresting exception is the rubber and oil palm plan-
5 Meeting Future Demand for Livestock Products
55
Figure 5.1. Goats grazing semi-arid brushland in Kenya. Pho-tograph courtesy of Eric Bradford, University ofCalifornia, Davis.
Figure 5.2. Smallholder sheep flock in the High AtlasRange in Morocco. Photograph courtesy ofEric Bradford, University of California, Davis.
tations of Southeast Asia and elsewhere (see Box 6)but, in general, prospects for expansion of grazingland in these countries are limited. Interest is grow-ing in alternative and additional uses of rangeland,such as recreation, biological preserves, crop produc-tion, industrial development, and housing. Some ofthese uses are compatible with continued grazing andsome are not. While some areas now grazed are goodpotential cropland (for example, in parts of LatinAmerica, notably Argentina), conversion of rangelandto crop production in low-rainfall areas is particular-ly disadvantageous. As stated in a report of a studyof grasslands in Northern China (National Research

56 Meeting Future Demand for Livestock Producers
Figure 5.4. Different environments and forage quality involvedifferent breeds for most efficient production. Dualpurpose (dairy/beef) cattle in a good rainfall area inGermany. Photograph courtesy of Eric Bradford,University of California, Davis.
Figure 5.5. Crossbred beef cattle in a dry summer climate inCalifornia. Photograph courtesy of Eric Bradford,University of California, Davis.
Council, 1992), “The cultivation of land previouslydevoted to livestock grazing reduced the area avail-able to feed livestock. Later, when crops grown inmarginal areas failed, land erosion followed and via-ble rangeland was lost—now and for many years tocome.”
Substantial improvements are possible in forageproduction from rangelands by better grazing man-agement and more effective use of tools such as fireand modifying species composition. Improvements ingenetic potential of animals for specific productionenvironments, as well as in the management of theanimals, also will increase productivity. As discussedin Chapter 5, environmental and alternative use is-sues related to rangelands will have important im-
pacts on what can be done (Figures 5.8–5.11). Diver-sion of rangeland to alternative uses will counter atleast a portion of the gains from using more efficientand sustainable technologies.
Cultivated ForagesCultivated forages have received much less atten-
tion from plant scientists than have cereal, fruit, andvegetable crops. As a result, great potential exists toimprove yield and quality of forage crops throughdevelopment of new varieties and cultural practices.An important question is how much land will be avail-able for these crops. On one hand, as demand for foodcrops increases, pressure will grow to devote landcurrently used for forage crops to food crop produc-tion (with potential impacts on soil erosion) (see Box3). On the other hand, substantial areas of land for-merly used to grow forage crops, e.g., in the northerntier of states in the eastern and central United States,are now idle. The primary reason is that livestockproduction from these lands is not currently profit-able. Some of the lands are reverting to forest; oncethat has happened, that may be their preferred use.However, much of this land represents a potentialreserve for future livestock production that could betapped if an increase in prices for ruminant productsmade it profitable. An increase in real prices of cere-al grains would likely result in increased demand forforages, particularly good quality ones.
Crop Residues and By-ProductsIn general, crop residues and by-products are ex-
pected to increase in proportion to increases in food
Figure 5.3. Rotational grazing of seeded pastures in NewZealand. Photograph courtesy of Howard Meyer,Oregon State University, Corvallis.

Animal Agriculture and Global Food Supply 57
Most areas of the world that produce potentiallygrazable forage are usually fully utilized for livestockgrazing. An interesting exception is the forage that growsnaturally under estate tree crops, such as rubber and oilpalm, of which there are several million ha in SoutheastAsia alone, as well as substantial areas in Africa andLatin America (Figures 5.6 and 5.7).
The total amount of forage potentially available fromthese tree crop production systems is substantial. Theenvironments are characterized by relatively high anddependable rainfall year round and, therefore, year-round green forage, an obvious advantage for livestockproduction. Use of this forage by livestock can reduce theneed for herbicide use by 18 to 38%, an important envi-ronmental advantage. Livestock production has the po-tential additional advantages to the landowners, wheth-er of large or small holdings, of income diversificationand greater use of available labor, including family la-bor.
Livestock production from this resource presents spe-cial challenges, in two respects in particular. One is tem-poral variation in forage supply. While the environmentsupports year-round forage growth, there is a five- or six-fold or greater variation in amount of forage over the lifecycle of the tree crop, e.g., about 25 years for rubber plan-tations. Forage production is abundant in the first fewyears after the trees are planted, decreases to a very lowlevel as the canopy closes, and increases again in lateryears as individual trees are lost. Thus, availability ofstands of trees planted at regular intervals in adjacentareas is essential to maintaining a relatively uniformnumber of animals. Second, the warm, humid climateyear round, ideal for forage production, is also ideal forthe maintenance of high internal parasite challenges tothe animals.
Challenges, opportunities, and approaches to utiliz-ing this important resource are discussed in the volumeedited by Iniguez and Sanchez (1991).
Utilization of Forage Growing under Estate Tree Crops for Livestock Production
Figure 5.6. Sheep grazing under young rubber trees in NorthSumatra. Photograph courtesy of Eric Bradford,University of California, Davis.
Figure 5.7. Goats grazing on a small landowner’s holdingsthat include banana plants. Photograph courtesyof Martin Vavra, Oregon State University, Burns,Oregon.
crop production. The ratio is not always one to one;for example, the short-straw cereals of the green rev-olution had a higher ratio of grain to total plant (har-vest index) than the taller cereals they replaced. As aresult, crop residue yield increased less than grainyield. However, the harvest index may be nearing aphysiological maximum in these cereals; thus, thecurrent proportionality between food crops and theresidues and by-products for animal feed may change
little in the future. If the harvest index remains rela-tively unchanged and food crop production parallelshuman population, the per capita supply of animalproducts from this source should at least be main-tained and could be increased with more research onimproved utilization. However, meeting increased percapita demand for meat, milk, and eggs will likelyrequire increases in other feed sources.
Box 6

58 Meeting Future Demand for Livestock Producers
Feed Grains
Projected DemandMeeting projected demand for animal products is
expected to require an increase in the global supplyof feed grains. In addition to the prospect that othersources of animal feedstuffs are projected to keep pacewith but not exceed human population growth, thegreatest increases are projected in pig, poultry, andaquaculture production, which require high-energydiets. The fact that animals of all species fed highernutrient-density diets produce more product per ani-mal in less time is also a factor favoring increased useof feed grains.
Information on total feed grain use for selectedcountries and regions in 1983 and 1993 and projec-tions for 2020 from the IFPRI IMPACT model (Roseg-rant et al., 1997) are presented in Table 5.1. Theserepresent past and projected use for all animals, i.e.,meat, milk, and egg production. The approach andassumptions used for projecting feed grain use aredetailed by Rosegrant et al. (1997).
The projection of world feed grain requirements of927 Mt for 2020 represents a 46% increase from the1993 total, which would require a 1.4% annual com-pound growth rate in supply, i.e., slightly more thanthe human population growth rate projected for thatperiod.
Projections from the IMPACT model baseline sce-nario (Table 5.1) assume little change in conversionrates of animal feed to human food. Two factors, act-ing in opposite directions, can be envisioned thatwould affect global conversion rates. One is an im-
provement in conversion rate due to better animalproduction technology. Significant improvement inaverage feed conversion rates globally has occurredin recent years and several potential means of furtherincreases are outlined later in this report. Continu-ing improvement at the rate that seems to have oc-curred from 1983 to 1993 (see Table 5.2) would meanthat the increased global demand for meat could bemet with a smaller increase in global feed grain sup-ply.
Other factors could increase the amount of grainrequired per unit of product, particularly meat. Asnoted in Table 4.5, the apparent grain requirementfor meat production in developing countries is lowcompared to that in developed countries. In China, theworld’s largest meat-consuming country, total feedgrain use (for all animal production) as reported byFAO was 73 Mt in 1993 (Table 5.1); total meat pro-duction was 39 Mt. Data are not available for Chinaon feed grain used for milk and egg production butusing the averages for Asia of 16% for milk and 20%for eggs (Hendy et al., 1995) would indicate 47 Mt(64% of 73) of grain used for meat production, for agrain:meat ratio of 1.20. This is a remarkably lowgrain requirement, particularly for a country wherepigs are the dominant species, and indicates use oflarge quantities of feedstuffs not recorded in nation-al feed supply statistics, such as kitchen wastes andlocally produced feeds. Inaccuracies in either the meatproduction or feed use statistics might also be factorsin the surprisingly low ratio.
With rapid urbanization and industrialization incountries such as China, including an increase in in-
Figure 5.8. Typical intermountain United States cattle operationwith cows grazing private meadowland and publicrangeland in the mountains in the background. Pho-tograph courtesy of Martin Vavra, Oregon StateUniversity, Burns, Oregon.
Figure 5.9. Livestock grazing systems can be developed thatare compatible with or in some cases may actuallybenefit wildlife. Burrowing owl in western range-land. Photograph courtesy of Martin Vavra, OregonState University, Burns, Oregon.

Animal Agriculture and Global Food Supply 59
dustrial pig and poultry production, it seems unlike-ly that the amounts of kitchen wastes and other cur-rently nonrecorded feeds used for animal productionwill rise as rapidly as total production, which in Chi-na is forecast to more than double by 2020. Thegrain:meat ratio may, therefore, rise, due to an in-crease in proportion of grain in average livestock di-ets, even with a concurrent increase in biological effi-ciency.
To examine the possible impacts of each of thesekinds of changes, the IMPACT model was re-run with
two alternative sets of assumptions (Delgado et al.,1999):
Scenario A. Increasing feed conversion efficiency rel-ative to baseline, based on improved animal-produc-tion technologies.
• Developed countries: 0.5% per year improvementin average conversion rate of feed grain to foodproduct from now to 2020.
• Developing countries: 1.0% per year improvement
Table 5.2. Estimated increase in feed grain conversion efficiency, 1983 to 1993
Developed countries Developing countries
1983 1993 Change 1983 1993 Change
Total meat (Mt)a 88 99 +12% 50 89 +78%Total feed grain (Mt)b 453 443 126 194Feed grain for meat (Mt)c 290 284 –2% 74 114 +54%Grain/meat 3.30 2.87 1.48 1.28Conversion rate (meat/grain) 0.30 0.35 +15% 0.68 0.78 +15%
aFrom Table 2.3.bFrom Table 5.1.cAssuming percentage of total feed grain fed to meat animals was the same for both periods (64% and59% for developed and developing countries, respectively; Table 4.5).
Table 5.1. Past and projected trends in use of cereal as feed, to the year 2020 a
Per capitaTotal cereal use cereal use
Annual growth rates as feed as feed
Projected cereal useCereal production Cereal use as feed as feed
1982–1993 1982–1993 1993–2020 1983 1993 2020 1993 2020
Region %/yr Mt kg
China 2.0 5.8 3.2 40 73 171 62 120India 3.2 3.5 3.0 2 4 8 4 6Other East Asia –2.0 6.7 2.5 4 11 22 115 183Other South Asia 2.1 1.5 2.9 1 2 4 7 8Southeast Asia 2.4 8.6 2.9 6 15 32 32 49Latin America 0.7 2.5 1.9 38 54 90 118 137WANAb 3.9 1.8 2.1 23 34 60 92 94Sub-Saharan Africa 4.1 5.3 2.3 2 2 4 4 4Developing world 2.3 4.3 2.6 126 194 390 45 62Developed world 0.2 0.1 0.7 453 443 536 346 386United States 0.0 1.0 0.9 132 159 199 603 622World 1.3 0.9 1.4 579 637 927 115 120
aSources: Delgado, et al., 1998. Raw data prior to 1995 from FAOSTAT (9/17/97) and projections to 2020 from the IFPRI IMPACT model(Rosegrant et al., 1997).
bWANA = western Asia and North Africa.

60 Meeting Future Demand for Livestock Producers
in average conversion. (A higher value than fordeveloped countries was assumed because of thegreater gap currently between actual and poten-tial production levels.)
Scenario B. Decreasing apparent feed conversion ef-ficiency of the human-edible portion of livestock di-ets, relative to baseline, due to an increase in grainas a percentage of the total feed.
• Developed countries: 0.5% per year decrease inaverage conversion rate. (A lower value than fordeveloping countries was assumed because ahigher proportion of production is already fromindustrial systems.)
• Developing countries: 1.0% per year decrease inaverage conversion rate.
The effects of these changes in conversion rates ondemand for feed cereals are shown in Table 5.3. Theassumed improvement in conversion rate (Scenario A)would reduce demand, compared to the baseline pro-jection, by an average of 13% in developing countriesand 7% worldwide, while the decrease in effective con-version rate (Scenario B) would result in respectiveincreases of 16 and 8%. Changes in developed coun-tries would be very small due to the relatively smallpopulation growth and the assumption of less changein efficiency.
The results in Table 5.3 indicate changes under the
alternative assumptions of less than 1% in consump-tion of animal products in every region. While pricesof feed grains as represented by maize would changeby –17% and +21% for Scenarios A and B, respective-ly (Table 5.4), meat and milk prices are projected tochange by no more than 2%. As a result, there is lit-tle change in projected consumption, i.e., conversionrates potentially have a large impact on cereal andlivestock producers but small impacts on consumers.Trade in feed grains would be significantly affected;the model projects, for example, that imports of feedgrain by China would decrease by 46% for Scenario Aand increase 53% under B.
Global cereal grain use for feed in 1993 (1992–1994average) was 637 Mt (Table 5.1), 33% of the corre-sponding total cereal production of 1994 Mt. The IM-PACT model baseline scenario projects an increase intotal cereal demand from 1993 to 2020 of 41% (Roseg-rant and Ringler, 1997; weighted average from Table2.2). Replacing the baseline feed grain estimate withthose from Scenarios A and B, with no change in oth-er demand for cereals, changes these figures to 34%and 44%, respectively. These would require annualcompound rates of increase in total cereal productionto the year 2020 of 1.11 and 1.37%, respectively.
Which, if either, of the two scenarios is probable?Opinions vary on this issue (within this panel as wellas in published reports). We have little doubt thatincreases in biological conversion efficiency are fea-sible and probable. However, food product/grain in-
Table 5.3. Total percentage changes in projections of aggregate consumption in 2020 due to changes in assumptions relative to baseline a
Alternative Scenario A: Alternative Scenario B:Increasing feed conversion efficiencyb Decreasing feed conversion efficiencyc
Beef, sheep, Pork and Dairy Cereals used Beef, sheep, Pork and Dairy Cereals usedand goat meat poultry products as feed and goat meat poultry products as feed
Region (percent difference between new scenario and baseline)
China 0 0 0 –15 0 0 0 17India 0 1 0 –9 0 0 –1 11Other Asia (including WANAd) 0 1 1 –10 –1 0 –1 12Latin America 1 1 0 –15 0 –1 –1 19Sub-Saharan Africa 0 0 0 –12 0 0 0 14Developing countries 0 1 0 –13 0 0 –1 16Developed countries 0 0 0 –2 0 0 0 2World 0 0 0 –7 0 0 0 8
aSource: Delgado et al., 1999.bRatio of output: cereal grain input assumed to increase due to technological inprovements in animal production.cRatio of output: cereal grain input assumed to decrease due to shift to industrial production with more grain fed.dWANA = western Asia and North Africa.
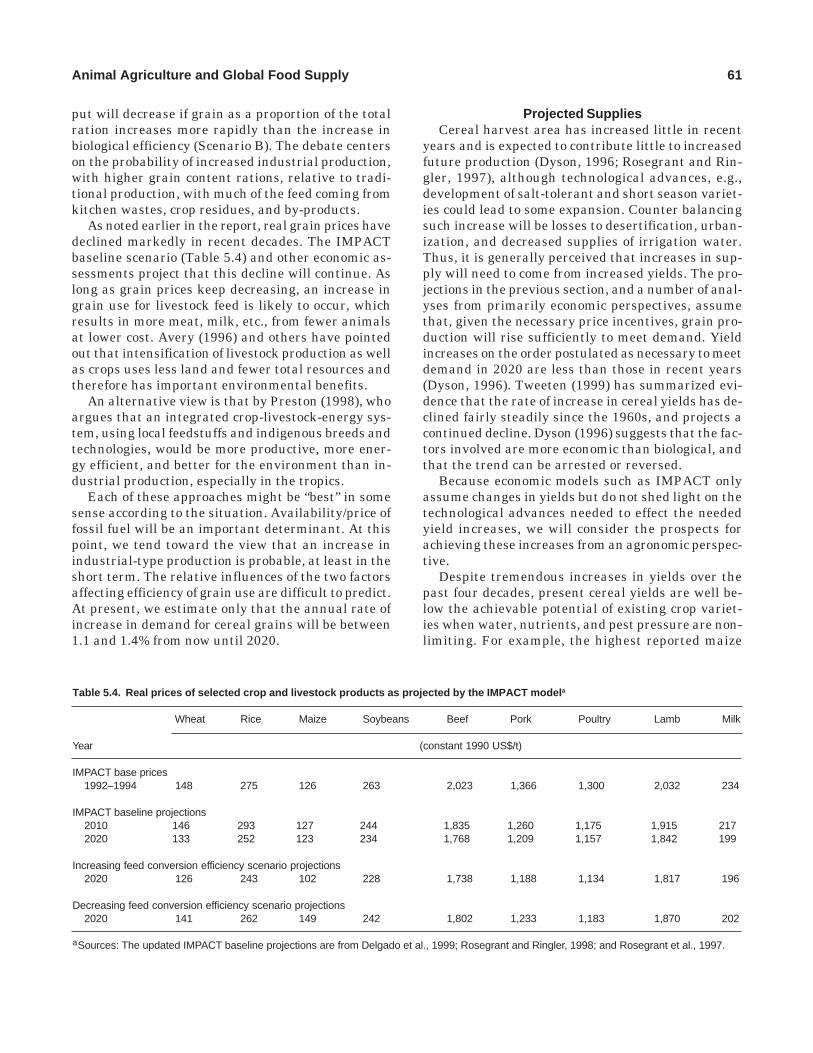
Animal Agriculture and Global Food Supply 61
put will decrease if grain as a proportion of the totalration increases more rapidly than the increase inbiological efficiency (Scenario B). The debate centerson the probability of increased industrial production,with higher grain content rations, relative to tradi-tional production, with much of the feed coming fromkitchen wastes, crop residues, and by-products.
As noted earlier in the report, real grain prices havedeclined markedly in recent decades. The IMPACTbaseline scenario (Table 5.4) and other economic as-sessments project that this decline will continue. Aslong as grain prices keep decreasing, an increase ingrain use for livestock feed is likely to occur, whichresults in more meat, milk, etc., from fewer animalsat lower cost. Avery (1996) and others have pointedout that intensification of livestock production as wellas crops uses less land and fewer total resources andtherefore has important environmental benefits.
An alternative view is that by Preston (1998), whoargues that an integrated crop-livestock-energy sys-tem, using local feedstuffs and indigenous breeds andtechnologies, would be more productive, more ener-gy efficient, and better for the environment than in-dustrial production, especially in the tropics.
Each of these approaches might be “best” in somesense according to the situation. Availability/price offossil fuel will be an important determinant. At thispoint, we tend toward the view that an increase inindustrial-type production is probable, at least in theshort term. The relative influences of the two factorsaffecting efficiency of grain use are difficult to predict.At present, we estimate only that the annual rate ofincrease in demand for cereal grains will be between1.1 and 1.4% from now until 2020.
Projected SuppliesCereal harvest area has increased little in recent
years and is expected to contribute little to increasedfuture production (Dyson, 1996; Rosegrant and Rin-gler, 1997), although technological advances, e.g.,development of salt-tolerant and short season variet-ies could lead to some expansion. Counter balancingsuch increase will be losses to desertification, urban-ization, and decreased supplies of irrigation water.Thus, it is generally perceived that increases in sup-ply will need to come from increased yields. The pro-jections in the previous section, and a number of anal-yses from primarily economic perspectives, assumethat, given the necessary price incentives, grain pro-duction will rise sufficiently to meet demand. Yieldincreases on the order postulated as necessary to meetdemand in 2020 are less than those in recent years(Dyson, 1996). Tweeten (1999) has summarized evi-dence that the rate of increase in cereal yields has de-clined fairly steadily since the 1960s, and projects acontinued decline. Dyson (1996) suggests that the fac-tors involved are more economic than biological, andthat the trend can be arrested or reversed.
Because economic models such as IMPACT onlyassume changes in yields but do not shed light on thetechnological advances needed to effect the neededyield increases, we will consider the prospects forachieving these increases from an agronomic perspec-tive.
Despite tremendous increases in yields over thepast four decades, present cereal yields are well be-low the achievable potential of existing crop variet-ies when water, nutrients, and pest pressure are non-limiting. For example, the highest reported maize
Table 5.4. Real prices of selected crop and livestock products as projected by the IMPACT model a
Wheat Rice Maize Soybeans Beef Pork Poultry Lamb Milk
Year (constant 1990 US$/t)
IMPACT base prices 1992–1994 148 275 126 263 2,023 1,366 1,300 2,032 234
IMPACT baseline projections 2010 146 293 127 244 1,835 1,260 1,175 1,915 217 2020 133 252 123 234 1,768 1,209 1,157 1,842 199
Increasing feed conversion efficiency scenario projections 2020 126 243 102 228 1,738 1,188 1,134 1,817 196
Decreasing feed conversion efficiency scenario projections 2020 141 262 149 242 1,802 1,233 1,183 1,870 202
aSources: The updated IMPACT baseline projections are from Delgado et al., 1999; Rosegrant and Ringler, 1998; and Rosegrant et al., 1997.

62 Meeting Future Demand for Livestock Producers
yields attained in commercial fields approach 22,000kg/ha (Council for Agricultural Science and Technol-ogy, 1994; Evans, 1993a). In contrast, the trend linefor U.S. maize yield indicates an average grain yieldof 8,200 kg/ha in 1997 (at 15.5% moisture content,equivalent to 131 bushels per acre), which is only 37%of the achievable yield potential of existing maizehybrids. It should be noted that more than 85% of theU.S. maize crop is produced in rainfed systems, whileirrigation is required to achieve yields that consistent-ly approach potential levels. Therefore, a large yieldgap is indicated between actual and potential maizeyields, which can be exploited by improved crop man-agement. Large yield gaps exist for the other majorcereal crops in the United States and in most otherdeveloped and developing countries. For example,average irrigated rice yield was 5.0 t/ha in 1991 on 70million hectares (Mha) in the developing countries ofAsia, which is 57% of the estimated yield potential ofpresent rice varieties (Cassman and Harwood, 1995).
Closing these yield gaps will depend on decreasingyield reductions caused by untimely field operations;inadequate nutrient and water supply; and weed, in-sect, and disease pressure. It also will depend on main-tenance of soil quality. Improved management prac-tices must assure the protection of natural resources,such as ground and surface water and wildlife habi-tat, and more efficient use of water and energy. Pop-ulation and income growth will rapidly increase de-mand for the land, water, and energy used inagricultural production. Future production systemstherefore must provide the necessary inputs, withoutexcess or deficiency and at the precise time and place,
to sustain increases in crop yields, while maximizinginput-use efficiency and minimizing potential adverseenvironmental effects.
Such a “precision agriculture” approach will requirenew knowledge of plant biology and agro-ecology andthe development of advanced information technolo-gies to improve management decisions involving amyriad of interacting factors. While considerableprogress has been made to develop information tech-nologies that facilitate a precision approach, e.g., yieldmonitors, global positioning systems, variable-rateapplicators, remote-sensing techniques, adoption ofthese tools by farmers in developed countries has beenhampered by inadequate knowledge of crop responseto climate, soils, and pests. In developing countries,precision agriculture also will be needed to sustainyield advances and protect natural resources but at adifferent scale. On small farms, precision agriculturerequires a “field-specific” approach (Cassman, 1999)and there is an additional challenge to extend infor-mation and new technologies to hundreds of millionsof farmers with average holdings of less than 5 ha. Inboth developed and developing countries, farmers willrequire greater education and technical skills to suc-cessfully implement precision agriculture techniques.
Sustained annual increases in actual yields of 1.4%eventually will lead to average yield levels that ap-proach the present yield potential limit. Assuming thisrate of increase, average farm yields will exceed 80%of the present yield potential during the next 30 yearsin several major cereal-production areas. Hence, rais-
Figure 5.10. Livestock grazing systems can be developed thatare compatible with or in some cases may actuallybenefit wildlife. Elk in western rangeland. Photo-graph courtesy of Martin Vavra, Oregon State Uni-versity, Burns, Oregon.
Figure 5.11. Sagebrush steppe rangeland that has beenungrazed for 60 years on the right side of the fenceand properly grazed on the left. Little difference inappearance and ecological condition occurs withproper grazing practices. Photograph courtesy ofMartin Vavra, Oregon State University, Burns, Or-egon.

Animal Agriculture and Global Food Supply 63
ing the yield potential is crucial for sustaining bothgreater input-use efficiency and yield increases, be-cause crop response to applied inputs is curvilinearand the marginal response to applied inputs decreas-es as yields approach the yield plateau (Council forAgricultural Science and Technology, 1994; de Witt,1992).
Compared to premodern crop varieties, the prima-ry factors contributing to the greater yield potentialof modern crop varieties are increased harvest index,which is the proportion of total plant dry matter ingrain, and modification of plant development to bet-ter fit the environment. These attributes were incor-porated into the first modern varieties of rice andwheat, the “miracle” varieties that were the drivingforce of the green revolution of the 1960s and 1970s.For maize, there was a shift to single-cross hybridsfrom double-cross and open-pollinated varieties. Butthese factors now have been widely incorporated andrefined in the varieties and hybrids released duringthe past 25 years. At issue are potential yield gainsthat can be realized from their further refinement andother innovations.
While a quantum leap in yield potential is evidentwhen modern varieties are compared with tradition-al wheat and rice varieties and modern maize hybridsare compared with open-pollinated varieties, morerecent trends are less apparent. Conflicting evidenceexists about yield potential trends during the past 25years. Evidence that indicates yield potential has notchanged comes from studies of plant physiology, long-term experiments, and yield contests. For example,there is little evidence that breeding efforts have im-proved the basic metabolic and assimilatory process-es that govern the rate of dry matter production(Evans, 1993a). Likewise, yields of the major cerealshave remained constant or even decreased during thepast 25 years in long-term experiments with irrigat-ed tropical rice in which there has been regular re-placement of older modern varieties with recent re-leases and crop management follows recommendedpractices for fertilizer inputs and pest control (Cass-man et al., 1995). Lack of a yield increase with a con-stant crop management regime suggests that cropyield potential has changed little, if at all, during thepast 25 years. More detailed analyses of yield trendsclearly indicate that rice yield potential has notchanged since the release of the first modern, semid-warf tropical variety (‘IR8’) in 1966, although morerecent, inbred varieties have earlier maturity andgreater resistance to insect pests and diseases (Khush,1993; Kropff et al., 1994). Thus, the continued increasein average rice yields achieved by farmers reflects
improved resistance to insects and diseases and bet-ter crop management.
Increased yields of maize during the past 25 yearsare associated with greater resistance to abiotic andbiotic stresses, e.g., drought, insect, diseases, and bet-ter adaptation to both short and long seasons as wellas to modern agronomic practices such as high plantdensity and responsiveness to applied nitrogen (Du-vick, 1992; Tollenaar et al., 1994). Whether maizeyield potential has increased at all during the recentpast is not clear. In fact, yield increases from greaterstress resistance and adaptation to modern agronomicpractices, rather than an increase in genetic yieldpotential, is consistent with trends in the annual yieldcontests sponsored by the National Corn GrowersAssociation in Nebraska, where both irrigated andrainfed maize are widely grown (Duvick and Cass-man, 1999). Whereas rainfed yields have been increas-ing steadily, there is no detectable yield trend withirrigation (Figure 5.12). The highest yield (21,800 kg/ha) was achieved in 1986, while the contest-winningrainfed yields are steadily increasing and are rapidlyapproaching the irrigated yield plateau. This conver-gence is at odds with the more optimistic scenario ofEvans (1993b) and Waggoner in the CAST publication(1994), who project that the gap between yield poten-tial and the average yields achieved by farmers will
25,000
Year
Yie
ld (
kg/h
a)
1982
15,000
5,000
10,000
20,000
1984 1986 1988 1990 1992 1994 1996 1998
Irrigated contest winners
Rainfed contest winners
Irrigated maximum
Figure 5.12. Maize yield trends in Nebraska from 1983 to 1997as measured in the annual yield contests spon-sored by the National Corn Growers Association(NCGA) for irrigated and rainfed production sys-tems. The dashed line with an arrow represents thetrend line for contest-winning rainfed yields. Allyields are adjusted to 15.5% moisture content.Yields are verified by independent observers andare obtained from a combined harvest of fields witha minimum size of 4 ha (data from Duvick andCassman, 1999)

64 Meeting Future Demand for Livestock Producers
not decrease in the foreseeable future. It should benoted, however, that their analyses were based onyield trends in the Iowa Masters contest, where maizeis grown under rainfed conditions. Those yield trendsare similar to the rainfed yield trends in the Nebras-ka contests, which are approaching the irrigated yieldbarrier suggested by the data in Figure 5.12.
Wheat seems to be the exception, because increas-ing yield trends are evident in long-term experimentsin Punjab, India, and the central and northwesternUnited States (Cassman et al., 1995). Additional evi-dence of increased wheat yield potential comes fromfield experiments that compare yields of varieties re-leased at different times since 1960 (Sayre et al., 1997;Waddington et al., 1986). Results from such “histori-cal” varietal comparisons, however, must be interpret-ed with caution, because the older varieties are notcompared in the environment for which they wereselected due to changes in agronomic practices, soilquality, and disease and insect pressure. For bothwheat and rice, there seems to be a yield potential gainof 10 to 20% from more widespread use of hybrid seed,because both crops are mostly grown from inbred va-rieties (Jordaan, 1996; Virmani et al., 1991).
Our conclusion is that gains in yields of the mag-nitude needed to meet projected demands for foodgrains and feed grains seem feasible through raisingaverage yields closer to the biological potential of thesecrops and through new technological innovations.Because the rate of increase in genetic potential forcrop yield seems to be declining or stagnant, sustain-ing grain production at these higher yield levels, whileconserving natural resources and protecting environ-mental quality, will be a major challenge. Achievingthe total increase in grain production to meet project-ed demand also will depend on minimizing losses ofcropland to urbanization, industrialization, and soildegradation and making required investments in re-search and education to develop and apply relevanttechnologies. Although all of these actions are feasi-ble, they will occur only with the necessary investmentof funds and effort throughout the world.
Technologies to Improve AnimalProduction Efficiency
Animal agriculture has shared in the twentieth-century revolution in agricultural technology in manyrespects, although traditional production systems con-tinue to be an important part of the global total. Wedocument here a few examples of increases in produc-tivity and efficiency and explore some opportunitiesfor the future. Additional new technologies are dis-
cussed by Heap (1998).
Examples of Achieved Efficiency IncreasesU.S. Milk Production
From 1960 to the 1990s, U.S. per cow milk produc-tion, based on production-recorded herds, increasedapproximately 65% (Bradford, 1998) and the rate ofincrease shows no signs of slowing. This increase isdue to improved genetics, nutrition, disease control,reproduction management, and other factors; im-proved genetic potential seems to account for morethan half the gain. This increased production requiresmore input per cow but the country now producesmore milk from fewer than half as many cows as werepresent at the end of World War II. Resulting savingsin labor, land requirement, and other inputs are verylarge. As shown in Table 4.24, overall efficiency of feedconversion is approximately twice as high in U.S.dairy herds as in several other countries.
This pattern has been duplicated in other devel-oped countries but to only a very limited extent indeveloping countries, with the result that the globalaverage production of 1,150 kg/cow/yr (Seré and Stein-feld, 1996) is only about 10% of that of the highest-producing herds. The opportunity for increases in ef-ficiency by applying known technologies in this areaseems to be especially good.
Growth and Feed Conversion in Broiler ChickensA comparison of a modern (1991) commercial broil-
er strain with a random-bred control with no selec-tion since 1957, using 1957 and 1991 diets and pro-duction practices, was carried out by Havenstein etal. (1994a, b). The 1991 strain on the 1991 diet grewthree to four times faster than the 1957/1957 combi-nation and required only 68% as much feed per unitof gain. Results of the two alternative combinations,i.e., 1957 strain with 1991 diet and vice versa, showedthat strain accounted for most of the difference ingrowth rate and diet for the largest part of the in-crease in conversion rate. Carcass yield as a % of liveweight and carcass fat % were highest in the 1991strain on the 1991 diet. Animals in this group also hadhigher mortality (9 vs. 3%) and a higher incidence ofleg problems. Thus, the very large increases in growthand feed conversion efficiency are accompanied bysome negative effects, although the latter are smallrelative to the gains.
Global Change in Feed Conversion RatesApparent conversion rates of grain to meat, milk,
and eggs for developing and developed countries,

Animal Agriculture and Global Food Supply 65
based on 1993 data, were given in Table 4.5. Using1983 and 1993 data on meat production and on feeduse for these regions (Table 5.1) and using the pro-portions of feed grains attributed to meat productioncalculated from the data in Table 4.5, changes in con-version rates for this period were calculated. The re-sults are presented (Table 5.2) as both output per unitof input and as the more familiar grain per unit ofmeat.
It is recognized that many of the global statisticsused for these calculations are estimates and that thedata may not be particularly accurate. However, itseems unlikely that the relative accuracy of the esti-mates of meat production and feed use would havechanged much during this decade. Assuming similarreliability for the two dates, the conclusion is thatmeat produced per unit of feed grain fed increased byabout 15% in both developed and developing countriesin one decade.
Increases in per Animal Production in AsiaSeré and Steinfeld (1996), in their summary of
world livestock production systems, note the follow-ing: “Growth rates [of animal production] have beenhighest in Asia, with a 7.8% increase annually in beefand veal production, 6.3% in sheep and goat meat,7.0% in cow milk production, 7.0% in pork, 9.6% inpoultry meat, and 9.6% in poultry eggs. Comparingthese growth rates with stock increases where possi-ble (for ruminants) it shows that there is very littlehorizontal expansion [i.e., increase in numbers of an-imals] (1.2% for cattle stock, 1.8% for sheep and goats,2.3% for cattle dairy stocks). This means that annualproductivity increases of between 4% and 6% havebeen obtained in the decade. This is unprecedentedand can only be compared to the Green Revolution incrop production in the same region during the 1960sand early 1970s.” Such increases in production peranimal and the resulting decrease in proportion offeed going for maintenance would be a major contrib-utor to the increased conversion rates noted earlier.
Rosegrant et al. (1997), using FAO data, calculat-ed annual change in meat production per animal forcattle, sheep and goats, pigs, and poultry for the pe-riods 1967–1982 and 1982–1994. While the increaseswere less than values indicated for Asia, they werepositive for all four classes of animals in both periods,for both developed and developing countries, confirm-ing a global trend towards increased productivity.
These examples, based on different regions, species,products, and sources of information, indicate increas-es in productivity of animals, which, if continued overthe period to 2020, would provide for meeting the large
projected increases in demand for foods of animal or-igin with proportionally much smaller increases ininputs. It is encouraging that increases in productiv-ity are occurring in both developing and developedcountries and that output per unit of input, as wellas output per animal, is increasing.
Potential Future Increases from ImprovedTechnologies
Successful animal production from the technologi-cal perspective involves simultaneous attention togenetic potential, nutrition, health, management, andthe production environment. Programs to improveanimal productivity may, at times, need to focus onthe most-limiting constraint, which may be any oneof these but, in general, need to pay attention to allconstraints. For example, the potential productivityof animals with superior genetics for growth, milkproduction, etc., will not be realized without adequatenutrition and health care; investment in increased nu-tritional or other inputs will not pay off with animalslacking the genetic potential to respond. Some specifictechnologies will be considered but it is emphasizedthat the interdependency of factors needs to be con-sidered when implementing change in any one area.
Animal GeneticsGenetic potential is defined as performance when
nutrition and environmental factors are not limiting.Genetic potential of domestic animals for growth, re-production, and production of desired products var-ies widely on a global basis, due to both natural se-lection and selection by humans toward a variety ofproduction objectives since domestication (Figures5.13–5.21). For example, mean milk yield of cattlebreeds, i.e., breeding populations with distinctivecharacteristics, ranges approximately from 1,000 tomore than 10,000 kg per cow per year, mean litter sizeof pig breeds ranges from 7 to 14 and of sheep from 1to 3, and mean mature weight and growth rate of cat-tle and sheep breeds varies five- to six-fold.
This between-population variation and the within-population genetic variation available for making fur-ther change provide the means for substantially im-proving the productive potential of domestic animals.Choice of improvement technologies varies with spe-cies, production system, and infrastructure.
With regard to breed variation, optimum geneticpotential is not necessarily synonymous with maxi-mum potential for growth rate, milk yield, etc. Breedsneed to be evaluated based on lifetime productivityand, if possible, biological efficiency (output/input),

66 Meeting Future Demand for Livestock Producers
Throughout the colonial era and still continuing insome countries, it often has been assumed that im-porting high genetic potential breeds is the best wayto raise productivity above the low levels observedwith locally available stocks. This frequently has metwith disappointing results. The imported animals of-ten suffer higher mortality and have lower fertilityand poorer production because of disease or temper-ature stresses to which they are not adapted, or sim-ply because the nutrients to permit them to expresstheir genetic potential are not available.
Use of breed resources to improve productivity can,with careful selection of breed(s) and some attentionto removing nutritional and other constraints, resultin one-step increases in performance of 50% or more.In general, breed transfer from one temperate envi-ronment to another is fairly successful; an exampleis the recent extensive use of North American Holsteinbreeding to increase milk yield of European dairy cat-tle. Transfer of breeds from one tropical environmentto another also can be useful. Gatenby et al. (1997)describe results of a comparison of Caribbean hairsheep crosses with a local breed in Indonesia in whichtwo crossbred groups produced 34 and 51% more to-tal lamb weight per ewe per year and an estimated15 and 26% more lamb per unit of maintenance feedrequirement than the local breed. However, a majorlimitation to improvement of tropical animal produc-tion by this method is the lack of high-production po-tential breeds in the tropics, compared to temperateregions. Thus, the choice of “improver” breeds fromthis source is limited.
Many disappointing results of breed transfer haveoccurred when breeds developed in temperate regionsare imported to the tropics and subtropics; such trans-fers should be made with great caution. New germ-plasm should be released only after the imported stockhas been shown to be superior, as a purebred or incrosses, to local breed(s), on a life-cycle basis underconditions characteristic of local farms. Such evalua-tions should include measurement of fertility, viabil-ity, veterinary costs, and length of productive life, aswell as the production traits of primary interest. It ismuch easier to produce individual animals with high-er growth rate or milk yield than to produce herdswith higher mean productivity on a life-cycle basis.Where temperate-origin breeds have contributed toimprovement of animal production in the tropics, ithas most often been as contributors to a crossbredpopulation based on local breeds.
Mention was made earlier of the large increaseseffected in genetic potential for milk yield in devel-oped countries in the last three decades and of the very
Figure 5.13. Beef cow with twin calves. Twinning in beefcattle is normally infrequent but can be in-creased by genetics. In favorable productionenvironments, twinning is a technology thatcan be used to increase efficiency of produc-tion substantially. Photograph courtesy ofJohn Dunbar, University of California, Davis.
under the nutritional and environmental conditionsin which they will be expected to perform.
In modern industrial production systems and inmixed crop-livestock systems in favorable areas, lev-els of inputs and environmental conditions are underfairly complete control by the producer. Such systemsgenerally provide the opportunity for the highest-po-tential breeds to express that potential. Such high-input, high-output systems also tend to be locatedwhere the most effective within-population geneticimprovement programs are being applied. In less fa-vorable environments, e.g., seasonal variation in for-age quantity and quality characteristic of grazing sys-tems, or the greater disease and parasite challengesin most tropical and subtropical regions, ability toutilize local feedstuffs and to survive and reproduceare more important than level of performance for pro-duction traits, such as growth rate or milk yield.

Animal Agriculture and Global Food Supply 67
large differences in yield between developed (temper-ate) and developing (mostly tropical) countries. Amajor factor in the latter difference is that tropicallyadapted breeds have lower milk production potential.Crossing between improved temperate (Bos taurus)and tropically adapted (Bos indicus) breeds results inF1s that are reasonably well adapted to the tropics andwith much higher milk yield than the Bos indicusparent (Cunningham and Syrstad, 1987). However,animals with more than 50% Bos taurus inheritanceoften have lower fertility and therefore longer calv-ing intervals (Rege, 1998) and, as the Cunninghamand Syrstad review showed, F2 and later generationsof the 50:50 combination consistently are substantiallyinferior to the F1. As a result, a high milk yield breedwell adapted to the tropics is a goal not yet achieved,in spite of much effort in many countries over the pastcentury. Rutledge (1997) has suggested an ingeniousplan for continuous production of F1s using embryotransfer that may be logistically and economically fea-sible in some tropical countries.
Availability of breed resources for effecting futuregenetic improvement depends on conserving existingbreed variation. One unfortunate consequence of in-appropriate breed importations, in addition to the riskof failure to effect genetic improvement, has been di-lution or loss of indigenous stocks with valuable ge-netic adaptation to local environments and markets.An important global need is for systematic evaluationof indigenous breeds, assessment of relationshipsamong them, and implementation of programs to con-serve those with unique performance characteristicsor that are most distinctive genetically.
Selection within populations can increase produc-tivity 1 to 2% per year, occasionally more. Such ratesoften are perceived as slow but they are cumulativeand permanent. The dairy cattle case described ear-lier represents an increase of this order consistentlyover three decades and, to date, there is no evidenceof diminution of response. Thus, where achieved,these rates would permit maintaining or increasingglobal per capita availability of animal products with-out an increase in the numbers of breeding animals.
Selection programs to increase animal performancedepend on extensive recording of performance, usingthe records to identify genetically superior animals,and using those animals for breeding. Effective genet-ic evaluations depend on sophisticated statisticalmethodologies and computers. Effective dissemina-tion of superior germplasm depends, at least in somespecies, on widespread use of technologies such asartificial insemination (AI).
These conditions generally are met in developedcountries. Dairy and beef cattle breeding is based onsystematic performance recording in large numbersof herds, objective genetic evaluations carried out bygovernmental or large breed organizations with pro-fessional scientific staff and extensive computing ca-pability, and provision of AI service by governmentalagencies or large commercial firms. Embryo transfer,which can further increase intensity of selection, alsois generally available and increasingly used.
Poultry breeding in developed countries is nowdone almost exclusively by a small number of largefirms that maintain large breeding flocks and havetheir own scientific staff to supervise performance
Figure 5.14. Genetic potential matched to the production envi-ronment and markets of a region are important toefficient animal production. Jersey and Friesiancattle in the United Kingdom. Photograph courtesyof Eric Bradford, University of California, Davis.
Figure 5.15. Genetic potential matched to the production envi-ronment and markets of a region are important toefficient animal production. Red Sindhi (Zebu)cattle in India. Photograph courtesy of EricBradford, University of California, Davis.

68 Meeting Future Demand for Livestock Producers
recording and perform genetic evaluations. Dissemi-nation of the improved stocks is done by providingbreeding stock (hatching eggs) to franchised multipli-er enterprises. The latter then produce and sell birdsto commercial producers. The commercial birds aretypically a three- or four-way cross involving propri-etary strains of the breeding firm. This maximizesexploitation of hybrid vigor (heterosis) and also en-sures that the commercial producer must continuous-ly return to the breeding firm, rather than breedingfrom the commercial animals, to obtain the highestgenetic potential.
Pig breeding is rapidly evolving a similar patternto that of the poultry breeding industry. For both poul-try and pigs, most breeding firms operate internation-ally, placing control of genetic improvement in thesetwo species with a relatively small number of inter-national firms. The utilization of a small number ofhigh-performance potential stocks is facilitated by thefact that industrial poultry and pig production in-volves highly standardized systems, which minimizenutritional and environmental constraints character-istic of traditional systems. (Such industrial systemsdepend heavily on relatively low feed grain prices andglobal trade in feed grains.) The breeding system isvery efficient in effecting and disseminating geneticimprovement; however, it is generating some concernabout loss of genetic diversity to meet changed needsin the future (Council for Agricultural Science andTechnology, 1999).
An alternative structure to effect genetic improve-ment in livestock is cooperative or group breedingschemes, often referred to as nucleus programs. De-
veloped initially for sheep improvement in NewZealand (Parker and Rae, 1982), the system involvesscreening a large population, comprising all of theanimals in many flocks, for superior animals, whichthen are placed in one flock to produce breeding ani-mals (predominantly males) for all participatingflocks. In principle, the system is similar to the breed-ing firm/franchise hatchery system described for poul-try, except that it is a cooperative venture, usuallywith opportunity for superior animals from participat-ing flocks to enter the nucleus on a continuing basis(open nucleus). Properly organized, such systems cancause genetic change as rapidly as the AI/nationalgenetic evaluation breeding plans described for cat-tle or the large-firm poultry- and pig-breeding struc-ture. Such programs have been successfully imple-mented for sheep, cattle, and goat improvement inNew Zealand, Australia, South Africa, and elsewhere.
The situation in developing countries for dairy,beef, sheep, and goat production—and also for muchpoultry and pig production—can be quite differentfrom that in developed countries. Herd/flock size,farmer education levels, lack of infrastructure, andother factors limit uniform performance recording onlarge numbers of animals. The availability of geneticevaluation expertise and computing capability areirrelevant without performance data. Disseminationof improved genetic material may be constrained bylack of communication systems, roads, reliable vehi-cles, etc. needed for successful AI.
Under these circumstances, many selection pro-grams used effectively in developed countries cannotbe implemented in developing countries. Importationand use of improved breeds or other crosses with lo-cal breeds may be an effective means of improvement(McDowell, 1994) provided nutritional and health con-straints can be sufficiently alleviated. In principle,successful implementation of cooperative breedingplans should be possible whenever a group of produc-ers agree to do so but farmer education levels and lackof effective extension programs mean that few, if any,such programs have been implemented in developingcountries.
As the economies of countries or regions developand increased demand for animal products contrib-utes to higher or at least more stable prices, produc-ers should be able to afford increased inputs. This willpermit greater use of “improved” breeds and theircrosses, more effective use of indigenous breed re-sources, and increased investment in record keepingand selection. As this happens, at varying rates indifferent parts of the world, improved genetics can beused to help close the very large gaps between poten-
Figure 5.16. Genetic potential matched to the production envi-ronment and markets of a region are important toefficient animal production. Zebu ∞ Friesian cowin India. Photograph courtesy of Eric Bradford,University of California, Davis.

Animal Agriculture and Global Food Supply 69
tial production levels and those now characteristic ofmany livestock populations.
BiotechnologyBiotechnology, which may be used in any of the
animal science disciplines, often is listed as a poten-tially powerful tool for improving animal productivi-ty and eventually may well prove to be so. To date, ithas been used to improve efficiency and effectivenessof disease diagnosis and to develop vaccines for dis-ease prevention. Monoclonal antibody techniques arebeing used in some 20 new diagnostic tests, includ-ing for bovine viral diarrhea (BVD), sarcocystis, chl-amidia, and toxoplasma. Polymerase chain reaction(PCR) methods are being used routinely to diagnoseBVD, Johne’s disease, blue tongue, and mycoplasma,as well as other diseases. Genetically engineered vac-cines for pseudorabies in hogs and for infectious laryn-gotracheitis in poultry are now available. A doublerecombinant vaccine for rinderpest has been devel-oped and is being field tested in Kenya and Ethiopia(Giavedoni et al., 1991; Yilma, 1994). This vaccine notonly provides protection to the vaccinated animalsbut, because it does not require refrigeration, veteri-nary services in developing countries can now carryout much more effective campaigns against rinderp-est.
Another application is the use of recombinant bo-vine somatotropin (rBST) to increase milk productionfrom intensively managed dairy cows.
With respect to genetic improvement of animalproductivity and product quality, biotechnology hasso far had relatively little impact. In the future, itseems probable that product composition may bene-fit more than production efficiency, for two reasons.One is that product composition, e.g., amount of fator fatty acid composition in meat, milk, or eggs, tendsto be less complex, from a genetic perspective, thantraits such as growth or reproduction, and thus easi-er to modify genetically. Second, funding for biotech-nology research is largely from private sources, so itis likely to be more feasible to patent changes in prod-uct composition than in a trait such as yield or feedconversion rate. Given the remarkable contributionsof past scientific achievements to increasing animalproductivity, it would be unwise to rule out any pos-sibility. Technologies that result directly in increasesin yield or efficiency may be developed, even thoughthey are not on the immediate horizon.
One approach that could have large indirect bene-fits for yield and efficiency is breeding for disease andparasite resistance. To date, it has received much lessattention in animal than in plant breeding but is cur-
rently receiving more emphasis by animal breeders.Its impact could be particularly important in the trop-ics and subtropics, where animal productivity andanimal product consumption are, on average, low.This field is seen as having especially good potentialfor applying biotechnology to augmenting human foodsupply.
Cloning, i.e., making genetically identical copies ofan individual, recently has been achieved using cellsfrom adult animals (Wilmut et al., 1997). Cloning thebest individuals has been a very effective tool used incrop improvement for millennia. It is not clear wheth-er large-scale, low-cost cloning will ever be feasible indomestic animals but its availability would be an im-portant tool for improvement of livestock productionefficiency and product uniformity.
There are two types of concerns regarding biotech-nology. One is that it may produce environmental orhealth hazards and therefore should not be used; thisconcern has resulted in constraints on the use of ge-netically engineered materials in food production inEurope (Science, 1998). The second is that misinfor-mation disseminated by opponents of biotechnology,based on the first kind of concern, can lead to legisla-tion and policies that will prevent the adoption of tech-nologies with important potential to improve thequantity or quality of the human food supply, even fortechnologies thoroughly tested and proven safe (Pin-strup-Andersen et al., 1997).
Animal HealthDisease prevention and control are essential to ef-
Figure 5.17. Zebu cows typically require presence of the calf atmilking time for proper milk let-down. This is notthe case for specialized dairy breeds such as Frie-sians. Zebu cow in India. Photograph courtesy ofEric Bradford, University of California, Davis.

70 Meeting Future Demand for Livestock Producers
ficient animal production. Prevention may be effect-ed by exclusion, accomplished through strictly en-forced import restrictions, quarantine, etc., by vacci-nation, by elimination of disease vectors, or by use ofgenetically resistant animals. Good nutrition is animportant tool for limiting the impact of a number ofdisease agents, such as internal parasites. Good man-agement/husbandry also can play a major role in pre-venting infections or limiting their spread. Where in-fection does occur, animal health research hasdeveloped a range of tools, two particularly importantones being antibiotics and anthelminthics, to elimi-nate or reduce morbidity and mortality from disease.
East Coast fever (ECF) is a disease that illustratesthe interaction of genetics and disease incidence aswell as the range of animal health technologies re-quired to control a disease. This usually fatal diseaseof cattle and the African buffalo is caused by Theile-ria parva, a protozoan parasite transmitted by the tickRhipicephalus appendiculatus. Mortality resultingfrom infection with this organism can run as high as90% when susceptible cattle are infected with carrierticks. Estimates of mortality suggest that 1.1 millioncattle die each year from this disease (Mukhebi et al.,1992). Thus, when animals with superior geneticmakeup for productivity are imported to ECF-endem-ic areas, they often fall victim to the disease (Nyangi-to et al., 1995). This is in contrast to animals of localbreeds born in endemic areas that, although ofteninfected by the age of 6 months, have a mortality ofonly about 5%. It has been estimated that annual di-rect ECF losses to African farmers are about $170million (Consultative Group on International Agricul-
tural Research, 1997a; Mukhebi et al., 1992). Whenthe additional losses due to a reduction of geneticimprovement are included, the estimated loss is muchhigher.
Among the methods being used to control ECF arevector or tick control, chemotherapy of infected ani-mals, and vaccination. Using pesticides to control ticksis difficult, expensive, and adversely affects the envi-ronment (Nyangito et al., 1994). Although treatmentwith various chemotherapeutic agents has been suc-cessful, these agents are expensive and their use oc-curs in most cases only after the animals are infectedand some loss of productivity already has occurred.The older method of vaccination involved direct infec-tion of the animal while simultaneously treating withan antibiotic (infection-and-treatment immunization)(Mukhebi et al., 1990). This procedure can result in alimited immunity, risks the introduction of extrane-ous pathogens to the area and herd, infers a strain-specific immunity, and is costly to the farmer (Mukhe-bi et al., 1995). However, estimates of the benefit:costratio are in the range of 9 to 17:1 (Mukhebi et al.,1992). One solution would be development of a newvaccine that is efficacious, cost effective, and nonpol-luting. Such a vaccine has been advanced throughdevelopment of recombinant antigens to Theileriaparva (Consultative Group on International Agricul-tural Research, 1997). A long-term solution would beto improve the productivity of resistant breedsthrough genetic selection. Even a 50% reduction inannual mortality from this disease by one or a combi-nation of approaches would mean over 500,000 addi-tional animals available for production of meat andmilk for human use or, alternatively, fewer breedinganimals to produce the same number of offspring an-nually, reducing pressure on the land while maintain-ing food production.
Improved vaccine production can save money andincrease productivity. For example, it is estimatedthat brucellosis in U.S. cattle herds costs producersabout $30 million a year. The new, genetically modi-fied vaccines for brucellosis provide excellent protec-tion without the complication of the old vaccines,where difficulty in distinguishing between vaccinat-ed and naturally infected reactors have frustratedcontrol of this disease. Pseudorabies is a disease thatkills young pigs and causes reproductive failure inpregnant sows. The disease, prevalent in some areasof the country, costs pork producers about $60 millioneach year. The development of a genetically engi-neered vaccine is expected to eliminate the problem(U.S. Department of Agriculture, 1995).
Figure 5.18. The Jamunapari breed of milk goats of India hascontributed to the development of breeds, such asthe Etawah of Indones ia and Anglo-Nubian, popu-lar in many countries. Photograph courtesy of EricBradford, University of California, Davis.

Animal Agriculture and Global Food Supply 71
Animal Nutrition and Feed UtilizationThere is no doubt that science has the tools to in-
crease production to meet the projected increase indemand for livestock products. However, not all ofthese tools have proved acceptable to either produc-ers and/or consumers. Without such acceptance, theirpotential cannot be realized. In this section, two typesof technologies will be discussed separately; first,those that enable animals to extract more nutrientsfrom feed and, second, those that enable feed to beutilized more efficiently. Predictions of likely respons-es of producers and consumers are a key part of thisdiscussion.
Nutrient Extraction by the AnimalThe primary difference between the digestive tractsof ruminants and nonruminants—namely, the pres-ence of anaerobic microbes in the rumen—is a keyfactor for differentiating between the approachesadopted for these two classes of livestock.
Nonruminants. Digestion in pigs and poultry, themajor species of nonruminant domestic livestock, islargely achieved by enzymes secreted in differentparts of the digestive tract. Adding enzymes to thefeed to aid digestion is already a common practice inmany production systems. New genetic techniquesmean that the cells in the animals’ digestive tractcould be manipulated to enable pigs and poultry todigest safely a wider range of feedstuffs. Introductionof an enzyme to detoxify gossypol in whole cottonseedand cottonseed meal could decrease the degree of com-petition between nonruminants and humans for soy-bean oilmeal or other protein supplements. Howev-er, consumers may not accept the use of animalswhose cells have been manipulated simply to producemore meat.
Ruminants. It is tempting to consider the rumenas a large vat containing many species of microbesthat provides an easy mechanism for using more fi-brous feeds through the introduction of a manipulat-ed microbe that can digest cellulose more efficientlyor even extract nutrients from lignin. There would belittle reason for consumers to object to such a prac-tice. However, after several decades of research bymicrobiologists and molecular biologists, a significantbreakthrough in energetic efficiency or cellulose di-gestion is still elusive (although inoculation with mod-ified microorganisms has proven successful for detox-ification of substances such as mimosine and nitrate).The problem is that survival in the rumen is highlycompetitive for any microbial species and the at-
tributes that scientists are trying to introduce for thebenefit of the animal are not likely to contribute to themicrobe’s competitive abilities. Manipulation of ani-mal cells, as described for nonruminants, thus maybe a more successful route for increasing the abilityof the ruminant to extract fiber from highly fibrousfeeds, which are abundant.
All Species. After digestion, nutrients are ab-sorbed from the digestive tract and then metabolized.Efficient production will result from the absorption ofdifferent classes of nutrients in ratios approximate totheir requirements for production. These ratioschange with stage of growth and milk production, andtheir profile with the age of the animal and potentiallyamong breeds. Using available biochemical- andmathematical-modeling techniques, researchers areachieving a better understanding of these profiles.Closer matching of nutrient absorption to nutrientrequirements should not only improve the productionefficiency of meat, milk, and eggs but also decreasethe environmental costs from excess nitrogen and oth-er nutrients being excreted in the waste from live-stock-production systems.
Feed Modification for Improved UtilizationThe key to successful modification of feeds for im-
proved productivity is a sound understanding of thestarting point, i.e., the nutritional value of the basicfeed. Modern laboratory equipment such as near-in-frared spectroscopy (NIRS) greatly facilitates the rap-id analysis of large numbers of samples, although the
Figure 5.19. Buffalo cow in Egypt. Buffalos are important pro-ducers of milk for human consumption in manytropical and subtropical countries. Photographcourtesy of Eric Bradford, University of California,Davis.

72 Meeting Future Demand for Livestock Producers
system does require calibration against standardchemical analysis for each type of feed. With calibra-tion, there is some evidence that NIRS can predict notonly the content of each nutrient but also its digest-ibility (i.e., the extent to which the animal can utilizethe nutrients). Improving the digestibility of fiber isthe nutritional advance with the greatest potential toincrease livestock productivity, given the worldwideabundance of fibrous feeds with digestibilities of lessthan 50%.
Attempts to increase the digestibility of fibrousfeeds started with the use of chemicals in the 1970s.For example, ammonia treatment of rice straw hasbeen shown to increase its feeding value for ruminantsby 11 to 17% (Cann et al., 1991). However, adoptionof the technology by farmers in developing countries,which are most dependent on fibrous feeds, has beenslow. This constraint to adoption has been variouslyattributed to lack of labor or water, the price of thechemicals, or the lack of incentive to increase livestockproductivity. Thus, the use of the technology has beengreatest in recent years in China, where the demandfor livestock products is fast growing and governmen-tal influence greater. This provides a lesson on howand when to introduce new technologies, i.e., when amarket, including the necessary infrastructure, forthe products exists and national policy facilitates theadoption.
Improving the feeding value of many crop residuesand by-product feeds through development of newtechnologies (physical or chemical treatments) is un-doubtedly possible; however, research funding for thisfield, in the United States or elsewhere, is very limit-ed. Reasons include geographically limited availabil-ity and relatively small contribution of individual by-
products in feeding systems. For example, althoughby-products in total may constitute 30 to 50% of U.S.dairy cattle rations, compared to alfalfa at 50%, nosingle by-product may contribute more than 10%.However, changes such as an increase in the real priceof feed grains could make it worthwhile to increaseresearch in this area. Important research needs in-clude development of economical methods to assessnutritive value of a wide variety of products, and in-vestigations of possible toxins, naturally occurring orfrom the use of agricultural chemicals, including as-sessment of the ability of ruminant animals to detox-ify such substances.
Feed Grains. Modifying the composition of feedgrains to improve their feeding value is a possibility.However, the energy used by a plant to synthesizeprotein and particularly oil is substantially higherthan to synthesize starch (McDermitt and Loomis,1981; Penning de Vries et al., 1974), which explainsin part why soybean yields are much lower thanmaize. Breeding any crop species for higher proteinor oil content will involve yield tradeoffs; thus, thisapproach is unlikely to contribute a net increase toanimal feed supply.
A number of reports have documented differencesin feeding efficiency among crop varieties that wererelated to starch digestibility and nutritive value. Inone study on sorghum, average daily weight gain ofsteers fed equivalent rations containing an inefficientor efficient hybrid differed by 9%, a difference relat-ed to the in vitro measures of starch digestibility rath-er than starch quantity (Wester et al., 1992). Themaximum potential increase in feeding value fromgenetic improvement in starch quality is probably nomore than 10% for maize and 15% for sorghum, how-ever, which is the increase in feeding efficiency thatcan be derived from steam flaking or steam rolling thegrain before feeding (Owens et al., 1997). This processgelatinizes the starch, reduces the particle size, andmakes the starch more digestible. Eliminating theneed for flaking would reduce the input costs from 5to 10%. The above estimates apply to potential im-provements in feeding value for beef cattle; the im-provement may be greater for dairy cattle.
Protein quality also can be modified to increasefeeding efficiency of grain by providing a better bal-ance of required amino acids. Although it is geneti-cally feasible to alter protein quality in grain, e.g.,high-lysine maize varieties, currently, this technolo-gy has not been widely adopted because it has beenmore economical to supplement animal rations withamino acids derived from microbial fermentation pro-
Figure 5.20. Sahelian sheep with owner in livestock market inMali. Photograph courtesy of Eric Bradford, Uni-versity of California, Davis.

Animal Agriculture and Global Food Supply 73
duction systems. Amino acid supplementation is wide-ly used in commercial animal rations, particularly forpoultry and pigs. Use of recombinant DNA technolo-gy has permitted increased supplies of amino acidssuch as lysine and methionine at greatly reduced cost.However, high yielding amino acid-enriched grainscurrently being developed may offer a competitivealternative in the future.
Antinutritional factors also affect digestibility andfeed value. One promising technology is low phyticacid feed grains. About 80% of the phosphorus (P)found in feed maize is contained in phytic acid, a formof P unavailable to nonruminant animals such as poul-try and swine. For example, only 10 to 20% of the P isassimilated by the animal; the rest is excreted. Recentresearch has identified genetic maize mutants with a66% reduction in phytic acid phosphorus content ingrain, although grain total P is unchanged (Raboy andGerbasi, 1996) and seeds remain viable (Ertl et al.,1998). When fed to chicks in moderately phosphorusdeficient diets, feed efficiency increased 11%, com-pared with normal maize. This increase was associ-ated with greater P utilization from the low phyticacid maize and by a 40% reduction in fecal P excre-tion. In fact, the environmental benefits of reducedphosphorus load in swine and poultry manure areperhaps more important than the potential improve-ment in feeding efficiency from low phytic acid maize.Work is underway to identify the genes responsiblefor this trait, so it may soon be possible to producetransgenic maize and other feed grain crops with lowphytic acid content.
Low phytic acid grain is but one example of poten-tial opportunities to modify grain quality using mo-lecular genetic approaches because many qualitytraits are under single-gene control. During the nextdecade, it is likely that a number of genetically engi-neered crop varieties with modified grain quality, e.g.,resistance to aflatoxin and other mycotoxins, will becommercialized and will contribute to increased feed-ing efficiency and decreased environmental impact.
Forages. Forage production can be increased bybreeding for greater forage yield and quality, althoughconsiderably less research has been devoted to thegenetics of pasture and range plants than to cerealcrops (Vogel et al., 1989). In spite of this reduced em-phasis, forage breeders have successfully developedimproved varieties of several species with improveddigestibility, greater yields, and better disease resis-tance (Casler and Vogel, 1999). Many of these im-proved varieties are now in commercial use and pro-duce higher yields with greater feed value than
unimproved genotypes. There remain a large numberof plant traits that influence forage quality that havenot been fully exploited, such as reducing the contentof antinutritional factors and altering cell wall andlignin concentration and composition. Improved hy-brids and hybrid seed production systems hold prom-ise for increasing forage yields of some species. Inaddition to conventional breeding methods, molecu-lar genetics and plant transformation are being usedto facilitate research on forage genetics, which shouldaccelerate forage crop improvement efforts.
Advanced Information SystemsReference was made earlier, during the discussion
of future animal feed supplies, to the potential con-tributions of “precision farming” to increased cropproductivity and, in particular, to more efficient useof production inputs. Likewise, improved informationresources and technology can contribute to higher ef-ficiencies in livestock production. This is made possi-ble by advances in computer hardware, including in-creased internal data storage and portability(CD-ROM), processing capacity, decision support soft-ware, and the World Wide Web with its incrediblecollection of data. On-line sensors will continue to beintegrated with these tools for more automated sys-tems. For example, in the United States, nationaldatabases by livestock species are being developed tosupport decision making by farmers, ranchers, andthose who work with them in an educational, consul-tative, or service capacity. These national databasesare comprehensive electronic collections of peer-re-viewed and expert-selected educational materials,lists, software tools, and other decision aids. Thisbrings useful decision support tools to farms, homes,
Figure 5.21. Javanese Thin-Tail breed ewe with quintuplets inIndonesia. Photograph courtesy of Luis Iniguez,ICARDA, Aleppo, Syria.

74 Meeting Future Demand for Livestock Producers
and offices in the smallest or most remote rural com-munity. These collections are distributed via CD-ROMand the Internet.
The Web will continue to grow, supplying market-ing information and sales opportunities, providingeducation and decision aids, and enabling two-waycommunication with active agents, the equivalent ofconsultants within narrow subject areas. Judging thequality of available information remains a major chal-lenge.
Individual identification of large animals and as-sociated databases will be developed further for im-proved animal selection and herd management. Thisalready is a legal requirement in the EU and is wide-ly used by dairy producers in many countries. Beefindustry associations in the United States have calledfor a voluntary program to enhance food safety andmanagement information feedback to improve prod-uct quality as well as industry profitability. With sucha system, the interdependence of all segments of theindustry is recognized. Hence, throughout the produc-tion system, from providers of animal genetics to sell-ers of consumer-ready products, all can capitalize onthe information provided to help people solve complex,industry-level problems and individual producer- andfirm-level problems associated with the many signif-icant changes occurring in these industries.
In the developing world, change may occur lessrapidly. However, with access to the Web and ad-vanced information resources, there is no basic rea-son why lack of access to information will be the mostlimiting resource for livestock production.
Production Systems
Grazing LandsMeat, milk, and fiber represent only a portion of the
many goods and services provided by the 35% of theworld’s land grazed by livestock. Others include main-tenance of wildlife populations and general biodiver-sity, fresh water, open space, and recreational spacefor a rapidly expanding human population. Walker(1995) predicted that, in the future, livestock on range-lands would be dual purpose: commodity productionand vegetation manipulation. Thus, the definition ofsustainability of grazing lands has shifted from a lev-el of animal off-take that does not decay the land’sability to continue producing forage to a balance be-tween what people collectively want, reflecting socialvalues and economic concerns, and what is ecologicallypossible in the long term (Borman et al., 1994; Vavra,1996).
When discussing impacts of grazing on rangeland
natural resources, it is important to specify the par-ticular ecosystems involved. Much attention has fo-cussed on the more arid lands because of the verylarge areas involved globally and the fact that manyof these areas have been grazed for many centuries.As will be discussed, controversy exists over the im-pacts of grazing on such lands but there is good evi-dence that, with proper management, their use forgrazing can be sustainable and compatible with oth-er purposes.
A more recent development is the clearing of rainforests in the Amazon to permit livestock grazing.From the perspectives of maintaining biodiversity andof global carbon dioxide production, this is an unde-sirable change. The primary driving force is the needfor economic opportunities for a rapidly expandinghuman population; there are presently limited alter-natives available in this region. The situation is a com-plex one (Faminow and Vosti, 1998) and substantialpolicy changes to provide alternative pathways of eco-nomic development will be required to protect theremaining rainforests.
With regard to traditionally grazed lands, grazingis perceived by some as an unsustainable use of theland. For example, in 1994, the Society for Conserva-tion Biology called for drastic reductions in livestockgrazing on public lands. Fleischner’s (1994) reviewidentified several results of livestock grazing: loss ofbiodiversity, lowering of population densities for awide variety of taxa, disruption of ecosystem function,changes in community organization, and changes inthe physical characteristics of terrestrial and aquatichabitats. As a result, it is widely perceived that landsgrazed by livestock are steadily deteriorating in bio-logical productivity. However, long-term monitoringof the infra-red index by National Aeronautics andSpace Administration satellites (Tucker et al., 1991)and evaluation of livestock productivity by de Haanet al. (1997) have shown that the perceived wide scaledegradation of rangeland resources may not be occur-ring. In a seven country region from Senegal to Sudan,there was a 47% increase in meat production per an-imal and a 93% increase in meat production per hect-are over the period 1960–1991. Production did de-crease temporarily during the 1970s drought, but thetrend for the whole period is clearly an increase inboth measures of productivity.
There is a natural expansion and contraction of theSahara, with vegetation and livestock responding tonaturally occurring climate variation. This has led tothe conclusion that these types of ranges are moreresilient than previously assumed. Because abioticfactors such as rainfall are the main determinants of

Animal Agriculture and Global Food Supply 75
A frequent suggestion for increasing animal produc-tion from rangelands, while improving the sustainabil-ity of the range resource, is to reduce stocking rate, i.e.,the number of animals grazing a given area, on rangesperceived to be overgrazed.
The biological principle involved in this recommen-dation is a simple one. If the stocking rate is at or closeto the maximum number of animals that the range canmaintain, (1) all or most of the available forage will beconsumed except during periods of most rapid foragegrowth, and (2) nearly all of the nutrients in the foragewill be used by the animals just to meet their mainte-nance needs, with little left for reproduction, lactation,growth, or fiber production. By reducing the number ofanimals, those remaining will each have more forageand, therefore, more nutrients for productive functionsand there will be less grazing pressure on the range.
This recommendation is based on the assumptionsthat the goal of keeping animals is to maximize off-takerates and that removal of vegetation by livestock is theprimary determinant of the plant biomass and speciesmix present.
The first of these assumptions is generally valid forranching systems in developed countries but often nottrue for pastoral people in arid regions heavily depen-dent on their animals to provide their food and liveli-hoods. In the latter case, having extra animals to slaugh-ter during a drought while still leaving sufficientanimals to repopulate when the drought is over may bean essential risk management strategy, more importantthan maximizing off-take rates in normal years.
The assumption that livestock grazing is a major de-terminant of vegetation status tends to be true for equi-librial systems, i.e., systems with reasonably dependablerainfall from year to year where there is a direct feed-back between animal numbers and vegetation states. In
Stocking Rate
Box 7
such systems, reduction of animal numbers from an over-stocked status can increase reproduction, growth, andsurvival rates of the remaining animals sufficiently toproduce a net increase, in some cases, quite large, in off-take rate. Areas with a high temporal and spatial vari-ability in forage yield and quality resulting from highinterseason and particularly interyear variability inrainfall are described as nonequilibrial. In such systems,livestock herders traditionally pursue opportunisticstrategies, based on mobility, to optimize use of range-land resources (Sandford, 1983). During drought years,losses of forage due to termites, decomposition, andweathering deplete the forage supply, regardless of an-imal numbers. In such situations—and considering thedifferent production objectives of pastoral people com-pared to ranchers—conventional ideas of carrying capac-ity no longer apply. Policies that support traditionalpractices, e.g., that facilitate movement of animals andtheir owners out of drought areas, may be much morebeneficial to both the pastoralists and the environmentthan confining the herds to a specific area at a prede-termined stocking rate (de Haan et al., 1997 [ Box 3];Ellis and Swift, 1988). Movement of animals out ofdrought areas, however, assumes there are accessibleareas with unused forage, which becomes progressivelyless likely as human population increases.
The conclusion is that reducing animal numbers onoverstocked lands in equilibrial systems can both in-crease animal production from the land and reduce thedetrimental effects of overgrazing. In nonequilibrial sys-tems, the picture is much less clear and this interven-tion may have adverse consequences for both the peo-ple and the environment. Thus, it should be considered,if at all, only after a careful assessment of the goals andcharacteristics of the system and the probable social aswell as environmental consequences of such a change.
vegetation, recognition has developed for the need tomanage this type of grazing resource in a manner thatmakes use of the forage when it is available and thenallows grazers the potential to move to different ar-eas (see Box 7). In a very different part of the world,grazing lands in the western United States are judgedto be in the best condition in a century, although muchroom for improvement remains (Box, 1990; Council forAgricultural Science and Technology, 1996a).
The undesirable effects described by Fleischner(1994) do, in fact, occur with improperly managedgrazing, which unfortunately happens with sufficientfrequency that such effects can readily be found. How-ever, properly managed grazing can be neutral or evenbeneficial with regard to biodiversity and other de-sired environmental outcomes. Bryant’s (1982) reviewof 214 papers on livestock influences on wildlife foundmore cases of positive than of negative effects. Sever-

76 Meeting Future Demand for Livestock Producers
son (1990) provides examples of a variety of speciesbenefited by livestock grazing, including sage grouse,sharp-tailed grouse, and waterfowl. Kay and Walker(1997) reported little or no effect of a century of sheepgrazing on willow communities, while elk populationshad nearly eliminated willows on their range in thesame region.
A recent report (Collins et al., 1998) showed thatbison grazing or mowing tall grass prairie significantlyincreased biodiversity, compared to no grazing; whilethis study did not involve a domestic livestock species,it seems highly probable that a similar effect could beachieved with selective management of such animals.Elimination of cattle grazing can have adverse effectson the quality of winter range for a species such asmule deer (Urness, 1990). Schwartz and Ellis (1981)found the dietary overlap between wildlife and live-stock species to be fairly limited throughout most ofthe year. Mwangi and Zulberti (1985) and Westernand Pearl (1989) showed that a combination of live-stock and wildlife management resulted in an equalor better species wealth than when these two activi-ties were practiced individually.
A number of strategies may be used to enhance live-stock production from grazed lands while maintain-ing or enhancing the ability of the land to meet otherpurposes. Multispecies grazing results in less grazingpressure on individual plant species, while maintain-ing or increasing meat or fiber production, comparedto single-species grazing; for a recent review, seeWalker (1994). Changes in stocking rate can be usedto increase productivity but the impact of such chang-es can vary markedly, depending on the ecosystemand production system involved (see Box 7).
Grazing systems are specializations of manage-ment that define recurring periods of grazing anddeferment (non-use) for two or more pastures or man-agement units; Heitschmidt and Taylor (1991) providean excellent discussion of grazing systems.
In the development of grazing systems compatiblewith wildlife, two main objectives usually are consid-ered. The first is simply to develop a system that hasminimal environmental consequences. The other hasspecific plant community manipulations in mind andthe livestock are used to develop that plant commu-nity through the process of grazing.
The development of sustainable grazing systemsusually begins with a change from continuous, sea-son-long use to a system where livestock are movedthrough a given number of pastures, creating recur-ring periods of grazing and deferment. Most systemsare designed to provide rest or deferment through thegrowing season in an effort to sustain plant vigor.
Often, a change from continuous use to a grazing sys-tem will benefit wildlife, if stocking rates are not ex-cessive.
On most rangelands, the landscape is such thatsome areas are preferred by livestock due to topogra-phy, distance to water, shade, and/or palatability ofplant species. Season of use also may influence live-stock distribution. The end result is that rangelandsare seldom grazed to a uniform level of utilization.Areas of heavy, moderate, light, and even non-usecommonly occur within one pasture (Sheehy andVavra, 1995). Gradients of disturbance and conse-quent successional status should then occur across thelandscape, providing an array of habitats. The key tosuccess is a moderate level of stocking so that residu-al plant material remains and not all locations with-in all pastures are heavily grazed. Moderate levels ofstocking also should provide the proper level of gainper animal and per ha, so that livestock productionitself is sustainable.
In specific instances, livestock grazing systems aredesigned to manipulate plant communities to enhancethe habitat for featured species. The development ofthese systems probably had its beginnings in the workof Bell (1971) and others, who observed that grazingby one species of herbivore can modify vegetation sothat individual plant species or communities are im-proved in ways that benefit other species of herbi-vores. In forests of the interior northwestern UnitedStates, elk and mule deer change both feeding habi-tat and species composition of their diets in responseto cattle grazing. On the Isle of Rhum, Scotland, Gor-don (1988) found that red deer production was in-creased on the area of the island where cattle graz-ing was reintroduced. More red deer calves per 100females were produced in the cattle-grazed area.
Severson and Urness (1994) provide an excellentdescription of the specific vegetation manipulationspossible with livestock grazing management. Live-stock of various species may be used to alter the com-position of the vegetation, increase the productivityof selected plant species, increase the nutritive qual-ity of the forage, and increase the diversity of habitatby altering its structure. Likewise, different speciesof livestock can be used to the same effect to improveforage conditions for other species of livestock. Evenwithin-species enhancement is possible.
One specialized grazing system, transhumance,involves the systematic movement of livestock to takeadvantage of seasonal differences in forage growth,e.g., at different elevations. Such systems have beenused in different parts of the world for many centu-ries and can be both productive and sustainable. For

Animal Agriculture and Global Food Supply 77
example, a traditional transhumant system in theSahel was found to be as productive, in terms of ani-mal protein per unit area, as ranching systems in com-parable zones in Australia and the United States (Bre-men and Uithol, 1984). However, transhumantsystems are being seriously constrained by increas-ing human population pressures in developing coun-tries, e.g., in the interior delta of the Niger in WestAfrica, by conversion of former grazing lands to cropproduction, and, in both developing and developedcountries, by construction of highways and other bar-riers to livestock movement.
Technologies exist to substantially improve animalproductivity from grazing lands, e.g., fertilization,fencing to permit more intensive control of grazing,and seeding with improved forage species providedcare is taken to ensure that introduced species do notbecome weeds in the new environment. These prac-tices may be appropriate in some cases but often arenot economically justified because of the inherentlylow productivity potential of the lands involved. Theiruse also may be constrained by other considerations,such as the inhibiting effect of fences on wildlife mi-gration.
An important goal is development of managementpathways for livestock production based on ecologi-cal soundness that provide the essentials of vegeta-tion cover, water-holding capacity, and lack of erosionto the landscape, which also support economic sustain-ability of livestock enterprises. Grazing treatments forspecific habitat considerations can be factored inwhere objectives dictate.
Crop-Livestock SystemsBecause mixed crop-livestock systems produce
more than half the meat and most of the world’s milksupply, improvements in productivity in this sectorare critical to meeting the increased demand for foodsof animal origin.
As discussed earlier, matching genetic potential ofanimals to the available nutrient level and manage-ment conditions, improving animal health, and im-proving yield and nutritional value of forage crops andfeed grains are important means of raising animalproductivity. All are important aspects of mixed crop-livestock systems. Such systems also put a specialpremium on management skills, not only on manage-ment of the animals but also on the integration of cropproduction, utilization of crop residues to meet nutri-tional needs, and management of manures to main-tain soil fertility, into an economically and environ-mentally sustainable production system.
Among animal management decisions, control and
improvement of reproduction is an important area. Inmany developing country (and in some developedcountry) enterprises, breeding males are left with theherd year round. While having offspring born at var-ious seasons or throughout the year may have advan-tages for risk aversion in either subsistence or mar-ket systems, a frequent result is offspring, particularlyof grazing animals, born at times when feed supplyor weather are unfavorable for survival and growthof young. Controlling the breeding season so thatyoung are born at the most-favorable time of year canresult in much greater production per breeding ani-mal, more efficient lactation, etc., although care muststill be taken to minimize risk. Controlling the breed-ing season also permits more efficient use of aids toreproduction, such as estrus synchronization and AI,where these are appropriate. Other advantages in-clude more effective delivery of animal health prac-tices, such as vaccination and internal parasite con-trol agents.
With regard to nutrition, successful strategiesadopted in some areas include the increasing use ofleaves from leguminous trees for livestock feed. Al-though indigenous species have been used for thispurpose since time immemorial in the arid zone, un-til relatively recently, emphasis on pasture improve-ment in the wetter agro-ecological zones had been fo-cused on the introduction of herbaceous legumes.Notable exceptions to this trend were Leucaena leu-cocephala and Gliricidia sepium. Now, a wide rangeof other genera and species are under evaluation (Gut-teridge and Shelton, 1994). The responses to differ-ent combinations of species have received little atten-tion but could have benefits both agronomically andnutritionally.
Industrial SystemsIndustrial livestock production systems readily
adopt and make effective use of technological advanc-es that can reduce production costs. Least-cost rationformulation using computers, feed additives andgrowth promoters, AI (confinement dairies, turkeyproduction), and implementation of product quality-assurance programs are among widely used practic-es, especially in developed countries. These systemsare also in the best position to utilize advanced infor-mation technologies, an area where innovations areoccurring very rapidly.
Stratified SystemsThese systems are combinations of components of
the other systems, for example, transferring animalsproduced on rangelands to industrial feedlots for fin-

78 Meeting Future Demand for Livestock Producers
ishing, thus utilizing technologies appropriate to thedifferent segments at different stages. Significantimprovements in overall efficiency will be facilitatedby effective integration of more complete and readilyaccessible information on prices and markets, suppliesof animals, and feed availability and feeding value.While each segment of the industry seeks to maximizenet returns for that segment, use of such informationby all should increase output per unit of input for thesystem as a whole.
Quantitative estimation of the increase in efficiencyof animal production from adoption of improved tech-nologies is difficult because of the many factors in-volved and interactions among them. Continuation ofthe estimated recent rate of improvement in feed con-version rate of 1% per year should be fairly readilyachievable. With favorable economic and policy envi-ronments, the increases possible, particularly in manydeveloping countries, are believed to be considerablygreater.
Environmental ConsiderationsVarious environmental aspects of animal agricul-
ture have been mentioned in previous sections, par-ticularly the section on grazing lands, where environ-mental and alternative-use considerationsincreasingly determine the management proceduresand technologies that can be implemented for animalproduction. Because it is important to protect environ-mental quality and the resources involved in food pro-duction, an overview of some key environmental is-sues related to other production systems will bepresented here.
Although mixed crop-livestock and industrial sys-tems use less total land than grazing lands, there arevery important environmental considerations relat-ed to each.
Mixed crop-livestock systems have excellent poten-tial for beneficial effects on the environment and onsustainability of food-producing systems but can havenegative impacts as well. Positive contributions in-clude production of organic fertilizer to maintain soilfertility; consumption by animals of crop residues andby-products, providing an alternative to burning, stor-ing in landfills, or releasing into water bodies; provid-ing draught power and sparing fossil fuel; and provid-ing an incentive to grow cultivated forages that reducesoil erosion and improve soil tilth. Potential negativeimpacts include excess nutrients such as phosphorusand nitrogen from manure contributing to soil andwater pollution and overgrazing of grassland areasinterspersed with cropping areas. Obviously, an im-
portant goal is to maximize the beneficial effects andminimize the negative ones.
Efficient use of manures is one important tool forachieving this goal. Manure storage to minimize nu-trient losses and timely application and incorporationof manures into the soil can improve the quality andavailability for uptake by crops. While providing ad-equate plant nutrients is the greater challenge inmuch of the world and one that efficient use of ma-nures can be very helpful in meeting, avoiding excessnutrients can be an issue. In situations where chem-ical fertilizers are inexpensive and readily available,farmers occasionally have provided the recommend-ed amounts of N, P, and K from chemical fertilizers,in addition to the application of manure, using therationale that the amounts of nutrients available toplants from manure are variable and not accuratelyknown. Clearly, this can lead to excess nutrient load-ing, with adverse effects on soil and water quality.Thus, it is important that recommended applicationrates for both chemical fertilizer and manure, basedon best-available information, be followed. More rap-id, accurate, and economical assessment of nutrientcontent of manures and soils would be helpful. Maxi-mum plant uptake of nutrients from applied manuresnot only reduces the chemical fertilizer needed foroptimum crop production but also minimizes poten-tial pollution effects of these nutrients.
Industrial systems are, in general, more problem-atical with regard to the environment because of theconcentration of large amounts of manure and urinein one location. Pollution of surface and ground wa-ter can result from improper handling of these mate-rials; atmospheric pollution, e.g., ammonia, odors, alsocan occur (U.S. General Accounting Office, 1995; Tan-ji, 1994). Nitrate nitrogen, in particular, can infiltrateto ground water, increasing concentrations above lev-els consistent with public health. Phosphorus frommanure and urine can be carried by runoff to streamsand estuaries, where it promotes growth of aquaticplants and subsequent eutrophication.
Systems such as lagoons, manure drying facilities,etc., have been developed to deal effectively withmanure and urine from large confinement facilities,i.e., to prevent pollution and obtain an economic re-turn from these products, (Animal Agriculture Re-search Center/Agricultural Issues Center, 1994). Theconstruction of such systems generally adds to the netcost of the operation and, unless such systems aremandated by enforceable regulations applied to alloperations, they may not be implemented. Such reg-ulations are used in a number of areas, e.g., northernEurope and North America, but are far from univer-

Animal Agriculture and Global Food Supply 79
sally in place or enforced. A problem with lagoons,even when properly constructed and maintained, isthat they may overflow at times of rare weatherevents such as hurricanes or catastrophic floods. Thisis a compelling reason to locate intensive livestockoperations away from areas of high human popula-tion density and where the topography will minimizeimpacts of such overflow. Restrictions on the use oflagoons have been proposed recently based on con-cerns about air quality, e.g., ammonia release as wellas water quality. (Technologies for environmentallysound animal waste management are covered in moredetail in CAST Report 128 [1996b] and in de Haan etal., 1997.) Some examples of voluntarily implement-ed technologies, which prevent pollution and providean economic return from animal manures, are de-scribed in the AARC/AIC publication (1994); oneranch in California obtains a return of $80 per ton ofswine manure by producing electricity from the bio-gas generated. In general, an approach that treatsmanure as a valuable resource rather than as wasteis an important first step to solving the potential pol-lution problems of industrial animal production.
De Haan et al. (1997) present several suggestionsthat would help control pollution levels. These includepolicy initiatives that reduce subsidies on concentratefeeds, development of incentives to improve emissioncontrol technologies, and removal of import restric-tions on materials and equipment that improve feedefficiency. Important technological solutions to reducepollution levels include introduction of multiphasefeeding, which more closely matches the nutritionalneeds of utilization levels by the animals being fed,and improving the accuracy of determining N, P, andsodium (Na) requirements and content in feeds, as amechanism to reduce concentrations of these elementsin animal waste. With regard to the last concept, thesupplementation of swine and poultry rations withsynthetic amino acids, a standard practice in the for-mulation of commercial rations, significantly reduc-es the total N required in the ration and thereforeexcreted by the animals. Feeding low phytic acid foodgrains (see Chapter 5, Feed Grains) substantially re-duces the P content of manures. The potential to re-duce pollution through modifying animal diets is afield in the early stages of development but one thatoffers substantial promise of future environmentalbenefits.
It is important to note that industrial animal pro-duction produces more human food on less land, fromless total feed input, with fewer animals and lessmethane production than other animal-productionsystems. Thus, expansion of this system has poten-tially important environmental benefits, if the concen-
trated “wastes” produced are properly managed. An-other potentially positive aspect of these systems isthat the manure is accumulated in one place, i.e., itis a point source, facilitating its capture, treatment,and disposal.
The use of stratified systems provides the oppor-tunity for flexibility regarding when and how range-lands are used. The use of crop residues or cultivatedpastures during times of the year when rangeland usemight cause ecological degradation or when nutrientcontent of range vegetation is below production lev-els provides improved production and environmentalprotection.
A number of areas in which additional research isneeded are indicated in the following section.Fitzhugh (1998), and other papers in the volume inwhich that paper appears, outline animal science re-search agendas in more detail.
Policy IssuesPolicy decisions, within countries and internation-
ally, can greatly impact food supplies in general andthe contributions of animal agriculture to food sup-ply in particular. Important issues include the follow-ing:
• Availability of banking and credit services to pas-toralists and small-holder livestock farmers in de-veloping countries. Livestock owners who lackaccess to these services tend to keep more animalsthan they may need in the short term or than isdesirable from the perspective of sustainable car-rying capacity, as a hedge against drought or othercontingencies where their livestock may be theironly saleable asset or food reserve. The option ofselling animals when a surplus exists and havingthe funds available for subsequent contingenciesreduce stocking and increase off-take rates.
• Policies related to resource use and environmen-tal quality. The essential difference between nat-ural resource and environmental consequences isthat the former are borne by the animal produc-ers and the latter are borne by others. The distinc-tion is critical for thinking about policies to pro-mote sustainable animal production. Whereanimal producers have clear, enforceable proper-ty rights to the land (and other resources) theyuse, they have strong incentives to avoid losses ofthe land’s productivity or to enhance it where fea-sible, because they pay the costs and reap the ben-efits. They have no comparable incentive to reduceenvironmental costs or increase environmental

80 Meeting Future Demand for Livestock Producers
benefits of their operations, because to do so wouldimpose costs on them with no offsetting benefits,at least in the short term. Two policy issues arisefrom this distinction: (1) how to strengthen prop-erty rights of animal producers to the resourcesthey need for production, so that they will haveincentive to protect the productivity of those re-sources; and (2) how to find policies and institu-tions that induce or require animal producers totake account of the environmental consequencesof their operations. An example of the impact ofgovernment policy on resource use and environ-mental quality is provided by the recent report bySneath (1998).
• Extremely important are policies that provide in-centives to farmers to produce. In many countries,the political influence of urban populations leadsto cheap food policies that do not provide adequateincentives for farmers to produce the food theycould; this seems to be a particular problem inAfrica (Pinstrup-Andersen et al., 1997), althoughit is not restricted to developing countries. Dyson(1996), from a detailed analysis of trends in worldcereal production, suggests that “the explanationfor the recent decline in per capita cereal produc-tion lies in reduced incentives for farmers in theworld’s more developed regions to both plant andgrow cereal crops.”
• Another aspect of the production incentive issueis subsidies in some developed countries that en-courage overproduction and subsequent sale offood to developing countries at prices below costof production. This not only may result in sup-pressing prices and therefore production in thereceiving country but also can lead to excessivelyhigh densities of livestock in the country with thesubsidies, with negative consequences for envi-ronmental quality, as has happened, for example,in some northern European countries. Recenttrends toward reduced subsidies are contributingto alleviation of this problem.
• Policies affecting general economic developmentand employment opportunities. Much of the mi-gration of people to the Amazon basin where theyhave cleared rainforests to produce livestock hasoccurred because of the lack of alternative meansof making a living. Again, policies related to landtenure and to conservation are involved.
• As mentioned earlier, public support, both nation-al and international, for agricultural productionresearch and extension is critical to achievingneeded increases in all components of the foodsupply.
The FutureThis report indicates that it should be possible to
produce an adequate global supply of human food,including desired levels of animal products, on a sus-tainable basis, given appropriate policies and ade-quate investment in research and extension. All pro-jections are based on numerous assumptions;achievement of the projected outcomes depends on thevalidity of those assumptions. Undoubtedly, some willnot hold true until the year 2020. Pinstrup-Andersenet al. (1997) and Waggoner (1998), among others, havespeculated on possible developments that could resultin major departures from current expectations. Theseinclude unforeseen consequences of global warming;scarcity of water for agriculture; major changes inhuman dietary habits; deviations from current popu-lation projections (in either direction); increased lossof soil or its productivity to alternative uses, erosion,and salinization; and technological breakthroughs.Several of these could contribute to less optimisticoutcomes than now projected, although slower humanpopulation growth rates, technological developments,and even climate changes (in some regions) could con-tribute to increased per capita food supply.
As detailed in this report, increases in food supplymust come primarily from increases in yield of cropsand livestock, with cereal yields being a key to sup-ply of foods of both plant and animal origin. Currentproductivity levels of both are greatly below biologi-cal potential, providing much opportunity for increas-ing food supply by raising average global productionlevels towards best-possible levels.
The development and application of new technolo-gies is, of course, an area particularly difficult to pre-dict. Although no new “green revolution” seems on thehorizon (American Association for the Advancementof Science, 1997), the record of achievement of agri-cultural science during the twentieth century givesreason for optimism about the future. As indicated,the contributions of biotechnology are particularlyuncertain, both because it is still a relatively new fieldand because of major uncertainties about public ac-ceptance of the results.
Recognizing that the future for food production, asfor all human activities, is uncertain, a vision of whatwould constitute a good future may be worth stating.
• Human population increasing no more rapidlythan the most recent UN medium-variant projec-tions, and preferably less.
• Appropriate agricultural policies and adequatepublic investment (national and international) in

Animal Agriculture and Global Food Supply 81
agricultural research and extension, to facilitatefarmer adoption of improved technologies thatlead to (1) increases in crop yields matching orexceeding human population growth rates, and (2)increases in productivity of food-producing ani-mals, to meet the projected increased demand formeat, milk, and eggs with minimal increases innumbers of breeding animals.
• Implementation of grazing management and an-
imal-production practices that contribute to main-taining or enhancing agricultural productivityand environmental quality, including protectionof biodiversity.
• National and international policies on income andfood distribution that assure adequate nutritionfor all, including some foods of animal origin forthose who wish them and with special emphasison nutritional adequacy of diets for children.

82
Appendix A: Abbreviations, Acronyms, and Symbols
AI artificial inseminationARC Agricultural Research Council (United Kingdom)ATNESA African Traction Network of Eastern and Southern
AfricaBSE bovine somatotrophic encephalopathyBVD bovine viral diarrheaCAST Council for Agricultural Science and TechnologyCGIAR Coordinating Group on International Agricultural
ResearchCIMMYT Centro Internacional de Mejoramiento de Maiz y Tri-
goCP crude proteind dayEC European CommunityECF East Coast FeverEEC European Economic CommunityFAO Food and Agriculture Organization of the United
NationsFAOSTAT FAO database (http://apps.fao.org)g gramha hectareICAR Indian Council for Agricultural ResearchIFPRI International Food Policy Research Institute
ILRI International Livestock Research InstituteIRRI International Rice Research InstituteK potassiumkg kilogramL literME metabolizable energyMha million hectaresMJ mega joulesMt million metric tonsN nitrogenNa sodiumNCRSP Human Nutrition Collaborative Research Support
ProgramNIRS near-infrared spectroscopyNRC National Research CouncilOECD Organization for Economic Cooperation and Devel-
opmentP phosphorusPCR polymerase chain reactiont metric tonUN United NationsUSDA U.S. Department of Agriculture

83
Appendix B: Glossary
Biological efficiency. Ratio of output to input.Camelids. Camels, llamas, alpacas.Cloning. Making genetically identical copies of an individual.Concentrates. Feed grains, milling by-products.Conversion rate. The amount of meat, milk, or eggs per unit of
input.Crop residues. Straws, stovers.Digestibility. The extent to which an animal can extract nutri-
ents from a feed through its digestive processes.Equilibrial systems. Systems with reasonably dependable rain-
fall from year to year where there is a direct feedback betweenanimal numbers and vegetation states.
Equines. Horses, mules, donkeys.Feed grains. Grains fed to animals, as opposed to grain directly
consumed by humans (food grains).Grazed forages. Rainfed or irrigated pastures.Grazing systems. Specializations of management that define
recurring periods of grazing and deferment (non-use) for twoor more pastures or management units.
Harvest index . Ratio of grain to total plant; proportion of totalplant dry matter in grain.
Harvested forages. Hays, silages.
Industrial livestock systems . Animals typically kept in largenumbers, in barns or outdoor pens, with all feed brought tothem. Feed may be grown on adjacent land or brought froma distance. Operations are usually highly mechanized.
Micronutrients. Vitamins and minerals.Mixed crop-livestock systems . Both crops and livestock pro-
duced on the same farm. Animal feed provided by crops, cropresidues, as well as grazing, and animal manures returnedto the cropland. Animals are often used for traction and trans-port on the farm.
Nonruminants. Poultry, pigs.Off-take . Numbers of animals slaughtered or amounts of prod-
uct produced per year per census animal.Ruminants. Includes cattle, sheep, goats, buffalo, and many non-
domesticated species such as deer and antelope. Presence ofanaerobic microbes in the rumen.
Stocking rate. Number of animals grazing a given area.Stratified animal production system. A combination of two or
three of the following: grazing, mixed crop-livestock, indus-trial systems.
Transhumance. A specialized grazing system involving the sys-tematic, seasonal movement of animals to take advantage ofseasonal differences in forage growth (e.g., at different ele-vations).

84 Literature Cited
84
Literature Cited
American Association for the Advancement of Science. 1997. Re-seeding the Green Revolution. Special Report: World Food Pros-pects. Science 277:1038–1043.
Animal Agriculture Research Center and Agricultural Issues Cen-ter. 1994. In R. Coppock and S. Weber (Eds.). Animal Agricul-ture Impacts on Water Quality in California. Proceedings of aconference cosponsored by the Animal Agriculture ResearchCenter and Agricultural Issues Center, University of Califor-nia, Davis.
Avery, D. T. 1996. The Environmental Necessity for Higher YieldAgriculture. American Association for the Advancement of Sci-ence Panel on Environment and Sustainability: Limits to Ag-ricultural Productivity. Baltimore, Maryland, February 10,1996.
Beaton, G. H., D. H. Calloway, and S. P. Murphy. 1992. Estimat-ed protein intakes of toddlers: Predicted prevalence of inade-quate intakes in village populations in Egypt, Kenya, and Mex-ico. Am J Clin Nutrit 55:902–911.
Beckett, J. L. and J. W. Oltjen. 1993. Estimation of the water re-quirement for beef production in the United States. J Anim Sci71:818–826.
Bell, R. H. V. 1971. A grazing ecosystem in the Serengeti. Sci Am225:86–93.
Borman, B. T., M. H. Brookes, E. D. Ford, A. R. Kiester, C. D.Oliver, and J. F. Wigand. 1994. A Framework for SustainableEcosystem Management. General Technical Report No. 331.U.S. Department of Agriculture, U.S. Forest Service, Washing-ton, D.C.
Box, T. W. 1990. Rangelands. Pp. 101–120. In R. N. Sampson andD. Hair (Eds.). Natural Resources for the 21st Century. IslandPress, Washington, D.C.
Bradford, G. E. 1998. Animal genetic resources in North Ameri-ca. Proceedings of the Eighth World Conference on Animal Pro-duction, Seoul, Korea, Symposium Series 1:216–228.
Bremen, H. and P. W. J. Uithol (Eds.). 1984. The Primary Produc-tion in the Sahel Project—A Bird’s Eye View. Centre for Agro-biological Research, Wageningen, The Netherlands.
Brown, L. R. 1997. Facing the prospect of food scarcity. Pp. 23–41. In L. R. Brown, C. Flavin, and H. French (Eds.). State ofthe World. W. W. Norton and Company, New York.
Bryant, F. C. 1982. Grazing, grazing systems and wildlife. Proceed-ings of the Great Plains Agricultural Council Annual Meeting.North Platte, Nebraska, June 7–9, 1982. Technical Article T-9-297. College of Agricultural Science, Texas Tech University,Lubbock, Texas.
Bunyavejchewin, P., C. Chantalakhana, and S. Sukharomana.1993. DAP vs. mechanisation in rural development. In DraughtAnimal Power in the Asian-Australasian Region. ACIAR Pro-ceedings No. 46.
Bywater, A. C. and R. L. Baldwin. 1980. Alternative strategies infood animal production. Pp 1–30. In R. L. Baldwin (Ed.). Ani-mals, Feed, Food and People. American Association for the
Advancement of Science Selected Symposium No. 42. WestviewPress, Boulder, Colorado.
Calloway, D. H., S. Murphy, J. Balderston, O. Receveur, D. Lein,and M. Hudes. 1992. Village nutrition in Egypt, Kenya andMexico: Looking across the CRSP projects. Pp. 1–130. In Func-tional Implications of Malnutrition (Final Report). Universityof California, Berkeley, California.
Cann, I. K. O., Y. Kobayashi, M. Wakita, and S. Hoshimo. 1991.Digestion properties of ammoniated rice straw in the rumenand lower tract of sheep. Anim Feed Sci Technol 35:55–68.
Casler, M. D. and K. P. Vogel. 1999. Accomplishments and impactfrom breeding for increased forage nutritional value. Crop Sci(in press).
Cassman, K. G. 1999. Ecological intensification of cereal produc-tion systems: Yield potential, soil quality, and precision agri-culture. Proc Natl Acad Sci (USA) 96:5952–5959.
Cassman, K. G. and R. R. Harwood. 1995. The nature of agricul-tural systems: Food security and environmental balance. FoodPolicy 20:439–454.
Cassman, K. G., R. Steiner, and A. E. Johnson. 1995. Long-termexperiments and productivity indexes to evaluate sustainabil-ity of cropping systems. Pp. 231–244. In V. Barnett, R. Payne,and R. Steiner (Eds.). Agricultural Sustainability in Econom-ic, Environmental, and Statistical Terms. John Wiley & Sons,Ltd., London, U.K.
Cleaver, K. and G. Schneiber. 1994. The Population, Agricultureand Environmental Nexus in Sub-Saharan Africa (revised).Agriculture and Rural Development Series No. 9. TechnicalDepartment, Africa Region, World Bank, Washington, D.C.
Cheeke, P. R. 1995. Impacts of Livestock Production on Society,Diet/Health and the Environment. Interstate Publishers, Dan-ville, Illinois. 241 pp.
Cohen, J. E. 1995. How Many People Can the Earth Support? W.W. Norton and Co., New York.
Coley, D. A., E. Goodlife, and J. Macdiarmid. 1998. The embodiedenergy of food: The role of diet. Energy Policy 26:455–459.
Collins, S. L., A. K. Knapp, J. M. Briggs, J. M. Blair, and E. M.Steinauer. 1998. Modulation of diversity by grazing and mow-ing in native tall grass prairie. Science 280:745–749.
Consultative Group on International Agricultural Research. 1997a.International Livestock Research Institute’s Development of aLive Vaccine Delivery System for East Coast Fever. Nairobi,Kenya.
Consultative Group on International Agricultural Research. 1997b.Twenty-five Years of Improvement, Part IV. Livestock Re-search. Nairobi, Kenya.
Council for Agricultural Science and Technology. 1994. How MuchLand Can Ten Billion People Spare for Nature? Report No. 121.Council for Agricultural Science and Technology, Ames, Iowa.
Council for Agricultural Science and Technology. 1996a. Grazingon Public Lands. Report No. 129. Council for Agricultural Sci-ence and Technology, Ames, Iowa.

Animal Agriculture and Global Food Supply 85
Council for Agricultural Science and Technology. 1996b. Integrat-ed Animal Waste Management. Report No. 128. Council for Ag-ricultural Science and Technology, Ames, Iowa.
Council for Agricultural Science and Technology. 1997a. Contri-bution of Animal Products to Healthful Diets. Report No. 131.Council for Agricultural Science and Technology, Ames, Iowa.
Council for Agricultural Science and Technology. 1997b. The Well-Being of Agricultural Animals. Report No. 130. Council for Ag-ricultural Science and Technology, Ames, Iowa.
Council for Agricultural Science and Technology. 1998. Food Safe-ty, Sufficiency, and Security. Special Publication No. 21. Councilfor Agricultural Science and Technology, Ames, Iowa.
Council for Agricultural Science and Technology. 1999. Benefitsof Biodiversity. Report No. 134. Council for Agricultural Sci-ence and Technology, Ames, Iowa.
Cunningham E. P. and O. Syrstad. 1987. Crossbreeding Bos indi-cus and Bos taurus for Milk Production in the Tropics. AnimalProduction and Health Paper No. 68., Food and AgriculturalOrganization of the United Nations, Rome.
Dawson, J. and I. Barwell. 1993. Roads Are Not Enough: NewPerspectives on Rural Transport Planning in Developing Coun-tries. International Forum for Rural Transport and Develop-ment Occasional Paper IT Transport. Ardington, Oxford, U.K.
de Haan, C., H. Steinfeld, and H. W. Blackburn. 1997. Livestock-Environment Interactions: Finding a Balance. Report of a studycoordinated by the Food and Agriculture Organization of theUnited Nations, the U.S. Agency for International Develop-ment, and the World Bank, Brussels. 115 pp. Available fromFAO, Rome.
de Witt, C. T. 1992. Resource use efficiency in agriculture. AgricSystems 40:125–151.
Delgado, C. L. and McIntire, J. 1982. Constraints on oxen cultiva-tion in the Sahel. Am J Agr Econ 64 (2):188–196.
Delgado, C. L., C. C. B. Courbois, and M. L. Rosegrant. 1998. Glo-bal food demand and the contribution of livestock as we enterthe new millennium. In M. Gill, T. Smith, G. G. Pollott, E.Owen, and T. L. J. Lawrence (Eds.). Food, Lands and Liveli-hoods: Setting Research Agendas for Animal Science. Occasion-al Publication No. 21. British Society of Animal Science, Edin-burgh, Scotland.
Delgado, C., M. Rosegrant, H. Steinfeld, S. Ehui, and C. Courbois.1999. Livestock to 2020: The Next Food Revolution. Food, Ag-riculture and the Environment Discussion Paper No. 28. In-ternational Food Policy Research Institute, Washington, D.C.
Duvick, D. N. 1992. Genetic contributions to advances in yield ofmaize. Maydica 37:69–79.
Duvick, D. N. and K. G. Cassman. 1999. Post-green-revolutiontrends in yield potential of temperate maize in the northcen-tral United States. Crop Sci (in press).
Dyson, T. 1996. Population and Food: Global Trend and FutureProspects. Global Environmental Change Program. Routledge,London, U.K.
Ellis, J. E. and D. M. Swift. 1988. Stability of African pastoral ec-osystems: Alternative paradigms and implications for develop-ment. J Range Manage 41:450–459.
Ertl, D. S., K. A. Young, and V. Raboy. 1998. Plant genetic ap-proaches to phosphorus management in agricultural produc-tion. J Envir Qual 27:299–304.
Evans, L. T. 1993a. Crop Evolution, Adaptation, and Yield. Cam-bridge University Press, Cambridge, U.K.
Evans, L. T. 1993b. Processes, genes, and yield potential. Pp. 687–696. In International Crop Science I. Crop Science Society ofAmerica, Madison, Wisconsin.
Fadel, J. G. 1999. Quantitative analysis of selected by-product feed-stuffs: A global perspective. Anim Feed Sci Technol 79:255–268.
Faminow, M. D. and S. A. Vosti. 1998. Livestock-deforestationlinks: Policy issues in the Western Brazilian Amazon. Pp 88–103. In A. J. Nele (Ed.). Proceedings of the International Con-ference on Livestock and the Environment. Wageningen, TheNetherlands, June 1997.
Fitzhugh, H. A. 1998. Global agenda for livestock research. Pp.11–17. In M. Gill, T. Smith, G. G. Pollott, E. Owen, and T. L. J.Lawrence (Eds.). Food, Lands and Livelihoods: Setting Re-search Agendas for Animal Science. Occasional Publication No.21. British Society of Animal Science, Edinburgh, Scotland.
Fleishchner, T. L. 1994. Ecological costs of livestock grazing inwestern North America. Conserv Biol 8:629–644.
Food and Agriculture Organization of the United Nations. 1997.FAOSTAT database. http://faostat.fao.org/default.htm. Access-ed September and December 1997.
Francis, P. A. 1988. Ox draught power and agricultural formationin Northern Zambia. Ag Systems 27:15–28.
Gatenby, R. M., M. Doloksaribu, G. E. Bradford, E. Romjali, A.Batubara, and I. Mirza. 1997. Comparison of Sumatra sheepand three hair sheep crossbreds. II. Reproductive performanceof F1 ewes. Small Ruminant Res 25:161–167.
Giavedoni, L., L. Jones, C. Mebus, and T. Yilma. 1991. A Vacciniavirus double recombinant expressing the F and H genes ofrinderpest virus protects cattle against rinderpest and causesno pock lesions. Proc Natl Acad Sci USA 88:8011–8015.
Gordon, I. J. 1988. Facilitation of red deer grazing by cattle andits impact on red deer performance. J Appl Ecol 25:1–10.
Grasser, L. A., J. G. Fadel, I. Garnett, and E. J. DePeters. 1995.Quantity and economic importance of nine selected by-productsused in California dairy rations. J Dairy Sci 78:962–971.
Gryseels, G., A. Astatke, F. M. Anderson, and G. Assemenew. 1984.The use of single oxen for crop cultivation in Ethiopia. Inter-national Livestock Center of Africa Bulletin 18:20–25.
Gutteridge, R. C. and H. M. Shelton (Eds.). 1994. Forage Tree Le-gumes in Tropical Agriculture. CAB International, Wallingford,U.K.
Harper, A. E. 1993. Challenge of Dietary Recommendations toCurtail Consumption of Animal Products. Proceedings of theWorld Conference on Animal Production, Vol. 1, Pp. 525–543.Edmonton, Canada.
Havenstein, G.B., P. R. Ferket, S. E. Scheideler, and B. T. Lar-son. 1994a. Growth, livability and feed conversion of 1957 vs.1991 broilers when fed “typical” 1957 and 1991 broiler diets.Poultry Sci 73:1785–1794.
Havenstein, G. B., P. R. Ferket, S. E. Scheideler, and D. V. Rives.1994b. Carcass composition and yield of 1991 vs. 1957 broilerswhen fed “typical” 1957 and 1991 broiler diets. Poultry Sci73:1795–1804.
Heap, R. B. 1998. Animals and the human food chain. Pp 232-245. In J. C. Waterlow, D. G. Armstrong, L. Fowden and R.Riley (Eds.). Feeding a World Population of More than EightBillion People. Oxford University Press, New York and Lon-don.
Heitschmidt, R. K. and C. A. Taylor, Jr. 1991. Livestock produc-tion. In R. K. Heitschmidt and J. W. Stuth (Eds.). GrazingManagement: An Ecological Perspective. Timber Press, Port-land, Oregon.
Hendy, C. R. C., U. Kleih, R. Grashaw, and M. Phillips. 1995. Inter-action Between Livestock Production Systems and the Environ-ment: Concentrate Feed Demand. Food and Agriculture Orga-nization of the United Nations Consultancy Report for

86 Literature Cited
Livestock and the Environment Study. (See de Haan et al.,1997)
Human Nutrition Collaborative Research Support Program. 1992.Functional Implications of Malnutrition. Human NutritionCollaborative Research Support Program (NCRSP), Final Re-port. University of California, Berkeley, California.
Humphreys, L. C. 1994. Tropical Forages. Their Role in Sustain-able Agriculture. The Longman Group, Harlow, U.K.
Ikombo, B. M. 1989. Effects of manure and fertilizers on maize insemi-arid areas of Kenya. E African Agric Forestry J 44:266–274.
Iniguez, L. C. and M. D. Sanchez (Eds.). 1991. Integrated TreeCropping and Small Ruminant Production Systems. Proceed-ings of a Workshop, Medan, Indonesia, September 1990. SmallRuminant Collaborative Research Support Program, Univer-sity of California, Davis, California.
Jordaan, J. P. 1996. Hybrid wheat: Advances and challenges. Pp.66–75. In M. P. Reynolds, S. Rajaram, and A. McNab (Eds.).Increasing Yield Potential in Wheat: Breaking the Barriers.Centro Internacional de Mejoramiento de Maiz y Trigo (CIM-MYT), Mexico City, Mexico.
Kay, C. E. and J. W. Walker. 1997. A comparison of sheep-andwildlife-grazed willow communities in the Greater Yellowstoneecosystem. Sheep Goat Res J 13:6–14.
Khush, G. 1993. Breeding rice for sustainable agricultural systems.Pp. 189–199. In International Crop Science I. Crop ScienceSociety of America, Madison, Wisconsin.
Kropff, M. J., K. G. Cassman, S. Peng, R. B. Matthews, and T. L.Setter. 1994. Quantitative understanding of yield potential. Pp.21–38. In K. G. Cassman (Ed.). Breaking the Yield Barrier:Proceedings of a Workshop on Rice Yield Potential in Favor-able Environments. November 29– December 4, 1994. Interna-tional Rice Research Institute, Los Banos, Philippines.
Kruit, F. 1994. Animal traction technology in Niger and someimplications for Zambia. Pp. 474–480. In P. Starkey, E. Mwen-ya, and J. Stares (Eds.). Improving Animal Traction Technolo-gy. Proceedings of the First Workshop of African Traction Net-work of Eastern and Southern Africa (ATNESA), January18–23, 1992, Lusaka, Zambia, Technical Centre for Agriculturaland Rural Co-operation. Wageningen, The Netherlands.
Lawrence, P. R., Dijkman, J. T., and Jansen, H. G. P. 1997. Theintroduction of animal traction into inland valley regions. Man-ual labour and animal traction in the cultivation of rice andmaize: a comparison. J Agric Sci (Cambridge) 129:65–70.
Loomis, R. L. and D. J. Connor. 1996. Crop Ecology. CambridgeUniversity Press, Cambridge, U.K.
Loomis, R. L. and J. Wallinga. 1991. Alfalfa: Efficient or Ineffi-cient User of Water? Proceedings of the Twenty-first Califor-nia Alfalfa Symposium, Sacramento, California, December 9–10, 1991.
Malthus, T. R. 1798. An essay on the principle of population. Pp.4–6. In G. Hardin (Ed.). Population, Evolution and Birth Con-trol—A Collage of Controversial Ideas. 2nd ed. 1969. W. H.Freeman and Company, San Francisco, California.
McDermitt, D. K. and R. S. Loomis. 1981. Elemental compositionof biomass and its relation to energy content, growth efficien-cy, and growth yield. Ann Bot 48:275–290.
McDowell, R. E. 1994. Improvement of Livestock Production inWarm Climates. W. H. Freeman and Company, San Francisco,California.
McIntire, J., Bourzat, D., and Pingali, P. 1992. Crop-LivestockInteractions in Sub-Saharan Africa. World Bank Washington,D.C.
Mitchell, D. O. and M. D. Ingco. 1993. World Food Outlook. Inter-national Economics Department, World Bank, Washington,D.C.
Mukhebi, A. W., B. D. Perry, and R. Kruska. 1992. Estimated eco-nomics of theileriosis control in Africa. Prevent Vet Med 12:73–85.
Mukhebi, A. W., D. P. Kariuki, E. Mussukuya, G. Mullins, P. N.Ngumi, W. Thorpe, and B. D. Perry. 1995. Assessing the eco-nomic impact of immunization against East Coast fever: A casestudy in Coast Province, Kenya. The Veterinary Record 137:17–22.
Mukhebi, A. W., S. P. Morzaria, B. D. Perry, T. T. Dolan, and R.A. I. Norval. 1990. Cost analysis of immunization for East Coastfever by the infection and treatment method. Prevent Vet Med9:207–219.
Mullinax, D., D. Meyer, and I. Garnett. 1998. The Economic Val-ue of Animal Manure as a Source of Plant Nutrients and Ener-gy Generation. University of California Agricultural IssuesCenter Publication, Davis. 42 pp.
Murphy, S. P., D. H. Calloway, and G. H. Beaton. 1995. Schoolchildren have similar predicted prevalences of inadequate in-takes as toddlers in village populations in Egypt, Kenya, andMexico. Eur J Clin Nutrit 49:647–657.
Mwangi, Z. J. and C. A. Zulberti. 1985. Optimization of Wildlifeand Livestock Production. Wildlife/Livestock Interfaces onRangelands. Inter-African Bureau of Animal Resources, Nairo-bi, Kenya.
National Research Council. 1980. Toward Healthful Diets. Foodand Nutrition Board Division of Biological Sciences Assemblyof Life Sciences. National Academy Press, Washington, D.C.
National Research Council. 1984. Nutrient Requirements of BeefCattle. 6th ed. National Academy Press, Washington, D.C.
National Research Council. 1989. Nutrient Requirements of DairyCattle. 6th ed. National Academy Press, Washington, D.C.
National Research Council. 1992. Grasslands and Grassland Sci-ences in Northern China. A Report of the Committee on Schol-arly Communication with the People’s Republic of China. Of-fice of International Affairs, National Research Council.National Academy Press, Washington, D.C.
New, M. B. 1997. Aquaculture and the capture fisheries. WorldAquaculture (June):11–30.
Nyangito, H. O., J. W. Richardson, A. W. Mukhebi, P. Zimmel, J.Namken, and B. P. Perry. 1995. Whole farming simulationanalysis of economic impacts of East Coast fever immunizationstrategies on mixed crop-livestock farms in Kenya. Agric Syst51:1–27.
Nyangito, H. O., J. W. Richardson, A. W. Mukhebi, D. S. Mundy,P. Zimmel, J. Namken, and B. D. Perry. 1994. Whole farm eco-nomic analysis of East Coast fever immunization strategies inKilifi District, Kenya. Preventative Vet Med 21:215–235.
Oltjen, J. W., M. R. George, and D. J. Drake. 1992. Dynamic allo-cation of multiple forage sources for beef cattle herds. Pp. 58–63. In D. G. Watson, F. S. Zazuelta, and A. B. Bottcher (Eds.).Computers in Agricultural Extension Programs. American So-ciety of Agricultural Engineers, St. Joseph, Michigan.
Owens, F. N., D. S. Secrist, W. J. Hill, and D. R. Gill. 1997. Theeffect of grain source and grain processing on performance offeedlot cattle. A review. J Anim Sci 75:868–879.
Panin, A. 1987. The use of bullock traction for crop cultivation inNorthern Ghana. An empirical economic analysis. ILCA Bul-letin 29:2–8.
Parker, A. G. H. and A. L. Rae. 1982. Underlying principles of co-operative group breeding schemes. Pp. 95–101. In R. A. Bar-

Animal Agriculture and Global Food Supply 87
ton and W. C. Smith (Eds.). Proceedings of the World Congresson Sheep and Beef Cattle Breeding, Vol. II. Dunmore Press,Palmerston North, New Zealand.
Penning de Vries, F. W. T., A. H. M. Brunsting, and H. H. van Laar.1974. Products, requirements and efficiency of biosynthesis: Aquantitative approach. J Theoret Biol 43:339–377.
Pimentel, D. 1997. Livestock production: Energy inputs and theenvironment. Pp. 16–26. Proceedings of the 47th Annual Meet-ing, Canadian Society of Animal Production Montreal, Quebec.July 1997.
Pimentel, D., J. Houser, E. Priess, O. White, H. Frang, L. Mesnick,T. Barsky, S. Tariche, J. Schreck, and S. Alpert. 1997. Waterresources: Agriculture, the environment and society. Bioscience47:97–106.
Pinstrup-Andersen, P., R. Pandya-Lorch, and M. W. Rosegrant.1997. The World Food Situation: Recent Developments, Emerg-ing Issues and Long-term Prospects. Food Policy Report, In-ternational Food Policy Research Institute, Washington, D.C.
Powell, J. M. 1986. Manure for cropping: A case study from Cen-tral Nigeria. Exper Agric 22(1):15–24.
Powell, J. M., R. A. Pearson, and J. C. Hopkins. 1998. Impacts ofLivestock on Crop Production. In M. Gill, T. Smith, G. G. Pol-lott, E. Owen, and T. L. J. Lawrence (Eds.). Food, Lands andLivelihoods: Setting Research Agendas for Animal Science. Oc-casional Publication No. 21. British Society of Animal Science,Edinburgh, Scotland.
Powell, J. M., S. Fernandez-Rivera, T. O. Williams, and C. Renard(Eds.). 1995. Livestock and Sustainable Nutrient Cycling inMixed Farming Systems of Sub-Saharan Africa. Vol. II. Tech-nical Papers. Proceedings of the International Conference,Addis-Ababa, Ethiopia, November, 1993.
Preston, T. R. 1998. Animal production and use of natural resourc-es. Pp. 450–460. In Proceedings of the 8th World Conference onAnimal Production, Seoul, Korea, June 28–July 4, 1998.
Raboy, V. and P. Gerbasi. 1996. Genetics of myo-inositol phosphatesynthesis and accumulation. Pp. 257–285. In B. B. Biswas andS. Biswas (Eds.). Subcellular Biochemistry. Vol. 26. Myo-inos-itol Phosphates, Phosphoinositides, and Signal Transduction.Plenum Press, New York, New York.
Ramaswamy, N. S. 1985. Draught animal power—socio-economicfactors. In J. W. Copland (Ed.). Draught Animal Power for Pro-duction. ACIAR Proceedings No. 10.
Rege, J. E. O. 1998. Utilization of exotic germ plasm for milk pro-duction in the tropics. Proceedings of the Sixth World Congresson Genetics Applied to Livestock Production. Vol. 25:193–200.Armidale, NSW, Australia, January 1998.
Resource Inventory and Management, Ltd. 1992. Nigerian Live-stock Resources. [Four-volume report to the Federal Govern-ment of Nigeria by Resource Inventory and Management Ltd.;Vol. I. Executive Summary and Atlas; Vol. II. National Syn-thesis; Vol. III. State Reports; Vol. IV. Urban Reports and Com-mercially Managed Livestock Survey Report.]
Romans, J. R., W. J. Castello, C. W. Carlson, M. L. Greasen, andK. W. Jones. 1994. The Meat We Eat. Interstate Publishers,Danville, Illinois.
Romney, D. L., P. J. Thorne, and D. Thomas. 1994. Some animal-related factors influencing the cycling of nitrogen in mixedfarming systems in sub-Saharan Africa agriculture. EcosystemsEnviron 49:163–172.
Rosegrant, M. W. and C. Ringler. 1997. World food markets in the21st century: Environmental and resource constraints and pol-icies. Austral J Agric Res Econ 41:401–428.
Rosegrant, M. W. and C. Ringler. 1998. Asian economic crisis and
the long-term global food situation. Paper presented at theInternational Agricultural Trade Consortium Symposium onPolicy Reform, Market Stability and Food Security, Alexandria,Virginia, June 26–27, 1998
Rosegrant, M. W., M. Agcaoili-Sombilla, and N. D. Perez. 1995.Global Food Projections to 2020: Implications for Investment.Food, Agriculture, and the Environment Discussion Paper No.5. International Food Policy Research Institute, Washington,D.C.
Rosegrant, M. W., A. Sombilla, R. V. Gerpacio, and C. Ringler.1997. Global Food Markets and U.S. Exports in the Twenty-first Century. Paper presented at the Illinois World Food Sus-tainable Agriculture Program Conference, Meeting the Demandfor Food in the 21st Century: Challenges and Opportunities forIllinois Agriculture, May 28, Urbana-Champaign, Illinois.
Rutledge, J. J. 1997. Cattle breeding systems enabled by in-vitroembryo production. Embryo Transfer Newsletter 15:14–18.
Sandford, S. 1983. Management of Pastoral Development in theThird World. John Wiley and Sons, New York.
Sayre, K. D., S. Rajaram, and R. A. Fischer. 1997. Yield potentialprogress in short bread wheats in northwest Mexico. Crop Sci37:36–42.
Schwabe, C. W. 1984. Veterinary Medicine and Human Health. 3rded. Williams and Wilkins, Baltimore, Maryland.
Schwartz, C. C. and J. E. Ellis. 1981. Feeding ecology and nicheseparation in some native and domestic ungulates in shortgrass prairie. J Appl Ecol 18:343–353.
Science. 1998. Agricultural biotech faces backlash in Europe. Sci-ence 281:768–771.
Seré, C. and H. Steinfeld. 1996. World Livestock Production Sys-tems. Animal Production and Health Paper 127. Food and Ag-riculture Organization of the United Nations, Rome.
Severson, K. E. 1990. Can Livestock Be Used as a Tool to EnhanceWildlife Habitat? U.S. Forest Service Rocky Mountain Forestand Range Experiment Station General Technical Report RM-194.
Severson, K. and P. J. Urness. 1994. Livestock grazing: A tool toimprove wildlife habitat. Pp. 232–249. In M. Vavra, W. A. Lay-cock, and R. Pieper (Eds.). Ecological Implications of LivestockHerbivory in the West. Society for Range Management, Den-ver, Colorado.
Sheehy, D. P. and M. Vavra. 1995. Ungulate foraging areas onseasonal rangeland in northeastern Oregon. J Range Manage19:16–23.
Sigma, M., C. Neumann, A. A. Jansen, and N. Bwibo. 1989. Cog-nitive abilities of Kenyan children in relation to nutrition, fam-ily characteristics, and education. Child Devel 60:1463–1474.
Smaling, E. M. A., S. M. Nandwa, H. Prestele, R. Roetter, and F.N. Muchena. 1992. Yield response of maize to fertilizers andmanure under various agro-ecological conditions in Kenya.Agric Ecosystems Envir 41:241–252.
Sneath, D. 1998. State policy and pasture degradation in innerAsia. Science 281:1147–1148.
Steinfeld, H., C. de Haan, and H. Blackburn. 1997. Livestock-En-vironment Interactions: Issues and Options. Report of a Studycoordinated by the Food and Agriculture Organization of theUnited Nations, the U.S. Agency for International Develop-ment, and the World Bank, Brussels. 115 pp. Available fromFAO, Rome.
Sumberg, J. and Gilbert, E. 1992. Agricultural mechanization inthe Gambia: Drought, donkeys and minimum tillage. AfricanLivestock Res 1:1–10.
Tanji, K. K. 1994. Impacts on human health and agricultural and

88 Literature Cited
natural systems. Pp 23–27. In R. Coppock and S. Weber (Eds.).Animal Agriculture Impacts on Water Quality in California.Proceedings of a conference cosponsored by the Animal Agri-culture Research Center and Agricultural Issues Center, Uni-versity of California, Davis.
Thorne, P. J. and M. Herrero. 1998. The role of livestock in natu-ral resources management. In M. Gill, T. Smith, G. E. Pollott,E. Owen, and T. L. J. Lawrence (Eds.). Food, Lands and Live-lihoods: Setting Agendas for Animal Science. Occasional Pub-lication No. 21. British Society of Animal Science, Edinburgh,Scotland
Tollenaar, M., D. E. McCullough, and L. M. Dwyer. 1994. Physio-logical basis of the genetic improvement of corn. Pp. 183–235.In G. A. Slafer (Ed.). Genetic Improvement of Field Crops. Mar-cel Dekker, Inc., New York.
Tucker, C. J., H. E. Dregne, and W. W. Newcomb. 1991. Expan-sion and contraction of the Sahara desert from 1980–1990.Science 253–299.
Tweeten, L. 1999. Status of the world: Global change in income,food and demand for animal products. Paper presented at FAIR2002 Symposium, Federation of American Societies of FoodAnimal Science, Baltimore, Maryland. April 1999. 16 pp.
United Nations. 1996. World Population Prospects: The 1996 Re-vision. Population Division, Department for Economic and So-cial Information and Policy Analysis, United Nations, NewYork.
Urness, P. J. 1990. Livestock as manipulators of mule deer win-ter habitats in northern Utah. Pp. 25–40. In K. E. Severson(Ed.). Can Livestock Be Used as a Tool to Enhance WildlifeHabitat? Rocky Mountain Forest and Range Experiment Sta-tion General Technical Report RM-194.
U.S. Department of Agriculture. 1975, 1979, 1990, 1992. Agricul-ture Handbook 8: Composition of Foods—Raw, Processed, Pre-pared. Washington, D.C.
U.S. Department of Agriculture. 1995. Animal Health. Accomplish-ments Report. Joint Council on Food and Agricultural Scienc-es, Animal Health and Wealth. Washington, D.C.
U.S. Department of Agriculture, Economic Research Service. 1996.Long-term Projections for International Agriculture to 2005.ERS Staff Paper No. 9612, August. Washington, D.C.
U.S. General Accounting Office. 1995. Animal Agriculture: Infor-mation on Waste Management and Water Quality Issues. GAO/RCED-95-200 BR. Washington, D.C.
Vavra, M. 1996. Sustainability of animal production systems: Anecological perspective. J Anim Sci 74: 1418–1423.
Virmani, S. S. J. B. Young, H. P. Moon, I. Kumar, and J. C. Flinn.1991. Increasing Rice Yield Through Exploitation of Heterosis.International Rice Research Institute, Los Banos, Philippines.
Vogel, K. P. and K. J. Moore. 1991. Native North American grass-es. Pp. 284–293. In J. Janick and J. E. Simon (Eds.). New Crops.John Wiley and Sons, Inc., New York.
Vogel, K. P., H. J. Gorz, and F. A. Haskins. 1989. Breeding grass-es for the future. Pp. 105–122. In Contributions from BreedingForage and Turf Grasses. Crop Science Society of America Spe-cial Publication No. 15. Madison, Wisconsin.
Waddington, S. R., J. K. Ransom, M. Osmanzai, and D. A. Saun-ders. 1986. Improvement in the yield potential of bread wheatadapted to northwest Mexico. Crop Sci 26:698–703.
Waggoner, P. E. 1998. Food, feed and land. Pp. 69–94. In D. A.Crocker and T. Linden (Eds.). Food, Feed and Land: The GoodLife, Justice and Global Stewardship. Rowman and LittlefieldPublishers, Lanham, Maryland.
Waggoner, P. E., J. E. Ausubel, and I. K. Wernick. 1996. Lighten-ing the tread of population on the land. Populat Devel Rev22:531–545.
Walker, J. W. 1994. Multispecies grazing: The ecological advan-tage. Sheep Res J (special issue) 52–64.
Walker, J. W. 1995. Viewpoint: Grazing management and researchnow and in the next millenium. J Range Manage 48:350–357.
Wester, T. J., S. M. Gramlich, R. A. Britton, and R. A. Stock. 1992.Effect of grain sorghum hybrid on in vitro rate of starch disap-pearance and finishing performance of ruminants. J Anim Sci70:2866–2876.
Western, D. and M. C. Pearl. 1989. Conservation for the Twenty-first Century. Oxford University Press, New York.
Westlund, L. 1995. Apparent Historical Consumption and FutureDemand for Fish and Fishery Products—Exploratory Calcula-tions. Paper presented at the International Conference on Sus-tainable Contribution of Fisheries to Food Security, Kyoto, Ja-pan, December 4–9.
Wheeler, R. D., G. L. Kramer, K. B. Young, and E. Ospina. 1981.The World Livestock Product, Feedstuff and Food Grain Sys-tem. Winrock International Institute for Agricultural Develop-ment, Morrilton, Arkansas.
Wilmut, I., A. E. Schnieke, J. McWhir, A. J. Kind, and K. H. S.Campbell. 1997. Viable offspring from fetal and adult mamma-lian cells. Nature 385:810–813.
Winrock International Institute for Agricultural Development.1992. Assessment of Animal Agriculture in Sub-Saharan Afri-ca. Winrock International, Morrilton, Arkansas.
Yilma, T. 1994. Genetically engineered vaccines for animal viraldisease. J Am Vet Med Assoc 204:1606–1615.
Zenebe, S. and Fekade, T. 1997. The role of pack donkeys in themajor grain market (Yehil Bernada) of Addis Abada, Ethiopia.In Improving Donkey Utilization and Management. Proceed-ings of an African Traction Network of Eastern and SouthernAfrica (ATNESA) Workshop, Debre Zeit, Ethiopia, 5–7 May1997 (in press).
Zerbini, E., B. Shapiro, C. E. S. Larsen, and A. G, Wold. 1996.Dairy-draught cows performance and implications for adoption.In Conference Handbook and Abstracts. All-Africa Conferenceon Animal Agriculture, 1–4 April 1996. South African Societyof Animal Science, Pretoria, South Africa.

Animal Agriculture and Global Food Supply 89
89
Index
A
Advanced information systems, 73–74Agriculture production, public support for, 80Alfalfa, 43Amazon, clearing of rain forests in, 74Animal agriculture, 4
and the environment, 78–79future for, 6–7, 80–81as integral part of food-producing systems, 1–2, 8–9, 10–18policies on, 6, 79–80
Animal by-products, recycle of, through animals, 38Animal feeds, use of human-edible materials as, 38–41, 43Animal genetics, 65–69Animal health, 69–70Animal nutrition, and feed utilization, 71–73Animal production
classification of, 25–31increases in, in Asia, 65indirect contributions of, to food supply, 15–18potential future increases from improved technologies, 65–69resources involved in, 31–43technologies to improve efficiency in, 64–78use of water in, 43
Animal productivity, biotechnology in, 69Animal products
consumption ofin developed countries, 11in developing countries, 10–12and per capita income, 12
current consumption and projected demand for, 10–15global demand for, 8nutritional value of, 8–9, 12opportunities to increase production of, 6per-capita demand for, 8projected consumption to 2020, 11–15proportion of human dietary calories and protein from, 10role of, in human nutrition and health, 19–24
Animal proteinsamino acid composition of, 19biological value of, 42digestibility of, 19
Animals, nutrient extraction by, 71Antinutritional factors, 73Aquaculture products, demand for, 2Argentina, per capita of major food groups in, 20, 23Artificial insemination, 67, 77
B
Bakery waste as source of high-energy feed, 37Beef
consumption, 13–14
industrial production of, 30–31Beef cows, breeding of, 67Biogass production, 5Biological efficiency, 83Biological sciences, advances in, 6Biotechnology, 69
contributions of, 80Breed resources, use of, to improve productivity, 66Breed transfer, results of, 66Breed variation, and genetic potential, 65–66Butter, per capita consumption of, 23
C
Calcium, bioavailability of, 19Camelids, 83Case studies, 3, 44–54Cash source
livestock as, 17nonfood livestock products as, 18
Cereal grains, projected shortage of, 8Cholesterol, role of foods of animal origin in, 19–20Cloning, 69, 83Concentrates, 83Conversion rate, 83Cooperative breeding schemes, 68Cost reduction, and development of stratified systems, 31Crop-livestock systems, 77Crop production
indirect contributions of animals to, 15–17livestock as a balance for, 17–18
Crop residues, 34, 36, 83and by-products, 56–57
Crop response to manure, 17Cultivated forages, 32, 34, 56
and soil erosion, 34
D
Dairy cowsbreeding of, 67diets of, 53milk yields of, 53–54
Developed countriesmeat and fish consumption in, 10meat consumption in, 1poultry consumption in, 13–14
Developing countriesconsumption of animal products in, 10–11draught power in, 15–17, 29meat and fish consumption in, 10meat consumption in, 1

90 Index
mixed farming systems in, 29poultry consumption in, 13–14
Digestibility, 73, 83Domestic animals, evolution of, 25Draught power, 15–17, 29
E
Earth, carrying capacity of, 8East Coast fever, efforts to control, 70Egg production systems, 53Eggs, per capita consumption of, 1, 23, 25Egypt, per capita of major food groups in, 20, 22, 23Embryo transfer, 67Energy
conversion rates of, in animal feeds, 1as requirement for production of animal and plant foods, 43
Environmentand animal agriculture, 78–79as concern, in industrial systems, 31and livestock, 5–6mixed systems in challenging stability of, 30
Equilibrial systems, 83Equines, 83Erosion, soil, 34
F
Fats and oils, per capita consumption of, 23–24Feed, human food from, 35Feed conversion
in broiler chickens, 64global change in rates of, 64–65
Feed grains, 72–73, 83as buffer against temporary food grain shortages, 8projected demand for, 58–61projected supplies of, 61–64
Feed modification for improved utilization, 71–73Feed supplies, 55–64Feed utilization, and animal nutrition, 71–73Fish consumption, projected, 11Food accessibility, contributions of livestock to, 17–18Food and fiber processing by-products, 36–38Food crops, human food from, 35Food-pricing policies, 6Food production
animal agriculture as integral part of, 1–2, 8–9, 10–18water as limited factor in, 43
Foodsinequitable distribution of, 1supply and demand of, 3
Food supplyimpact of policy decisions on, 79–80indirect contributions of animals to, 15–18
Forage, 45, 73cultivated, 32, 34, 56grazed, 32harvested, 32range, 55–56from rangelands, 32
utilization ofgrowing under estate tree crops for livestock production, 57
for livestock production, 57
Forage genetics, 73Forage legumes, 32Fuel, manure as, 18
G
Genetic potential, 65and breed variation, 65–66
Global food supply, sufficiency of, 1, 8Grain:product ratios, 42Grains
animal consumption of, 1diversion from animal production to human consumption, 1
Grazed forages, 32, 83Grazing systems, 25–27, 74–78, 83Green revolution, 80Group breeding schemes, 68
H
Harvested forages, 32, 83Harvest index, 83Health
link between livestock products and, 3–4role of animal products in, 19–24
Human-edible materials, use of, an animal feeds, 31–32, 38–41,43
Human food from feed and food crops, 35Human-inedible materials, 32, 34Human Nutrition Collaborative Research Support Program (NCR-
SP), 20–24
I–K
India, preference for vegetarian diets in, 13Industrial livestock systems, 5, 30–31, 66, 77, 78, 83International Food Policy Research Institute’s (IFPRI) IMPACT
model, 3, 11–15, 58, 59, 60–61Iron, bioavailability of, 19Irrigation, and use of mechanization, 16Kenya, per capita of major food groups in, 21, 22, 23
L
Lagoons, 5Lamb, industrial production of, 30–31Land-reform policies, 6Latin America, per capita consumption in, 12Legumes, forage, 32Livestock
as a balance for crop production, 17–18as a cash source, 17contributions of, to food accessibility, 17–18and the environment, 5–6environmental effects of, 2role of, in human food supply, 10utilization of forage for production of, 57utilization of forage growing under estate tree crops for pro-
duction of, 57Livestock products
link between human nutrition and health and, 3–4meeting future demand for, 55–81
Low phytic acid feed grains

Animal Agriculture and Global Food Supply 91
M
Magnesium, bioavailability of, 19Maize
effects of manure on, 17yield from, 1, 35, 41
Manganese, bioavailability of, 19Manure
crop response to, 17draught animals in production of, 17efficient use of, 78as fuel, 18
Manure drying, 5Meat, consumption of, 1Mechanization, viability of, in developing countries, 16–17Mexico, per capita of major food groups in, 21, 22, 23Micronutrients, 83Milk
biotechnology in improving production of, 69consumption of, 1, 11genetic potential for yield of, 66–67production of, 64
Minerals, bioavailabilities of important, 19Mixed crop-livestock systems, 27–30, 66, 78, 83Molecular genetics, 73Monoclonal antibody techniques, in disease diagnosis, 69
N–O
Near-infrared spectroscopy (NIRS), 71–72Niacin, bioavailability of, 19Nonfood livestock products, as cash source, 18Nonruminants, 83
nutrient extraction by, 71Nucleus programs, 68Nutrient extraction by the animal, 71Nutrient recycling, 17Nutrition
link between livestock products and, 3–4role of animal products in, 19–24
Nutritional value of animal products, 8–9, 12Off-take, 83
P
Pasture, conversion of rainforest to, 5Per capita income, 12–13
and consumption of animal products, 12Phosphorus, bioavailability of, 19Pigs, breeding of, 68Plant transformation, 73Policy decisions, impact of, on food supplies, 79–80Pollution control, 79Polymerace chain reaction (PCR) methods, in disease diagnosis,
69Population, forecasted growth of, 3, 8Pork
demand for, 2industrial production of, 30–31per capita consumption of, 13–14, 23, 25production of, 1
Poultrybreeding of, 67–68
demand for, 2growth and feed conversion in broiler chicken, 64growth in consumption of, 13–14industrial production of, 30–31production of, 1
Poultry production systems, 53Production systems
crop-livestock systems, 77grazing lands, 74–78impact of, on amount/type of feed required, 33industrial systems, 77stratified systems, 77–78
Proteinbiological value of, 1conversion rates of, in animal feeds, 1modification of quality of, 72–73
Pyridoxine (B6), bioavailability of, 19
R
Rain forestsclearing of, in Amazon, 74
Rainforestsconversion of, to pasture, 5
Rangelands, forage from, 32, 55–56Recombinant bovine somatotropin (rBST), in increasing milk pro-
duction, 69Resource use, efficiency of, 4–5Riboflavin (B2), bioavailability of, 19Ruminants, 83
digestion of high-fiber feeds by, 40nutrient extraction by, 71per capita consumption of, 23
S
Soil biodiversity, incorporation of livestock into farming systemin maintaining, 29–30
Soil erosion, and cultivated forages, 34Soil fertility, and mixed farming systems, 29Solids separation, 5South Korea, per capita of major food groups in, 21, 23Soybean meal, 37Stocking rate, 75, 83Stratified systems, 31, 32, 77–78, 79, 83Subsidies, 80Swine-production systems, 52–53
T–U
Thiamin (B1), bioavailability of, 19Transhumance, 76–77, 83United States, per capita of major food groups in, 21, 22, 23
V
Vaccine production, improved, 70Vegetarian diets, preference for, in India, 13Vitamin B12, bioavailability of, 19

92 Index
W–Z
Waterenvironmental importance of, 5–6as limiting factor in food production, 43
Zinc, bioavailability of, 19