anhang 3: project design document (pdd) - klima.kvvm.huklima.kvvm.hu/documents/18/pdd_040712.pdf ·...
TRANSCRIPT

Austrian Federal Ministry of Agriculture, Forestry, Environment and Water Management
A guide to carrying out
Joint Implementation and Clean Development Mechanism Projects
within the framework of the Austrian JI/CDM Programme
Part 3: Preparation of the Project Design Document (PDD) (Proposal: Appendix 6)
(Version 1.3)
Vienna, December 2003

Editorial
Publisher
Austrian Federal Ministry of Agriculture, Forestry, Environment and Water Management Stubenbastei 5, A-1011 Vienna, Austria Tel: ++43 1 515 22-0 Internet: http://www.lebensministerium.at
Guide preparation
Mag. Dr. Gertraud Wollansky (project management) Mag. Angela Friedrich (contributor)
Austrian Federal Ministry of Agriculture, Forestry, Environment and Water Management
Austrian Federal Ministry of Agriculture, Forestry, Environment and Water Management
Stubenbastei 5, A-1011 Vienna, Austria Stubenbastei 5, A-1011 Vienna, Austria
Tel: ++43 1 515 22-1751 Tel: ++43 1 515 22-1735
E-mail: [email protected] E-mail: [email protected]

Introduction Preparation of the Project Design Document 3 / 111
Table of Contents I. Introduction ............................................................................................................................................. 4
II. Template for the Project Design Document (PDD) ............................................................................... 6
A General Project Description....................................................................................................................... 6
A 1 Project Identification.................................................................................................................................................... 6
A 2 General Information .................................................................................................................................................... 7
A 3 Project Participants (EB PDD A.3.)........................................................................................................................... 13
A 4 Location of the Project Activity................................................................................................................................. 19
A 5 Schedule .................................................................................................................................................................... 21
A 6 Technical Description of the Project ......................................................................................................................... 23
A 7 Project Organisation ................................................................................................................................................. 26
B Ecological, Socio-Economic and Development Aspects ......................................................................... 28
B 1 Ecological Effects of the Project during Construction ............................................................................................... 29
B 2 Ecological Effects during the Project Lifetime............................................................................................................ 30
B 3 Socio-Economic and Development Aspects ............................................................................................................. 38
B 4 Additionality and Sustainability ................................................................................................................................. 41
C Stakeholder Comments........................................................................................................................... 44
D Baseline................................................................................................................................................... 48
D 1 Baseline Development .............................................................................................................................................. 49
D 2 Project Scenario........................................................................................................................................................ 54
D 3 Baseline Scenario ...................................................................................................................................................... 57
D 4 Emission Reductions ................................................................................................................................................ 76
E Monitoring Methodology and Plan ........................................................................................................... 79
E 1 Development and Methodology ................................................................................................................................ 80
E 2 Calculation of ERUs or CERs ................................................................................................................................... 82
E 3 Ecological, Socio-Economic and Development Effects ........................................................................................... 100
E 4 Process, Quality and Self-Checking ....................................................................................................................... 102
E 5 Responsibilities ...................................................................................................................................................... 103
III. Appendix .............................................................................................................................................. 104
A Monitoring Data Examples regarding Ecological, Socio-Economic and Development Effects .............. 104
B Comparison of the EB PDD (Version 01) and the PDD of the Austrian JI/CDM Programme ................ 109
C Emission Factors................................................................................................................................... 111

Introduction Preparation of the Project Design Document 4 / 111
I. Introduction The PDD serves as the central document within the Joint Implementation (JI) and Clean Development Mechanism (CDM) approval procedure. It should deliver detailed information on the project and serves the Programme Management of the Austrian JI/CDM Programme as the basis for project appraisal and approval.
The PDD must be in English and comprise the following:
♦ project description,
♦ ecological, socio-economic and development effects of the project,
♦ (if available) stakeholder comments,
♦ baseline,
♦ monitoring plan. The PDD has to be submitted to the Programme Management of the Austrian JI/CDM Programme. Programme Management: Kommunalkredit Public Consulting GmbH Türkenstraße 9, A-1092 Vienna, Austria Tel.: ++43 1 316 31–0, Fax: ++43 1 316 31–104 E-mail: [email protected]
Transparency of the PDD
The Marrakesh Accords specify that parts of the PDD must be made publicly available. Therefore, prior to PDD submission the applicant shall clarify which sections of the PDD are deemed as confidential and thus may not be made publicly available.
Comments regarding the PDD may be put forward for both JI and CDM projects for 30 days. These comments must then also be made publicly available.
Support for filling in forms
Differentiation between “Avoidance” and “Reduction”
Two project types can be differentiated:
1) Avoidance: These projects essentially only generate 'relative' emission reductions. This means that Avoidance projects always encompass the construction of a new plant and therefore lead to emissions, simultaneously however prevent other, inefficient projects being realised or staying in operation which would otherwise lead to even higher emissions.
2) Reduction: These projects result in 'absolute' emission reductions in existing enterprises, for example, through efficiency increases or refurbishment measures, e.g. reducing the use of primary fossil fuels.
This differentiation is especially significant regarding environmental and socio-economic project impacts.

Introduction Preparation of the Project Design Document 5 / 111
Relevance
Since not all questions are relevant to all submitted projects, it is sufficient to answer only those questions which are relevant to your project. However, the Management of the Austrian JI/CDM Programme will always carry out a relevance plausibility check and may request relevant details if required.
PDD of the Executive Board
The PDD at hand is partially more comprehensive than the standard PDD of the Executive Board (EB PDD), which additionally has to be filled in in the case of CDM projects. The Austrian PDD includes all details which are queried in the EB PDD (Version 01). In order to facilitate filling in the EB PDD the Austrian PDD comprises cross references to the correspondent articles of the EB PDD (Version 01). Recapitulatory the appendix shows a comparison of the EB PDD (Version 01) and the PDD of the Austrian JI/CDM Programme. The EB PDD template (Version 01) is available at http://cdm.unfccc.int/Reference/Documents.1
1 In the case of CDM projects modifications of the EB PDD shall be accounted for accordingly. Cp. http://cdm.unfccc.int/.

General Project Description Preparation of the Project Design Document 6 / 111
II. Template for the Project Design Document (PDD)
A General Project Description
A 1 PROJECT IDENTIFICATION
Title of the project activity (EB PDD A.1.) Pálhalma Biogas Project Applicant Pálhalmai Agrospeciál Kft
Date of Submission 30th June 2004

General Project Description Preparation of the Project Design Document 7 / 111
A 2 GENERAL INFORMATION
A 2.1 General information
Project name Pálhalma Biogas Project
Project type X Avoidance
⃝ Reduction
Description of the project activity and its purpose
(EB PDD A.2.)
The project activity comprises the installation of a biogas plant at Pálhalmai Agrospecial Kft (PA) in Pálhalma Hungary.
The biogas plant generates electricity and heat from renewable sources. The biogas plant and its storages solve the MM-problems of PA, as the project displaces the old leaking manure management (MM) systems. Electricity is directly fed into the public Hungarian electricity grid. Heat is used as energy source in the nearby laundry. Hot water for washing machines is produced and water for steam production is preheated. Costs for natural gas are saved as natural gas is substituted by biogas heat.
Following feedstocks are fermented in the biogas plant. Pig manure, slaughterhouse wastes and remains from sun flower oil production are delivered from the neighbouring company Adonyhús Kft: Feedstock Pig manure 14.400 t/a Cattle manure 15.000 t/a Kitchen wastes 60 t/a Pig - Slaughterhouse wastes 200 t/a Wastewater from pig husbandries 23.120 t/a Maize silage 12.000 t/a Pig manure (Adonyhús Kft) 25.000 t/a Remains from sun flower oil production ( Héliosz-Coop Kft) 35 t/a Pig - Slaughterhouse wastes (Adonyhús Kft) 440 t/a Total 90,255 t/a
The feedstocks are fermented in a mesophilic (about 38°C) biogas process. Slaughterhouse wastes are sanitized in special facilities before they are fed into the biogas plant. A two-stage fermenting process (primary and secondary digester) provides the full fermentation of the substrate and maximizes the biogas generation. The biogas is combusted in two biogas engines (combined heat and power engines), where electricity and heat is generated (13,376 MWh/a electricity; 14,944 MWh/a heat). The electricity is sold and fed into the public Hungarian electricity grid. Biogas heat is delivered to the laundry, where natural gas is replaced.
The digested substrates are stored in sealed storages that are dimensioned to store liquids for 120 days to comply with legislation.
The liquid effluent of the biogas plant contains nutrients in a high quality state. PA uses the effluent to fertilize its fields and thus PA is able to reduce its chemical fertilizer demand.
For a more detailed technical description please refer to chapter A6.1.

General Project Description Preparation of the Project Design Document 8 / 111
The project improves the agricultural waste management of Pálhalmai Agrospeciál Kft. and to make use of the renewable energy potential of the agricultural wastes. The project should also be used as a demonstration project for innovative actions addressed to agricultural sector in Hungary.
Description of the background to the project
Agriculture
The Hungarian agricultural production has practically developed in accordance with the country’s ecological and economic capabilities until 1990, several branches have reached world standard. After the change of regime in 1990, however, a dramatic fallback occurred. Due to Hungarians EU accession in 2004, the agricultural sector will be faced to modernization and restructuring measures.
Agriculture of PA
Pig husbandries are situated in Ùjgalambos and Bernátkút. In total the stock is 10540 (year: 2003). The majority of the pigs (8038) are kept in Ùjgalambos, where also the pig breeding farms and heated pigsties for shoats are located. In Bernátkút are only pig fattening farms. PA sold the majority of the livestock, only a small amount is slaughtered in the own slaughterhouse.
The pigsties are mucked out daily. The muck is stored for more than 6 month before it is used for fertilizing fields. The storages do not have any leakproof grounds or facilities to protect the environment against infiltration emissions into the ground.
In Hangos and Parrag there are cattle husbandries located. Whereas in Parrag the cattle are fattened, in Hangos diary cattle are kept. The milk production has been increased in the last years to 5000 l per year and became an important factor.
Also the manure systems at Hangos and Parrag will have to be rebuilt due to the environment is insufficiently protected against emissions.
The next table shows the animal stock of PA in 2003.
Type of animal Stock in 2003 Output Ujagalambos Pigs 8038 Livestock Bernátkút Pigs 2502 Livestock Parrag Non diary cattle 690 Livestock Hangos Diary Cattle 709 Milk
It is expected that the number of animals will slightly increase in the next years. PA has enough capacities to have much more animals than today.
Fertilizing
PA needs chemical fertilizer to fertilize its fields. Following products are applied to the fields.
Demand of chemical Fertilizer kg/a Nitrosol 160.000

General Project Description Preparation of the Project Design Document 9 / 111
Karbamid 394.910 Fertisol 62.960 MAS 275.000 MAP 11:52 133.300 K-60 293.110 Total 1.319.280
Adonyhús Kft.
Adonyhús Kft is part of the agricultural cooperative society holding “Adony Március 21.Szövetkezet”. Beneath Adonyhús Kft there are 7 other agricultural and agricultural service companies under this holding like the sunflower - oil production company Héliosz-Coop Kft.
Adonyhús Kft is a pork production company. They have pig husbandries and a slaughterhouse. Their stock is about 7.030 pigs. Adonyhús Kft. has a liquid based MM-system (anaerobic manure ponds). About 25.000 m³ liquid-manure is produced in the husbandries annually.
Adonyhús Kft. slaughters about 10.000 pigs annually, where 300 t slaughterhouse wastes accrue.
The Hungarian Electricity Sector
The reform of the electricity industry commenced in 1994-95, when Act No. XLVIII of 1994 on the Production, Transportation and Supply of Electricity was formulated and came into effect. In 1995, the privatization of the public concerns in the sector began.
Market Structure
Privatization took place in several phases. At present, the majority of power stations and 100% of the electricity suppliers (today called network and service provider companies as a result of privatization) are privately owned. The endeavors of the European Union to establish a uniform internal market have included the liberalization of the energy sector. As a result, Act No. CX of 2001 on Electricity came into effect on 1 January 2003.
As the first step towards the liberalization of the market, the Government decided on a 30-35% authorization level in order to facilitate partial liberalization of the market (that corresponds to the above-mentioned 6.5 GWh/year limit). Thereafter, tracking the liberalization of the market in the EU was the objective. In the meantime, the EU reviewed its Directive 96/92/EC (concerning common rules for the internal market in electricity) and adopted a policy of accelerating the opening of the market. This means that from 2004, all consumers other than household consumers shall be authorized consumers in the member states of the EU, while from 2007, households shall also be authorized, i.e. the market shall be 100% liberalized.
The producers produce the electricity and feed it into the transmission or distribution networks. As regards licensing, the built-in production capacity of the power stations is the decisive factor, power stations with built-in capacity of at least 50 MW require licenses.

General Project Description Preparation of the Project Design Document 10 / 111
The transmission and distribution network license holders are responsible for the "transportation" of electricity, its transmission and distribution from producers to consumers. These market players are obliged to provide free access to the networks without discrimination.
The systems controller plans and controls the operations of the electricity system. It is independent of producers, traders and consumers. Its tasks comprise system level operative control, resource planning, preparation for network operations, the settlement of electricity and the provision of system-level services.
Capacities and Generation
In 2002, the Hungarian electricity supply industry comprised about 8,184 MW (commissioned capacity; C.C.) of public utilities capacity and about 127 MW of industrial autoproduction. The available capacity (A.C.) of the public power plants amounts to 7,850 MW. The following table gives an overview on the generation capacities of the Hungarian public power plants 1990 – 2002.
Generation Capacities of Public Power Plants
Item 1990 2000 2001 2002Increase MW (2002-2001)
C.C. Public Power Plants MW 6,973 8,210 8,265 8,184 -81A.C. Public Power Plants MW 6,868 7,766 7,803 7,850 47Peak Load MW 4,181 5,394 5,761 5,726 -35
The table below shows the plant categories and the corresponding commissioned capacities of the Hungarian public power plants. Commissioned capacities of the thermal power plants amount to 6,270 MW. Therefore the Hungarian generation capacities are dominated by thermal power plants (76.6%) and nuclear power plants (22.8%).
Power Plant Categories 2002
ItemC.C. Public Power
PlantsNumber
Total Comissioned Capacity
Hydro Power Plants < 30 MW 45 48Thermal Power Plants < 20 MW 48 375
20-50 MW 12 32651-100 MW 11 680> 100 MW 29 4,889
Nuclear Power Plants > 200 MW 8 1,866 In 2002, the Hungarian public power plants produced about 35,000 GWh of electrical energy, dominated by nuclear, natural gas, and coal generation. The following table gives an overview on the gross electricity generation in 2002.

General Project Description Preparation of the Project Design Document 11 / 111
Electricity Production by Energy Sources 2002
GWh %
Coal (Lignite) 8,663 24.8%Fuel Oil 2,074 5.9%Natural Gas 10,043 28.8%Hydrocarbons as total 12,117 34.7%Fossil Fuels as total 20,780 59.5%Hydro Power 195 0.6%Nuklear Power 13,953 39.9%
Total 34,928 100.0% In 2002, 40% of the electricity produced in Hungary was generated by nuclear, 28.8% by natural gas, 24.8% by coal and 5.9% by oil. The crucial importance of the Paks nuclear power plant is clearly discernible. Renewables, mainly small run-of-river hydro power stations, amount to less than 1% of power production.
Electricity imports reached 12,605 GWh, while exports from Hungary reached 8,349 GWh, resulting in net imports of 4,256 GWh. The following table shows the electricity actually measured on the border crossing lines, including the transit deliveries. The contractual export-import values differ significantly from the physical values, but the balance is of course the same.
Export - Import 2002
Item Physical deliveries Contractual deliveries
Import GWh 12,606 7,624Export - Import in 2002 GWh 8,349 3,367Balance GWh 4,256 4,256
A 2.2 Category(ies) of project activity
Project category
(EB PDD A.4.2.)
X Construction (retrofitting) of combined heat and power coupling plants
⃝ Energy sources transfer in energy conversion installations and production plants to renewable energy sources or from energy sources with high carbon content to energy sources with lower carbon content, especially in existing district heating systems
X Construction (or retrofitting) of generating plants operated with renewable energy sources (especially wind power stations, biogas or biomass combined heat and power coupling as well as hydroelectric power plants)
⃝ Projects whose purpose is the avoidance or (energy) recovery of landfill gas
⃝ Waste management measures which contribute to avoidance of greenhouse gas emissions especially through energy recovery of waste, if possible under consideration of waste heat utilisation
⃝ Projects serving the reduction of end-user energy consumption in residential accommodation, public and private service office buildings as well as in industrial applications and processes (including waste heat

General Project Description Preparation of the Project Design Document 12 / 111
potentials) (energy efficiency projects)
⃝ Other: ______________________________________________________
A 2.3 Greenhouse gases
Greenhouse gases reduced through the project
X CO2
X CH4
X N2O
⃝ HFCs
⃝ PFCs
⃝ SF6
For small-scale projects simplifications in certain areas are possible (baseline, monitoring plan etc.). Information is available at http://cdm.unfccc.int/.
A 2.4 CDM project category n/a
CDM project category ⃝ Normal project
⃝ Small-scale project
o Renewable energy project activity with a maximum output capacity equivalent of up to 15 megawatts (or an appropriate equivalent)
o Energy efficiency improvement project activity which reduces energy consumption, on the supply and/or demand side, by up to the equivalent of 15 gigawatthours per year
o Other project activity that both reduces anthropogenic emissions by sources and directly emits less than 15 kilotonnes of carbon dioxide equivalent annually

General Project Description Preparation of the Project Design Document 13 / 111
A 3 PROJECT PARTICIPANTS (EB PDD A.3.)
A 3.1 Applicant
Name Pálhalmai Agrospeciál Kft (PA Kft)
Type of organization ⃝ Authorities: _________________________________________________
⃝ Private enterprise
⃝ NGO
X Other: State owned enterprise
Other functions of applicant within the project
X Sponsor
⃝ Intermediary
⃝ Technical consultant
X Other: Operator
Main activities, knowledge and experience
Since the PA Kft. was founded in 1950 by the ministry of justice, the farms employs prisoners from the neighbouring jailhouses. After the collapse of the communism in 1989/1990, the company remain in state-ownership as according to Act No. 1992/LIII 2§ (3) enterprises with functions of public concerns remain state-owned. In 1994 the company was restructured and transformed into the state owned limited liability company Pálhalmai Agrospeciál Ltd. (seed capital € 1,400,000).
Activities and Experiences
The full name of the company is Pálhalmai Agrospeciál Agriculture, Production, Distribution and Service Ltd” The field of activities and experiences are:
Agricultural Production: Pig and cattle feeding is one of the main activities of Pálhalmai Agrospeciál Ltd. Except a small number, the livestock is sold. In addition, milk production became an important factor in the last years, as well as special livestock breeding for milk cows and in cooperation with Hungapig Kft a very successfully pig-breeding.
Crop Production: Currently the produced crops are used by about 30% in the husbandry and about 70% of produced crops are sold (sunflowers and maize) to local partners. (Hungrana Kft and Héliosz Coop Kft)
The forestry is relatively small and do not have importance.
Industrial Services: This sector comprises radiator production, , steel construction and manufacturing, zinc galvanization, as well as laundry and tailoring.
In all sectors the company has to provide employments for prisoners, who get different kinds of training there.
Address 2407 Dunaújváros, Pálhalma, Hungary

General Project Description Preparation of the Project Design Document 14 / 111
URL n.a.
Phone/fax Phone: +3625286514
Fax: +3625285929
E-mail n.a.
Contact person
Name, department, phone, fax, e-mail
Tamás Kovács Managing Director
Phone: +3625286514-114
Fax: +3625285929
Email: [email protected]
Requests in English or German

General Project Description Preparation of the Project Design Document 15 / 111
A 3.2 Project developer See A3.1
Name Pálhalmai Agrospeciál Kft (PA Kft)
Type of organization ⃝ Authorities: _________________________________________________
⃝ Private enterprise
⃝ NGO
⃝ Other: _____________________________________________________
Other functions of project developer within the project
⃝ Sponsor
⃝ Intermediary
⃝ Technical consultant
⃝ Other: _____________________________________________________
Main activities, knowledge and experience
See A3.1
Address See A3.1
URL See A3.1
Phone/fax See A3.1
E-mail See A3.1
Contact person
Name, department, phone, fax, e-mail
See A3.1

General Project Description Preparation of the Project Design Document 16 / 111
A 3.3 Other project participants
Name Csanády & Partners Consulting Ltd (Cs&P)
Type of organization O Governmental body: ________________________
X Private enterprise
O NGO
O Other: ____________________________________
Other functions of project participant within the project
O Sponsor
O Intermediary
O Technical consultant
X Other: Consultants
Main activities, knowledge and experience
Csanády & Partners Consulting Ltd.(Cs&P) is a Hungarian-Austrian JV company, which was founded in 1997 in order to provide regional development advising services to Hungarian and International institutions across a range of areas such as elaboration of Regional & Rural Development Concepts and Programmes, Marketing Research and Management Consulting etc. The firm has been collaborating with several Hungarian and International institutions within the framework of INTERREG II C and now running IIIB CADSES projects, as well as since 2001 elaboration of SAVE, LIFE, FP5 & 6 programme applications.
Cs&P was responsible to create Partnerships, on behalf of Hungarian “County and Sub-Regional Self-Government level regarding 2001 SAVE Application 4.1 and 4.2 - Regional and Local Energy Agency creation - to apply for EU funding. Working proceeding was based on a pre-AGENDA 21 process, which was started early 2000.
On behalf of this running project, during 2003 - Cs&P has elaborated a preliminary study for Hungarian Environmental Ministry KAC – Environmental Fund, according allocation of upcoming EU funding schemas for energy & environment related topics.
Address H-1136 Budapest, Tátra u. 12b.
URL
Phone/fax Phone +36 1 2360737
Fax +36 1 2360738
E-mail [email protected]
Contact person
Name, department, phone, fax, e-mail
Mag. Wolfgang Lehner
Phone +36 1 2360737
Fax +36 1 2360738
Email: [email protected]

General Project Description Preparation of the Project Design Document 17 / 111
A 3.3 Other project participants
Name KWI Management Consultants & Engineers
Type of organization O Governmental body: ________________________
X Private enterprise
O NGO
O Other: ____________________________________
Other functions of project participant within the project
O Sponsor
O Intermediary
X Technical consultant
X Other: JI-Consultants
Main activities, knowledge and experience
KWI Consultants & Engineers is an Austrian group of companies with a broad range of services. These services are concentrated in 4 main areas:
• Architectural and engineering services: engineering work for infrastructure projects
• Software development and consulting: software for legal compliance of companies and institutions
• Project development and management: Development of infrastructure (with a main focus on greenhouse gas mitigation projects) and real estate projects
• Consulting: consulting in the fields of resource efficiency, organisation, management, project development,…
With a background of consulting and engineering in energy and environmental projects, KWI is putting a major focus on the growing carbon market. Supporting industrial companies in developing their strategies to meet the obligations of the coming EU emissions trading scheme as well as developing market opportunities for international investors and project sponsors in JI and CDM projects are a key priority on KWI’s agenda. The list of clients in this field also includes the World Bank, the Prototype Carbon Fund, the European Commission, governments and institutional partners. The European Union and the Central and Eastern European Countries are the main target regions for KWI.
Address Burggasse 116; 1070 Vienna, Austria
URL http://www.kwi.at
Phone/fax Phone +43 1 52520
Fax +43 1 52520 266

General Project Description Preparation of the Project Design Document 18 / 111
E-mail [email protected]
Contact person
Name, department, phone, fax, e-mail
Mag. Manfred Stockmayer
Phone +43 1 52520256

General Project Description Preparation of the Project Design Document 19 / 111
A 4 LOCATION OF THE PROJECT ACTIVITY
A 4.1 Host country
Host Country Party(ies)
(EB PDD A.4.1.1.)
Hungary
Region/State/Province etc.
(EB PDD A.4.1.2.)
Komitat Fejér
City/Town/Community etc.
(EB PDD A.4.1.3.)
Dunaújváros / Pálhalma
A 4.2 Location of the project activity
Detail on physical location, including information allowing the unique identification of this project activity
(EB PDD A.4.1.4.)
Please enclose a map of the project location.
Pálhalmai Agrospecial Ltd. is located in Pálhalma, a settlement of Selfgovernment of the town Dunaújváros (about 70 km from Budapest) in the region - County (Komitat) of Fejér (green coloured).
Location of Pálhalma
Biogas Plant
Budapest
The company farms fields with 4,420 ha in Pálhalma and in the surrounding communities (Adony, Kulcs, Nagyvenyim, Perkáta, Rácalmás).
The next picture shows the land and buildings of PA Kft. Animal husbandries are coloured in orange, the location of the biogas plant is indicated as red point.

General Project Description Preparation of the Project Design Document 20 / 111
Biogas Plant
Pig husbandries are situated in Ùjgalambos and Bernátkút. In total the stock is 10540 (year: 2003). The majority of the pigs (8038) are kept in Ùjgalambos, where also the pig breeding farms and heated pigsties for shoats are located. In Bernátkút are only pig fattening farms. PA sold the majority of the livestock, only a small amount is slaughtered in the own slaughterhouse at Ùjgalambos.
Is the location in a nature reserve?
⃝ Yes
X No
Will the project have effects on residents?
(e.g. noise, smell, other immissions, additional infrastructure, ...)
The biogas plant will not have negative effects on residents. The next residents are more than 2 km away from the biogas plant site.
Burning biogas in a biogas engine is naturally linked with emissions like noise, CO, NOx and NMHC (non methane hydrocarbons). However, these emsissions directly depend on the performance of the engine and peripherical equipment. As it described in Chapter B.2. these emissions will be below national and European limits.
However, compared to the baseline scenario agricultural wastes will be fermented under controlled conditions. Thus, the manure is digested and more or less odourless. Because of the huge amount of manure and the fact that manure is used for fertilizing most of the fields, the odourless manure of the biogas plant will have a significant positive effect on nearby residents.

General Project Description Preparation of the Project Design Document 21 / 111
A 5 SCHEDULE
A 5.1 Schedule
Starting date of the project activity
(e.g. start of construction)
(EB PDD C.1.1.)
The project activities began by the end of 2003 when PA instructs to elaborate a pre-feasibility study.
Construction period Start: Jan. 2005 until Dec. 2005
Measures Duration
Building Construction 20 weeks
Installations 14 weeks
External facilities 2 weeks
Starting Testing 21 weeks
Construction phases
Date of commissioning 15/12/2005
Expected operational lifetime of the project activity
(in years and months, e.g. two years and four months would be shown as: 2y-4m)
(EB PDD C.1.2.)
The operational lifetime of the project activity will be at least 20 years.
A detailed project schedule is to be enclosed.
The crediting period corresponds to the period during which 'creditable' emission reduction certificates can be generated.
JI Projects
The Marrakesh Accords do not specify for how long emission reduction certificates can be generated by a JI project. It can however be assumed that the crediting period will correspond to the first commitment period (2008 - 2012).
CDM Projects
The crediting period of CDM projects is stipulated in the Marrakesh Accords as follows:
• 7 years with two extension options (each with renewed baseline determination), i.e. a maximum total of 21 years,
• once 10 years with no renewal option.

General Project Description Preparation of the Project Design Document 22 / 111
Crediting of the Certified Emission Reductions, CERs, can be performed retroactively from the year 2000. Contractual parties having carried out CDM projects since 2000 must be able to prove the fulfilment of the CDM criteria to be retrospectively credited CERs.
A 5.2 Choice of the crediting period
Starting date of the crediting period (DD/MM/YYYY): 01/01/2008
In addition to credits generated in the first commitment period (2008-2012), the project will reduce CO2 emissions before 2008. It is intended that Assigned Amount Units (AAUs) equivalent to these emission reductions are transferred during the first commitment period.
JI projects
Duration of the crediting period: 2008 - 2012
⃝ Renewable crediting period (at most seven years per period)
⃝ Fixed crediting period (at most ten years)
Starting date of the (first) crediting period (DD/MM/YYYY): ________________
CDM projects
(EB PDD C.2.1., EB PDD C.2.2.)
Length of the (first) crediting period: _________________________________ (in years and months, e.g. two years and four months would be shown as: 2y-4m)

General Project Description Preparation of the Project Design Document 23 / 111
A 6 TECHNICAL DESCRIPTION OF THE PROJECT
A 6.1 Technology to be employed by the project activity
Project technology used and listing of all measures
Please refer to Appendix 2.
(EB PDD A.4.3.)
PA built a biogas plant that is intended to be accomplished by the end of 2005. The biogas plant generates electricity and heat from renewable sources. The biogas plant and its storages solve the MM-problems of PA, as the project displaces the old leaking MM-systems. Electricity is directly fed into the public Hungarian electricity grid. Heat is used as energy source in the nearby laundry. Hot water for washing machines is produced and water for steam production is preheated.
Feedstocks
Following feedstocks are fermented in the biogas plant. Pig manure, slaughterhouse wastes and remains from sun flower oil production are delivered from Adonyhús Kft:
Feedstock Pig manure 14.400 t/a Cattle manure 5.000 t/a Kitchen wastes 60 t/a Pig - Slaughterhouse wastes 200 t/a Wastewater from pig husbandries 23.120 t/a Maize silage 12.000 t/a Pig manure (Adonyhús Kft) 25.000 t/a Remains from sun flower oil production ( Héliosz-Coop Kft) 35 t/a Pig - Slaughterhouse wastes (Adonyhús Kft) 440 t/a Total 90,255 t/a
Before slaughterhouse and kitchen wastes are put into the digesters, the wastes are sterilized in a sterilization facility2.
Feedstocks Input
Solid feedstocks are delivered into the acceptance hall and dumped into two feedstock batchers. Each of these batchers is dimensioned to store feedstock for 2 days. In the batchers the feedstock is cut with a milling machine and fed into the primary digesters via worm type feeders.
Wastewater from the pig husbandries in Ùjgalambos is directly fed in the mixing pit. The other liquid substrates from Adonyhús Kft. are collected in an acceptance pit to ensure accounting of delivery.
Primary Digesters

General Project Description Preparation of the Project Design Document 24 / 111
The primary digesters are designed as complete-mixed digester or as plug-flow digesters3. To ensure a retention time of about 23 days the total volume is 6000 m³ (2 complete-mixed digesters with 3000m³ each) and 3000 m³ (3 plug-flow digesters with 1000³ each) respectively. The digesters are heat insulted to reduce heat demand.
2 paddle agitators in each complete mixed digester and 1 vertical paddle agitator in each plug-flow digester ensure mixing of the substrate. Heat from the biogas CHP is used to heat the digesters. The primary digesters are operated mesophilic at a temperature of about 38°C.
Secondary Digesters
Secondary digesters ensure the full fermentation of the substrate. They are designed like complete-mixed digesters. The retention time there is 30 days that means that they have total volume of 8.500 m³ (2 secondary digesters with 4500 m³ each). The secondary digesters are also operated mesophilic (about 38°C).
Gas Holder
Above each secondary digester there is a gas holder installed. The total volume of the gas holder is 2.640 m³. With this amount of biogas the engines are operating approximately 4 h at full load.
Biogas CHP
In the digesters approximately 6.000.000 m³ biogas per year with about 60% methane is produced during the degradation process by the bacteria. The biogas is combusted in biogas engines (combined heat and power engines), where electricity and heat is generated (13,376 MWh/a electricity; 14,944 MWh/a heat). The biogas engines do have following characteristics:
Efficiency Hours of
Operation Electric Capacity Thermal Capacity
electric thermal h/a kW kW 38% 46% 8,000 2 x 836 2 x 934
Before the biogas is combusted in the biogas engines the gas is dehydrated and desulfurized. In the case of a breakdown of the engines there is an emergency flare installed, that avoids methane emissions if the engines are out of order.
The biogas plant has an own electricity demand of about 6% of total electricity production (803 MWh/a). Therefore the net amount of electricity that is fed into the public Hungarian electricity grid is 13,376 MWh/a.
2 According to EU-regulation 1774/2002/EG slaughterhouse wastes (category 2 and 3) has to be sterilized before fermentation in biogas plants. 3 The final design of the primary digesters is determined after the tender process in cooperation with the plant constructor.

General Project Description Preparation of the Project Design Document 25 / 111
Digested Manure Storage
According to Hungarian regulation liquid manure storages must have a capacity for at least 120 days. Therefore the storages have a capacity of 36.000 m³.
The storages are designed as lagoons. They have a leakage detection system and are covered to avoid nitrogen emissions. The lagoons are surrounded by fences.
Digested Manure Disposal - Fertilizing
The digested manure is distributed to fields by dribble bar distributors. These systems bring the fertilizers directly to the ground and the nutrient losses are reduced to a minimum. Biogas manure is high quality fertilizer, thus chemical fertilizer demand is reduced.
Laundry
Biogas heat is delivered to the laundry. In a heat exchanger the heat is transferred. Out of the exchanger 85°C hot water is piped in two hot water tanks. One stores hot water with 60°C for the standard washing program. The other stores hot water with 85° C for the special washing program. Steam is injected in the washing machines to heat the water from 85°C to the required 90°C.

General Project Description Preparation of the Project Design Document 26 / 111
A 7 PROJECT ORGANISATION
A 7.1 Economic aspects
Public funding of the project activity
Level and source of public funding for the project activity, including an affirmation that such funding does not result in a diversion of official development assistance and is separate from and is not counted towards the financial obligations of the funding Parties
(EB PDD A.4.5.)
Project investment costs1€= 250 HUF
Development costs 145,732,500 HUF 582,930 €Installed costs 1,382,050,576 HUF 5,528,202 €Total project costs 1,527,783,076 HUF 6,111,132 €Opportunity Costs 216,171,636 HUF 864,687 €
Source Name Contribution 1€= 250 HUF %
Equity PA 153,000,000 HUF 612,000 € 10%Local bank loan K&H 852,075,297 HUF 3,408,301 € 56%Grant AVOP 400,000,000 HUF 1,600,000 € 26%JI Advance Payment Austrian JI/CDM Program 122,707,779 HUF 490,831 € 8%
Total Financing 1,527,783,076 HUF 6,111,132 € 100%
Economic viability
A detailed financing plan and an economic viability calculation (for at least 15 years) has to be enclosed. Please refer to Appendix 1.
Please refer to Annex 1 Business Plan
Indicative offer price for ERUs/CERs
Please include an illustration of the price calculation and of the underlying assumptions.
9.5 € / tCO2e
A 7.2 Legal aspects
Status of the official approval process in the host country
As it is mentioned in the Baseline Study, in Hungary there are no existing approval regulations for biogas plants. PA therefore intends to get approvals as follows:
1. Analysing the existing regulations for use of agricultural manure and discussion with responsible public administration officers.
2. Based on these discussion results, elaboration of procedure how to treat other different feedstocks
3. In cooperation with responsible Self-Government Administration, decision about building permission proceedings.
4. If it occurs, that statehouse feedstock’s, kitchen wastes, and remains from sun flower oil production, only could be used under proceeding of special permissions, following process will be aspired:
a) Elaboration of a building permission, focused to usage of agricultural

General Project Description Preparation of the Project Design Document 27 / 111
feedstock, as manure, energy crops, like maize silage, etc.
b) Hand in subsequently, operating permission for other feedstock’s, where conditions of usage, will be defined by a detailed permission proceeding
5. Above procedure will guarantee planned full operation of PA-Biogas plant with January 20064
6. However, if above procedure, following contents of point 4 couldn’t realised and time schedule of building permission will not be followed, unacceptable costs will occur, for the project owner, given by operating losses. By these facts, equal chances of competition within the EU common economic market will be mismatched, based on missing regulations about building permission for a Hungarian project owner. To avoid this really unpleasant situation, project owner together with his experts, in collaboration with permission authorities, and try to define based on consensus proceeding of building permission up to August 2004.
4 Please mention that in other European countries like Austria and Germany the approval process for biogas plants fed with manure and maize silage is a very simple one.

Ecological, Socio-Economic and Development Aspects Preparation of the Project Design Document 28 / 111
B Ecological, Socio-Economic and Development Aspects According to article EB PDD F.1. documentation on the analysis of the environmental impacts, including transboundary impacts, shall be provided. This documentation has to be attached to the CDM EB PDD. If the impacts are considered significant by the project participants or the host Party, according to EB PDD F.2., conclusions and all references to support documentation of an environmental impact assessment that has been undertaken in accordance with the procedures as required by the host Party shall be provided.
The Austrian PDD asks for the following specifications.

Ecological, Socio-Economic and Development Aspects Preparation of the Project Design Document 29 / 111
B 1 ECOLOGICAL EFFECTS OF THE PROJECT DURING CONSTRUCTION The following section deals with the environmental effects of the project activity during the construction phase. Significant effects on the media water and air and with regard to waste and noise shall be described in detail as well as mitigation measures undertaken. Relevant regulation (national laws, directives etc.) has to be complied with. If nonexistent or not applicable the current national technological practice/standards are to be observed. Please also describe in detail if your project activity goes beyond these minimum requirements.
B 1.1 Environmental effects during construction
Environmental effects during construction
Environmental effect: Noise and dust emissions due to construction works at the construction site.
Mitigation measures: if necessary restriction of working hours, watering of open pits in dry and windy seasons to avoid inadmissible fugitive dust emissions
o Compliance with relevant regulations/national technological standards
o Relevant regulation: ___________________________________________________ (Please indicate where and how it is available.)
o National technological practice/standard: ___________________________________________________ (Please state references.)
Does the project go beyond these minimum requirements?
o No
o Yes:
Please extend the table if necessary.

Ecological, Socio-Economic and Development Aspects Preparation of the Project Design Document 30 / 111
B 2 ECOLOGICAL EFFECTS DURING THE PROJECT LIFETIME The following section deals with the environmental effects of the project activity during the project lifetime. Significant effects on the media water and air and with regard to land use, biodiversity and waste shall be described in detail as well as mitigation measures undertaken. Relevant regulation (national laws, directives etc.) has to be complied with. If nonexistent or not applicable the current national technological practice/standards are to be observed. Please also describe in detail if your project activity goes beyond these minimum requirements or displays other positive effects.
Water
B 2.1 Effects on the medium water
X Not present
⃝ Present
Environmental effect: ________________________________________
Mitigation measures: _________________________________________
o Compliance with relevant regulations/national technological standards
o Relevant regulation: _______________________________________________ (Please indicate where and how it is available.)
o National technological practice/standard: _______________________________________________ (Please state references.)
Does the project go beyond these minimum requirements?
o No
o Yes: ____________________________________
Effects on the medium water
(e.g. abstraction of ground or surface water, pollution of surface water, composition of effluents etc.)
X Positive effects: Because of biogas fertilizer, the project allows PA to switch over to bio-agricultural company. Chemical fertilizers, insecticides, etc. will be reduced as a result of the project. Thus, storm and ground water will not be contaminated with chemical substances.
Furthermore nitrogen of the biogas fertilizer are better infiltrated by crops compared to non-digested or chemical fertilizer. Thus, the origin of nitrates is abated. Consequently eutrophication of surface water is avoided.

Ecological, Socio-Economic and Development Aspects Preparation of the Project Design Document 31 / 111
Air
B 2.2 Effects on the medium air
CO
⃝ Not present
X Present
Environmental effect: CO emissions 500 mg/Nm³
Mitigation measures: CO emissions are reduced to local levels by installing a catalyst.
o Compliance with relevant regulations/national technological standards
o Relevant regulation: 14/2001. (V.9.) KöM-EüM-FVM; available at the environmental authority of Fejér. (Please indicate where and how it is available.)
o National technological practice/standard: _______________________________________________ (Please state references.)
Does the project go beyond these minimum requirements?
o No
o Yes: max. 500 mg / Nm³
Effects on the medium air
(e.g. quantity of emissions rejected, composition of emissions, etc.)
X Positive effects: Reduction of local and global air pollutants such as CO2, SO2, CO, NOx, TSP, PM10 from fossil fuelled power plants.
B 2.2 Effects on the medium air
NOx

Ecological, Socio-Economic and Development Aspects Preparation of the Project Design Document 32 / 111
⃝ Not present
X Present
Environmental effect: NOx emissions
Mitigation measures:
o Compliance with relevant regulations/national technological standards
o Relevant regulation: (Please indicate where and how it is available.)
o National technological practice/standard: Relevant for NOx emissions is TA Luft. Limited Value is 500 mg/Nm³ Reference: Biomass district heating project in Szombathely. (Please state references.)
Does the project go beyond these minimum requirements?
o No
o Yes: max. 500 mg / Nm³
Effects on the medium air
(e.g. quantity of emissions rejected, composition of emissions, etc.)
⃝ Positive effects: _____________________________________________
B 2.2 Effects on the medium air
NMHC
⃝ Not present
X Present
Environmental effect: NMHC emissions
Mitigation measures:
o Compliance with relevant regulations/national technological standards
o Relevant regulation: (Please indicate where and how it is available.)
o National technological practice/standard: Relevant for NMHC emissions is TA Luft. Limited Value is 150 mg/Nm³ Reference: Biomass project in Szombathely. (Please state references.)
Does the project go beyond these minimum requirements?
o No
o Yes: max. 150 mg / Nm³
Effects on the medium air
(e.g. quantity of emissions rejected, composition of emissions, etc.)
⃝ Positive effects: _____________________________________________

Ecological, Socio-Economic and Development Aspects Preparation of the Project Design Document 33 / 111
Land
Details on land use are normally only to be stated for Avoidance projects.
B 2.3 Land use
Land use About 35 000 m2

Ecological, Socio-Economic and Development Aspects Preparation of the Project Design Document 34 / 111

Ecological, Socio-Economic and Development Aspects Preparation of the Project Design Document 35 / 111
X Not present (Please refer to Annex 2 for the dimension of the buildings)
⃝ Present
Environmental effect: ________________________________________
Mitigation measures: _________________________________________
o Compliance with relevant regulations/national technological standards
o Relevant regulation: _______________________________________________ (Please indicate where and how it is available.)
o National technological practice/standard: _______________________________________________ (Please state references.)
Does the project go beyond these minimum requirements?
o No
o Yes: ____________________________________
Effects on land use
(e.g. erosion, landslip etc.)
Please provide at least 2-3 different pictures of the planned location of the project under different view angles and show the dimension of the buildings of the project on these pictures.
⃝ Positive effects: _____________________________________________

Ecological, Socio-Economic and Development Aspects Preparation of the Project Design Document 36 / 111
Biodiversity
Details on biodiversity are normally only to be stated for Avoidance projects.
B 2.4 Effects on biodiversity
X Not present
⃝ Present
Environmental effect: ________________________________________
Mitigation measures: _________________________________________
o Compliance with relevant regulations/national technological standards
o Relevant regulation: _______________________________________________ (Please indicate where and how it is available.)
o National technological practice/standard: _______________________________________________ (Please state references.)
Does the project go beyond these minimum requirements?
o No
o Yes: ____________________________________
Effects on biodiversity
(Is the project situated in a protected zone, e.g. listed in a fauna or flora inventory?; Are there any fauna/flora species mentioned on Red Lists present on the area of the project location?5; Are there any endangered or indigenous plants or animals present on the area of the project location?; etc.)
X Positive effects:
The project initiates PAs switch to bio agricultural farming. Thus, PA mitigate insecticides and chemical fertilizer. As it is described in Chapter 2.1 also eutrophication of surface water is avoided. Hence the project has positive effects on the biodiversity in the region as microorganism and small animals (insects, small reptiles, birds,…) are not endagered by chemicals anymore.
5 For information on such species see e.g. IUCN: International Union for the Conservation of Nature (www.iucn.org/themes/ssc/).

Ecological, Socio-Economic and Development Aspects Preparation of the Project Design Document 37 / 111
Waste
B 2.5 Waste
⃝ Not present
X Present
Environmental effect: Used oils from the biogas engines.
Mitigation measures: It is intended that the used oil will be taken over by the service company. If this would not be part of the service contract the oil will be taken over by the Hungarian disposal system. Anyway, the used oil will be disposed according to EU-standards.
o Compliance with relevant regulations/national technological standards
o Relevant regulation: _______________________________________________ (Please indicate where and how it is available.)
o National technological practice/standard: _______________________________________________ (Please state references.)
Does the project go beyond these minimum requirements?
o No
o Yes: ____________________________________
Waste generation, treatment and disposal
(e.g. total amount of waste generated, total amount of hazardous waste generated, composition of waste, treatment of hazardous/non-hazardous waste etc.)
⃝ Positive effects: _____________________________________________
Ecological, Socio-Economic and Development Aspects Preparation of the Project Design Document 38 / 111
B 3 SOCIO-ECONOMIC AND DEVELOPMENT ASPECTS The Austrian JI/CDM Programme touches on developing country interests, therefore the Austrian Development Cooperation Act, BGBl. 2002/49 idgF is also applicable to this Programme. The goals of the Austrian development cooperation policy are: poverty eradication, peace and human security, as well as environmental protection and sustainable use of natural resources. These goals lead to the following questions within the Austrian JI/CDM Programme.
The sections which apply to CDM projects only resp. to JI and CDM projects are marked accordingly.
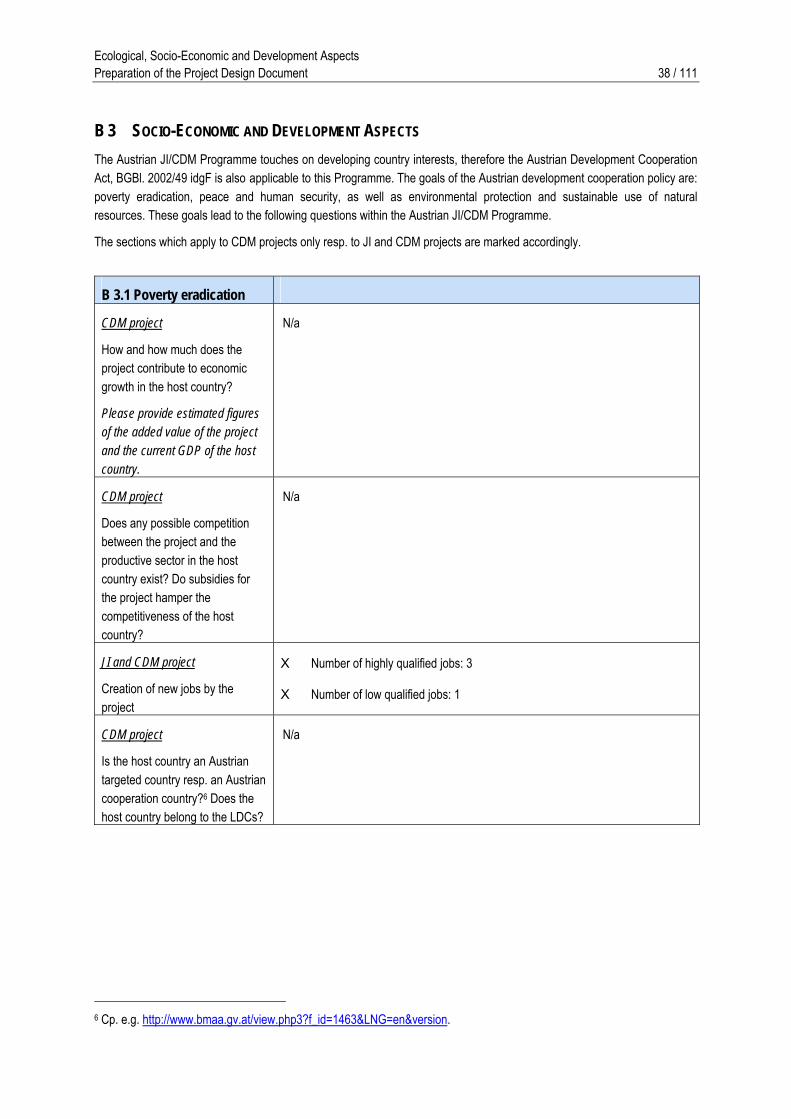
B 3.1 Poverty eradication
CDM project
How and how much does the project contribute to economic growth in the host country?
Please provide estimated figures of the added value of the project and the current GDP of the host country.
N/a
CDM project
Does any possible competition between the project and the productive sector in the host country exist? Do subsidies for the project hamper the competitiveness of the host country?
N/a
JI and CDM project
Creation of new jobs by the project
X Number of highly qualified jobs: 3
X Number of low qualified jobs: 1
CDM project
Is the host country an Austrian targeted country resp. an Austrian cooperation country?6 Does the host country belong to the LDCs?
N/a
6 Cp. e.g. http://www.bmaa.gv.at/view.php3?f_id=1463&LNG=en&version.

Ecological, Socio-Economic and Development Aspects Preparation of the Project Design Document 39 / 111
B 3.2 Peace, security, democracy
CDM project
What is the ranking of the host country in the human rights reports and in international corruption rankings?
Please refer to www.amnesty.org and www.transparency.org.
N/a.
CDM project
Is the host country involved in an internal or cross-border armed conflict?
N/a
B 3.3 Social Situation, Cultural Awareness
CDM project
Does the project limit physical or de facto access by indigenous or local users to natural resources (e.g. water)?
N/a
CDM project
How will possible negative socio-economic or cultural effects (resettlement, access to resources, conflict user-groups etc.) be healed?
N/a
JI and CDM project
Social security of workforce
Description of services in comparison to local standards (health insurance, accident insurance, other social services)
Workforce will have social securities according to Hungarian standards.

Ecological, Socio-Economic and Development Aspects Preparation of the Project Design Document 40 / 111
B 3.4 Gender Equality
JI and CDM project
Equal Opportunities
Are the principles of equal opportunities reflected in the employment structure of middle and upper management?
Middle Management
Number of women: 7
Number of men: 23
Upper Management
Number of women: 1
Number of men: 10

Ecological, Socio-Economic and Development Aspects Preparation of the Project Design Document 41 / 111
B 4 ADDITIONALITY AND SUSTAINABILITY
B 4.1 Additionality
Brief explanation of how the anthropogenic emissions of anthropogenic greenhouse gas (GHGs) by sources are to be reduced by the proposed project activity, including why the emission reductions would not occur in the absence of the proposed project activity, taking into account national and/or sectoral policies and circumstances
In addition please provide the total estimate of anticipated reductions in tonnes of CO2 equivalent.
(EB PDD A.4.4.)
According to the Kyoto Protocol, a JI project should result in a GHG emission reduction that is additional to any that would occur otherwise.
The project results in GHG emission reduction, and thus additional revenues. Considering these revenues in the financial analyses the biogas plant shows economically viable values. Without them PA would not decide to construct the biogas plant.
As it is described in the Baseline Study the proposed project generates 262,000 tCO2e between 2006 and 2012.
AAUs ERUs Year 2006 2007 2008 2009 2010 2011 2012GHG ERs in tCO2e 37,887 37,722 37,561 37,403 37,249 37,142 37,037
Assuming a rather conservative price of 6 €/tCO2e and an advance payment of 30 %, following JI revenues (including costs for validation and verification) would occur:
Total 2005 2006 2007 2008 2009 2010 2011 2012 2013JI Payments 30% Advance Payment € 471,601 JI-Payments 471,601 0 0 0 207,413 224,418 223,494 222,852 222,224JI-Costs € 12,000 12,000 6,000 6,000 6,000 6,000 6,000 6,000
JI-Revenues € 1,512,003 459,601 0 -12,000 -6,000 201,413 218,418 217,494 216,852 216,224
Assumed Price 6 €/ tCO2e
Considering the JI-revenues in the financial analysis of the Baseline Scenario 3 – biogas plant, the Scenario shows economically viable figures7.
Financial Results with JI without JIIRR 9.6% 5.3%NPV 630,732 € -463,691 €
Without JI revenues the project would have an IRR of 5.3% and a NPV of -463,691 € (please refer to chapter 3.3.3 iof the Baseline Study). As it is mentioned before the biogas plant expands PA´s product portfolio, but PA would logically expand its lines of business with businesses that ensure economic viable figures. Furthermore PA would need an investment loan that PA would not get without economic viable figures for the project.
Considering JI revenues the project shows an IRR of 9.6 % and a positive NPV of 630,732€. With economic viable figures PA is able to secure financing the biogas plant by taking out a loan for this investment. Therefore the proposed project is additional.
Furthermore the proposed project is the first biogas project in Hungary that
7 Details of Financial Analysis are shown in Baseline Study, Annex – Baselinescenario´Biogas Plant with JI

Ecological, Socio-Economic and Development Aspects Preparation of the Project Design Document 42 / 111
undergoes an official approval process. Because of the non existing approval process for biogas plants PA´s project is a pioneer project in these issues and has to clear the approval hurdle. The project therefore paves the way for other biogas plants in Hungary. Biogas technology is an important technology for the environmentally sound development of Hungary´s agricultural sector. There is a huge potential for this beneficial technology as there are many large scale agricultural farms. The JI status is very important factor for the awareness of the authorities. Hence the JI project helps to accelerate the approval process and provide important arguments for the project and following biogas projects
Additional JI-revenues have an important effect to the projects financial figures. The revenues lead to economically sound figures that allow financing the project. Considering this and the barrier described above make the project additional in the course of JI.
B 4.2 Sustainability
Description of the project's contribution to the sustainable development of the host country
Please describe the view of the project participants of the contribution of the project activity to sustainable development.
(EB PDD A.2.)
This section should also include a description on how environmentally safe and sound technology and know-how to be used is transferred to the host Party, if any. What kind of project specific training is planned? Which maintenance measures are planned?
(EB PDD A.4.3.)
The project contributes to Hungary´s sustainable development as:
• The project will create new qualified jobs onsite for operation.
• Set up of know how that is planned to distribute in a competence centre and will contribute to a sustainable development of the region.
• The biogas plant improves closing the nutrient loop as nutrients of the organic substrate originated from crops is applied to the fields again without significant losses. Thus the project contributes to an ecologically sound development of PA´s agriculture.
• The project reduces the application of chemical fertilizers. Side effects like eutrophication of surface waters and emissions from its productions (CO2, N2O, CO, NOx) are reduced.
• Several construction works will be made by local construction companies. Thus the project has positive impacts to local employment and economic development.
• Prisoners will be involved to daily works wherever it is possible. The project will so create employments and trainings for prisoners that have important impacts to social life and rehabilitation of the inmates.
• Due to the anaerobic degradation process in the biogas plant the manure that is applied to the fields is nearly odourless. This will massively improve living standard of residents near fertilized fields.
• The project prepares the legal ground for biogas plants in Hungary as it is the first biogas plant that undergoes an official approval process in Hungary.
• State-of-the-art biogas technology is transferred into a region that is dominated by large-scale agricultural companies. It is very likely that other companies get inspired by the project.
• Electricity and heat generated from renewable sources displaces fossil fuels energy. Greenhouse gases, SO2, NOx, CO, dust and other emissions that are related with burning of fossil fuels are reduced.

Ecological, Socio-Economic and Development Aspects Preparation of the Project Design Document 43 / 111
• The project raises people’s awareness on environmental sound agriculture, recycling of materials, renewable energies and importance of the GHG reduction.
• Given by the fact, that manure management will be changed significantly by use of biogas fertilizer, PA/Kft decided to implement based on Austrian “good Agricultural Praxis” contents of COM(2000) 20 final - Indicators for the Integration of Environmental Concerns into the Common Agricultural Policy. So fare supported by definition of “sustainable Agriculture” of COM(2000) 20 final (1.3.1.2.) an “Ecological Balance” within company’s level and on regional level in close cooperation with Self Government of Rácalmás, will be undertaken, parallel to PA biogas plant project implementation.

Stakeholder Comments Preparation of the Project Design Document 44 / 111
C Stakeholder Comments Stakeholders include all Parties or persons affected by the project. If several stakeholder comments are made, the table is to be copied and filled in separately for each stakeholder.
In the case of CDM projects stakeholder involvement is mandatory (also on an international level).
C 1 Identity of stakeholders
Name Schrick Istvan
Type of organization X Authorities: Municipality of Rácalmás
⃝ Private Enterprise
⃝ NGO
⃝ Individual Person
⃝ Other: ____________________________________________________
Description of the effects of the project on the stakeholder
Mr. Schrick is major of the Municipality of Rácalmás. Pálhlma is administrated by this municipality.
Address Rácalmás Nagyközség Önkörmányzata
2459 Rácalmás
Phone/fax Tel.: 25/440-001
Fax: 25/444-958
Contact person Schrick Istvan (Major)
C 1 Identity of stakeholders
Name Maj. Gen. Dr. Istvan Bökönyi
Type of organization X Authorities: State Penal Department
⃝ Private Enterprise
⃝ NGO
⃝ Individual Person
⃝ Other:

Stakeholder Comments Preparation of the Project Design Document 45 / 111
Description of the effects of the project on the stakeholder
PA employs prisoners. The Hungarian prison service is administrated by Hungary´s Penal Department.
Address Steindl I. u. 8
1245 Budapest
Phone/fax 06 1 301 8100 / Fax: 06 1 331 7351
E-mail [email protected]
Contact person Maj. Gen. Dr. Istvan Bökönyi
Stakeholder Comments Preparation of the Project Design Document 46 / 111
C 2 Stakeholder comments
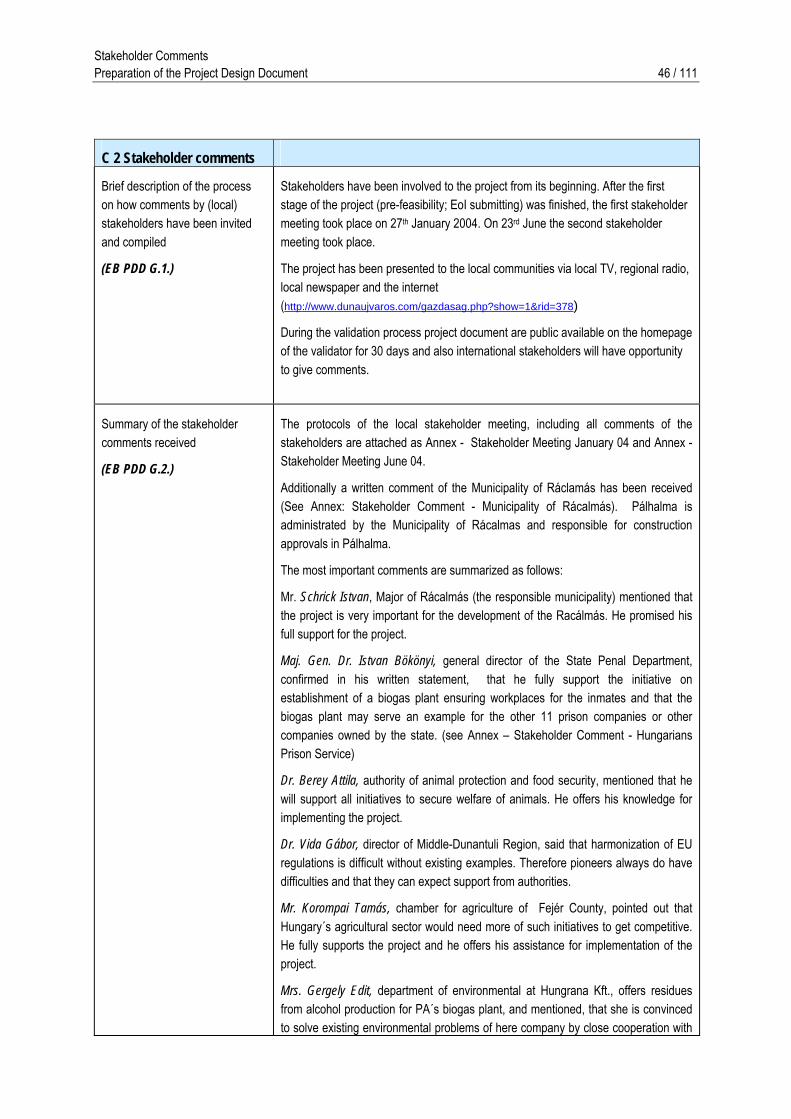
Brief description of the process on how comments by (local) stakeholders have been invited and compiled
(EB PDD G.1.)
Stakeholders have been involved to the project from its beginning. After the first stage of the project (pre-feasibility; EoI submitting) was finished, the first stakeholder meeting took place on 27th January 2004. On 23rd June the second stakeholder meeting took place.
The project has been presented to the local communities via local TV, regional radio, local newspaper and the internet (http://www.dunaujvaros.com/gazdasag.php?show=1&rid=378)
During the validation process project document are public available on the homepage of the validator for 30 days and also international stakeholders will have opportunity to give comments.
Summary of the stakeholder comments received
(EB PDD G.2.)
The protocols of the local stakeholder meeting, including all comments of the stakeholders are attached as Annex - Stakeholder Meeting January 04 and Annex - Stakeholder Meeting June 04.
Additionally a written comment of the Municipality of Ráclamás has been received (See Annex: Stakeholder Comment - Municipality of Rácalmás). Pálhalma is administrated by the Municipality of Rácalmas and responsible for construction approvals in Pálhalma.
The most important comments are summarized as follows:
Mr. Schrick Istvan, Major of Rácalmás (the responsible municipality) mentioned that the project is very important for the development of the Racálmás. He promised his full support for the project.
Maj. Gen. Dr. Istvan Bökönyi, general director of the State Penal Department, confirmed in his written statement, that he fully support the initiative on establishment of a biogas plant ensuring workplaces for the inmates and that the biogas plant may serve an example for the other 11 prison companies or other companies owned by the state. (see Annex – Stakeholder Comment - Hungarians Prison Service)
Dr. Berey Attila, authority of animal protection and food security, mentioned that he will support all initiatives to secure welfare of animals. He offers his knowledge for implementing the project.
Dr. Vida Gábor, director of Middle-Dunantuli Region, said that harmonization of EU regulations is difficult without existing examples. Therefore pioneers always do have difficulties and that they can expect support from authorities.
Mr. Korompai Tamás, chamber for agriculture of Fejér County, pointed out that Hungary´s agricultural sector would need more of such initiatives to get competitive. He fully supports the project and he offers his assistance for implementation of the project.
Mrs. Gergely Edit, department of environmental at Hungrana Kft., offers residues from alcohol production for PA´s biogas plant, and mentioned, that she is convinced to solve existing environmental problems of here company by close cooperation with

Stakeholder Comments Preparation of the Project Design Document 47 / 111
PA biogas initiative.
Report on how due account was taken of any comments received
(EB PDD G.3.)
The project has been presented transparently to the stakeholder. The opinions of the stakeholders are very important for PA´s project. Positive comments encouraged PA to proceed with the project. Negative comments have not been received until now.

Baseline Preparation of the Project Design Document 48 / 111
D Baseline A JI or CDM project should result in additional emission reductions, this means such emission reductions which would have not taken place without these projects. To be able to prove such emission reductions it is essential to calculate the emissions
• in the project scenario and
• in the baseline scenario.
The actually achieved emission reductions result from the difference between the two scenarios.
Emission Reductions = (Baseline Emissions) ─ (Project Emissions)

Baseline Preparation of the Project Design Document 49 / 111
D 1 BASELINE DEVELOPMENT
D 1.1 Details of baseline development
Name and address of person/entity determining the baseline
Please provide contact information and indicate if the person/entity is also a project participant.
(EB PDD B.6.2.)
The Baseline Study for this project has been prepared in a separate document. The following sections summarize the results of this baseline study.
KWI Management, Consultants & Auditors GmbH
Burggasse 116
A-1070 Wien
Contact Persons:
Manfred Stockmayer ([email protected])
Martin Hammer ([email protected])
KWI Management Consultants & Auditors GmbH participate the project as JI consultant.
Date of completing the final draft of this baseline section (DD/MM/YYYY)
(EB PDD B.6.1.)
28/06/2004

Baseline Preparation of the Project Design Document 50 / 111
The project can be split into various project components. This serves the definition of the project boundary and the choice of the baseline methodology. For details see e.g. the baseline study available at http://www.ji-cdm-austria.at or http://www.klimaschutzprojekte.at.
D 1.2 Project components
Project components ⃝ E (0)
X E (+ -)
⃝ H (0)
X H (+ -)
X M (-)
The project boundary defines which emissions in which framework must be considered in the emission calculation. The project boundary must include all significant emissions which are subject to the project operator's direct control and can be allocated to the project. For details see e.g. the baseline study available at http://www.ji-cdm-austria.at or http://www.klimaschutzprojekte.at.
D 1.3 Project boundary
Description of how the definition of the project boundary related to the baseline methodology is applied to the project activity
(EB PDD B.5.)
Please enclose a graphical representation of the project boundary.
In the project boundary all significant anthropogenic GHG sources has been included. Significant GHG sources are:
- the conventional MM-systems at of PA and Adonyhús
- the laundry
- the chemical fertilizer production
- the Hungarian grid power plants
The biogas plant is also inside the project boundary as it affects all these emission sources.
Baseline Preparation of the Project Design Document 51 / 111
PROJECT BOUNDARY
Feedstock Harvesting
Animal Husbandries
Feedstock Transport
Manure Syst. Baseline
Manure Transport
Fields
Fuel Production
Fuel TransportGrid Power
Plants
… Feedstock… Laundry Heat… Electricity… Chemical fertilizer… Crops, fodder… Biogas fertilizer
Laundry
Biogas Plant
Hungarian Eletricity Grid
Fuel Production
Gas Transport
Chemical Fertilizer
Production
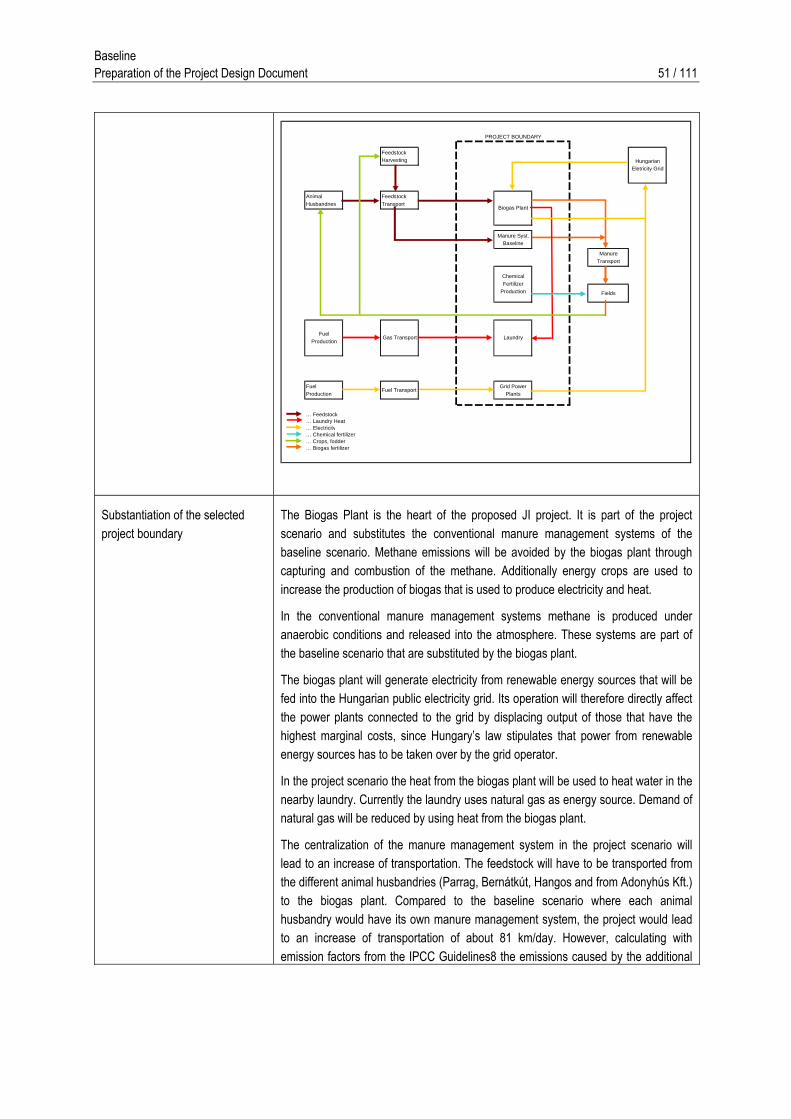
Substantiation of the selected project boundary
The Biogas Plant is the heart of the proposed JI project. It is part of the project scenario and substitutes the conventional manure management systems of the baseline scenario. Methane emissions will be avoided by the biogas plant through capturing and combustion of the methane. Additionally energy crops are used to increase the production of biogas that is used to produce electricity and heat.
In the conventional manure management systems methane is produced under anaerobic conditions and released into the atmosphere. These systems are part of the baseline scenario that are substituted by the biogas plant.
The biogas plant will generate electricity from renewable energy sources that will be fed into the Hungarian public electricity grid. Its operation will therefore directly affect the power plants connected to the grid by displacing output of those that have the highest marginal costs, since Hungary’s law stipulates that power from renewable energy sources has to be taken over by the grid operator.
In the project scenario the heat from the biogas plant will be used to heat water in the nearby laundry. Currently the laundry uses natural gas as energy source. Demand of natural gas will be reduced by using heat from the biogas plant.
The centralization of the manure management system in the project scenario will lead to an increase of transportation. The feedstock will have to be transported from the different animal husbandries (Parrag, Bernátkút, Hangos and from Adonyhús Kft.) to the biogas plant. Compared to the baseline scenario where each animal husbandry would have its own manure management system, the project would lead to an increase of transportation of about 81 km/day. However, calculating with emission factors from the IPCC Guidelines8 the emissions caused by the additional

Baseline Preparation of the Project Design Document 52 / 111
transport is about 23.08 tCO2e/year (<1% of total ER per year). As this is not a significant GHG source the transport of the feedstock will not be inside the project boundary.
Fuel production and fuel transport of the grid power plant are also not included in the project boundary. In the project scenario fuel demand will be reduced due to displacement of grid electricity by the project and hence less GHG emissions will occur during fuel production and transport. However, these sources are not inside the project boundary since the GHG reduction cannot be calculated at an acceptable degree of certainty. Fact is that GHG emissions of fuel production and transportation will be reduced and if is not within the project boundary, this will contribute to a conservative bias of the baseline.
The fermented manure is a high quality fertilizer. The nutrient losses will be reduced to a minimum in the project scenario, as all storages will be covered. Hence, the demand of chemical fertilizer can be reduced by applying biogas manure to the field. As chemical fertilizer production is a significant GHG-source, it will be considered in the project boundary.
Applying nitrogen fertilizer to fields will lead to GHG-emissions from soils in general. However, as the project (fermented manure in the project scenario instead of not fermented manure and chemical fertilizer in the baseline scenario) will not have a significant effect to the GHG-emission from soils and those emissions can not be determined in an acceptable decree of certainty, GHG-emissions from soils will not be considered within the project boundary. Anyway, according to a research from K. Möller (2003)9 the application of fermented manure will lead to less GHG emissions (N2O) compared to the application of not fermented manure, as anoxic conditions will be avoided due to the degradation of carbon during the biogas process which results in less bacteria activity in soils. C. Lampe et al. report that application of chemical (mineral) fertilizers is related to 22% more GHG emissions compared to liquid manure10.
PA will grow and reap additional energy crops (maize) in the proposed project (3500 t dry matter). According to C.Wells11 maize cropping is related to 87.1 kgCO2e / t dry matter, including fertilizing seed production and harvesting. This results in additional GHG emission of below 1% of the total GHG baseline emissions. So this is not a significant amount and thus outside of the project boundary.
8 Revised 1996 IPCC Guidelines for National Greenhouse Gas Inventories: Reference Manual; Page 1.82; Table 1-39. Please note, that emission factors for heavy duty vehicles (30 l/ 100km) have been used for this calculation. 9 K. Möller (2003), “Systemwirkungen einer “Biogaswirtschaft” im ökologischen Landbau: Pflanzenbauliche Aspekte, Auswirkungen auf den N-Haushalt und auf Spurengasemissionen”; Page 9; http://www.uni-giessen.de/orglandbau/biogas-uebersicht 10 Carola Lampe et al, 2003; “Einfluss der N-Düngung auf die N2O Emissionen auf Grünland”; page 39; http://www.riswick.de/pdf/gruenland/gruenlandtagung2003.pdf (from page 36 to 42). 11 C.Wells 2001 “Total Energy Indicators of Agricultural Sustainability: Dairy Farming Case Study“; http://www.maf.govt.nz/mafnet/publications/techpapers/techpaper0103-dairy-farming-case-study.pdf

Baseline Preparation of the Project Design Document 53 / 111
Influencing factors can affect both the project scenario and the baseline scenario. Factors relevant for the project and their possible effects are to be stated. Examples are the energy policy of the host country, raw material prices etc. For details see e.g. the baseline study available at http://www.ji-cdm-austria.at or http://www.klimaschutzprojekte.at.
D 1.4 Influencing factors
Legal influencing factors Type of influencing factor
Factor A: Approval process
Factor B:
Relevance for the project
Factor A: Delays due to a protracted approval process
Factor B:
Expected development
Factor A: Receive in time of building permits for biogas plant as planned
Factor B:
Economic and political influencing factors
Type of influencing factor
Factor A: Price of base load electricity after 2010
Factor B:
Relevance for the project
Factor A: Change of economically viability
Factor B:
Expected development
Factor A: Increase by 4.5 % per year on average.
Factor B:
Please extend the table if multiple factors play a role.

Baseline Preparation of the Project Design Document 54 / 111
D 2 PROJECT SCENARIO There are no significant GHG emissions in the project scenario (please refer to baseline study for mor details).
D 2.1 Project emissions within the project boundary
X Emission 1
Source: Storages for digested substrates (effluent of the biogas plant)
Type of emission: Methane
⃝ Emission 2
Source: _________________________________________________________
Type of emission: _________________________________________________
⃝ Emission 3
Source: _________________________________________________________
Type of emission: _________________________________________________
⃝ Emission 4
Source: _________________________________________________________
Type of Emission: ________________________________________________
Emissions within the project boundary
⃝ No emissions within the project boundary
Leakage is (project-related) emissions occurring outside the project boundary. They are not under the direct influence of the project operator.
D 2.2 Leakage
⃝ Leakage 1
Source: ________________________________________________________
Type of leakage: _________________________________________________
⃝ Leakage 2
Source: ________________________________________________________
Type of leakage: _________________________________________________
Leakage
X No leakage
To calculate the project emissions the following data must be collected for each emission source:
1 fuel input in tonnes,
2 specific emission factors.

Baseline Preparation of the Project Design Document 55 / 111
The emissions are calculated by multiplying the fuel input by the corresponding emission factors. For details see e.g. the baseline study available at http://www.ji-cdm-austria.at or http://www.klimaschutzprojekte.at.
D 2.3 Calculation of project emissions within the project boundary
(EB PDD E.1., EB PDD E.6.)
Emission 1 In the project scenario organic material is fermented in the biogas plant. Biogas generated there during the degradation process in the digesters is captured and combusted in the biogas engines. If any breakdown of these engines would happen, the biogas is flared by an emergency gas flare. Except the lagoons to store the digested substrates all tanks and vessels (mixing pit, equalizing tank,…) are designed gas proof. Furthermore air from the acceptance hall is cleaned in a biofilter before it is released to the environment. Anyway, significant amount of methane will not arise there. The digested manure storages are covered so that nitrogen losses are reduced to a minimum.
Consequently only the storages for the digested substrates provide potential sources for GHG emissions. Anyway, methane formation is rather low there, as the substrate has already been fermented before and the hydraulic retention time in the digesters is long (53 days). However, full fermentation cannot be guaranteed. After the fermentation process in the digesters, the formation of 2 % of the total biogas generation potential is realistic. In order to calculate these emissions conservatively, the emissions are calculated with 3 %.
The calculation of the project emissions are shown below, therefore the project is related to 1,526 tCO2e per year, that results from methane formation in the storages of digested substrates: PROJECT GHG EMISSIONS UnitTotal biogas formation 6,026,280 m³/a% of biogas formation in the storages 3%Biogas from storages 180,788 m³/a% methane in the biogas 60%Density methane 0.67 kg/m³GWP 21
GHG emissions of the biogas plant 1,526 tCO2e
Emission 2
Emission 3
Emission 4
Please include a description of the formulae used to estimate anthropogenic emissions by sources of greenhouse gases of the project activity within the project boundary (for each gas, source, formulae/algorithm, emissions in units of CO2 equivalent).

Baseline Preparation of the Project Design Document 56 / 111
D 2.4 Calculation of leakage emissions
(EB PDD E.2., EB PDD E.6.)
n/a
Leakage 1
Leakage 2
Please include a description of the formulae used to estimate leakage, defined as: the net change of anthropogenic emissions by sources of greenhouse gases which occurs outside the project boundary, and that is measurable and attributable to the project activity (for each gas, source, formulae/algorithm, emissions in units of CO2 equivalent).
D 2.5 Calculation of total project activity emissions
(EB PDD E.3., EB PDD E.6.)
2006 2007 2008 2009 2010 2011 2012 ∑
Emissions (in t CO2/year) 1,526.2 1,526.2 1,526.2 1,526.2 1,526.2 1,526.2 1,526.2 10,684
Leakage (in t CO2/year) 0 0 0 0 0 0 0 0
Total emissions (in t CO2/year) 1,526.2 1,526.2 1,526.2 1,526.2 1,526.2 1,526.2 1,526.2 10,684

Baseline Preparation of the Project Design Document 57 / 111
D 3 BASELINE SCENARIO Baseline methodology refers to the methods used to determine the baseline emissions. The division of the project into various subcomponents could serve the selection of a baseline methodology. For details see e.g. the baseline study available at http://www.ji-cdm-austria.at or http://www.klimaschutzprojekte.at.
D 3.1 Baseline methodology
Description of the selected methodology and justification of the choice of the methodology and why it is applicable to the project activity
(EB PDD B.2.)
If an approved methodology is chosen, please indicate the title and reference of the methodology applied to the project activity.12
(EB PDD B.1.)
PA uses a variety of criteria to evaluate major investment decisions. These include social, environmental, legal, political and economic criteria. Anyway, to find the baseline scenario for the GHG emission sources of the proposed project – investments on basic facilities of the agricultural farms - PA finally decide on economic criteria.
Four scenarios were identified in the baseline study.
- business as usual (BAU) scenario
- solid/solid scenario
- liquid/solid scenario
- biogas plant scenario
BAU is really not realistic because the current situation does not comply with Hungarian and EU legislation. Therefore BAU was excluded in advance.
The scenarios solid/solid and liquid/solid has been evaluated by a cost analysis (Details are found in the baseline study).
For the biogas scenario IRR and NPV has been calculated, but the investment does not show economic viable figures (please refer to baseline study)
Calculating the baseline emissions:
Methane emissions have been calculated according to the method provided in the “Revised 1996 IPCC Guidelines for National Greenhouse Gas Inventories workbook” and the “IPCC Good Practice Guidance and Uncertainty management in National Green House Gas Inventories” respectively.
Also the calculation of the emissions from burning natural gas is based on the emission factor from IPCC Guidelines.
For calculating the GHG emissions from chemical fertilizer production, emission factors published by IFA (International Fertilizer Industry Association) have been used (Please refer to Baseline Study for further details).
The electric sector baseline methodology is defined by data availability of the Hungarian electric sector. In the case of the Palhalma project data for elaborating a least cost dispatch analysis are not public available.
Therefore an average emission approach excluding hydro and nuclear has been 12 If a new baseline methodology shall be applied to a CDM project activity, a special procedure has to be observed. For details please refer to http://cdm.unfccc.int/.

Baseline Preparation of the Project Design Document 58 / 111
chosen for the Palhalma Joint Implementation project. The generation of the Palhalma JI project will directly affect the generation of power plants connected to the Hungarian grid; displacing those that have the highest marginal costs. Due to their low marginal costs, nuclear power plants are dispatched as base load, and their operation will not be influenced by the proposed project. Also the generation of the hydro power plants, which have the lowest operational costs, will not be affected by the Palhalma project.
Actual electricity sector data are published by MVM Rt (‘Statistics of the Hungarian Power System’). In addition, the applied baseline methodology takes the expected development of the Hungarian electric power system into consideration, using the electric market forecast data published by the International Energy Agency.
Description of how the methodology is applied in the context of the project activity
(EB PDD B.3.)
The methodology applies in the context of project activity as all significant and anthropogenic GHG emissions can be calculated.

Baseline Preparation of the Project Design Document 59 / 111
Different scenarios can be used for each methodology.
D 3.2 Identification of different baseline scenarios
Baseline Scenario 1 Scenario 1 – Solid Based MM-System
PA reconstructs the current MM-systems to comply with legislation. The slurry is stored in sealed tanks and a collecting pit for the liquid run of from will be installed at each husbandry.
The total investment for this is about 245,900 €. The method to apply the substrate to fields will not change. The application costs are about 10€/t.
Baseline Scenario 2 Scenario 2 – Liquid/Solid Based MM-System
PA would install a new liquid based manure management (MM) system for pigs in Ùjgalambos and Bernátkút. The solid based systems in Parrag and Hangos would be refurbished.
Ùjgalambos Pigs Liquid based system Bernátkút Pigs Liquid based system Parrag Cattle Solid based system Hangos Cattle Solid based system
Table 1: MM-Systems at PA
Currently there is a solid based system installed at Ùjgalambos and Bernátkút. But, handling the solids is very costly – especially transportation and spreading them to the fields. Therefore PA would prefer installing a liquid based system for pigs at Ùjgalambos and Bernátkút. The implementation of this system would require reconstruction of the pigsties, but even considering this investment, the liquid based system would be more economic than solid based systems. (Please compare the cost analysis in the Baseline Study
Liquid based systems for pigs are common in this part of Hungary (e.g.: Adonyhús Kft.); especially for large scale pig farming this system is more economic than solid based MM systems.
In Parrag and Hangos (cattle husbandries) PA intends to retain the solid based system. The current systems will have to be refurbished to comply with legislation. Tight grounds and a proper collecting pit for liquids will be installed at Parrag and Hangos.
It is clear that it is not possible to continue with BAU. PA will have to secure leak proof manure storages and thus they have to invest. As it is mentioned in the Baseline Study; a liquid based MM is more economic than a pure solid based MM-system for pigs. Thus PA will have to invest at least in a liquid/solid based MM-system for pigs and the refurbishment of MM-systems in Hangos and Parrag. Therefore the total investment is about 870.000 €.

Baseline Preparation of the Project Design Document 60 / 111
Baseline Scenario 3 Scenario 3 – Biogas Plant
PA built a biogas plant that is accomplished by the end of 2005. The biogas plant generates electricity and heat from renewable sources. The biogas plant and its storages solve the MM-problems of PA, as the project displaces the old leaking MM-systems. Electricity is directly fed into the public Hungarian electricity grid. Heat is used as energy source in the nearby laundry. Hot water for washing machines is produced and water for steam production is preheated.
Following feedstocks are fermented in the biogas plant. Pig manure, slaughterhouse wastes and remains from sun flower oil production are delivered from Héliosz-Coop Kft:: Feedstock Pig manure 14.400 t/a Cattle manure 15.000 t/a Kitchen wastes 60 t/a Slaughterhouse wastes 200 t/a Wastewater from pig husbandries 23.120 t/a Maize silage 12.000 t/a Pig manure (Adonyhús) 25.000 t/a Remains from sun flower oil production (Héliosz-Coop Kft)
35 t/a
Slaughterhouse wastes (Adonyhús) 440 t/a
The feedstocks are fermented in a mesophilic (about 38°C) biogas process. Slaughterhouse wastes are sanitized in special facilities before they are fed into the biogas plant. A two-stage fermenting process (primary and secondary digester) provides the full fermentation of the substrate and maximizes the biogas generation. The biogas is combusted in two biogas engines (combined heat and power engines), where electricity and heat is generated (13,376 MWh/a electricity; 14,944 MWh/a heat). The biogas engines do have following characteristics:
Efficiency Hours of
Operation Electric Capacity Thermal Capacity
electric thermal h/a kW kW 38% 46% 8.000 2 x 836 2 x 934
The electricity is sold and fed into the public Hungarian electricity grid. Biogas heat is delivered to the laundry, where natural gas is replaced.
The digested substrates are stored in sealed storages that are dimensioned to store liquids for 120 days to comply with legislation.
The liquid effluent of the biogas plant contains nutrients in a high quality state. PA uses the effluent to fertilize its fields and thus PA is able to reduce its chemical fertilizer demand. Liquids are also much easier to handle compared to solids, so that costs for manure application are reduced.
To build the biogas plant will need a further investment of about 3,581,000 € (considering funds of 1,600,000 € and opportunity costs).
Following operational costs are associated with the biogas plant:
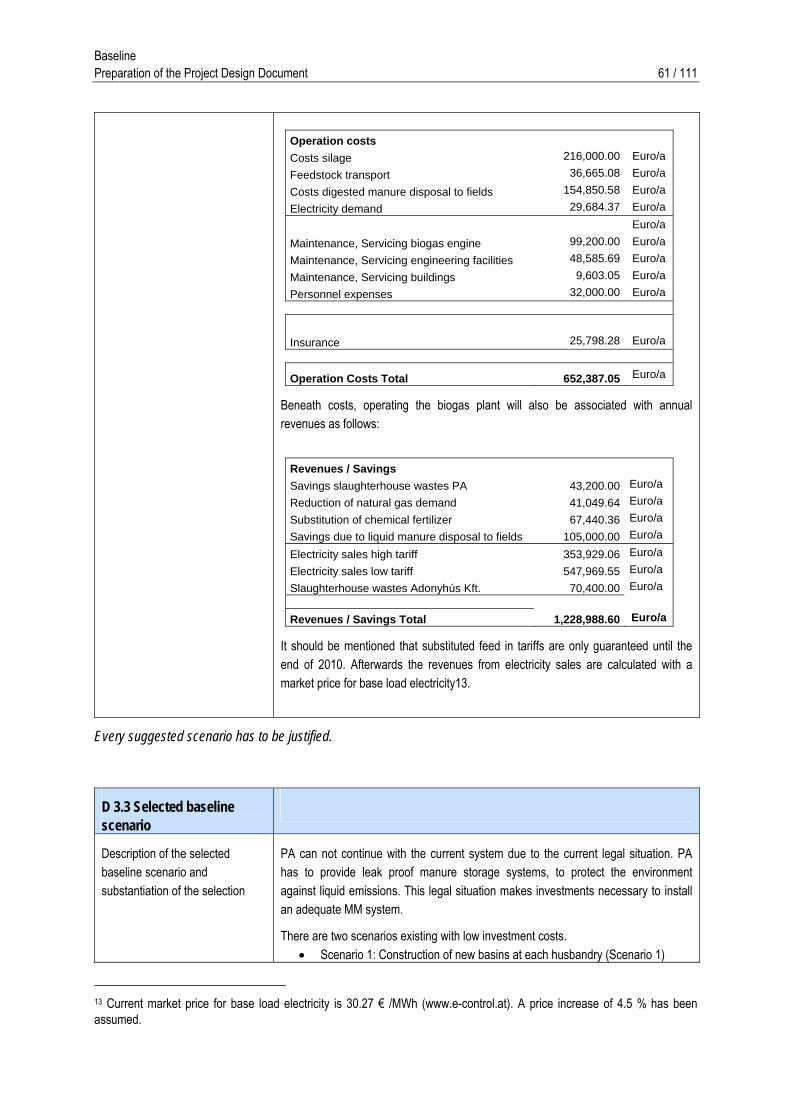
Baseline Preparation of the Project Design Document 61 / 111
Operation costs
Costs silage 216,000.00 Euro/a
Feedstock transport 36,665.08 Euro/a
Costs digested manure disposal to fields 154,850.58 Euro/a
Electricity demand 29,684.37 Euro/a
Euro/a
Maintenance, Servicing biogas engine 99,200.00 Euro/a
Maintenance, Servicing engineering facilities 48,585.69 Euro/a
Maintenance, Servicing buildings 9,603.05 Euro/a
Personnel expenses 32,000.00 Euro/a
Insurance 25,798.28 Euro/a
Operation Costs Total 652,387.05 Euro/a
Beneath costs, operating the biogas plant will also be associated with annual revenues as follows:
Revenues / Savings
Savings slaughterhouse wastes PA 43,200.00 Euro/a
Reduction of natural gas demand 41,049.64 Euro/a
Substitution of chemical fertilizer 67,440.36 Euro/a
Savings due to liquid manure disposal to fields 105,000.00 Euro/a
Electricity sales high tariff 353,929.06 Euro/a
Electricity sales low tariff 547,969.55 Euro/a
Slaughterhouse wastes Adonyhús Kft. 70,400.00 Euro/a Revenues / Savings Total 1,228,988.60 Euro/a
It should be mentioned that substituted feed in tariffs are only guaranteed until the end of 2010. Afterwards the revenues from electricity sales are calculated with a market price for base load electricity13.
Every suggested scenario has to be justified.
D 3.3 Selected baseline scenario
Description of the selected baseline scenario and substantiation of the selection
PA can not continue with the current system due to the current legal situation. PA has to provide leak proof manure storage systems, to protect the environment against liquid emissions. This legal situation makes investments necessary to install an adequate MM system.
There are two scenarios existing with low investment costs. • Scenario 1: Construction of new basins at each husbandry (Scenario 1)
13 Current market price for base load electricity is 30.27 € /MWh (www.e-control.at). A price increase of 4.5 % has been assumed.

Baseline Preparation of the Project Design Document 62 / 111
• Scenario 2: Construction of new basins at the cattle husbandries but installation of a liquid based MM-system at the pig husbandries (Scenario 2).
For cattle husbandries PA would retain the current manure management methods, but for pig husbandries there are two alternatives existing.
• Option 1: to continue using litter in the husbandries (“solid”) • Option 2: to switch to liquid based system, without litter (“liquid”). Such
systems are quite common for pig husbandries in this region.
As it is shown in Baseline Study Annex Liquid vs. Solid MM-System at Pig Husbandries; a liquid based MM system has more investment costs than a solid based system, because the liquid based system requires an adequate canalization system from the pigsties. The reconstruction of the current MM-systems at the pig husbandries would therefore be related to investment costs of about 137,470 € (option 1). Due to the required reconstruction of the pigsties and the required canalization system option 2 would have higher investment costs of about 756,247 €.
To finance investments of the active business PA does not take out loans. For these investments PA uses its cash flow for financing. Therefore PAs investments usually do not exceed about 230 Mio HUF (920,000 €). As scenario 1 as well as scenario 2 do not exceed this range, both of the scenarios are financially feasible for PA.
A more detailed analysis of both Scenarios shows that Scenario 1 is related to higher operating costs than Scenario 2. Handling solids is more costly than handling liquids. A cost comparison of the implementation between option 1 and option 2 in the pig husbandries shows following results (please refer to the Baseline Study Annex Liquid vs. Solid MM-System at Pig Husbandries):
Liquid Based / Solid Based MM-System
0
500000
1000000
1500000
2000000
2500000
3000000
0 1 2 3 4 5 6 7 8 9 10 11 12 13 14 15 16 17 18 19 20
Years
Costs in €
Liquid Based Solid Based
In the medium term the liquid based option is more cost effective than the solid based option. The “break even” was calculated by 5.98 years. Considering the long lifetime of more than 20 years of these systems PA would prefer a liquid based MM-system in the pig husbandries and therefore scenario 2.
A biogas plant (scenario 3) is also able to meet the legal requirements for MM-systems. But, PA would not be able to finance it without an investment loan as the total investment costs are more than 6 Mio. €.

Baseline Preparation of the Project Design Document 63 / 111
Baseline Study (Annex: Baseline Scenario Biogas Plant). IRR and NPV have been calculated for the biogas plant that shows following figures.
Financial Results IRR 5.3% NPV -463,691
In contrast to scenarios 1 and 2, which would be financed out of the cash flow/regular investment program, PA would have to take out a loan. With an IRR of 5.3% and a NPV of -462,691 € the project is not attractive enough to be able to secure financing.
A sensitivity analysis on the investment cost and on the baseload price increase has been done. The increase of the baseload price increase is an important factor as the current regulation that guarantees a feed in tariff for electricity from renewable sources expires by the end of 2010 and it has to be assumed that after 2010, the feed in tariff complies with market prices for baseload electricity then.
An increase of the feed in tariff is very likely in the future. The electricity demand especially in Eastern Europe will increase that the currently installed capacities will not be able to meet. Moreover there are many power plants that have to be decommissioned because of lacking environmental or safety standards. Consequently new power plants will have to be constructed that will be associated with higher prices for baseload electricity. Therefore an price increase of the current market prices for baseload electricity of 4.5% per year on average has been assumed.
Beneath the sensitivity of the financial figures on the baseload price increase, the influence of a change of the investment costs has been analyzed. The results are shown below:
Sensitivity of IRR on Investment
0.0%
2.0%
4.0%
6.0%
8.0%
-10% -5% 0% 5% 10%
Change of Investment Costs
IRR
Table 1

Baseline Preparation of the Project Design Document 64 / 111
Sensitivity of NPV on Investment
-1000000
-500000
0-10% -5% 0% 5% 10%
Change of Investment Costs
NPV
Table 2
Sensitivity of IRR on Baseload Price Increase
0.0%
2.0%
4.0%
6.0%
8.0%
-10% -5% 0% 5% 10%
Change of Price increase
IRR
Table 3
Sensitivity of NPV on Baseload Price Increase
-1000000
-500000
0-10% -5% 0% 5% 10%
Change of Price Increase
NP
V
Table 4
The sensitivity analysis demonstrates ,(table 1 and table 2) that even with a 10% reduction of the investment costs Scenario 3 shows a negative NPV and an IRR of

Baseline Preparation of the Project Design Document 65 / 111
6.58% (The assumed discount rate is 7%)
The sensitivity of IRR and NPV (table 3 and 4) on the baseload price increase that results in the assumed feed in tariff after 2010 shows that baseload price has to increase annually by 5.6 % on average, that the NPV of Scenario 3 is positive.
D 3.4 Baseline description
Was a new baseline developed for the project?
X Yes
⃝ No
Was an existing baseline used or adapted for the project?
⃝ Yes: _____________________________________________________ (State sources and matters used.)
X No
Is it planned to update the baseline during the project lifetime?
⃝ Yes
X No

Baseline Preparation of the Project Design Document 66 / 111
D 3.5 Baseline emissions within the project boundary
X Emission 1
Source: Conventional MM-systems Ùjgalambos Pigs Liquid based system Bernátkút Pigs Liquid based system Parrag Cattle Solid based system Hangos Cattle Solid based system Adonyhús Kft Pig Liquid based system
Type of emission: Methane
X Emission 2
Source: Grid Power Plants
Type of emission: CO2
X Emission 3
Source: Gas boilers at the laundry in Bernátkút
Type of emission: CO2
X Emission 4
Source: Chemical fertilizer production
Type of emission: CO2, N2O
Emissions within the project boundary
⃝ No emissions within the project boundary
D 3.6 Leakage
⃝ Leakage 1
Source: ________________________________________________________
Type of leakage: ________________________________________________
⃝ Leakage 2
Source: ________________________________________________________
Type of leakage: ________________________________________________
Leakage
X No leakage
To calculate the baseline emissions the following data must be collected for each emission source:
1 fuel input in tonnes,
2 specific emission factors.

Baseline Preparation of the Project Design Document 67 / 111
The emissions are calculated by multiplying the fuel input by the corresponding emission factors. For details see e.g. the baseline study available at http://www.ji-cdm-austria.at or http://www.klimaschutzprojekte.at.

Baseline Preparation of the Project Design Document 68 / 111
D 3.7 Calculation of baseline emissions
(EB PDD E.4., EB PDD E.6.)

Baseline Preparation of the Project Design Document 69 / 111
Emission 1 Manure is principally composed of organic material. When this organic material decomposes in an anaerobic environment, methanogenic bacteria produce methane (CH4). These conditions often occur when large numbers of animals are managed in confined areas.
For the calculation of this methane emission factors from the IPCC Good Practice Guidance and Uncertainty Management in National Greenhouse Gas Inventories (Chapter 4.3) have been used. tCO2 e = GWP(Methane) * CH4 [MM]
GWP = Global Warming Potential for methane = 21 CH4 [MM] = Emission Factor [MM] * Population / (106 kg/Gg) Emission Factor (EF) [MM] = emission factor for the defined livestock population Population = the number of head in the defined livestock population EF [MM] = VSi * 365 days/year * Boi * 0,67 kg/m³ * MCFjk VSi = daily volatile solids (VS) excreted for animal within defined population i, in kg Boi = maximum CH4 producing capacity for manure produced by an animal within defined population i, m³/kg of VS MCFjk = CH4 conversion factors for each manure management system j by climate k
Volatile Solids - VS14
In the Revised 1996 IPPC Guidelines for National Greenhouse Gas Inventories: Reference Manual page 4.39 (Table B-1) and page 4.42 (Table B-2) following figures of VS for pigs, diary cattle and non diary cattle are found:
Type of Animal Unit VS Pigs [kg/hd/day] 0,5 Diary Cattle [kg/hd/day] 5,1 Non Diary Cattle [kg/hd/day] 3,9
CH4 Producing Capacity - Bo
For calculating the methane emissions following CH4 producing capacity for the different types of manure have been used15.
Type of Animal Unit Bo Pigs [m³CH4/kgVS] 0,45 Diary Cattle [m³CH4/kgVS] 0,24 Non Diary Cattle [m³CH4/kgVS] 0,17

Baseline Preparation of the Project Design Document 70 / 111
Methane emission from Litter
1800 t/a litter will be used in the cattle husbandries in Parrag and Hangos. The organic material is also decomposed in the MM system.
Litter Unit VS16 88 [%] Bo17 0,6 [m³CH4/kgVS]
Methane Conversion Factors – MCF
Default MCF values are provided in the IPCC Guidelines for different manure management systems and climate zones.
The MM-systems described in the Baseline Scenario result in following MCFs according to the IPCC Good Practice Guidance and Uncertainty Management in National Green House Gas Inventories page 4.36 (table 4.10)18.
MM system Type of MM MCF Ùjgalambos Anaerobic Lagoon 100 % Bernátkút Anaerobic Lagoon 100 % Hangos19 Liquid/Slurry 39 % Parrag Liquid/Slurry 39 % Adonyhús Kft Anaerobic Lagoon 100 %
Emission 2 In 2002 total amount of electricity produced in Hungary was about 35,000 GWh. As it is shown in the Baseline Study about 59.5 % of this amount was produced in fossil fuel power plants, about 39.9% in nuclear power plants and 0.6% in hydro power plants. According to the baseline approach, further calculations are based on the figures, given in the last column of the table below, the share of fossil fuel based electricity generation.
14 As emission reduction will occur first in 2006 when the biogas plant is operating, Hungary has already been two years in the EU and Western standard in the agriculture sector will be reached. 15 Revised 1996 IPCC Guidelines for National Greenhouse Gas Inventories: Reference Manual page 4.39 (Table B-1) and page 4.42 (Table B-2) 16 IPCC Good Practice Guidance and Uncertainty Management in National Greenhouse Gas Inventories; Table 4.16 17 Derived from "Landwirtschaftliche Biogasanlagen" G. Jüngling, 1999; page 17 18 The annual mean temperature in Pálhalma is below 15°C „Cool Climate“ 19 An analysis of the existing storages shows that the substrate has a dry matter content of 21 %. Therefore a substrate stored in tanks with sealed grounds would have lower dry matter content. IPCC guidelines draw the line between liquid/slurry and solid MM-system by 20% dry matter content. Thus the MM-systems at Hangos and Parrag would be categorized as liquid/slurry MM-system according the IPPC guidelines. 20 http://www.iea.org/

Baseline Preparation of the Project Design Document 71 / 111
Electricity Generation 2002 GWh % total % fossil
Coal (Lignite) 8,663 24.8% 41.7% Fuel Oil 2,074 5.9% 10.0% Natural Gas 10,043 28.8% 48.3% Hydrocarbons as total 12,117 34.7% 58.3% Fossil Fuels as total 20,780 59.5% 100.0% Hydro Power 195 0.6% Nuclear Power 13,953 39.9%
Total 34,928 100.0%
On of the key factors determining the specific electricity emission factors is the efficiency of the power plants within the project boundary. Plant categories specific efficiencies are published by MVM. The table below shows the plant categories specific efficiencies in 2002.
Efficiencies 2002 Electricity Output Fuel Input Efficiency
GWh PJ % Coal 8,663 107.9 28.9% Fuel Oil 2,074 22.8 32.8% Natural Gas 10,043 106.5 34.0% Hydrocarbons as total 12,117 129.2 33.8% Fossil Fuels as total 20,780 237.1 31.6% Nuclear Power 13,953 148.8 33.8%
Based on the electricity sector forecast, published by the International Energy Agency (IEA), the next figure shows the development of the electricity generation up to 2020. The average annual growth rate of the Hungarian electricity generation is forecasted by about 1% per year.
Electricity Generation 2005-2020
30,00032,00034,00036,00038,00040,00042,00044,00046,00048,00050,000
2005
2006
2007
2008
2009
2010
2011
2012
2013
2014
2015
2016
2017
2018
2019
2020
GW
h
Total GWh
The following table summarizes the IEA forecast of the annual change in fossil fuel electricity generation. Details are described in the ‘Energy Policies of IEA Countries, Hungary Review 2003’, published by the International Energy Agency20.
Increase/Decrease IEA Coal Oil Gas
2000-2005 %/a -2.02% 1.16% 0.85% 2005-2010 %/a -0.68% -0.29% 0.98% 2010-2020 %/a -0.53% 0.42% 0.11%
Based on the actual figures given in the table above and the Hungarian specific electricity forecast data, the following table gives the expected generation share of fossil fuelled power station until 2012.

Baseline Preparation of the Project Design Document 72 / 111
Generation Mix 2002 2006 2007 2008 2009 2010 2011 2012
Coal 41.7% 34.9% 34.3% 33.6% 32.9% 32.2% 31.7% 31.2% Fuel Oil 10.0% 13.2% 12.9% 12.6% 12.3% 12.0% 12.4% 12.8% Natural Gas 48.3% 51.9% 52.8% 53.8% 54.8% 55.8% 55.9% 56.0%
Total 100% 100% 100% 100% 100% 100% 100% 100%
As shown in table above Hungarian coal fired power generation will decrease (31.2% of total fossil fuelled power generation in 2012), whereas the natural gas fired power generation will increase to about 56% in 2012.
In order to apply a conservative baseline approach, it is assumed that all new natural gas fired power plants will be combined cycle units with a conversion efficiency of 57.5%. Efficiencies of new oil and coal fired power plants are expected to be 47%.
From an economic point of view it is obvious, that decommissioned coal fired power plants will be those with the lowest conversion efficiency. For the sake of a conservative baseline approach and taking the decommissioning of coal fired power plants into consideration, efficiency improvements of coal fired power plants are considered in this baseline study. Therefore the efficiency of coal-fired power plants will slightly increase, resulting in 31.9% in 2012. The table below shows the specific plant efficiencies and the total weighted fossil fuelled power plant efficiency.
Total Plant Efficiency 2002 2006 2007 2008 2009 2010 2011 2012
Coal Power Stations % 28.9% 30.1% 30.4% 30.7% 31.0% 31.3% 31.6% 31.9% Oil Power Stations % 32.8% 36.4% 36.4% 36.3% 36.3% 36.3% 36.6% 37.0% Gas Power Stations % 34.0% 36.5% 37.0% 37.5% 38.0% 38.5% 38.7% 38.9%
Total Efficiency % 31.6% 34.0% 34.4% 34.8% 35.2% 35.6% 35.9% 36.2%
Increasing total fossil fuel based electricity generation (2005-2012) will be mainly satisfied by gas fired power production, whereas coal based generation will slightly decrease. Therefore the expected total weighted efficiency of fossil fueled power plants will increase from actual 31.6% (2002) to about 36.2% in 2012.
The figures shown above result in Hungarian specific electricity emission factors as shown in table below using IPCC carbon factors of 0.36, 0.26, 0.20 tCO2 per MWh of fuel input for coal, oil and gas respectively.
Hungarian Emission Factors 2006 2007 2008 2009 2010 2011 2012
Electricity Emission Factor tCO2/MWh 0.81 0.79 0.78 0.77 0.75 0.75 0.74
The specific Hungarian electricity emission factors are expected to decrease in the time span 2006 to 2012. Based on the applied methodology the emission factor for the year 2006 is about 0.81 t CO2 /MWh and will fall to 0.74 t CO2 /MWh in the year 2012.
As argued above, these GHG emission factors for electricity generation are conservative and lead to a conservative estimation of emission reductions. As mentioned in the IPCC Guidelines for National GHG inventories, locally available data should be used wherever possible. In the absence of more detailed data,

Baseline Preparation of the Project Design Document 73 / 111
electricity emission factors as described in the table above will be used for the Palhalma JI project.
The biogas block CHP has an electric capacity of 2*836 kW. Based on 8000 hours of operation the annual electricity output is about 13,380 MWh. The own electricity demand of the biogas plant is about 6% (803 MWh), resulting in total net 12,573 MWh fed into the public Hungarian electricity grid.
Finally, the table below summarizes the baseline electricity CO2 emissions 2006-2012.
Summary Baseline Electricity 2006 2007 2008 2009 2010 2011 2012
Block CHP Net Generation MWh 12,573 12,573 12,573 12,573 12,573 12,573 12,573
Emission Factor tCO2/MWh 0.81 0.79 0.78 0.77 0.75 0.75 0.74
Electricity CO2 Emissions tCO2 10,129 9,964 9,803 9,646 9,492 9,385 9,280
Emission 3 t CO2 e = Natural gas demand / EF [natural gas] * heat value [natural gas]
Natural gas demand = primary gas demand that can be substituted by biogas heat in m³
EF [natural gas] = Emission Factor for natural gas 0,20196 tCO2/MWh21
Heat value [natural gas] = 10 kWh/m³
Emission 4 About 73,335 t of biogas fertilizer will be used for fertilizing PA´s fields. It is envisaged that the rest will be used by Adonyhús Kft. PA will logically save the fertilizers with the highest costs per nutrient. With using the biogas fertilizer PA displaces following chemical fertilizers.
Substitution kg €/kg nutrient
Nitrosol 74,094 0.39
Karbamid 0 0.35
Fertisol 0 0.38
MAS 275,000 0.45
MAP 11:52 133,300 -
K-60 95,305 -
Total 577,699
GHG emissions from fertilizer production are calculated by using a model established by Hydro Agri Europe22. The following tables show the calculation of the GHG
21 The emission factor is derived Table 1-2, page 1.6 of the Revised 1996 IPCC Guidelines for National Greenhouse Gas Inventories workbook. 22 see „Energy Consumption and Greenhouse Gas Emissions in Fertilizer Production“; G.Kongshaugm 1998; the study is part of the Fehler! Verweisquelle konnte nicht gefunden werden.

Baseline Preparation of the Project Design Document 74 / 111
emissions in chemical fertilizer production. In general each fertilizer product (for further details please refer to Baseline Study). Chemical fertilizers consist of one or more building blocks and additives. In the emission factors for each building block listed below are all GHG emissions (CO2e) from raw material to fertilizer products considered. The fertilizers used by PA are produced in production companies in Eastern Europe (Hungary, Ukraine, Russia, and Croatia). Without much doubt this production companies are relatively old. In order to calculate the emission reduction in a conservative bias, emission factors of “average Europe” technology have been chosen.
Product Name Building Block * Emission Factor * Substituited Amount GHG Emissions tCO2e / t t Fertilizer tCO2e K60 MOP 0.34 95 32.40 Karbamid UREA 0.61 0 0.00 MAP 11:52 MAP 11:52 0.31 133 41.32 Nitrosol CAN 1.82 74 134.85 Fertisol AS 0.34 0 0.00 MAS 27 AN 33.5 2.28 275 627.00 Total 578 835.58 * see Annex "Energy Consumption and Greenhouse Gas Emissions in Fertilizer Production"; G.Kongshaug, 1998
The substitution of chemical fertilizer at PA by biogas manure results 835 tCO2e per year in total. Following emission factor can be calculated:
ER 835.58 tCO2e
Biogas Fertilizer 73335.00 m³
Emission Factor 0.0114 tCO2e / m³
tCO2 e = biogas fertilizer applied to PA´s fields [m³] * EF factor [tCO2 e]
Please describe the formulae used to estimate the anthropogenic emissions by sources of greenhouse gases of the baseline (for each gas, source, formulae/algorithm, emissions in units of CO2 equivalent).
D 3.8 Calculation of leakage emissions
n/a
Leakage 1
Leakage 2
Please present the calculation including the basis and method of calculation.

Baseline Preparation of the Project Design Document 75 / 111
D 3.9 Calculation of total baseline emissions
(EB PDD E.6.)
2006 2007 2008 2009 2010 2011 2012 ∑
Emissions (in t CO2/year) 39,413 39,248 39,087 38,929 38,775 38,668 38,564 272,684
Leakage (in t CO2/year) 0 0 0 0 0 0 0 0
Total emissions (in t CO2/year) 39,413 39,248 39,087 38,929 38,775 38,668 38,564 272,684

Baseline Preparation of the Project Design Document 76 / 111
D 4 EMISSION REDUCTIONS
D 4.1 Expected emission reductions
(EB PDD E.5., EB PDD E.6.)
2006 2007 2008 2009 2010 2011 2012 ∑
Expected total project emissions (in t CO2/year) 1,526 1,526 1,526 1,526 1,526 1,526 1,526 10,684
Expected total baseline emissions (in t CO2/year) 39,413 39,248 39,087 38,929 38,775 38,668 38,564 272,684
Expected total emission reductions (in t CO2/year) 37,887 37,722 37,561 37,403 37,249 37,142 37,037 262,000
D 4.2 Sensitivity analysis
Sensitivity analysis
A sensitivity analysis illustrating the effects of the variation of the influencing factors described in D 1.4. is to be enclosed.
Delay of Year IRR with JI IRR without JI
1 9.27% 4.81% Delay of Year NPV with JI NPV without JI
1 556,871.47 -630,932.41
Sensitivity of IRR on Investment
0.0%
2.0%
4.0%
6.0%
8.0%
10.0%
12.0%
14.0%
-10% -5% 0% 5% 10%
Change of Investment Costs
IRR
with JI without JI

Baseline Preparation of the Project Design Document 77 / 111
Sensitivity of NPV on Investment
-1000000
-500000
0
500000
1000000
1500000
-10% -5% 0% 5% 10%
Change of Investment Costs
NPV
with JI without JI
Sensitivity of IRR on Baseload Price Increase
0.0%
2.0%
4.0%
6.0%
8.0%
10.0%
12.0%
-10% -5% 0% 5% 10%
Change of Price increase
IRR
with JI without JI
Sensitivity of NPV on Baseload Price Increase
-1000000
-500000
0
500000
1000000
-10% -5% 0% 5% 10%
Change of Price Increase
NPV
with JI without JI

Baseline Preparation of the Project Design Document 78 / 111
D 4.3 Additionality
Description of how the anthropogenic emissions of GHG by sources are reduced below those that would have occurred in the absence of the project activity
Please explain, how and why this project is additional and therefore not the baseline scenario.
For analysing the additionality of a project please take into account the relevant decisions of the Executive Board23 (e.g. EB 10 Report, Annex 124).
(EB PDD B.4.)
Please refer to B4.1
23 Cp. http://cdm.unfccc.int/EB/. 24 Cp. http://cdm.unfccc.int/EB/Meetings/010/eb10repan1.pdf.

Monitoring Methodology and Plan Preparation of the Project Design Document 79 / 111
E Monitoring Methodology and Plan Emission reductions can only be acknowledged when these are proved by traceable monitoring of the project activities and emissions.
Since the monitoring plan should document the actually achieved emission reductions as well as significant additional ecological, socio-economic and development effects it can only be filled in after the project has already been implemented. No differentiation is made between a JI and CDM project regarding the structure of the monitoring plan. Specific regulations are however applicable to CDM small-scale projects. The EB prepared a monitoring template for small-scale projects (SSC) which is available at http://unfccc.int/cdm/.
The monitoring reports must be delivered by the contractual party to an independent verification entity (IE or OE) at regular intervals. This entity examines the reports. Monitoring data must be kept for at least 2 years after the end of the crediting period or the last transfer of ERUs or CERs.
Details of theoretical fundamentals of the monitoring are described in part 1 of the guide.
The monitoring plan encompasses the following five areas:
1. development of the monitoring plan and methodology,
2. organisation and procedures of monitoring regarding the calculation of ERUs/CERs,
3. review of significant additional ecological, socio-economic and development effects of the project,
4. quality assurance,
5. responsibilities.

Monitoring Methodology and Plan Preparation of the Project Design Document 80 / 111
E 1 DEVELOPMENT AND METHODOLOGY
E 1.1 Details of monitoring plan development
Name and address of person/entity determining the monitoring methodology
Please provide contact information and indicate if the person/entity is also a project participant.
(EB PDD D.7.)
The Monitoring Plan is part of the Project Design Document (PDD) and is based on the methodology and results of the Baseline Study. It defines the ongoing process which will be used to collect, analyse and verify the data and calculations used to determine the qualifying ERs that can be sold in each year covered by the Emission Reduction Purchase Agreement (ERPA) between PA and KPC.
KWI Management, Consultants & Auditors GmbH
Burggasse 116
A-1070 Wien
Contact Persons:
Manfred Stockmayer ([email protected])
Martin Hammer ([email protected])
KWI Management Consultants & Auditors GmbH participate the project as JI consultant.
Date of completing the final draft of the monitoring plan (DD/MM/YYYY)
28/06/2004
The following description and substantiation of the monitoring methods used is mandatory for CDM projects. Authorised methods are available at http://unfccc.int/cdm/. New methods are to be substantiated and submitted to the EB for appraisal (in the case of CDM projects).
E 1.2 Approved methodology
n/a
Name and reference of approved methodology applied to the project activity
If a national or international monitoring standard has to be applied to monitor certain aspects of the project activity, please identify this standard and provide a reference to the source where a detailed description of the

Monitoring Methodology and Plan Preparation of the Project Design Document 81 / 111
standard can be found.
(EB PDD D.1.)
Justification of the choice of the methodology and why it is applicable to the project activity
(EB PDD D.2.)

Monitoring Methodology and Plan Preparation of the Project Design Document 82 / 111
E 2 CALCULATION OF ERUS OR CERS In order to determine the actual emission reductions generated by the project the monitoring plan is based on the baseline study.
Project emissions
E 2.1 Data relevant for monitoring project emissions
(EB PDD D.3.)
E01
ID number
Please use numbers to ease cross-referencing.
E01
Data type Number
Data variable Quantity of produced biogas
Data unit m³
Data quality
Measurement
X Yes: The biogas production is metered with meters that comply with international standards. (State how the measurement is performed and the data quality ensured.)
⃝ No
Calculation
⃝ Yes: _____________________________________________________ (State how the calculation is performed.)
⃝ No
Estimate
⃝ Yes: ______________________________________________________ (State which assumptions the estimate is based on and how it is performed.)
⃝ No
Recording frequency Continuously
Proportion of data to be monitored
100%
Emission Reductions = (Baseline Emissions) ─ (Project Emissions)

Monitoring Methodology and Plan Preparation of the Project Design Document 83 / 111
How will the data be archived? X Electronic
X In paper form
For how long is archived data to be kept?
Until 2014
Comment
The table is to be filled in separately for each data type and should therefore be copied as often as required.
E 2.2 Data relevant for monitoring leakage
(EB PDD D.4.)
n/a
ID number
Please use numbers to ease cross-referencing.
Data type
Data variable
Data unit
Data quality
Measurement
⃝ Yes: _____________________________________________________ (State how the measurement is performed and the data quality ensured.)
⃝ No
Calculation
⃝ Yes: _____________________________________________________ (State how the calculation is performed.)
⃝ No
Estimate
⃝ Yes: ______________________________________________________ (State which assumptions the estimate is based on and how it is performed.)
⃝ No
Recording frequency
Proportion of data to be monitored

Monitoring Methodology and Plan Preparation of the Project Design Document 84 / 111
How will the data be archived? ⃝ Electronic
⃝ In paper form
For how long is archived data to be kept?
Comment
The table is to be filled in separately for each data type and should therefore be copied as often as required.
Baseline emissions
Depending on the methodology used to determine the baseline the following tables may need to be filled in.
E 2.3 Data relevant for monitoring baseline emissions
(EB PDD D.5.)
A01
ID number
Please use numbers to ease cross-referencing.
A01
Data type Number
Data variable Annual electric power production of the biogas engines
Data unit MWh
Data quality
(If no data will be collected on this item, please explain the reason.)
Measurement
X Yes: The electricity that is fed into the Hungarian grid will be measured with meters that comply with international standards. (State how the measurement is performed and the data quality ensured.)
⃝ No
Calculation
⃝ Yes: _____________________________________________________ (State how the calculation is performed.)
X No
Estimate
⃝ Yes: ______________________________________________________

Monitoring Methodology and Plan Preparation of the Project Design Document 85 / 111
(State which assumptions the estimate is based on and how it is performed.)
X No
Recording frequency Continuously
Proportion of data to be monitored
100%
How is data archived? X Electronic
X In paper form
For how long is data archived to be kept?
Until 2014
Comment
E 2.3 Data relevant for monitoring baseline emissions
(EB PDD D.5.)
A02
ID number
Please use numbers to ease cross-referencing.
A02
Data type Number
Data variable Electricity own demand of the biogas plant
Data unit MWh
Data quality
(If no data will be collected on this item, please explain the reason.)
Measurement
X Yes: The electricity that delivered to the biogas plant will be measured with meters that comply with international standards. (State how the measurement is performed and the data quality ensured.)
⃝ No
Calculation
⃝ Yes: _____________________________________________________ (State how the calculation is performed.)
X No
Estimate
⃝ Yes: ______________________________________________________ (State which assumptions the estimate is based on and how it is

Monitoring Methodology and Plan Preparation of the Project Design Document 86 / 111
performed.)
X No
Recording frequency Continuously
Proportion of data to be monitored
100%
How is data archived? X Electronic
X In paper form
For how long is data archived to be kept?
Until 2014
Comment
E 2.3 Data relevant for monitoring baseline emissions
(EB PDD D.5.)
B01
ID number
Please use numbers to ease cross-referencing.
B01
Data type Number
Data variable Livestock number (diary cattle) at PA
Data unit -
Data quality
(If no data will be collected on this item, please explain the reason.)
Measurement
⃝ Yes: (State how the measurement is performed and the data quality ensured.)
X No
Calculation
X Yes: PA keeps an account of its number of different livestock. Leavings and accesses are counted daily. Previous livestock plus accesses minus leavings equals to the current number of livestock. (State how the calculation is performed.)
⃝ No
Estimate
⃝ Yes: ______________________________________________________ (State which assumptions the estimate is based on and how it is

Monitoring Methodology and Plan Preparation of the Project Design Document 87 / 111
performed.)
X No
Recording frequency Daily
Proportion of data to be monitored
100%
How is data archived? X Electronic
X In paper form
For how long is data archived to be kept?
Until 2014
Comment
E 2.3 Data relevant for monitoring baseline emissions
(EB PDD D.5.)
B02
ID number
Please use numbers to ease cross-referencing.
B02
Data type Number
Data variable Livestock number (non diary cattle) at PA
Data unit -
Data quality
(If no data will be collected on this item, please explain the reason.)
Measurement
⃝ Yes: (State how the measurement is performed and the data quality ensured.)
X No
Calculation
X Yes: PA keeps an account of its number of different livestock. Leavings and accesses are counted daily. Previous livestock plus accesses minus leavings equals to the current number of livestock. (State how the calculation is performed.)
⃝ No
Estimate
⃝ Yes: ______________________________________________________

Monitoring Methodology and Plan Preparation of the Project Design Document 88 / 111
(State which assumptions the estimate is based on and how it is performed.)
X No
Recording frequency Daily
Proportion of data to be monitored
100%
How is data archived? X Electronic
X In paper form
For how long is data archived to be kept?
Until 2014
Comment
E 2.3 Data relevant for monitoring baseline emissions
(EB PDD D.5.)
B03
ID number
Please use numbers to ease cross-referencing.
B03
Data type Number
Data variable Livestock number (pigs) at PA
Data unit -
Data quality
(If no data will be collected on this item, please explain the reason.)
Measurement
⃝ Yes: (State how the measurement is performed and the data quality ensured.)
X No
Calculation
X Yes: PA keeps an account of its number of different livestock. Leavings and accesses are counted daily. Previous livestock plus accesses minus leavings equals to the current number of livestock. (State how the calculation is performed.)
⃝ No
Estimate

Monitoring Methodology and Plan Preparation of the Project Design Document 89 / 111
⃝ Yes: ______________________________________________________ (State which assumptions the estimate is based on and how it is performed.)
X No
Recording frequency Daily
Proportion of data to be monitored
100%
How is data archived? X Electronic
X In paper form
For how long is data archived to be kept?
Until 2014
Comment
E 2.3 Data relevant for monitoring baseline emissions
(EB PDD D.5.)
B04
ID number
Please use numbers to ease cross-referencing.
B04
Data type Number
Data variable Livestock number (pigs) at Adonyhús
Data unit -
Data quality
(If no data will be collected on this item, please explain the reason.)
Measurement
⃝ Yes: (State how the measurement is performed and the data quality ensured.)
X No
Calculation
X Yes: Adonyhús keeps an account of its number of different livestock. Leavings and accesses are counted daily. Previous livestock plus accesses minus leavings equals to the current number of livestock. (State how the calculation is performed.)
⃝ No

Monitoring Methodology and Plan Preparation of the Project Design Document 90 / 111
Estimate
⃝ Yes: ______________________________________________________ (State which assumptions the estimate is based on and how it is performed.)
X No
Recording frequency Daily
Proportion of data to be monitored
100%
How is data archived? X Electronic
X In paper form
For how long is data archived to be kept?
Until 2014
Comment
E 2.3 Data relevant for monitoring baseline emissions
(EB PDD D.5.)
B05
ID number
Please use numbers to ease cross-referencing.
B05
Data type Number
Data variable Litter used at Hangos
Data unit -
Data quality
(If no data will be collected on this item, please explain the reason.)
Measurement
⃝ Yes: (State how the measurement is performed and the data quality ensured.)
X No
Calculation
X Yes: PA keeps an account of its stock of litter. Leavings and accesses are counted. Summarizing leavings of one year equals to the annual litter demand. (State how the calculation is performed.)
⃝ No

Monitoring Methodology and Plan Preparation of the Project Design Document 91 / 111
Estimate
⃝ Yes: ______________________________________________________ (State which assumptions the estimate is based on and how it is performed.)
X No
Recording frequency Daily
Proportion of data to be monitored
100%
How is data archived? X Electronic
X In paper form
For how long is data archived to be kept?
Until 2014
Comment
E 2.3 Data relevant for monitoring baseline emissions
(EB PDD D.5.)
B06
ID number
Please use numbers to ease cross-referencing.
B06
Data type Number
Data variable Litter used at Parrag
Data unit -
Data quality
(If no data will be collected on this item, please explain the reason.)
Measurement
⃝ Yes: (State how the measurement is performed and the data quality ensured.)
X No
Calculation
X Yes: PA keeps an account of its stock of litter. Leavings and accesses are counted. Summarizing leavings of one year equals to the annual litter demand. (State how the calculation is performed.)
⃝ No

Monitoring Methodology and Plan Preparation of the Project Design Document 92 / 111
Estimate
⃝ Yes: ______________________________________________________ (State which assumptions the estimate is based on and how it is performed.)
X No
Recording frequency Daily
Proportion of data to be monitored
100%
How is data archived? X Electronic
X In paper form
For how long is data archived to be kept?
Until 2014
Comment
E 2.3 Data relevant for monitoring baseline emissions
(EB PDD D.5.)
C01
ID number
Please use numbers to ease cross-referencing.
C01
Data type Number
Data variable Heat delivery 60°C
Data unit kWh
Data quality
(If no data will be collected on this item, please explain the reason.)
Measurement
X Yes: The heat that delivered to washing machines will be measured with meters that comply with international standards. (State how the measurement is performed and the data quality ensured.)
⃝ No
Calculation
⃝ Yes: _____________________________________________________ (State how the calculation is performed.)
X No

Monitoring Methodology and Plan Preparation of the Project Design Document 93 / 111
Estimate
⃝ Yes: ______________________________________________________ (State which assumptions the estimate is based on and how it is performed.)
X No
Recording frequency Continuously
Proportion of data to be monitored
100%
How is data archived? X Electronic
X In paper form
For how long is data archived to be kept?
Until 2014
Comment
E 2.3 Data relevant for monitoring baseline emissions
(EB PDD D.5.)
C02
ID number
Please use numbers to ease cross-referencing.
C02
Data type Number
Data variable Heat delivery 85°C
Data unit kWh
Data quality
(If no data will be collected on this item, please explain the reason.)
Measurement
X Yes: The heat that delivered to washing machines will be measured with meters that comply with international standards. (State how the measurement is performed and the data quality ensured.)
⃝ No
Calculation
⃝ Yes: _____________________________________________________ (State how the calculation is performed.)
X No
Estimate

Monitoring Methodology and Plan Preparation of the Project Design Document 94 / 111
⃝ Yes: ______________________________________________________ (State which assumptions the estimate is based on and how it is performed.)
X No
Recording frequency Continuously
Proportion of data to be monitored
100%
How is data archived? X Electronic
X In paper form
For how long is data archived to be kept?
Until 2014
Comment
E 2.3 Data relevant for monitoring baseline emissions
(EB PDD D.5.)
D01
ID number
Please use numbers to ease cross-referencing.
D01
Data type Number
Data variable Take off from storage 1 of digested substrate
Data unit m³
Data quality
(If no data will be collected on this item, please explain the reason.)
Measurement
X Yes: The substrate that will be taken off from the storages will be metered in m³ with flow meters that comply with international standards. (State how the measurement is performed and the data quality ensured.)
⃝ No
Calculation
⃝ Yes: _____________________________________________________ (State how the calculation is performed.)
X No
Estimate

Monitoring Methodology and Plan Preparation of the Project Design Document 95 / 111
⃝ Yes: ______________________________________________________ (State which assumptions the estimate is based on and how it is performed.)
X No
Recording frequency Continuously
Proportion of data to be monitored
100%
How is data archived? X Electronic
X In paper form
For how long is data archived to be kept?
Until 2014
Comment
E 2.3 Data relevant for monitoring baseline emissions
(EB PDD D.5.)
D02
ID number
Please use numbers to ease cross-referencing.
D02
Data type Number
Data variable Take off from storage 2 of digested substrate
Data unit m³
Data quality
(If no data will be collected on this item, please explain the reason.)
Measurement
X Yes: The substrate that will be taken off from the storages will be metered in m³ with flow meters that comply with international standards. (State how the measurement is performed and the data quality ensured.)
⃝ No
Calculation
⃝ Yes: _____________________________________________________ (State how the calculation is performed.)
X No
Estimate

Monitoring Methodology and Plan Preparation of the Project Design Document 96 / 111
⃝ Yes: ______________________________________________________ (State which assumptions the estimate is based on and how it is performed.)
X No
Recording frequency Continuously
Proportion of data to be monitored
100%
How is data archived? X Electronic
X In paper form
For how long is data archived to be kept?
Until 2014
Comment
E 2.3 Data relevant for monitoring baseline emissions
(EB PDD D.5.)
D03
ID number
Please use numbers to ease cross-referencing.
D03
Data type Number
Data variable Take off from storage 3 of digested substrate
Data unit m³
Data quality
(If no data will be collected on this item, please explain the reason.)
Measurement
X Yes: The substrate that will be taken off from the storages will be metered in m³ with flow meters that comply with international standards. (State how the measurement is performed and the data quality ensured.)
⃝ No
Calculation
⃝ Yes: _____________________________________________________ (State how the calculation is performed.)
X No
Estimate

Monitoring Methodology and Plan Preparation of the Project Design Document 97 / 111
⃝ Yes: ______________________________________________________ (State which assumptions the estimate is based on and how it is performed.)
X No
Recording frequency Continously
Proportion of data to be monitored
100%
How is data archived? X Electronic
X In paper form
For how long is data archived to be kept?
Until 2014
Comment
The table is to be filled in separately for each data type and should therefore be copied as often as required.
E 2.4 Data relevant for monitoring leakage
n/a
ID number
Please use numbers to ease cross-referencing.
Data type
Data variable
Data unit
Data quality
(If no data will be collected on this item, please explain the reason.)
Measurement
⃝ Yes: _____________________________________________________ (State how the measurement is performed and the data quality ensured.)
⃝ No
Calculation
⃝ Yes: _____________________________________________________ (State how the calculation is performed.)
⃝ No
Estimate

Monitoring Methodology and Plan Preparation of the Project Design Document 98 / 111
⃝ Yes: ______________________________________________________ (State which assumptions the estimate is based on and how it is performed.)
⃝ No
Recording frequency
Proportion of data to be monitored
How will the data be archived? ⃝ Electronic
⃝ In paper form
For how long is archived data to be kept?
Comment
The table is to be filled in separately for each data type and should therefore be copied as often as required.

Monitoring Methodology and Plan Preparation of the Project Design Document 99 / 111
Emission reductions
E 2.5 Emission reductions
Calculation of emission reductions
The Monitoring Plan is based on the methodology and results of the Baseline Study.
Therefore please refer to Chapter D.

Monitoring Methodology and Plan Preparation of the Project Design Document 100 / 111
E 3 ECOLOGICAL, SOCIO-ECONOMIC AND DEVELOPMENT EFFECTS A monitoring plan is to be created for major ecological, socio-economic and development effects of the project. If applicable, the following table shall be used.
E 3.1 Data relevant for monitoring ecological, socio-economic and development effects of the project
ID number Please use numbers to ease cross-referencing.
In order to monitor the socio economic effects of the project, the Monitoring Plan foresees the recording of following data that have to be reported in each Monitoring Report.
ID Nr PDD
Number of employes F01
New created jobs compared to the previous year (high qualified)
F02
New created jobs compared to the previous year (low qualified)
F03
Number of men (upper management)
F04
Number of women (upper management)
F05
Number of men (middle management)
F06
Number of women (middle management)
F07
Data type Numbers
Data variable Number of employees; New created jobs compared to the previous year (high qualified); New created jobs compared to the previous year (low qualified); Number of men (upper management); Number of women (upper management); Number of men (middle management); Number of women (middle management)
Data unit None
Data quality Measurement
⃝ Yes: _____________________________________________________ (State how the measurement is performed and the data quality ensured.)
⃝ No
Calculation
⃝ Yes: _____________________________________________________ (State how the calculation is performed.)

Monitoring Methodology and Plan Preparation of the Project Design Document 101 / 111
⃝ No
Estimate
⃝ Yes: ______________________________________________________ (State which assumptions the estimate is based on and how it is performed.)
⃝ No
Recording frequency Annually
Proportion of data to be monitored
100 %
The table is to be filled in separately for each data type and should therefore be copied as often as required. Examples of data relating to particular environmental media and socio-economic and development aspects are included in the appendix.

Monitoring Methodology and Plan Preparation of the Project Design Document 102 / 111
E 4 PROCESS, QUALITY AND SELF-CHECKING The entire process of data acquisition and processing must be documented. In addition a system for information procurement and processing and quality control must be established. Furthermore, the monitoring should be capable of self-checking using plausibility checks.
E 4.1 Procedures
Data
Please indicate table and ID number.
(EB PDD D.6.)
A01, A02, B01 – B06, C01,C02, D01- D03, E01
Data acquisition (including measuring methods)
The collection and archiving of all relevant data is arranged and specified in the Monitoring Plan, the responsible persons are named (Cahpter E5).
Data are obtained from the metering system of the power plants, using methods according to international standards.
How is the data transmitted? Data is transmitted via email and written documents.
Uncertainty level of data (high/medium/low)
(EB PDD D.6.)
low
Are quality assurance/quality control procedures planned for these data?
Please add an explanation.
(EB PDD D.6.)
X Yes: Regular intervals of calibrating meters according to international standards. Livestock data is regularly checked.
⃝ No: ______________________________________________________
Measures for quality assurance
Checking of data for consistency, completeness and correctness
PA is responsible for checking of data for consistency, completeness and correctness.
How are errors during data acquisition dealt with?
Errors identified and corrective measurements are documented in special reports and added to the annual reports.

Monitoring Methodology and Plan Preparation of the Project Design Document 103 / 111
E 5 RESPONSIBILITIES
E 5.1 Responsibilities
Technical responsibility Contact person: Tibor Szárszó
Address: 2407 Dunaújváros, Pálhalma
Phone/fax: +36 25 531
E-mail:
Commercial responsibility Contact person: Gabor Hetyei (Financial Director)
Address: 2407 Dunaújváros, Pálhalma
Phone/fax: +36 25 531
E-mail:
Responsibility for data acquisition Contact person: Gabor Hetyei (Financial Director)
Address: 2407 Dunaújváros, Pálhalma
Phone/fax: +36 25 531
E-mail:
Responsibility for calculation of emission reductions
Contact person: Gabor Hetyei (Financial Director)
Address: 2407 Dunaújváros, Pálhalma
Phone/fax: +36 25 531
E-mail:
Responsibility for monitoring supervision
Contact person: Gabor Hetyei (Financial Director)
Address: 2407 Dunaújváros, Pálhalma
Phone/fax: +36 25 531
E-mail:

Appendix Preparation of the Project Design Document 104 / 111
III. Appendix
A Monitoring Data Examples regarding Ecological, Socio-Economic and Development Effects
Ecological Effects
Water
Ap A 1 Effects on the medium water
Abstraction of ground water Abstraction: __________________________________________________ m³/week
Abstraction of surface water River
Abstraction: _________________________________________________ m³/second
Mean low water: _____________________________________________ m³/second
Lake
Abstraction: _________________________________________________ m³/second
Regeneration of water (inflow ): _________________________________ m³/second
Pollution of surface water Before discharge of effluents
Water quality according to biological water organisms: ___________________________________________________________________ (Please refer to your country specific regulations.)
Oxygen content in the water: ________________________________________ mg/l
Ammonia concentration: ______________________________________ mg/l NH4-N
After discharge of effluents
Water quality according to biological water organisms: ___________________________________________________________________ (Please refer to your country specific regulations.)
Oxygen content of the water: ________________________________________ mg/l
Ammonia concentration: ______________________________________ mg/l NH4-N
Average temperature increase in the receiving water body: __________________ °C
Further particular effects within the framework of the local conditions

Appendix Preparation of the Project Design Document 105 / 111

Appendix Preparation of the Project Design Document 106 / 111
Air
Ap A 2 Effects on the medium air
Emissions SO2: _________________________________________________________ mg/ m3
NOx: _________________________________________________________ mg/ m3
Dust: ________________________________________________________ mg/ m3
Organ. C : ____________________________________________________ mg/ m3
HCl: _________________________________________________________ mg/ m3
Dioxins and furans: _____________________________________________ mg/ m3
Hg: __________________________________________________________ mg/ m3
Other: _______________________________________________________ mg/ m3
Further particular effects within the framework of the local conditions
Land
Ap A 3 Land use
Land use ______________________________ m2
Effects caused by the project Erosion: ____________________________________________________
Landslip: ___________________________________________________
Other: _____________________________________________________
Biodiversity
Ap A 4 Effects on biodiversity
Diversity of flora
Local fauna

Appendix Preparation of the Project Design Document 107 / 111
Waste
Ap A 5 Waste
Amounts of non hazardous wastes and details of treatment
Amounts of hazardous wastes and details of treatment
Other project influences on the occurrence of wastes
Socio-Economic and Development Effects
Ap A 6 Job creation
Creation of new jobs through the project
Number of highly qualified jobs: _____________________________________
Number of low qualified jobs: ______________________________________
Ap A 7 Social security
Social security of workforce
Ap A 8 Gender equality
Equal Opportunities Middle Management
Number of women: _______________________________________________
Number of men: _________________________________________________
Upper Management
Number of women: _______________________________________________
Number of men: _________________________________________________

Appendix Preparation of the Project Design Document 108 / 111
Sustainability
Ap A 9 Sustainability
Contribution of the project to the sustainable development of the host country

Appendix Preparation of the Project Design Document 109 / 111
B Comparison of the EB PDD (Version 01) and the PDD of the Austrian JI/CDM Programme
The Executive Board PDD is not as comprehensive as the PDD of the Austrian JI/CDM Programme. Since for CDM projects the EB PDD is to be filled additionally, the following table illustrates where information is already contained in the Austrian PDD to facilitate filling in of the EB PDD.
Executive Board PDD (Version 01) Austrian JI/CDM Programme PDD
A. General description of project activity
A.1. Title of the project activity A 1
A.2. Description of the project activity A 2.1, B 4.2
A.3. Project participants A 3
A.4. Technical description of the project activity
A.4.1. Location of the project activity
A.4.2. Category(ies) of project activity
A.4.3. Technology to be employed by project activity
A.4.4. Brief explanation of how the emissions by sources are to be reduced
A.4.5. Public funding of the project activity
A 4.1, A 4.2
A 2.2
A 6.1, B 4.2
B 4.1
A 7.1
B. Baseline methodology
B.1. Title and reference of the methodology D 3.1
B.2. Justification of the choice D 3.1
B.3. Description of how the methodology is applied D 3.1
B.4. Description of how emissions are reduced below those that would have occurred in the absence of the project activity
D 4.3
B.5. Application of the project boundary to the project activity D 1.3
B.6. Details of baseline development D 1.1
C. Duration of the project activity/crediting period
C.1. Duration of the project activity
C.1.1. Starting date of project activity
C.1.2. Expected operational lifetime of the project activity
A 5.1
A 5.1
A 5.1
C.2. Choice of the crediting period
C.2.1. Renewable crediting period
C.2.2. Fixed crediting period
A 5.2
A 5.2
A 5.2
D. Monitoring methodology and plan
D.1. Name and reference of approved methodology E 1.2
D.2. Justification of the choice of the methodology E 1.2

Appendix Preparation of the Project Design Document 110 / 111
D.3. Data to be collected to monitor emissions from the project activity E 2.1
D.4. Potential sources of emissions which are attributable to the project activity, but not included in the project boundary
E 2.2
D.5. Relevant data necessary for determining the baseline of emissions within the project boundary
E 2.3
D.6. Quality control (QC) and quality assurance (QA) procedures E 4.1
D.7. Name of person/entity determining the monitoring methodology E 1.1
E. Calculation of GHG emissions by sources
E.1. Description of formulae used to estimate emissions within the project boundary
D 2.3
E.2. Description of formulae used to estimate leakage D 2.4
E.3. The sum of E.1. and E.2. D 2.5
E.4. Description of formulae used to estimate baseline emissions D 3.7
E.5. Difference between E.3. and E.4. (Emission reductions) D 4.1
E.6. Table providing values obtained when applying formulae above D 2.3, D 2.4, D 2.5, D 3.7, D 3.9, D 4.1
F. Environmental impacts
F.1. Analysis of the environmental impacts (including transboundary impacts) B
F.2. Conclusions and references regarding environmental impacts B
G. Stakeholder comments
G.1. Brief description of the process on how comments by local stakeholders have been invited and compiled
C 2
G.2. Summary of the comments received C 2
G.3. Report on how due account was taken of any comments received C 2

Appendix Preparation of the Project Design Document 111 / 111
C Emission Factors The following CO2 emission factors for particular fuels originate from the IPCC (International Panel on Climate Change) 1996 'Revised Guidelines for National Greenhouse Gas Inventories' (www.ipcc.ch/pub/guide.htm).
Fuel Net caloric value (TJ/1000 t)25
Carbon content (tC/TJ)
CO2eq share26) (tCO2eq/TJ)
Primary fuels
Anthracite a) 26.8 98.27
Other Bituminous Coal a) 25.8 94.60
Coking Coal a) 25.8 94.60
Sub-bituminous Coal a) 26.2 96.07
Lignite a) 27.6 101.40
Oil Shale 9.40 29.1 106.70
Peat --- 28.9 105.97
Crude Oil a) 20.0 73.33
Natural Gas --- 15.3 56.10
Methane --- (15.0) 55.00
Secondary fuels
Gasoline 44.80 18.9 69.30
Gas/Diesel 43.33 20.2 74.07
Jet Kerosene 44.59 19.5 71.50
Other Kerosene 44.75 19.6 71.87
Residual Fuel Oil 40.19 21.1 77.37
Liquefied Petroleum Gas 47.31 17.2 63.07
Bitumen 40.19 22.0 80.67
Lubricants 40.19 20.0 73.33
Petroleum Coke 31.00 27.5 100.83
Coke Oven/Gas Coke --- 29.5 108.17
Coke Oven Gas --- 13.0 47.67
Blast Furnace Gas --- 66.0 242.00
Tabelle 1: Emission factors 25 a): country specific data in the 'Revised IPCC Guidelines for National GHG Inventories (1996)’. 26 Conversion coefficient: 1 t C = 44/12 t CO2.