angostura reservoir - bureau of reclamation reservoir 1979 sedimentation survey by joe m. lara...
TRANSCRIPT
75k)/2 7t/
ANGOSTURARESERVOIR
1979 Sedimentation Survey
U.S. Department of the InteriorBureau of Recjamation
7-2090 (4-81)Bureau oe Reclamalion TECHNICAL REPORT STANDARD TITLE PAGE
1. REPORT NO. 2. OOVtRKMN1' .'CCS1ON NO. 3. RECIPIENT'S CATALOG NO.
4. TITLE AND SUBTITLE 5. REPORT DATE
Angostura Reservoir - 1979 Sedimentation Survey August 19836. PERFORMING ORGANIZATION CODE
7. AUTHOR(S) 8. PERFORMING ORGANIZATION
Joe M. LaraREPORT NO.
9. PERFORMING ORGANIZATION NAME AND ADDRESS 10. WORK UNIT NO.
Bureau of ReclamationEngineering and Research Center
Ii. CONTRACT OR GRANT NO.
Denver Colorado,13. TYPE OF REPORT AND PERIOD
COVERED12. SPONSORING AGENCY NAME AND ADDRESS
S anie14. SPONSORING AGENCY CODE
__________________________________________________ DI BR15. SUPPLEMENTARY NOTES
Microfiche and/or hard copy available at the Engineering and ResearchCenter, Denver, CO
Ed: RDM16. ABSTRACT
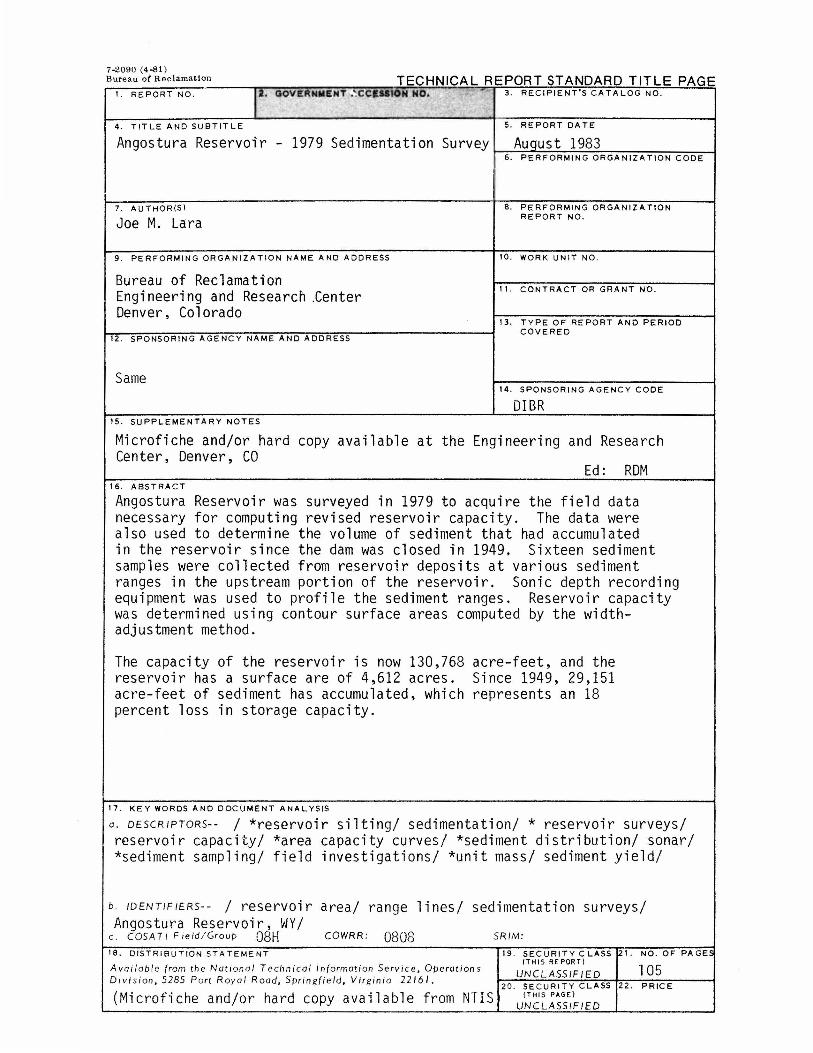
Angostura Reservoir was surveyed in 1979 to acquire the field datanecessary for computing revised reservoir capacity. The data werealso used to determine the volume of sediment that had accumulatedin the reservoir since the dam was closed in 1949. Sixteen sedimentsamples were collected from reservoir deposits at various sedimentranges in the upstream portion of the reservoir. Sonic depth recordingequipment was used to profile the sediment ranges. Reservoir capacitywas determined using contour surface areas computed by the width-adjustment method.
The capacity of the reservoir is now 130,768 acre-feet, and thereservoir has a surface are of 4,612 acres. Since 1949, 29,151acre-feet of sediment has accumulated, which represents an 18percent loss in storage capacity.
17. KEY WORDS AND DOCUMENT ANALYSIS
a. DESCRIPTORS-- / *reservoir silting! sedimentation! * reservoir surveys!reservoir capacity! *area capacity curves! *sediment distribution! sonar!*sedjment sampling! field investigations! *unit mass! sediment yield!
b. IDENTIFIERS-- / reservoir area/ range lines! sedimentation surveys!Angostura Reservoir, WY/
c. COSATI Field/Group 08H COWRR; 0808 SR)M:
18. DISTRIBUTION STATEMENT 19, SECURITY CLASS 121. NO. OF PAGE
Available from the National Technical Information Service, Operations5285 P R l R Vi i i 22161Di i d S i ld
UNCLASSIFIED 105oya rg n a .vis on, ort oa , pr ngfie , 20 SECURITY CLASS 22. PRICE
(Microfiche and/or hard copy available from NTIS UNCLASSIFIED

ANGOSTURA RESERVOIR
1979 Sedimentation Survey
by
Joe M. Lara
August 1983
Hydrology Branch
Division of Planning Technical Services
Engineering and Research Center
Denver, Colorado
ACKNOWLEDGEMENTS
The Bureau of Reclamation prepared and published this report.James 0. Blanton, Hydraulic Engineer, Engineering and Research Center,Denver, Colorado, ran the hydrologic survey. Personnel of the Missouri-OaheProjects Office, Huron, South Dakota, ran the required land survey andassisted in running the hydrographic survey and taking the sediment samples.Robert I. Strand, Head, Sedimentation and River Hydraulics Section, Engi-neering and Research Center, was consulted in the sediment engineeringcomputations. Messrs. Strand and Blanton reviewed the report, thedata, and information used in its preparation.
As the Nation's principal conservation agency, the Department of theInterior has responsibility for most of our nationally owned publiclands and natural resources. This includes fostering the wisest use ofour land and water resources, protecting our fish and wildlife, preserv-ing the environmental and cultural values of our national parks andhistorical places, and providing for the enjoyment of life through out-door recreation. The Department assesses our energy and mineralresources and works to assure that their development is in the bestinterests of all our people. The Department also has a major respon-sibility for American Indian reservation communities and for peoplewho live in Island Territories under U.S. Administration.
CONTENTS
...........................
.....................
........................................
............................
.......................................
........................................
....................................
.............................................
............................
....................
...................
...........................
...........
...............................
................
...............
.................
P age
Introduction 1
Summary and conclusions 1
Description of basin 3Drainage area and topography 3Geology 3
Surveys, sampling, and equipment 4History of surveys 4Surveying methods 5Sampling method and equipment 5
Reservoir sediment distribution 5Longitudinal distribution 5Lateral distribution
Sediment analyses 7Sediment accumulation 7Particle size and unit weight analyses 8Reservoir sedimentation summary 8
Degradation below the dam 9
Reservoir area and capacity 9
Bibliography 11
TABLES
Table
1 Sediment distribution computations 122 Summary of 1979 survey results and sediment distri-
bution computations 133 Reservoir sediment data summary 144 Summary of sediment sample analyses for 1979 survey . . 16
FIGURES
1 General plan and sections of dam and spillway 172 ftnthly inflow to Arigostura Reservoir 183 Inflow-duration curve for monthly inflow discharges . . 214 Monthly outflow from Angostura Reservoir 225 End-of-month Angostura Reservoir elevation 256 Reservoir drainage area 28
CONTENTS (Continued)Figure Page
7 Layout of reservoir sedimentation ranges ...... .. 298 Layout of degradation ranges .. .......... .. 309 Sounding boat for hydrographic sur vey ........ .. 31
10 Longitudinal profiles for Cheyenne River ...... .. 3211 Longitudinal profiles for Horsehead Creek ...... .. 3312 Percent depth-percent distance rel ationship for
Cheyenne River above Angostura Dam ........ .. 3413 Percent depth-percent distance rel ationship
for Horsehead Creek above conflu ence ofCheyenne River and Horsehead Creek ........ .. 35
14 Depth-capacity relationship ... .......... .. 3615 Sediment distribution curves .. .......... .. 3716 Stage-duration curve for end-of-month elevations . . . 3817 1949 and 1979 sedimentation range profiles,
Cheyenne River - Range 1 ... .......... .. 3918 1949 and 1979 sedimentation range profiles,
Cheyenne River - Range 2 ... .......... .. 40
19 1949 and 1979 sedimentation range profiles,Cheyenne River - Range 2A ... .......... .. 41
20 1949 and 1979 sedimentation range profiles,Cheyenne River - Range 3 ... .......... .. 42
21 1949 and 1979 sedimentation range profiles,Cheyenne River - Range 3A ... .......... .. 43
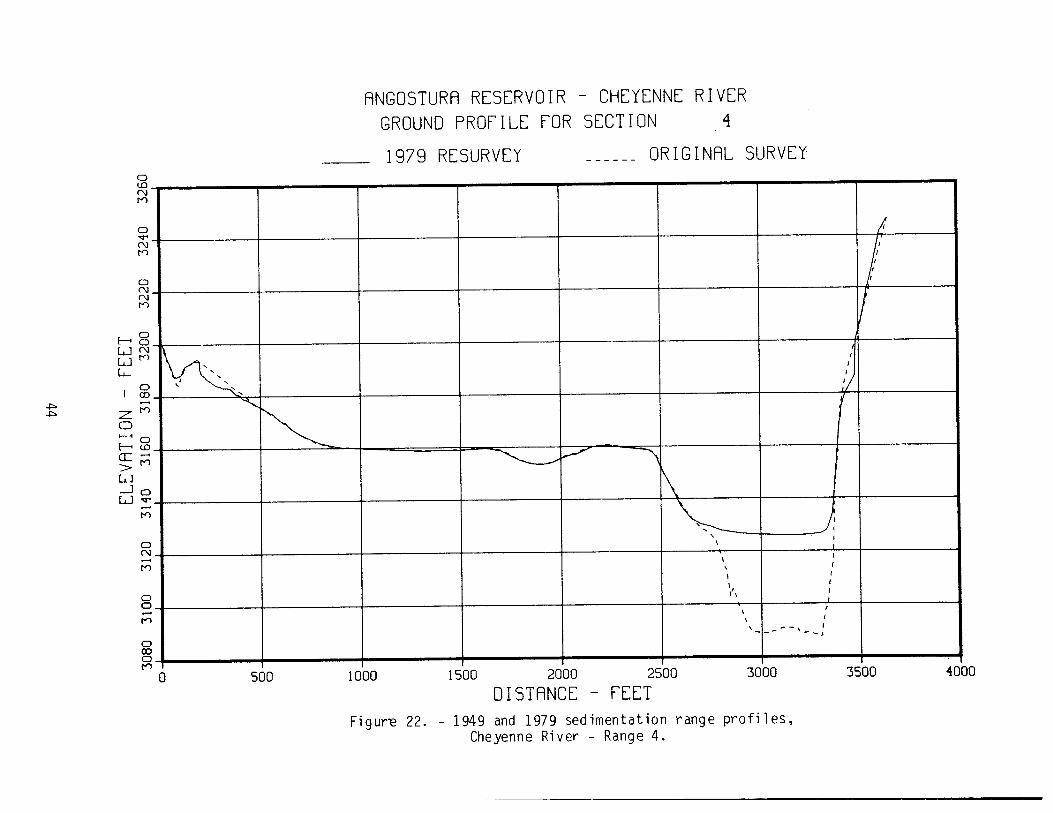
22 1949 and 1979 sedimentation range profiles,Cheyenne River - Range 4 ... .......... .. 44
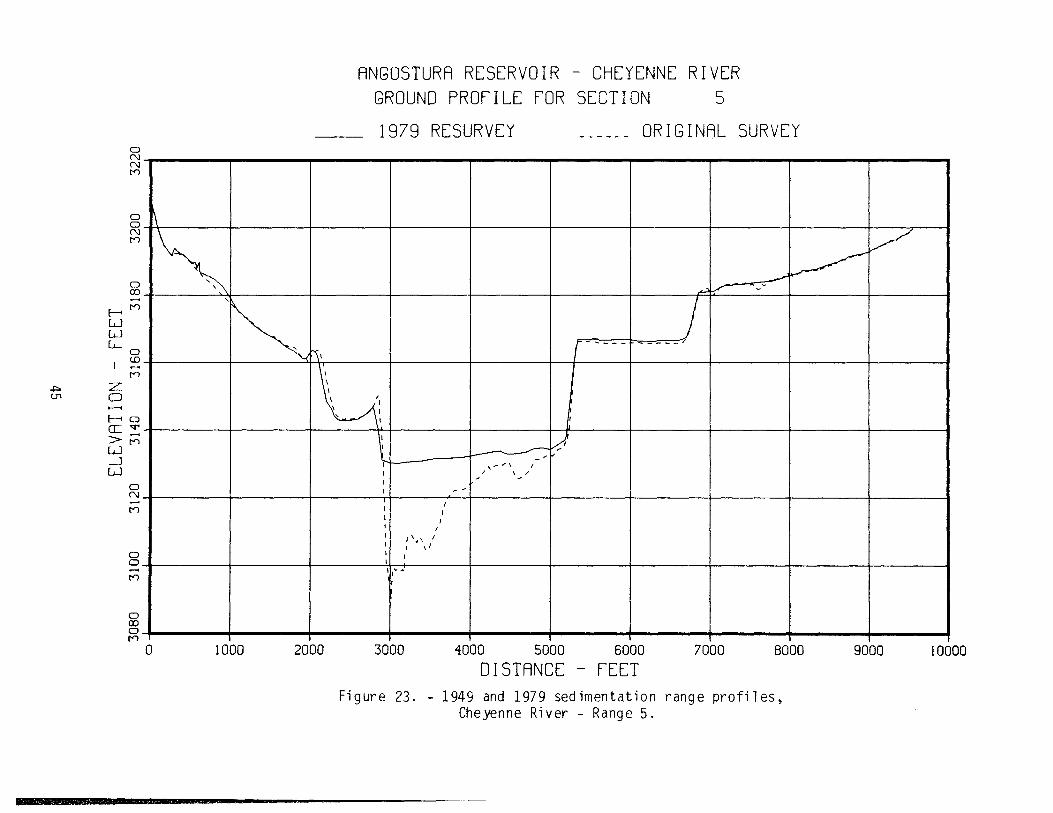
23 1949 and 1979 sedimentation range profiles,Cheyenne River - Range 5 ... .......... .. 45
24 1949 and 1979 sedimentation range profiles,Cheyenne River - Range 6 ... .......... .. 46
25 1949 and 1979 sedimentation range profiles,Cheyenne River - Range 6A ... .......... .. 47
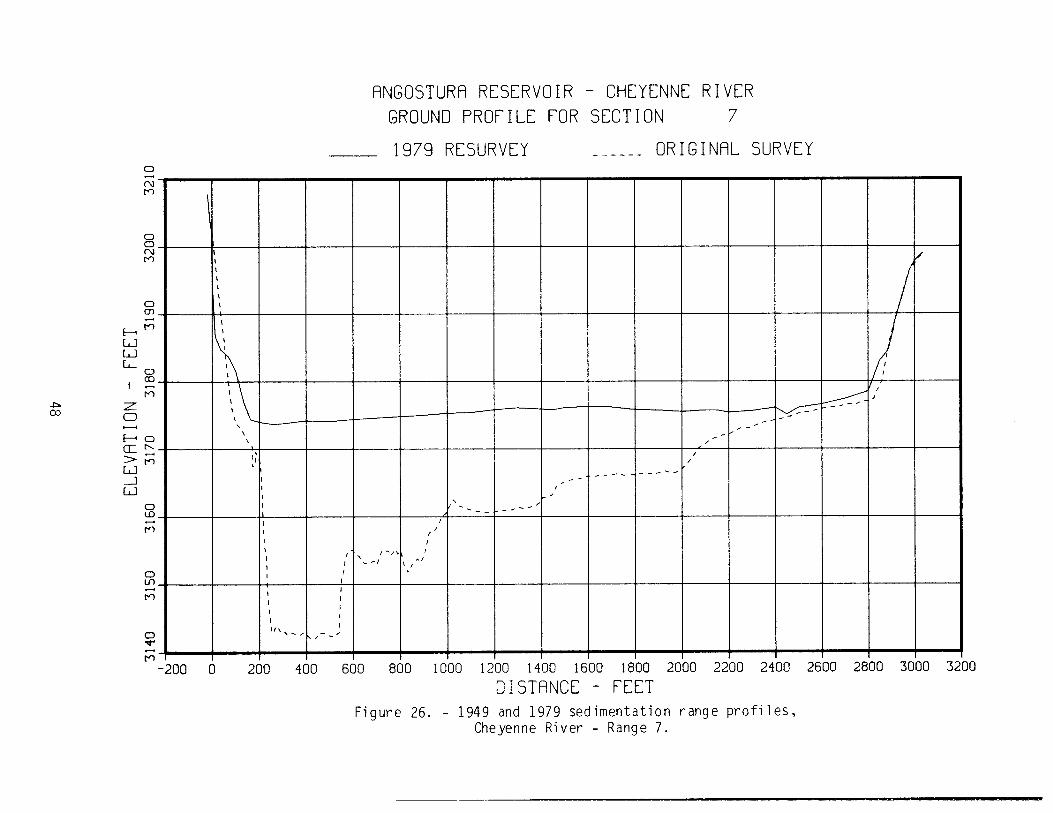
26 1949 and 1979 sedimentation range profiles,Cheyenne River - Range 7 ... .......... .. 48
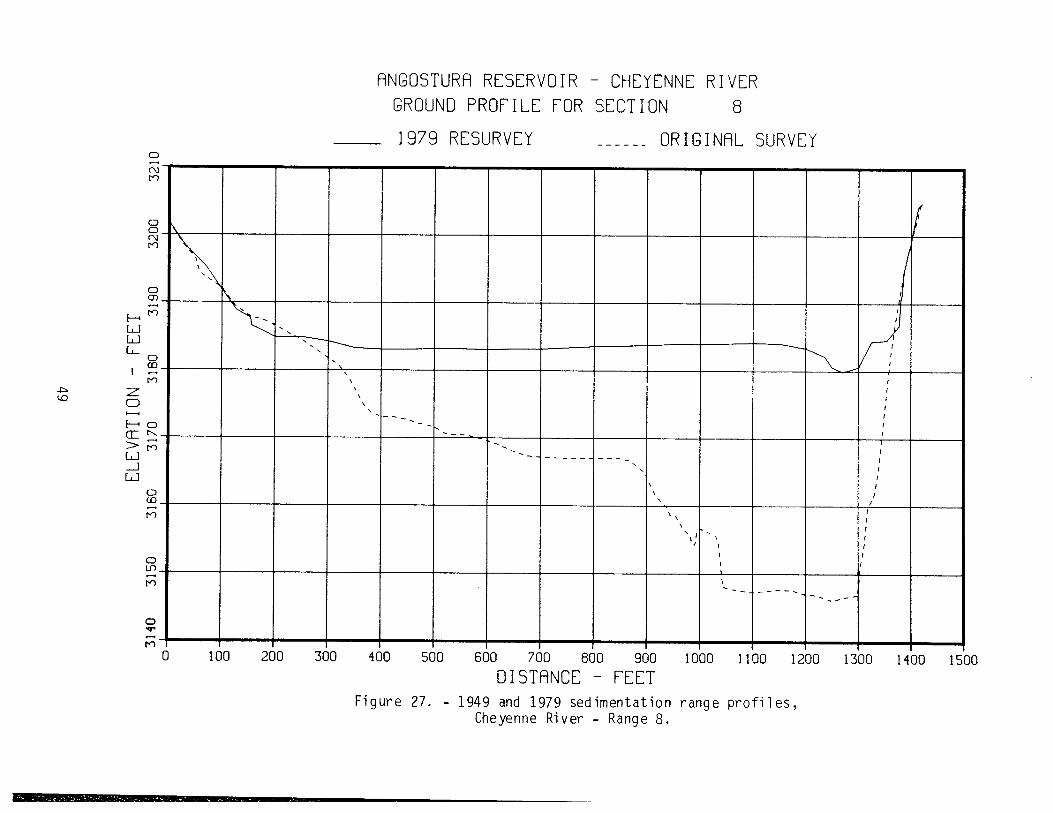
27 1949 and 1979 sedimentation range profiles,Cheyenne River - Range 8 ... .......... .. 49
28 1949 and 1979 sedimentation range profiles,Cheyenne River - Range 9 ... .......... .. 50
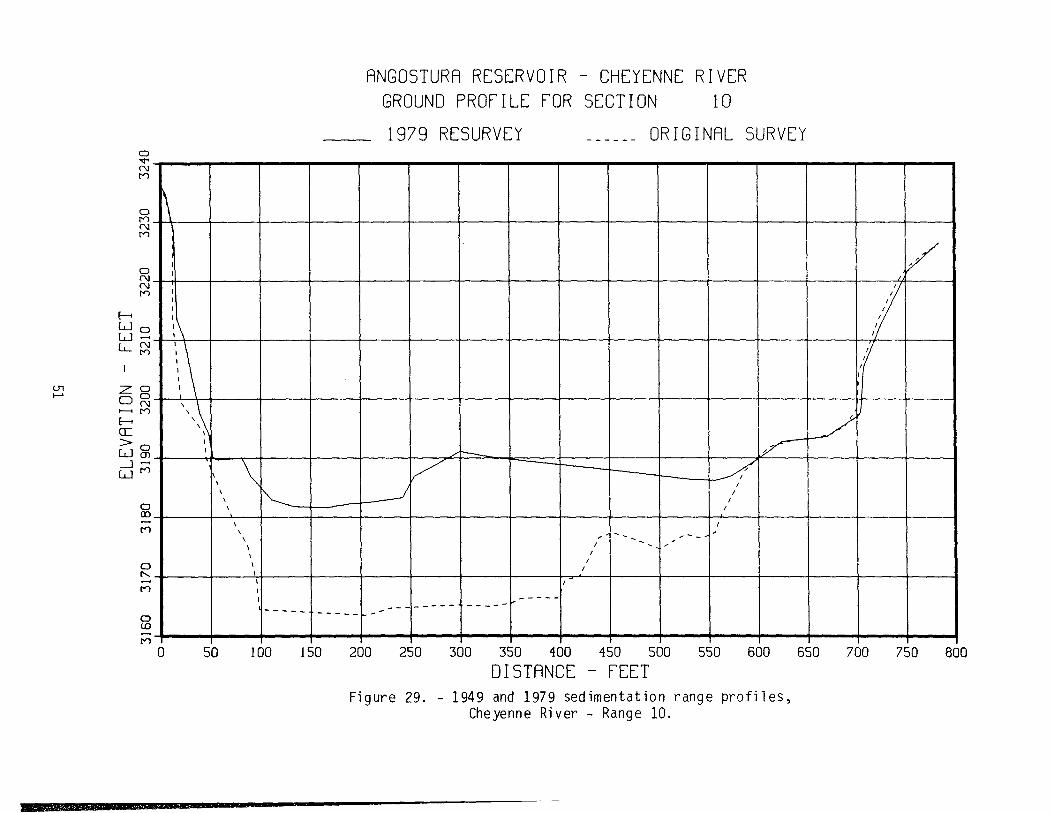
29 1949 and 1979 sedimentation range profiles,Cheyenne River - Range 10 ... .......... .. 51
30 1949 and 1979 sedimentation range profiles,Cheyenne River - Range 11 ... .......... .. 52
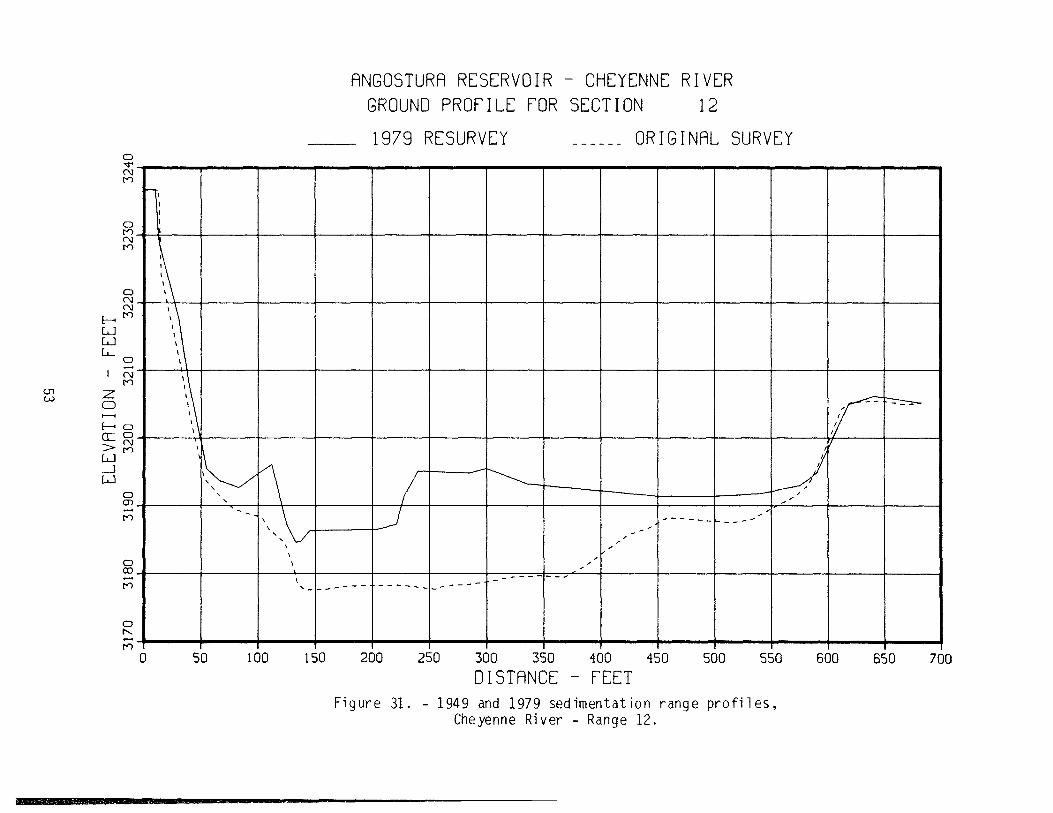
31 1949 and 1979 sedimentation range profiles,Cheyenne River - Range 12 ... .......... .. 53
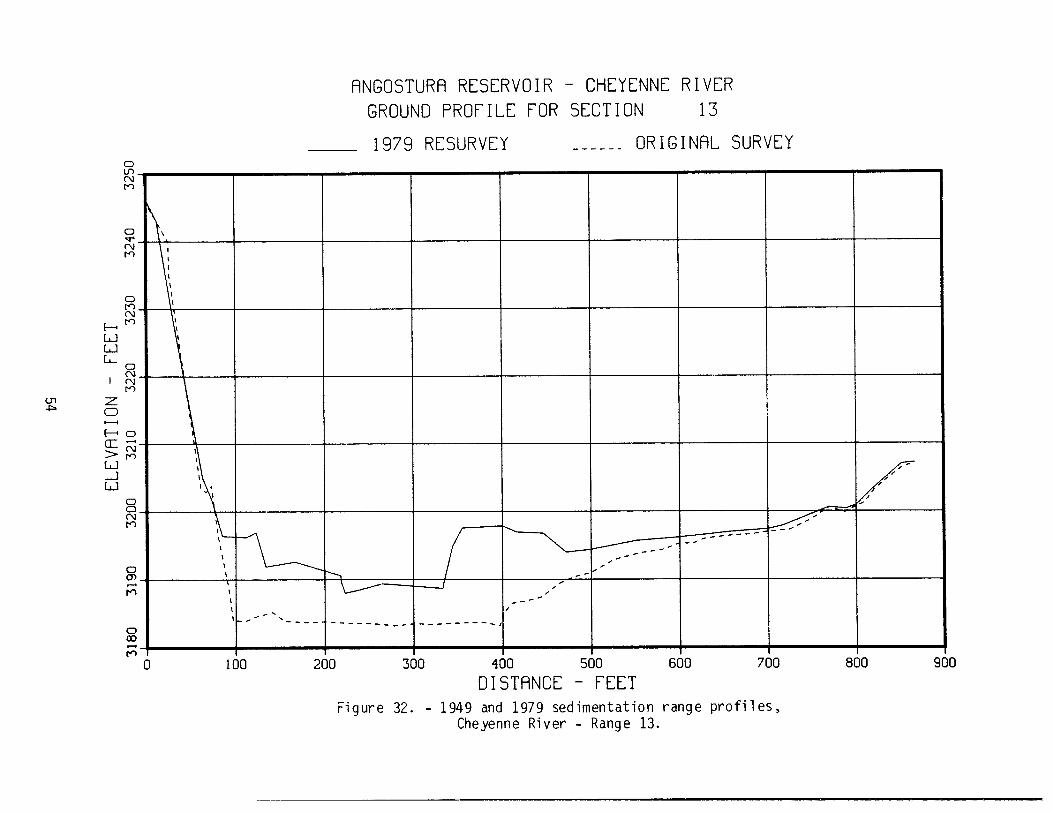
32 1949 and 1979 sedimentation range profiles,Cheyenne River - Range 13 ... .......... .. 54
33 1949 and 1979 sedimentation range profiles,Cheyenne River - Range 14 ... .......... .. 55
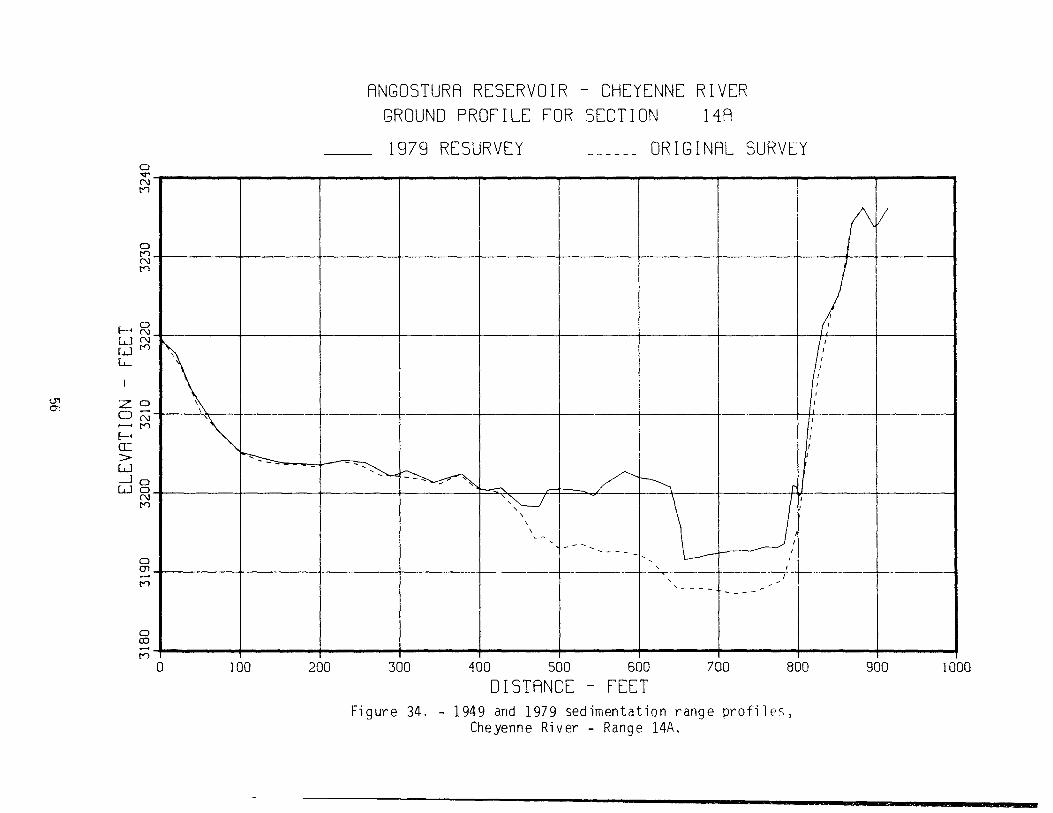
34 1949 and 1979 sedimentation range profiles,Cheyenne River - Range 14A .. .......... .. 56
11

CONTENTS (Continued)
...............
...............
...............
...............
.....
................
................
................
................
................
..............
..............
..............
..............
..............
..............
..............
..............
..............
..............
..............
..............
.................
Figure p
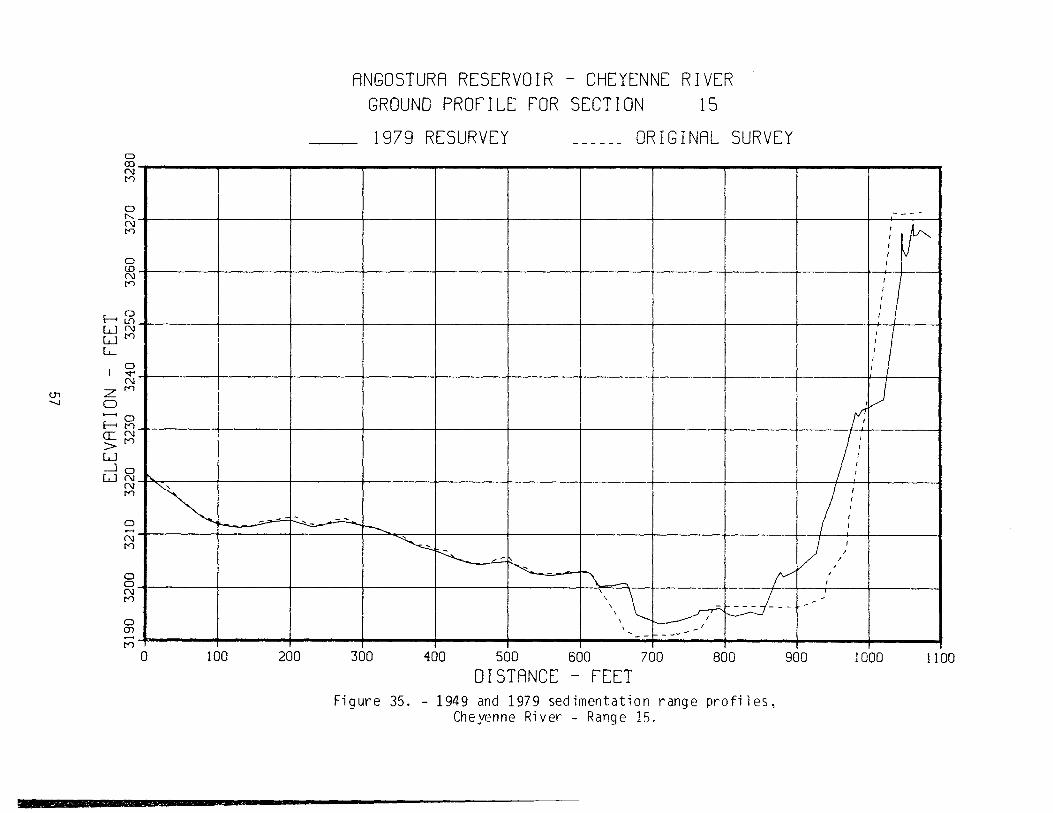
35 1949 and 1979 sedimentation range profiles,Cheyenne River - Range 15 57
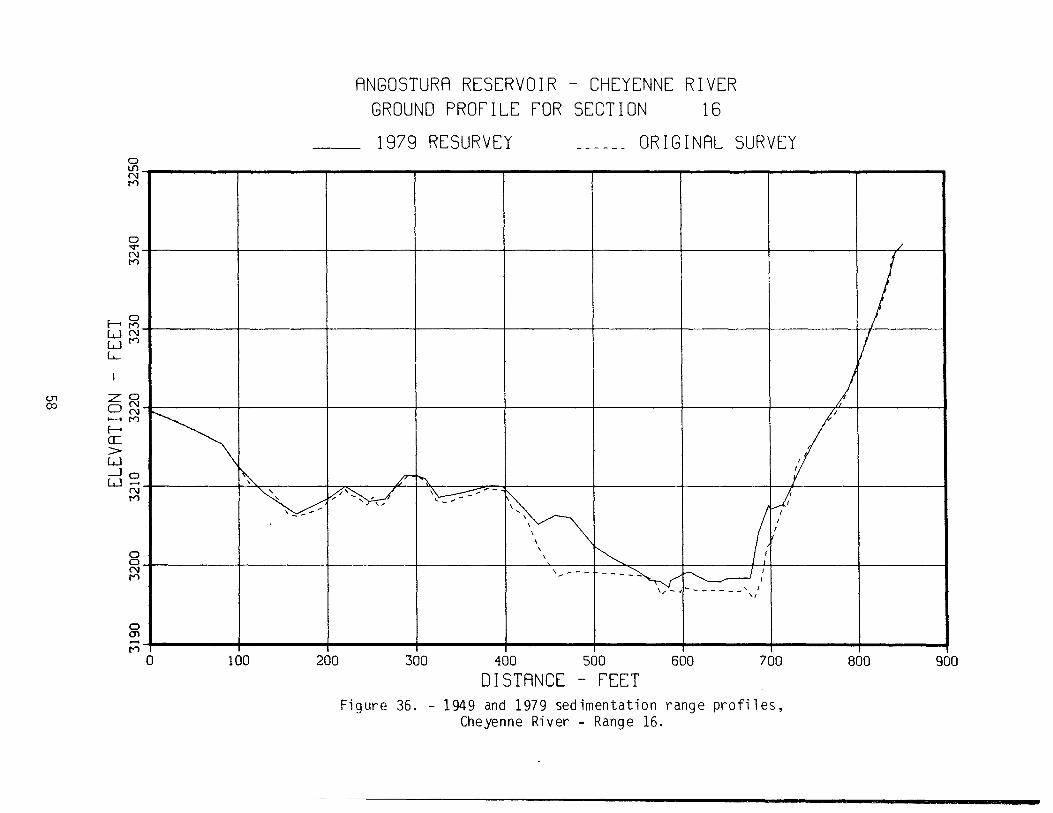
36 1949 and 1979 sedimentation range profiles,Cheyenne River - Range 16 58
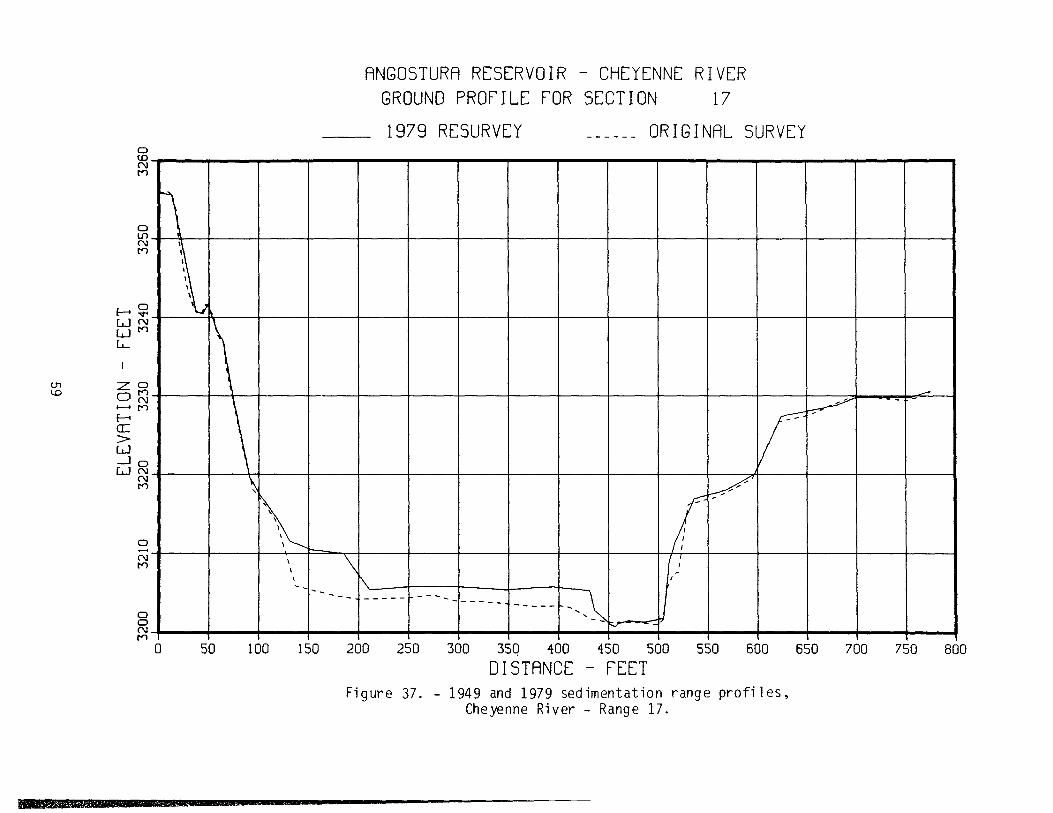
37 1949 and 1979 sedimentation range profiles,Cheyenne River - Range 17 59
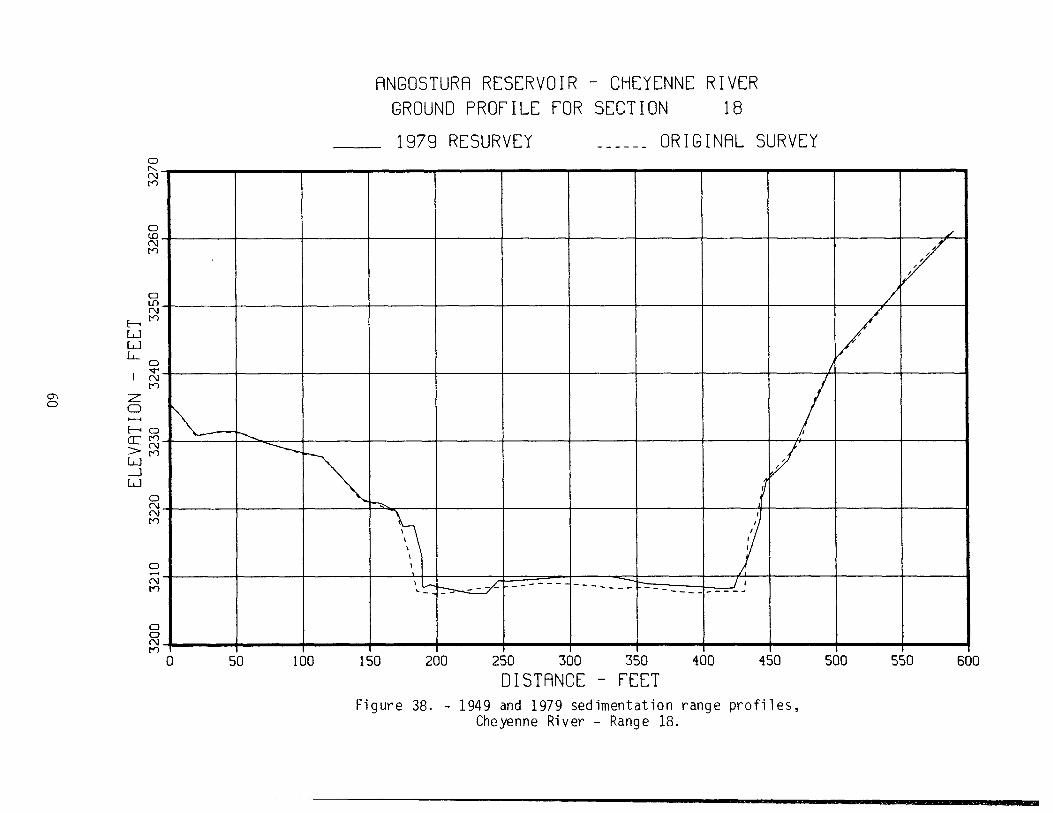
38 1949 and 1979 sedimentation range profiles,Cheyenne River - Range 18 60
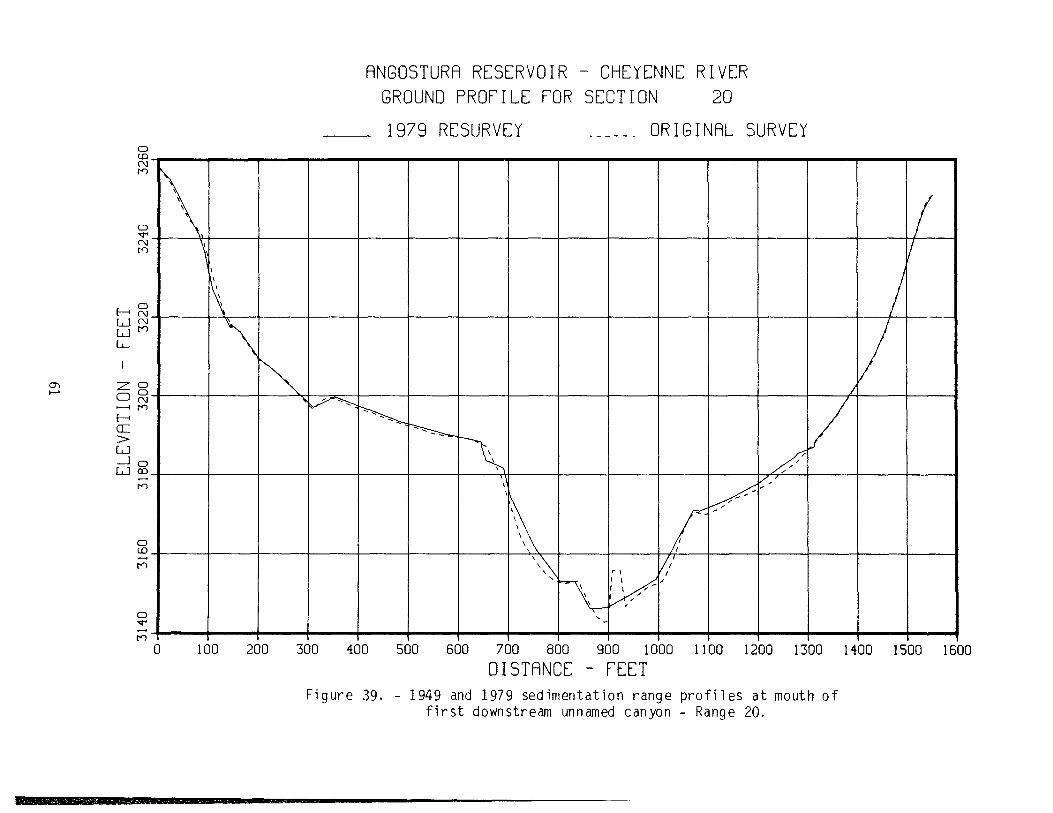
39 1949 and 1979 sedimentation range profiles at mouthof first downstream unnamed can yon - Range 20 61
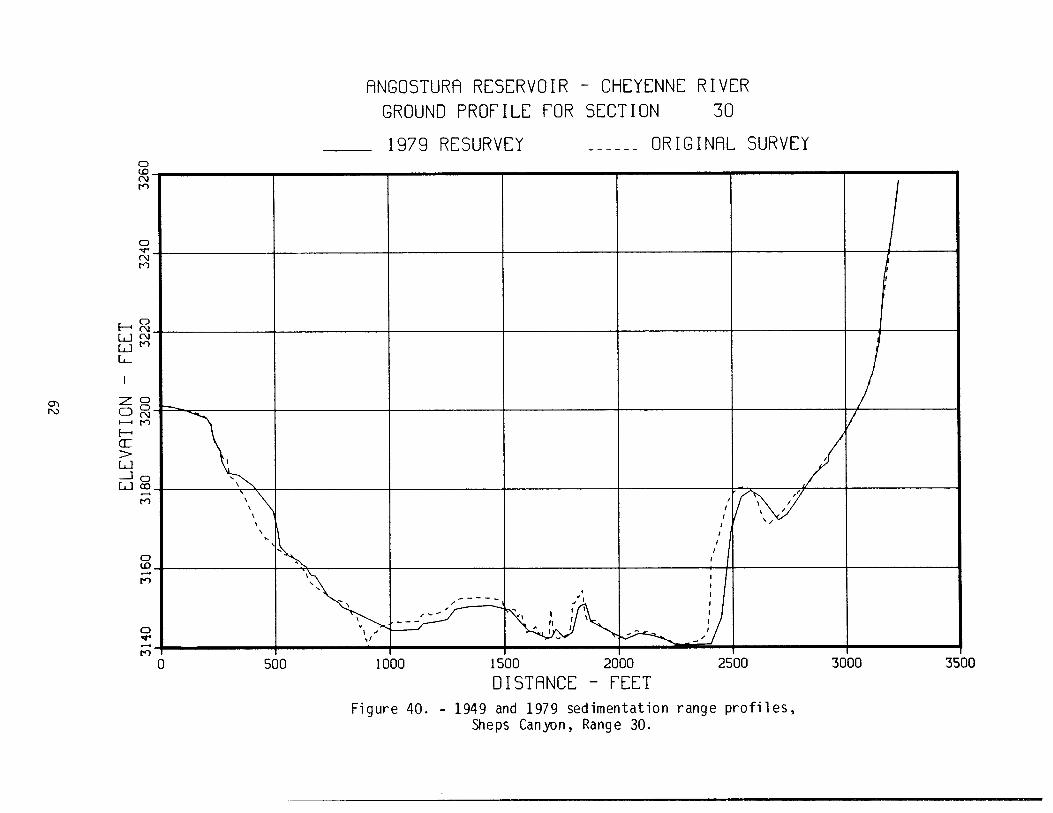
40 1949 and 1979 sedimentation range profiles,Sheps Canyon - Range 30 62
41 1949 and 1979 sedimentation range profiles,Sheps Canyon - Range 31 63
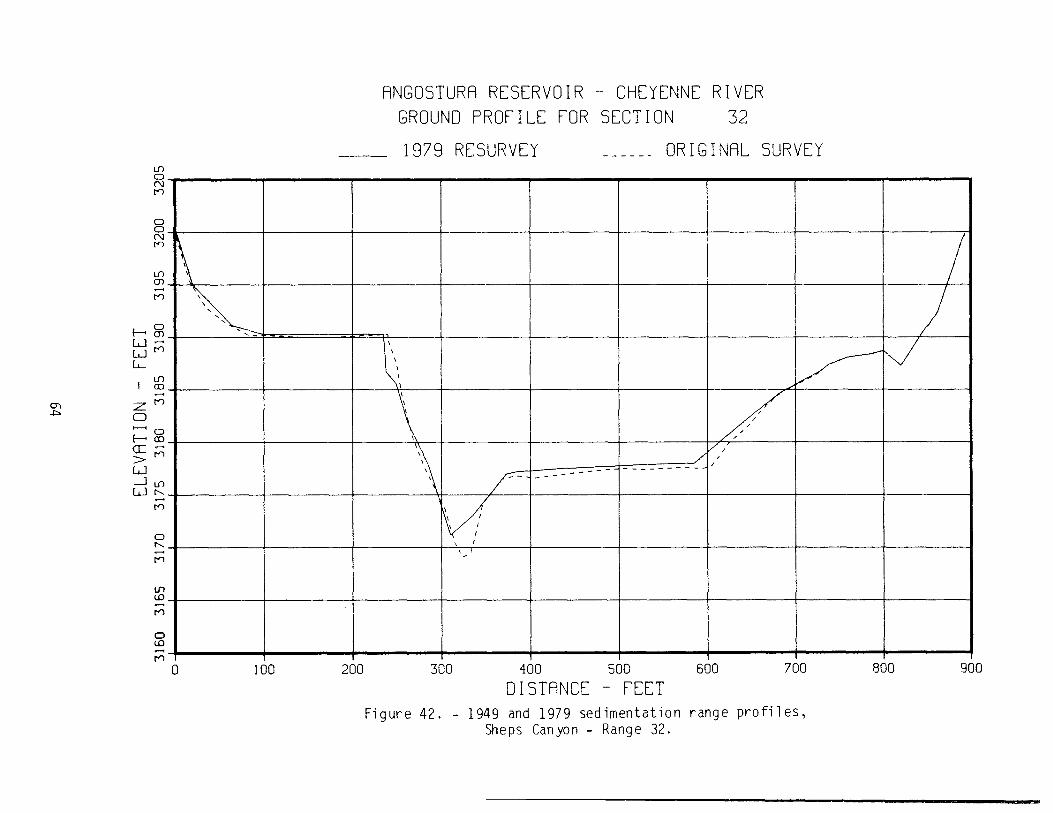
42 1949 and 1979 sedimentation range profiles,Sheps Canyon - Range 32 64
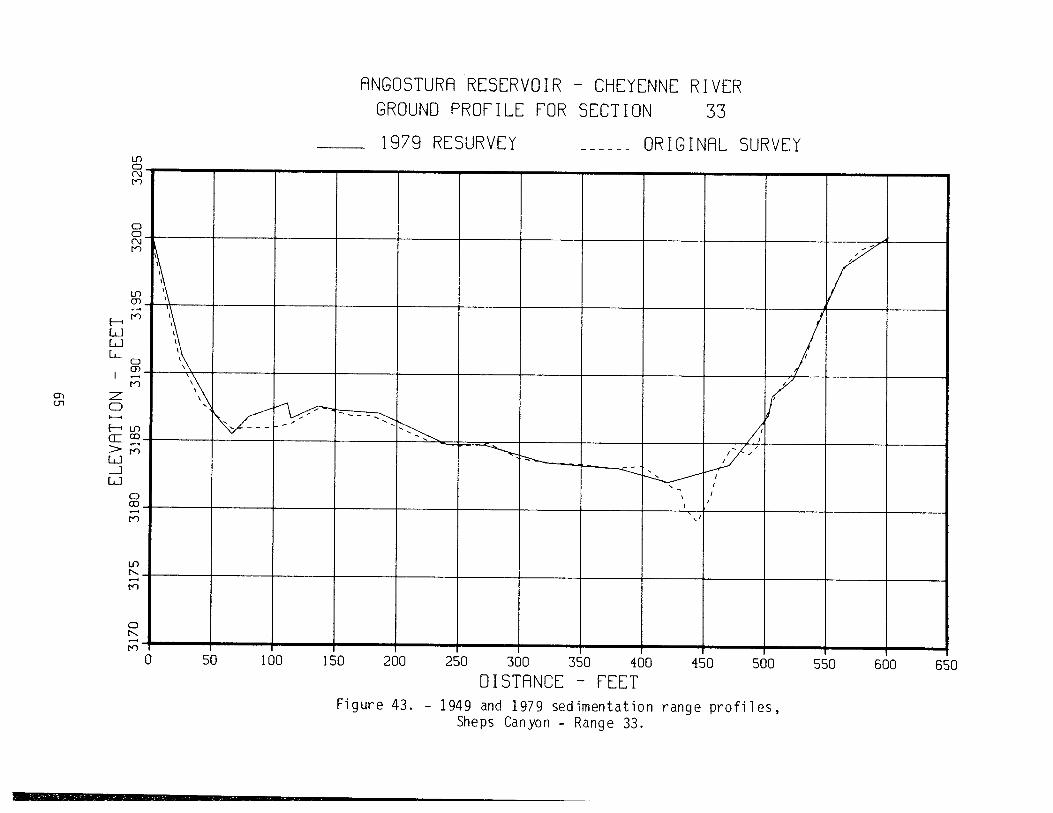
43 1949 and 1979 sedimentation range profiles,Sheps Canyon - Range 33 65
44 1949 and 1979 sedimentation range profiles,Sheps Canyon - Range 34 66
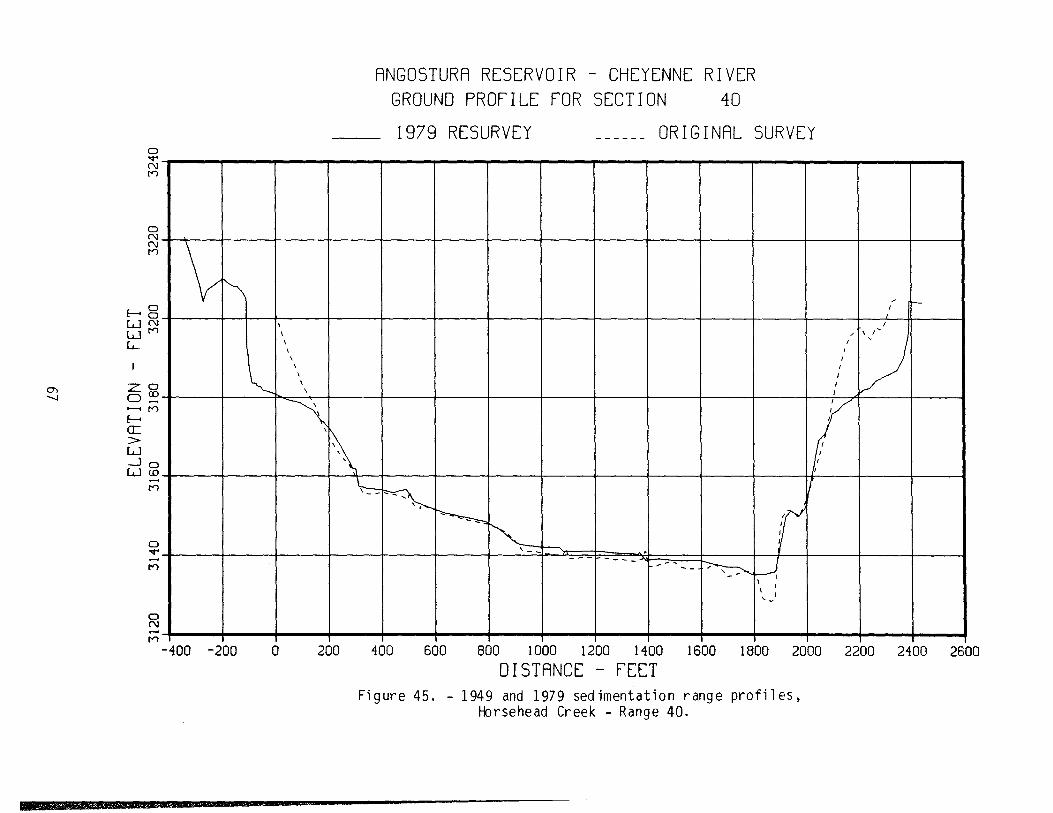
45 1949 and 1979 sedinientation range profiles,Horsehead Creek - Range 40 67
46 1949 and 1979 sedimentation range profiles,Fbrsehead Creek - Range 41 68
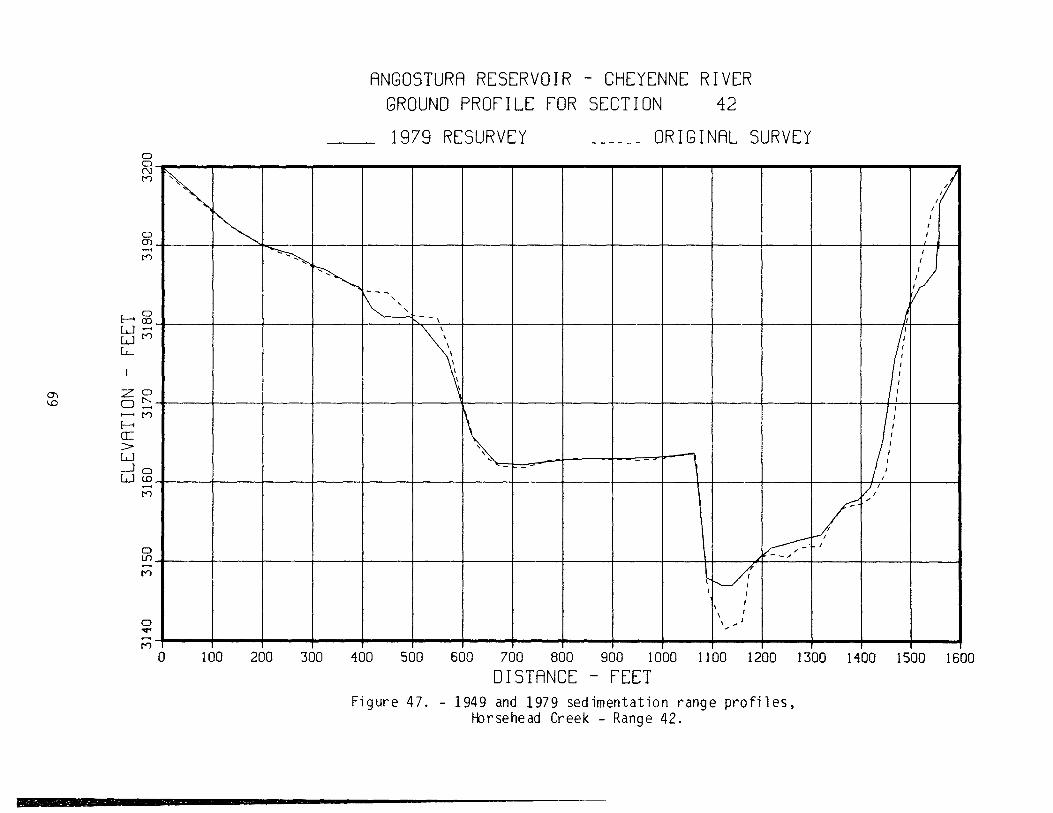
47 1949 and 1979 sedimentation range profiles,Horsehead Creek - Range 42 69
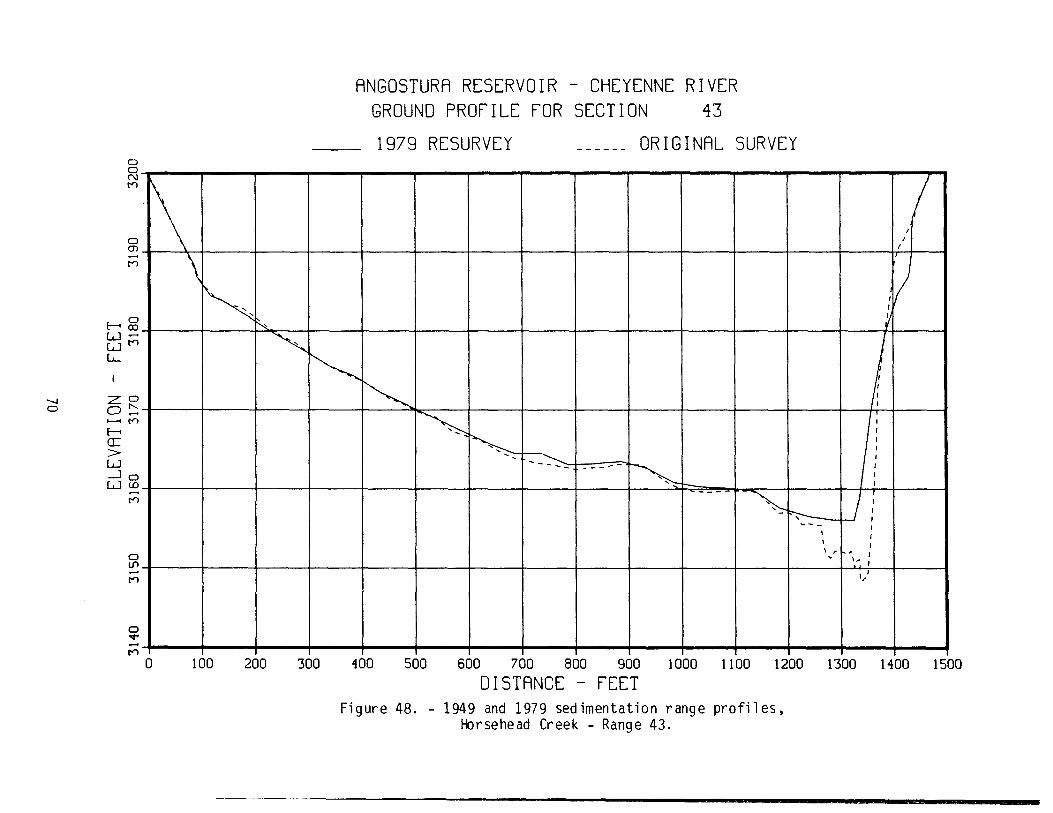
48 1949 and 1979 sedimentation range profiles,Horsehead Creek - Range 43 70
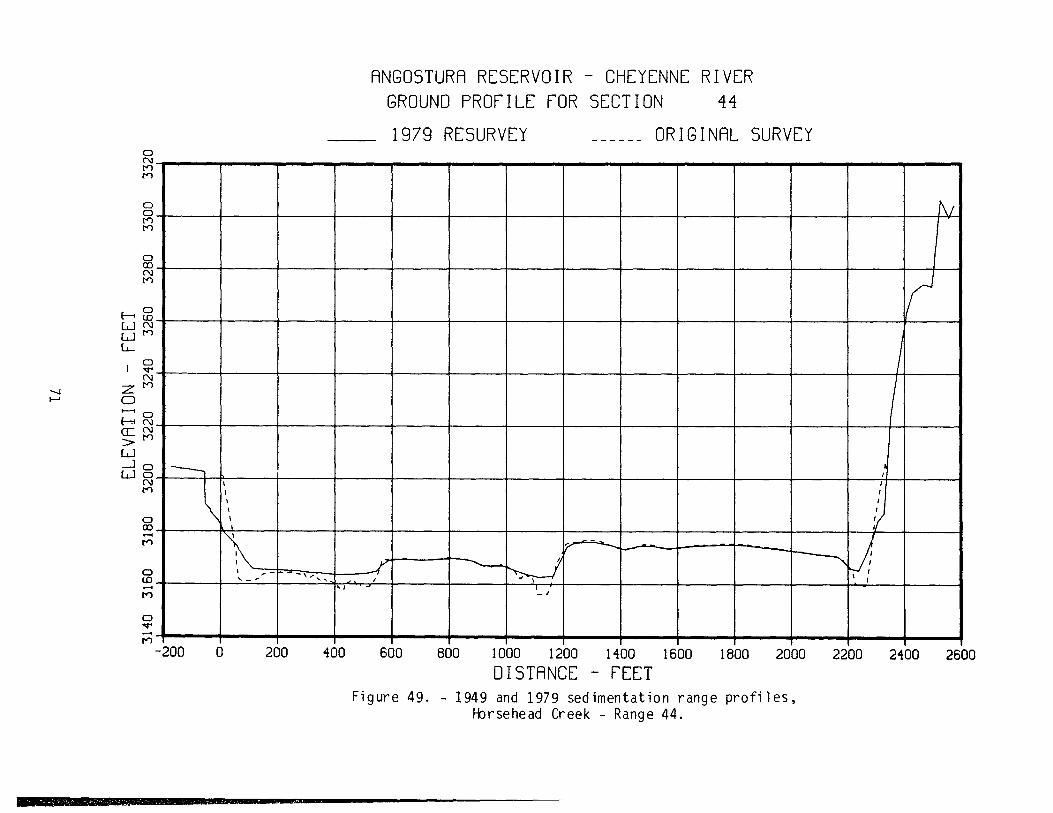
49 1949 and 1979 sedimentation range profiles,Horsehead Creek - Range 44 71
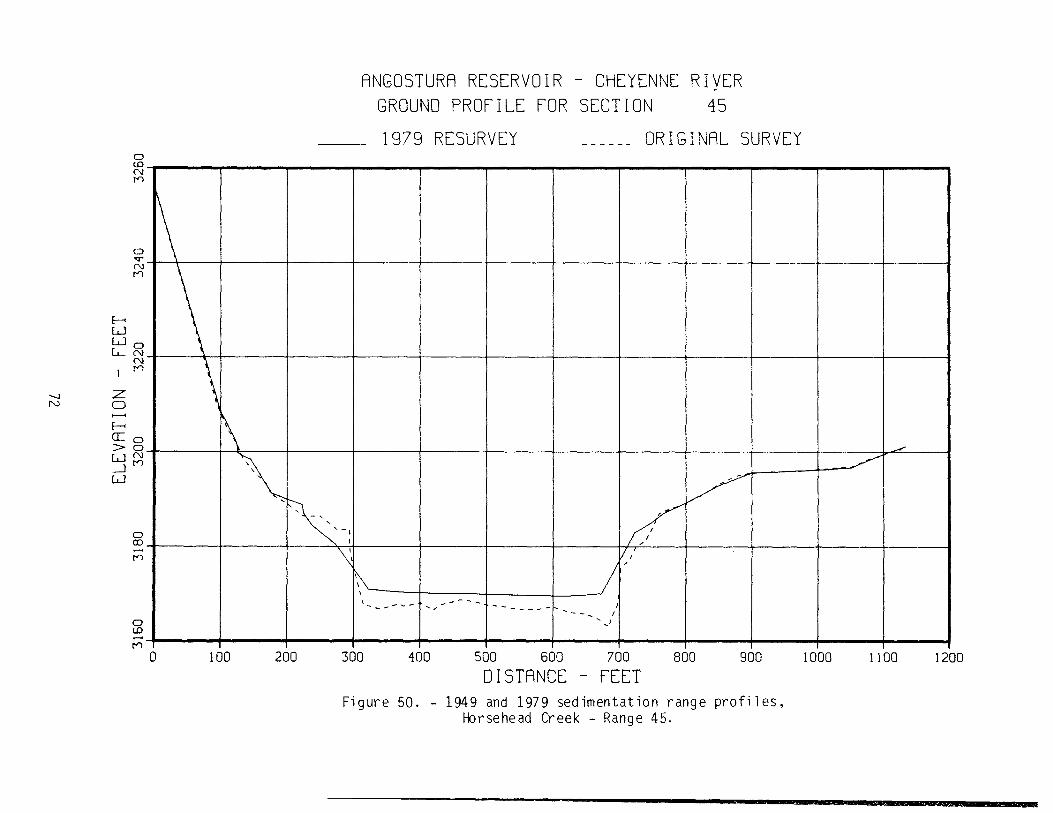
50 1949 and 1979 sedimentation range profiles,Horsehead Creek - Range 45 72
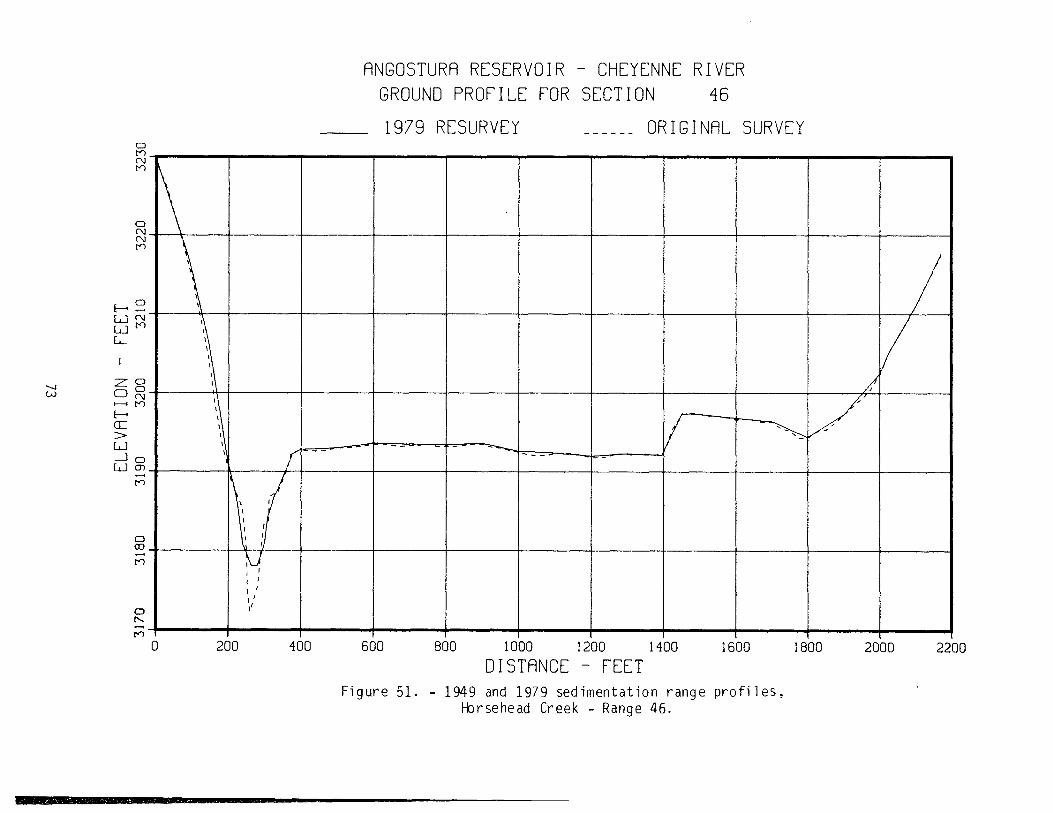
51 1949 and 1979 sedimentation range profiles,Horsehead Creek - Range 46 73
52 1949 and 1979 sedimentation range profiles,}-brsehead Creek - Range 47 74
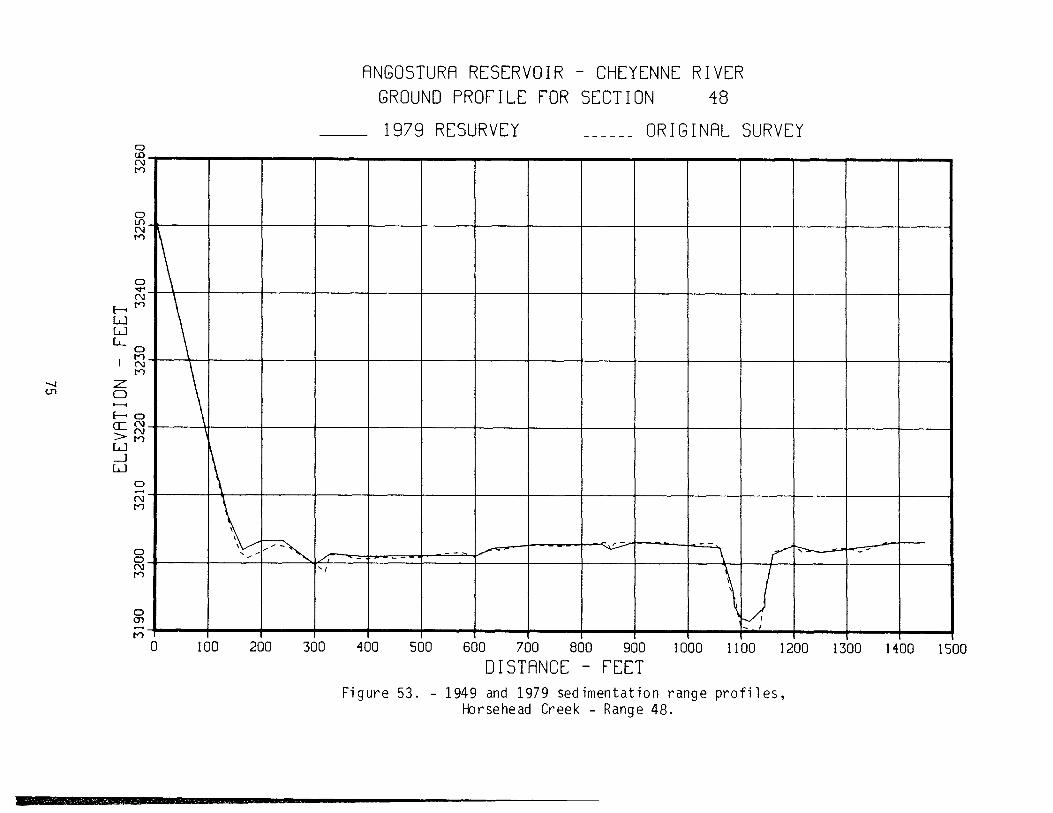
53 1949 and 1979 sedimentation range profiles,Horsehead Creek - Range 48 75
54 1949 and 1979 sedimentation range profiles,Horsehead Creek - Range 48A 76
55 1949 and 1979 sedimentation range profiles,Horsehead Creek - Range 49 77
56 1949 and 1979 sedimentation range profiles,Horsehead Creek - Range 51 78
57 1949 and 1979 sedimentation range profiles,Dry Creek - Range 60 79
111
CONTENTS (Continued)Fe
.................
.................
.................................
.......................
.........
.........
.........
.................
.................
.........
.........
.........
.........
.........
.........
.........
.....................
......
58 1949 and 1979 sedimentation range profiles,Dry Creek - Range 61 80
59 1949 and 1979 sedimentation range profiles,!}-y Creek - Range 62 81
60 1949 and 1979 sedimentation range profiles at mouthof unnamed canyon entering reservoir upstream ofRange 7 - Range 7A 82
61 Sediment accumulation curve 8362 Sediment accumulations in elevation intervals 8463 Particle size analyses curves - Range 6 8564 Particle size analyses curves - Range 6A 8665 Particle size analyses curves - Range 7 8766 Particle size analyses curves - Range 8 8967 Particle size analyses curves - Range 9 9068 Particle size analysis curve - Range 10 9169 Particle size analyses curves - Range 12 9270 Particle size analysis curve - Range 14 9371 Particle size analyses curves - Range 40 9472 Particle size analysis curve - Range 42 9573 Degradation range profiles - Range 0.2 9674 Degradation range profiles - Range 0.7 9775 Degradation range profiles - Range 1.75 9876 Degradation range profiles - Range 4.0 9977 Degradation range profiles - Range 5.0 10078 Degradation range profiles - Raoe 10.0 10179 Degradation range profiles - Range 15.0 10280 Longitudinal degradation profiles 10381 Outflow-duration curve for monthly outflow discharges . 10482 Area-capacity curves for Angostura Reservoir 105
iv
INTRODUCTION
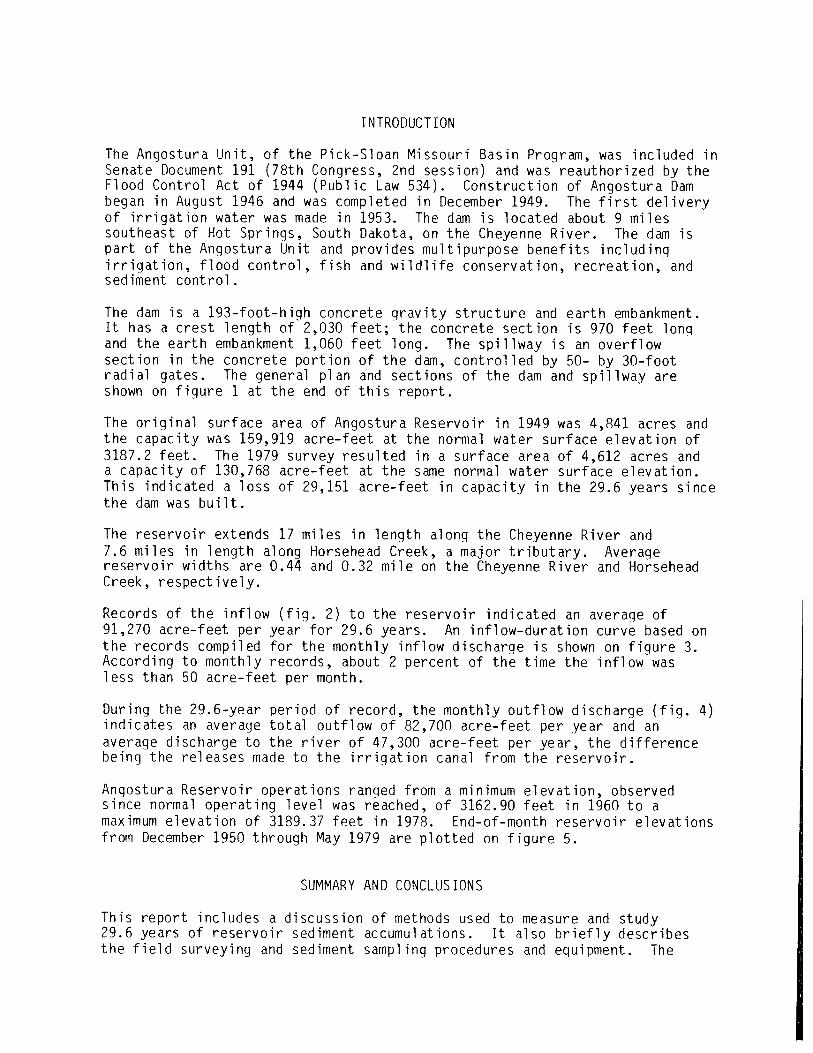
The Angostura Unit, of the Pick-Sloan Missouri Basin Program, was included inSenate Document 191 (78th Congress, 2nd session) and was reauthorized by theFlood Control Act of 1944 (Public Law 534). Construction of Angostura Dambegan in August 1946 and was completed in December 1949. The first deliveryof irrigation water was made in 1953. The dam is located about 9 milessoutheast of Hot Springs, South Dakota, on the Cheyenne River. The dam ispart of the Angostura Unit and provides multipurpose benefits includinqirrigation, flood control, fish and wildlife conservation, recreation, andsediment control.
The dam is a 193-foot-high concrete gravity structure and earth embankment.It has a crest length of 2,030 feet; the concrete section is 970 feet longand the earth embankment 1,060 feet long. The spillway is an overflowsection in the concrete portion of the dam, controlled by 50- by 30-footradial gates. The general plan and sections of the dam and spillway areshown on figure 1 at the end of this report.
The original surface area of Angostura Reservoir in 1949 was 4,841 acres andthe capacity was 159,919 acre-feet at the normal water surface elevation of3187.2 feet. The 1979 survey resulted in a surface area of 4,612 acres anda capacity of 130,768 acre-feet at the same normal water surface elevation.This indicated a loss of 29,151 acre-feet in capacity in the 29.6 years sincethe dam was built.
The reservoir extends 17 miles in length along the Cheyenne River and7.6 miles in length along Horsehead Creek, a major tributary. Averagereservoir widths are 0.44 and 0.32 mile on the Cheyenne River and HorseheadCreek, respectively.
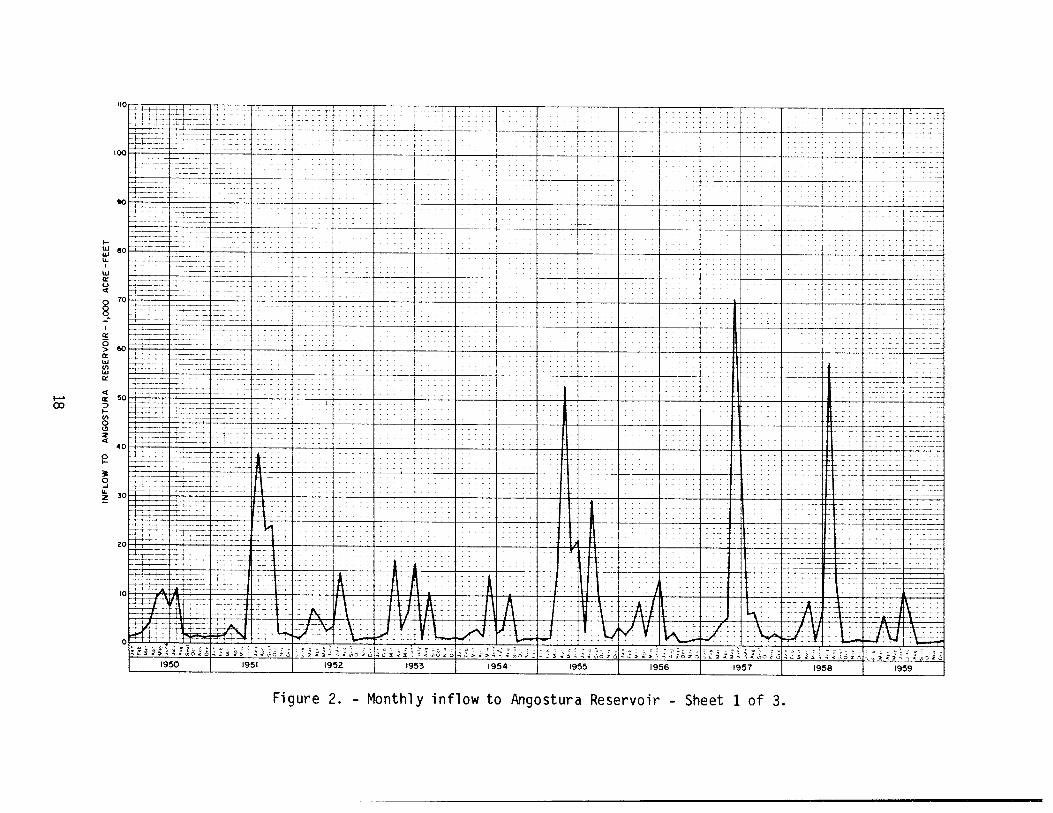
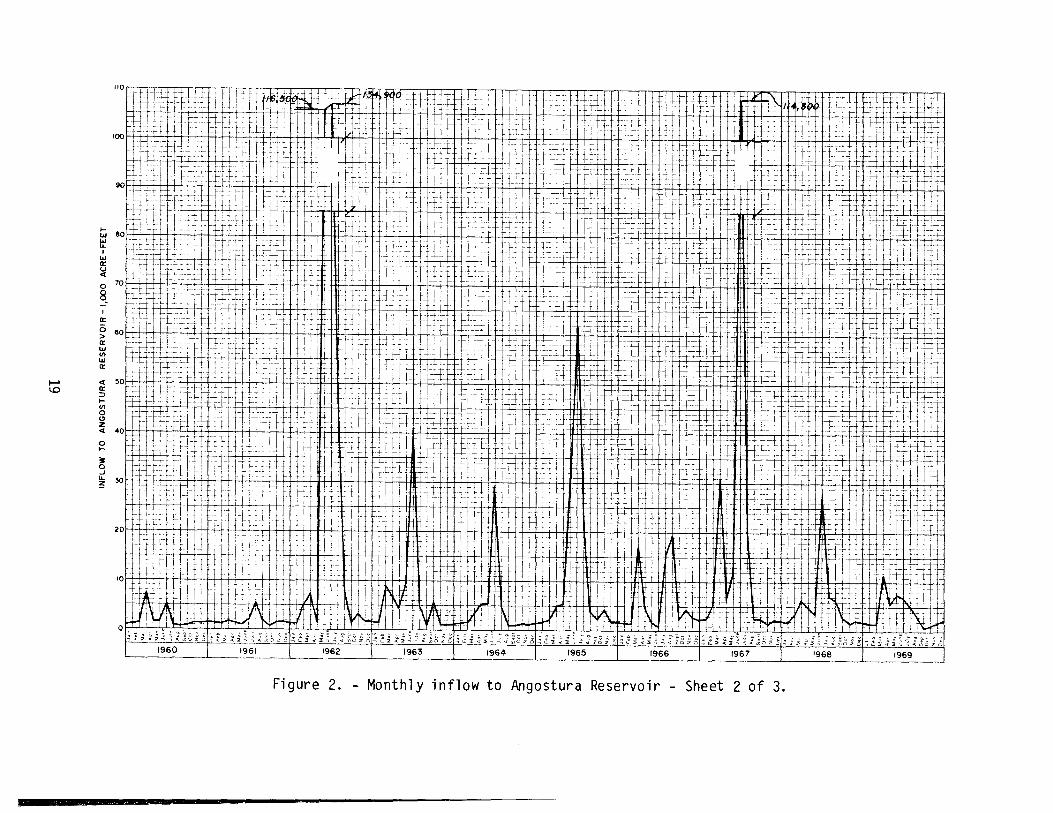
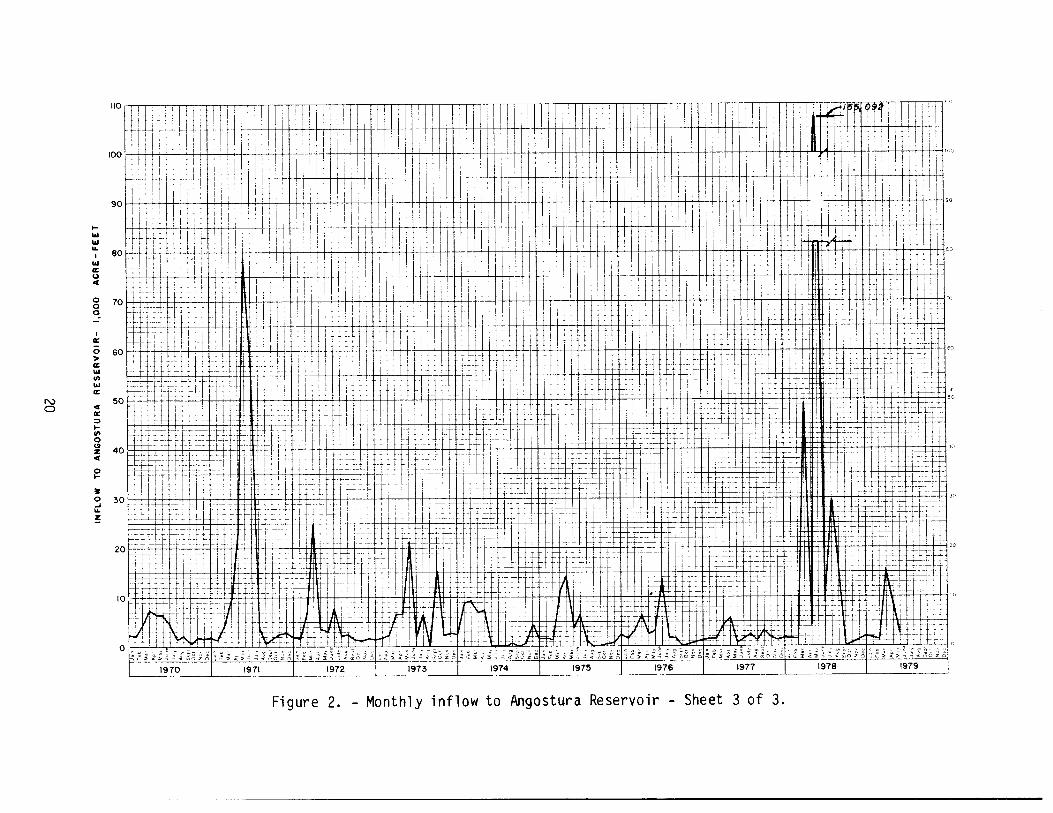
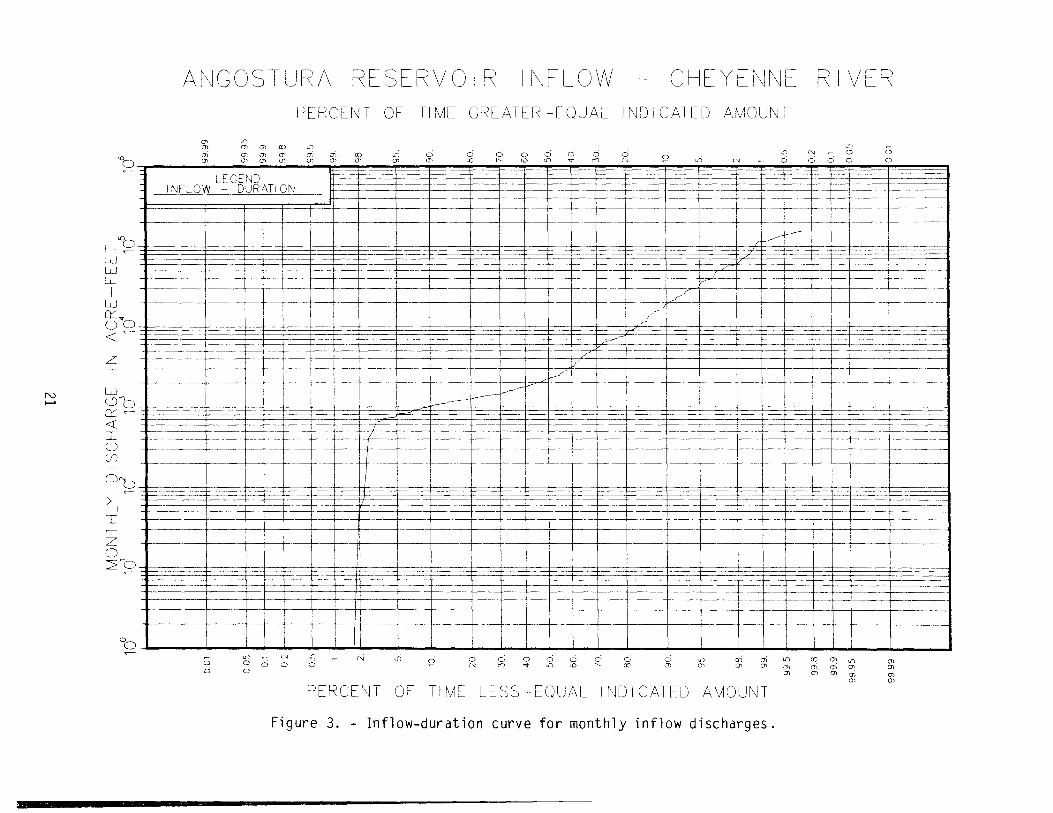
Records of the inflow (fig. 2) to the reservoir indicated an average of91,270 acre-feet per year for 29.6 years. An inflow-duration curve based onthe records compiled for the monthly inflow discharge is shown on figure 3.According to monthly records, about 2 percent of the time the inflow wasless than 50 acre-feet per month.
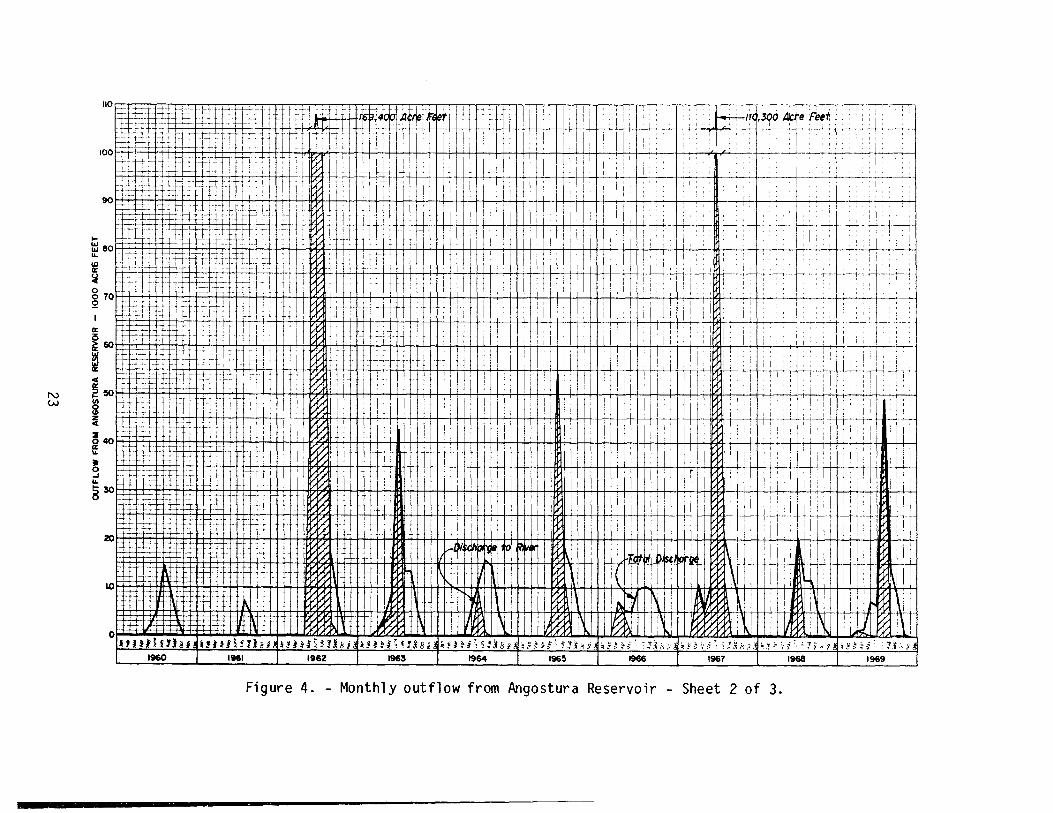
During the 29.6-year period of record, the monthly outflow discharge (fig. 4)indicates an average total outflow of 82,700 acre-feet per year and anaverage discharge to the river of 47,300 acre-feet per year, the differencebeing the releases made to the irrigation canal from the reservoir.
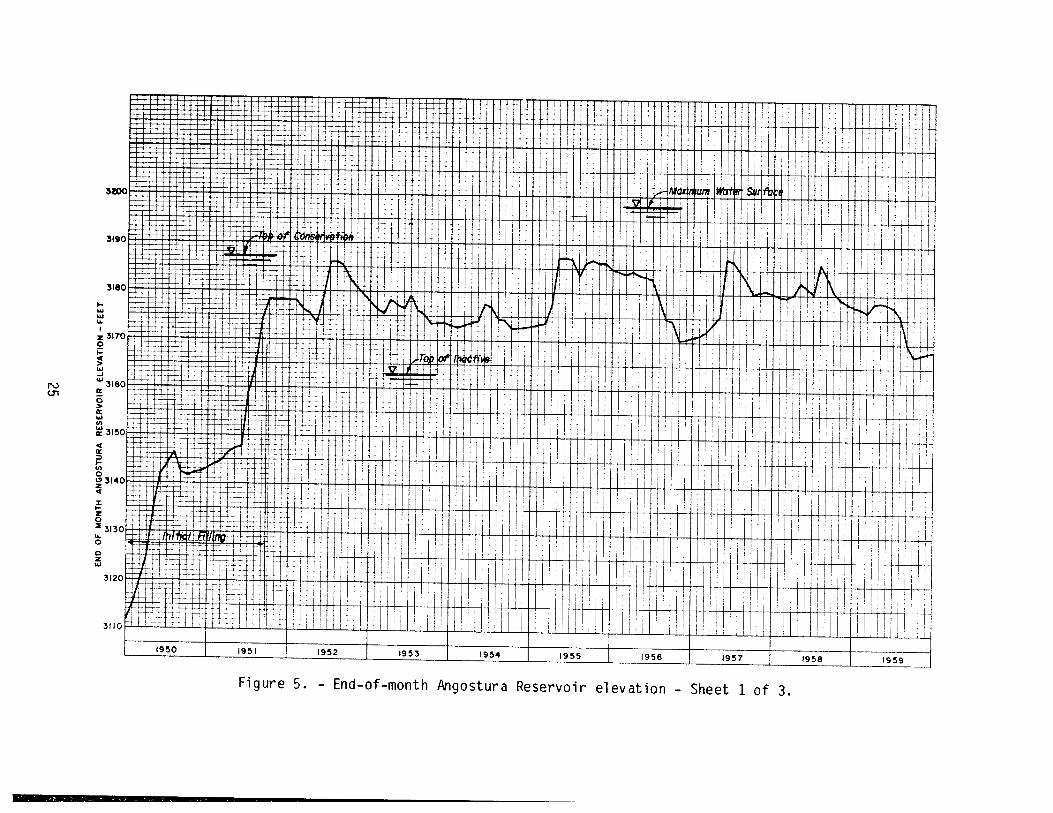
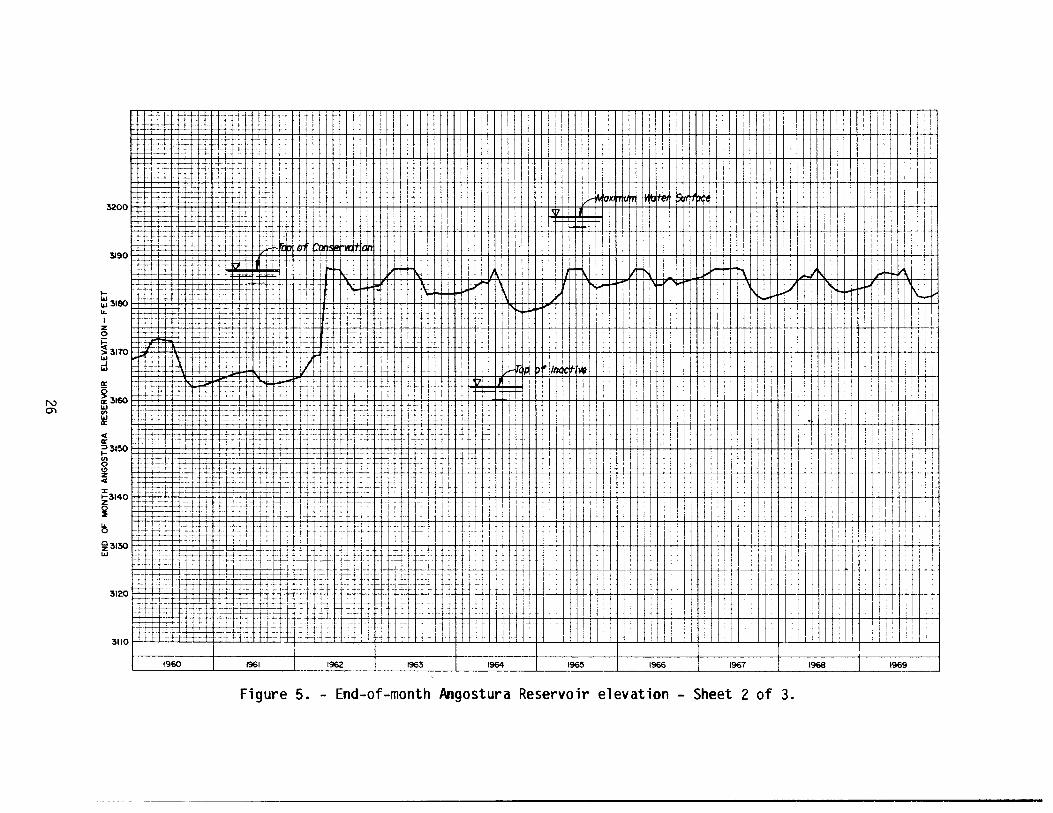
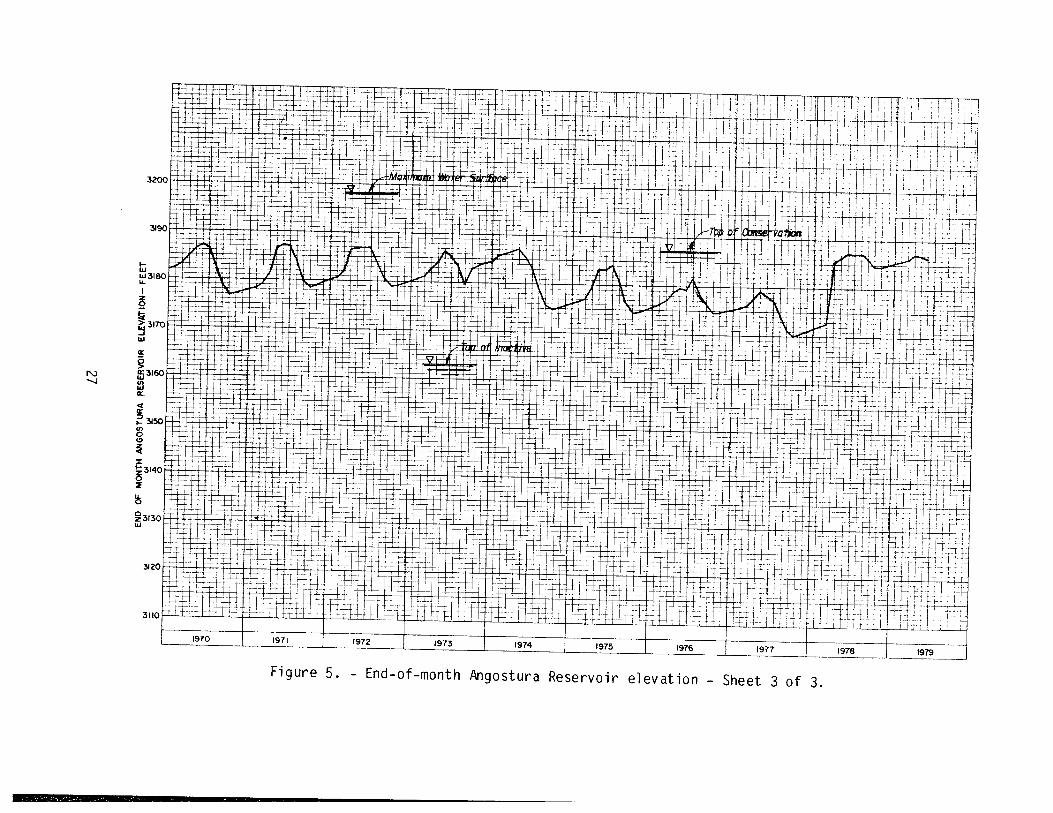
Angostura Reservoir operations ranged from a minimum elevation, observedsince normal operating level was reached, of 3162.90 feet in 1960 to amaximum elevation of 3189.37 feet in 1978. End-of-month reservoir elevationsfrom December 1950 through May 1979 are plotted on figure 5.
SUMMARY AND CONCLUSIONS
This report includes a discussion of methods used to measure and study29.6 years of reservoir sediment accumulations. It also briefly describesthe field surveying and sediment sampling procedures and equipment. The
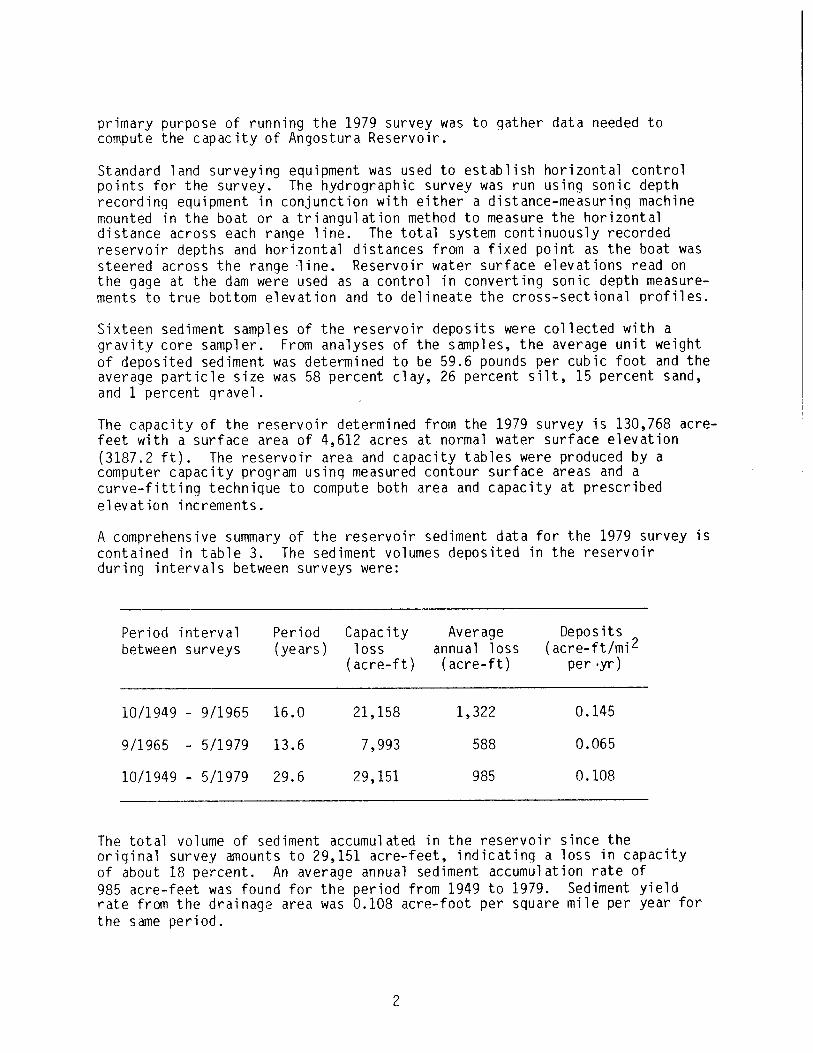
primary purpose of running the 1979 survey was to gather data needed tocompute the capacity of Angostura Reservoir.
Standard land surveying equipment was used to establish horizontal controlpoints for the survey. The hydrographic survey was run using sonic depthrecording equipment in conjunction with either a distance-measuring machinemounted in the boat or a triangulation method to measure the horizontaldistance across each range line. The total system continuously recordedreservoir depths and horizontal distances from a fixed point as the boat wassteered across the range line. Reservoir water surface elevations read onthe gage at the dam were used as a control in converting sonic depth measure-ments to true bottom elevation and to delineate the cross-sectional profiles.
Sixteen sediment samples of the reservoir deposits were collected with agravity core sampler. From analyses of the samples, the average unit weightof deposited sediment was determined to be 59.6 pounds per cubic foot and theaverage particle size was 58 percent clay, 26 percent silt, 15 percent sand,and 1 percent gravel.
The capacity of the reservoir determined from the 1979 survey is 130,768 acre-feet with a surface area of 4,612 acres at normal water surface elevation(3187.2 ft). The reservoir area and capacity tables were produced by acomputer capacity program using measured contour surface areas and acurve-fitting technique to compute both area and capacity at prescribedelevation increments.
A comprehensive summary of the reservoir sediment data for the 1979 survey iscontained in table 3. The sediment volumes deposited in the reservoirduring intervals between surveys were:
Period interval Period Capacity Average Depositsbetween surveys (years) loss annual loss (acre-ft/mi2
(acre-ft) (acre-ft) per .yr)
10/1949 - 9/1965 16.0 21,158 1,322 0.145
9/1965 - 5/1979 13.6 7,993 588 0.065
10/1949 - 5/1979 29.6 29,151 985 0.108
The total volume of sediment accumulated in the reservoir since theoriginal survey amounts to 29,151 acre-feet, indicating a loss in capacityof about 18 percent. An average annual sediment accumulation rate of985 acre-feet was found for the period from 1949 to 1979. Sediment yieldrate from the drainage area was 0.108 acre-foot per square mile per year forthe same period.
2
DESCRIPTION OF BASIN
DrainaQe Area and TopocraDh
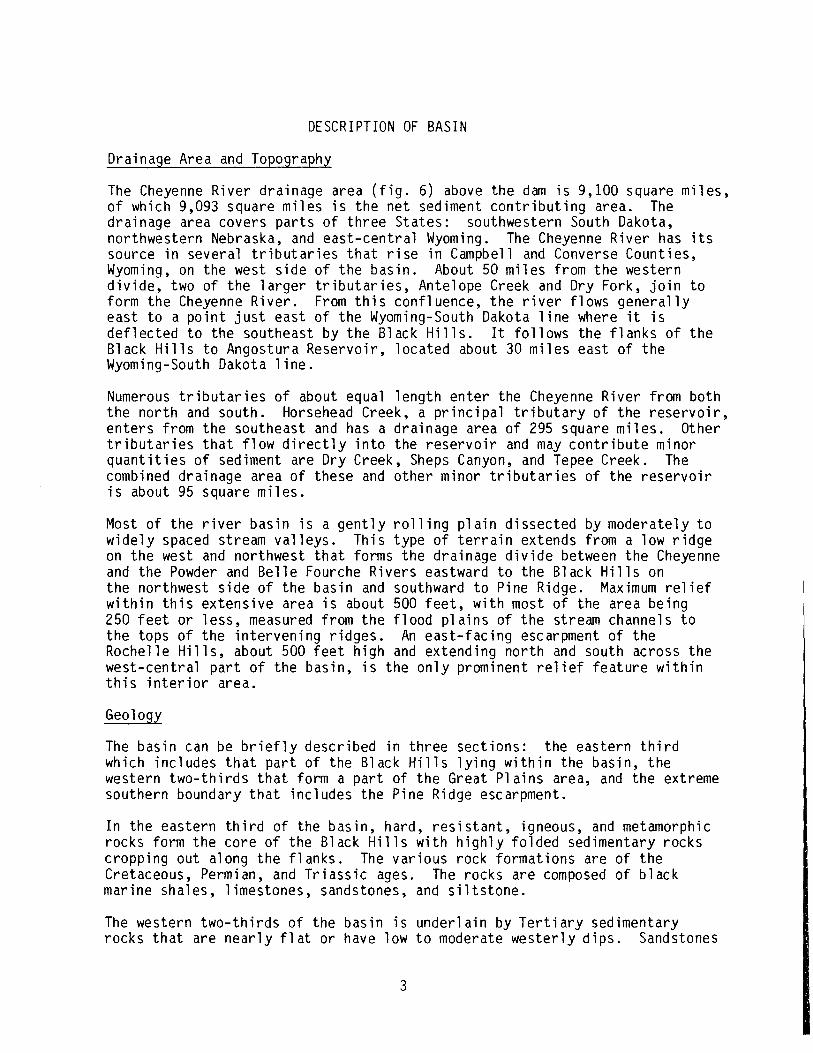
The Cheyenne River drainage area (fig. 6) above the dam is 9,100 square miles,of which 9,093 square miles is the net sediment contributing area. Thedrainage area covers parts of three States: southwestern South Dakota,northwestern Nebraska, and east-central Wyoming. The Cheyenne River has itssource in several tributaries that rise in Campbell and Converse Counties,Wyoming, on the west side of the basin. About 50 miles from the westerndivide, two of the larger tributaries, Antelope Creek and Dry Fork, join toform the Cheyenne River. From this confluence, the river flows generallyeast to a point just east of the Wyoming-South Dakota line where it isdeflected to the southeast by the Black Hills. It follows the flanks of theBlack Hills to Angostura Reservoir, located about 30 miles east of theWyoming-South Dakota line.
Numerous tributaries of about equal length enter the Cheyenne River from boththe north and south. Horsehead Creek, a principal tributary of the reservoir,enters from the southeast and has a drainage area of 295 square miles. Othertributaries that flow directly into the reservoir and may contribute minorquantities of sediment are Dry Creek, Sheps Canyon, and Tepee Creek. Thecombined drainage area of these and other minor tributaries of the reservoiris about 95 square miles.
Most of the river basin is a gently rolling plain dissected by moderately towidely spaced stream valleys. This type of terrain extends from a low ridgeon the west and northwest that forms the drainage divide between the Cheyenneand the Powder and Belle Fourche Rivers eastward to the Black Hills onthe northwest side of the basin and southward to Pine Ridge. Maximum reliefwithin this extensive area is about 500 feet, with most of the area being250 feet or less, measured from the flood plains of the stream channels tothe tops of the intervening ridges. An east-facing escarpment of theRochelle Hills, about 500 feet high and extending north and south across thewest-central part of the basin, is the only prominent relief feature withinthis interior area.
Geology
The basin can be briefly described in three sections: the eastern thirdwhich includes that part of the Black Hills lying within the basin, thewestern two-thirds that form a part of the Great Plains area, and the extremesouthern boundary that includes the Pine Ridge escarpment.
In the eastern third of the basin, hard, resistant, igneous, and metamorphicrocks form the core of the Black Hills with highly folded sedimentary rockscropping out along the flanks. The various rock formations are of theCretaceous, Permian, and Triassic ages. The rocks are composed of blackmarine shales, limestones, sandstones, and siltstone.
The western two-thirds of the basin is underlain by Tertiary sedimentaryrocks that are nearly flat or have low to moderate westerly dips. Sandstones
3
and shales are themore prominent rocks. The stream pattern developed inthis terrain is essentially dendritic, there being little if any, structuralcontrol. The extreme western part is underlain by the Wasatch Formation andis composed of variegated sands and clays. The sparse grass and sagebrushreflect the aridity of the area which probably has the lowest precipitationin the entire basin. Nearly all streams are ephemeral and flow only inresponse to heavy rains or spring snowmelt.
The Pine Ridge escarpment that forms the southeast boundary of the basin ispart of the Tertiary White River Group. This group includes soft, white, andpinkish clays with some sandstone and limestone. A few streams in the areaare springfed and are perennial.
SURVEYS, SAMPLING, AND EQUIPMENT
History of Surveys
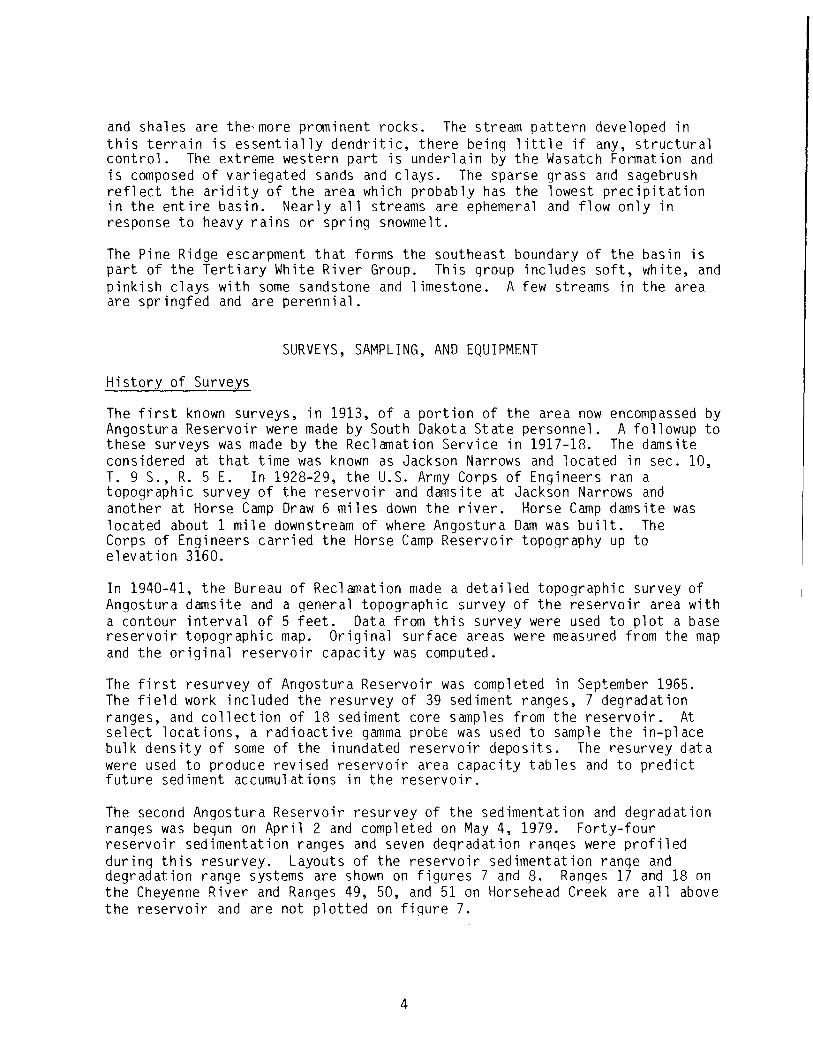
The first known surveys, in 1913, of a portion of the area now encompassed byAngostura Reservoir were made by South Dakota State personnel. A followup tothese surveys was made by the Reclamation Service in 1917-18. The damsiteconsidered at that time was known as Jackson Narrows and located in sec. 10,T. 9 S., R. 5 E. In 1928-29, the U.S. Army Corps of Engineers ran atopographic survey of the reservoir and damsite at Jackson Narrows andanother at Horse Camp Draw 6 miles down the river. Horse Camp damsite waslocated about 1 mile downstream of where Angostura Dam was built. TheCorps of Engineers carried the Horse Camp Reservoir topography up toelevation 3160.
In 1940-41, the Bureau of Reclamation made a detailed topographic survey ofAngostura damsite and a general topographic survey ofthe reservoir area witha contour interval of 5 feet. Data from this survey were used to plot a basereservoir topographic map. Original surface areas were measured from the mapand the original reservoir capacity was computed.
The first resurvey of Angostura Reservoir was completed in September 1965.The field work included the resurvey of 39 sediment ranges, 7 degradationranges, and collection of 18 sediment core samples from the reservoir. Atselect locations, a radioactive gamma probe was used to sample the in-placebulk density of some of the inundated reservoir deposits. The resurvey datawere used to produce revised reservoir area capacity tables and to predictfuture sediment accumulations in the reservoir.
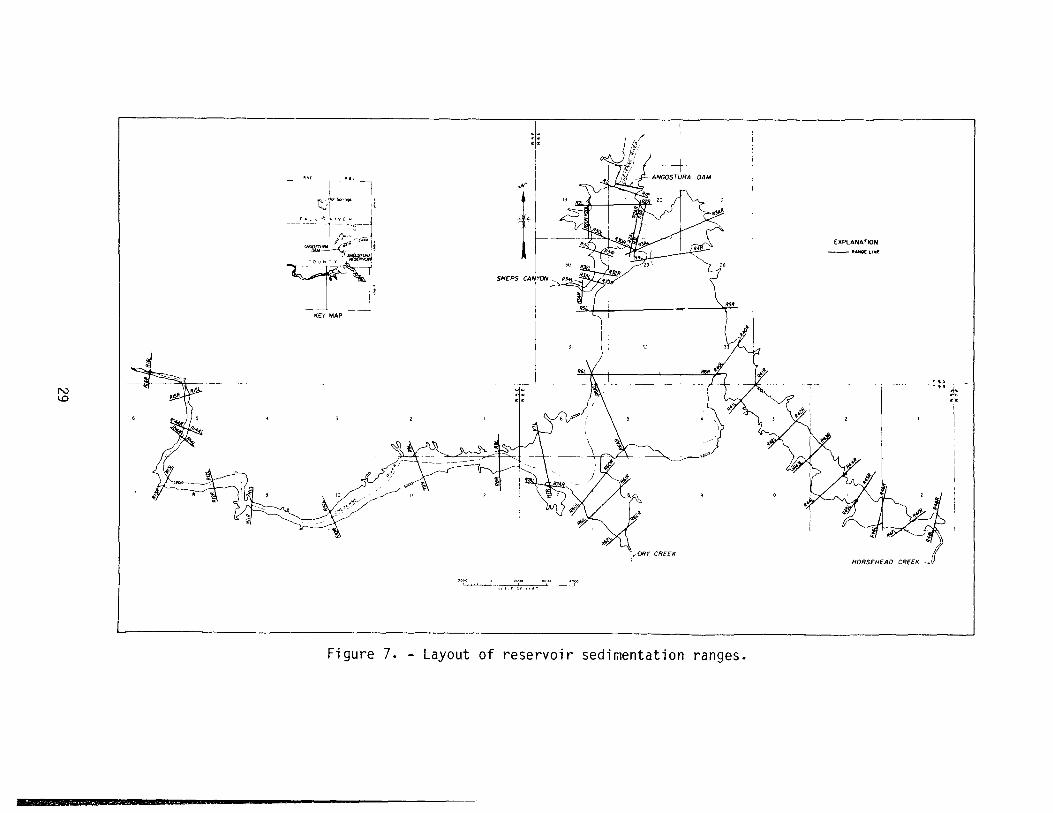
The second Angostura Reservoir resurvey of the sedimentation and degradationranges was begun on April 2 and completed on May 4, 1979. Forty-fourreservoir sedimentation ranges and seven degradation ranqes were profiledduring this resurvey. Layouts of the reservoir sedimentation range anddegradation range systems are shown on figures 7 and 8. Ranges 17 and 18 onthe Cheyenne River and Ranges 49, 50, and 51 on Horsehead Creek are all abovethe reservoir and are not plotted on figure 7.
4

Survevinci Methods
Field survey work consisted initially of locating and flagging all reservoirsedimentation range ends for use in running the profiles. Where possible,all ranges were profiled across their full length using standard land sur-veying procedures for leveling. For the 24 ranges that were partiallyinundated, levels were run down to the reservoir water surface from the rangemonuments located on each side of the reservoir. Stations were establishedat water's edge of each range to run the hydrograhic survey.
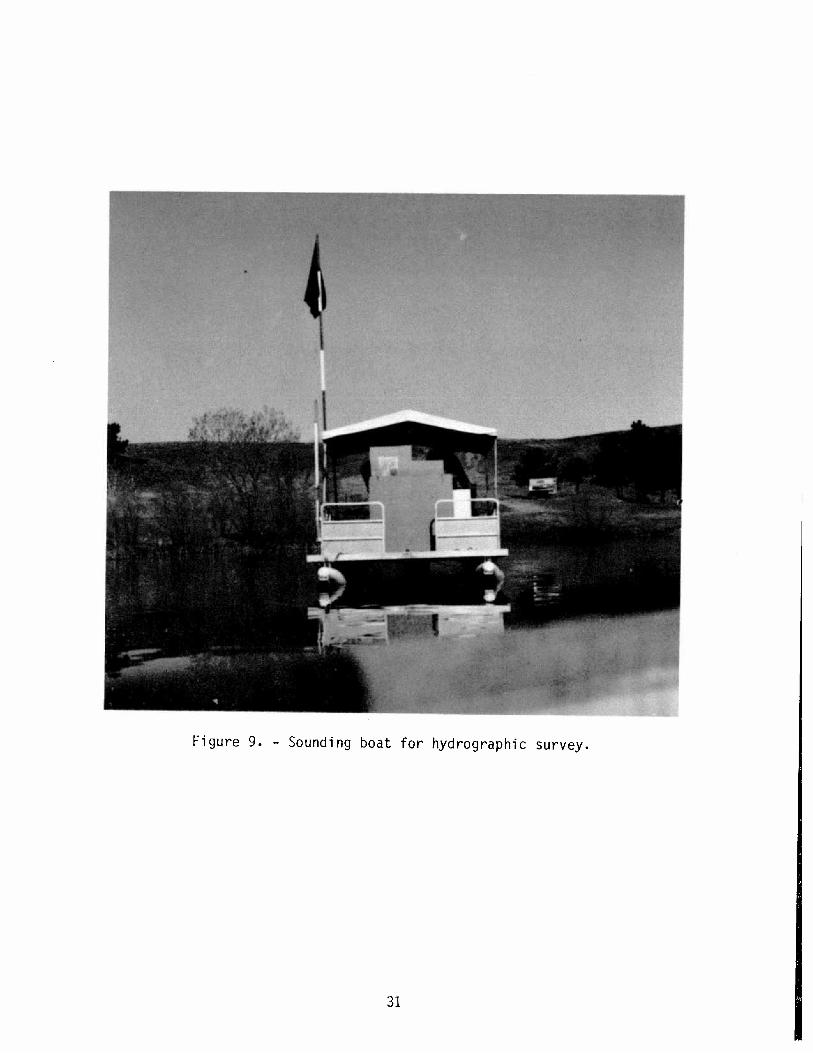
The hydrographic survey began on April 30 and was completed May 4, 1979,using sonic depth recording equipment to sound 11 range lines in the CheyenneRiver and 13 range lines in the tributaries. The equipment was installed onthe deck of a pontoon boat (fig. 9). The boat was positioned on a range lineas near to the shore as possible; then, the line was profiled from thestation at water's edge using a tape to measure the distance to the centerpoint of the transducer. The depth recorder was turned on and the boat wassteered across the range at speeds of about 3 to 5 feet per second. A man onshore kept the boat on line through radio communication with the boat operator.A distance measuring machine was used to measure horizontal distances acrossthe reservoir for some ranges. A "cutting-in" method was used for otherranges. Vertical control was maintained by referencing the recorded soundingsto the reservoir water surface elevation that was read off the gage at thedam each day of the survey operation.
Sampling Method and Equipment
A gravity core sampler was used to take 16 samples of the underwater reser-voir sediment deposits. The sampler was suspended over the side of the boatfrom a cable reeled off a power-operated winch. The sampler was allowed tofree-fall into the sediment deposits to maximum possible penetration. Whenthe sampler was retrieved on the boat deck, the cutterhead at the bottom wasremoved and the plastic liner withdrawn from the coring pipe. A hacksaw wasused to cut that part of the liner holding the sample. The samples werecapped with plastic caps on each end of the liner, sealed, and labeled foranalysis.
RESERVOIR SEDIMENT DISTRIBUTION
Longitudinal Distribution
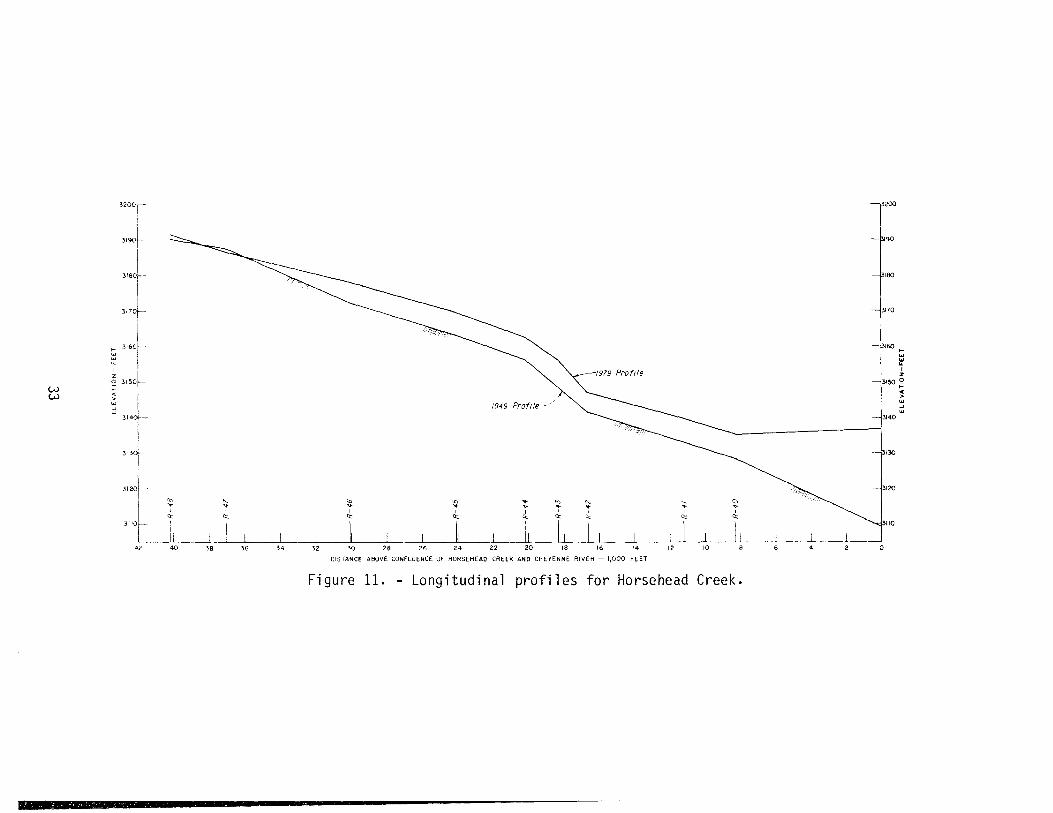
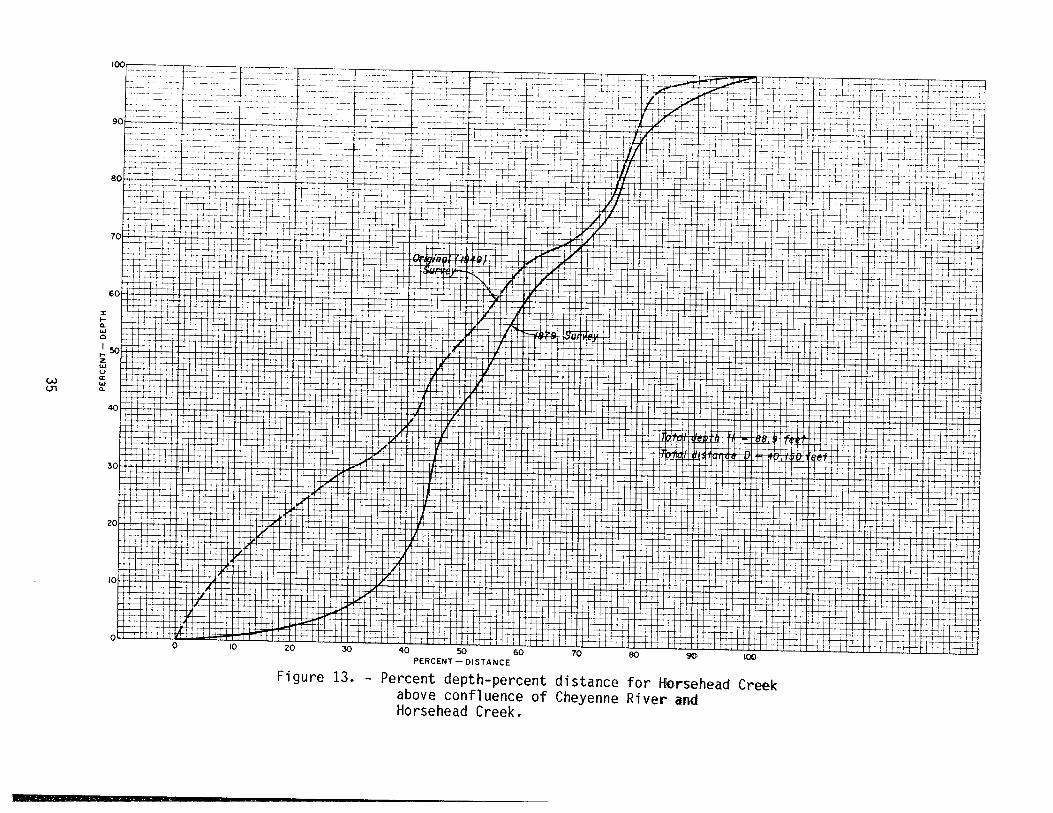
Longitudinal profiles of the Cheyenne River (fig. 10) and Horsehead Creek(fig. 11) were plotted for the original and 1979 reservoir conditions tostudy the distribution of sediments in each tributary arm. The profiles werealso plotted in dimensionless form (figs. 12 and 13), relating percent of depthto percent of distance for both the original and 1979 reservoir conditions.Percent of depth for both the Cheyenne River and Horsehead Creek arms wascomputed as the ratio of the thalweg depth at each range to the total depth.Thalweg depth was computed as the difference in elevation between the lowestpoint in the range and the lowest point on the profile. For 1949 reservoir
5

conditions, a total depth of 133.1 feet for the Cheyenne River arm was computedas the difference between the original low point of the reservoir, 3065 feet,and the maximum water surface elevation, 3,198.1 feet. Similarly for HorseheadCreek, a total depth of 88.9 feet [3,198.1 feet - 3,109.2 feet (thalweg eleva-tion of the confluence point of the Cheyenne River and Horsehead Creek)] wascomputed. Percent of distance for the Cheyenne River arm was computedas the ratio of the distance between the dam and each range to the totaldistance, 95,700 feet measured between the dam and the point where thelongitudinal profile intersects the original thalweg elevation (3195.7 feet)at the upstream end of the reservoir. Similarly for Horsehead Creek, percentof distance was computed as the ratio of the distance between the confluenceof the Cheyenne River and Horsehead Creek and each range to the total distanceof 40,150 feet measured between the confluence point and the point where thelongitudinal profile intersects the thaiweg elevation.
Based on the longitudinal profile of the Cheyenne River (fig. 10), maximumsediment deposits of 53 feet occurred near the dam. From Range 2 to Range 6,an average sediment deposition of 35 feet was noted. An average sedimentdeposition of 28 feet occurred between Ranges 6 and 7 upstream. The delta ortopset beds begin at Range 8 where the sediment deposits vary from 4 to34 feet.
Maximum sediment deposits of 27.5 feet occurred at the most downstream point(confluence of Horsehead Creek and Cheyenne River), as seen on the longi-tudinal profile (fig. 11) of Horsehead Creek. These deposits decreasedto 7 feet at Range 40. Between Range 40 and Range 46, the sediment depositsaveraged 6.5 feet. At Range 47, above Range 46, there were no deposits.
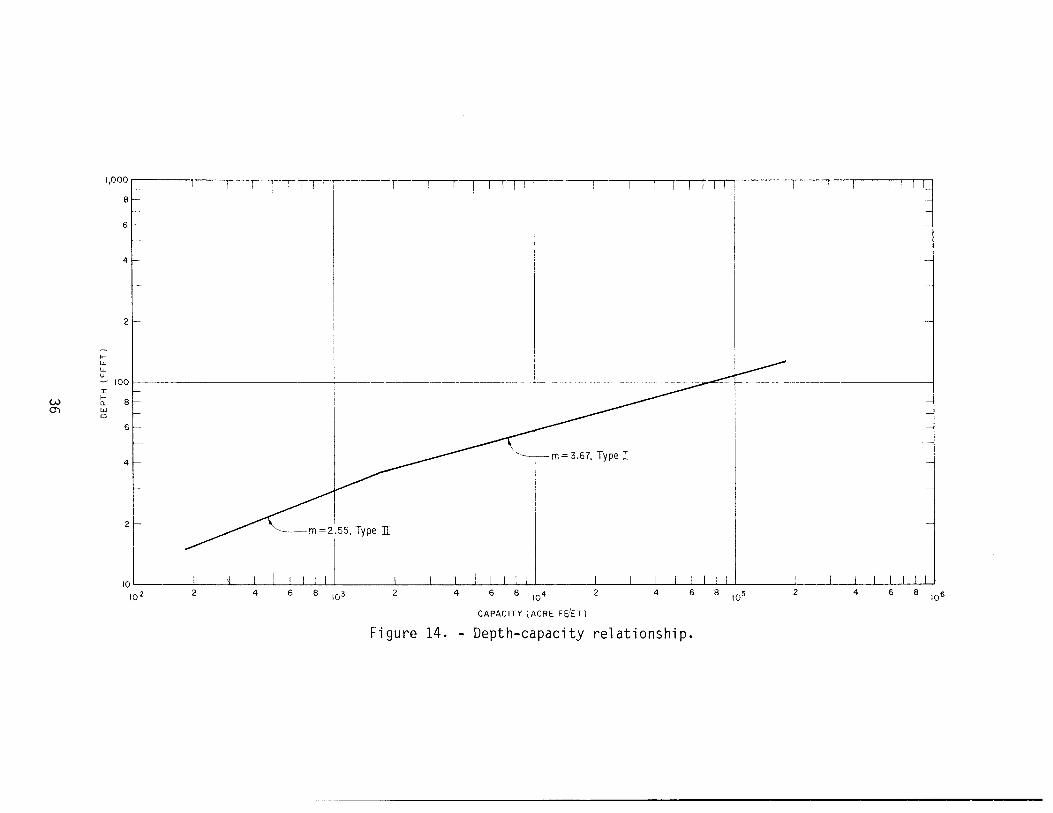
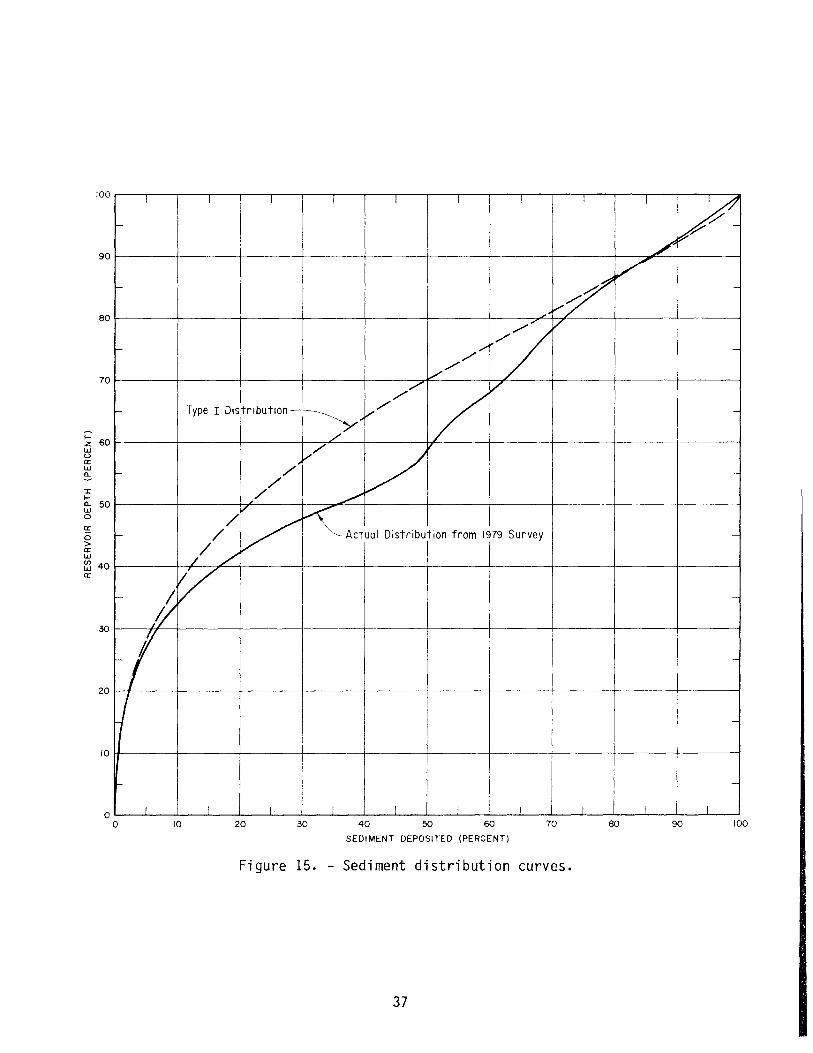
For further practical interest, a theoretical distribution of sediment in thereservoir was computed (table 1) using the Empirical Area-Reduction Method [1].*A sediment inflow volume of 29,151 acre-feet was assumed to be distributed.This volume was equal to the sediment volume measured by the 1979 survey.Plotting the depth-capacity relationship (fig. 14) using the original dataindicated the reservoir to be a type I [1]. Sediment distribution computa-tional results are retabulated in columns 8, 9, and 10 of table 2 for a typeI reservoir. These computations show the sediment would reach an elevationof 3086 feet, as compared to the elevation of 3115 feet determined frdm the1979 survey. The sediment distribution curves on figure 15 show how theactual distribution compares with the theoretical distribution of atype I reservoir. The curves show percentages of depth plotted againstsediment deposited. The greatest differences in the actual and type I curveslie between the 45 to 70 percent depths.
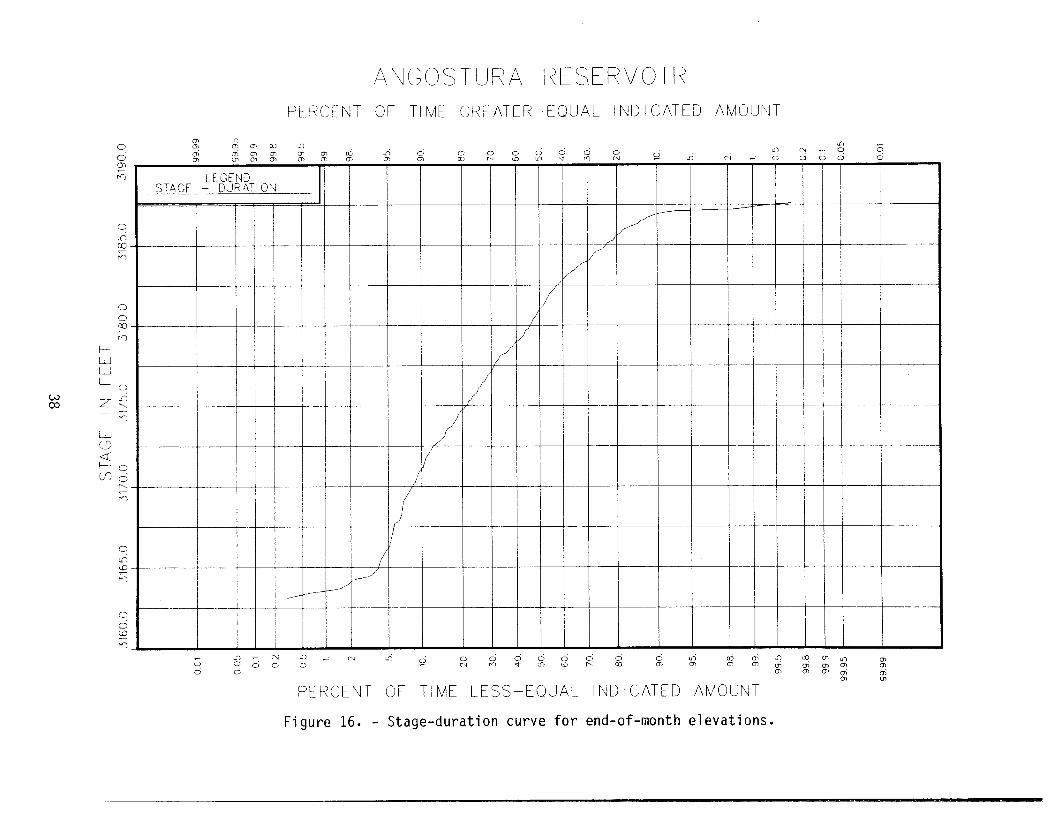
Using the end-of-month data (fig. 5), a stage-duration curve (fig. 16)was derived. This relationship is useful in classifying the reservoir forcomputing sediment distribution. It may also be used in predicting thedelta formation of a reservoir [1]. For delta computations, data from thecurve are used to determine the pivot point (where the topset and foreset beds
* Numbers in brackets refer to items in the bibliography.
6
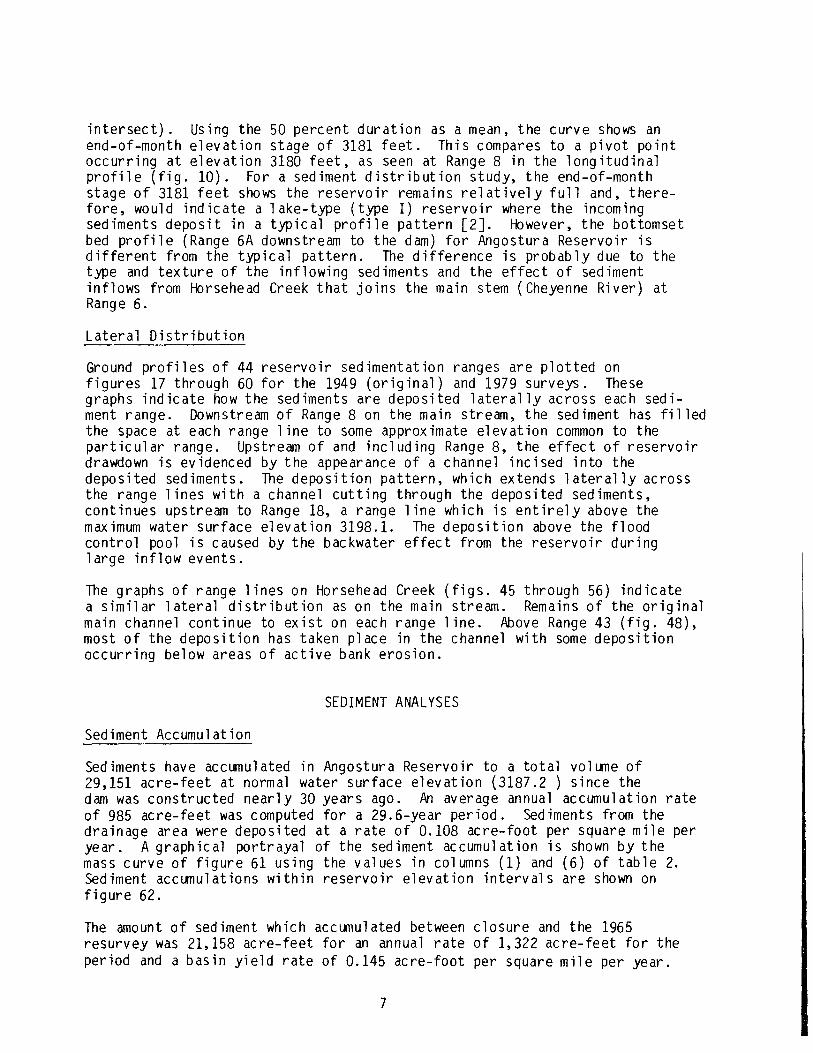
intersect). Using the 50 percent duration as a mean, the curve shows anend-of-month elevation stage of 3181 feet. This compares to a pivot pointoccurring at elevation 3180 feet, as seen at Range 8 in the longitudinalprofile (fig. 10). For a sediment distribution study, the end-of-monthstage of 3181 feet shows the reservoir remains relatively full and, there-fore, would indicate a lake-type (type I) reservoir where the incomingsediments deposit in a typical profile pattern [2]. However, the bottomsetbed profile (Range 6A downstream to the dam) for Angostura Reservoir isdifferent from the typical pattern. The difference is probably due to thetype and texture of the inflowing sediments and the effect of sedimentinflows from Horsehead Creek that joins the main stem (Cheyenne River) atRange 6.
Lateral Distribution
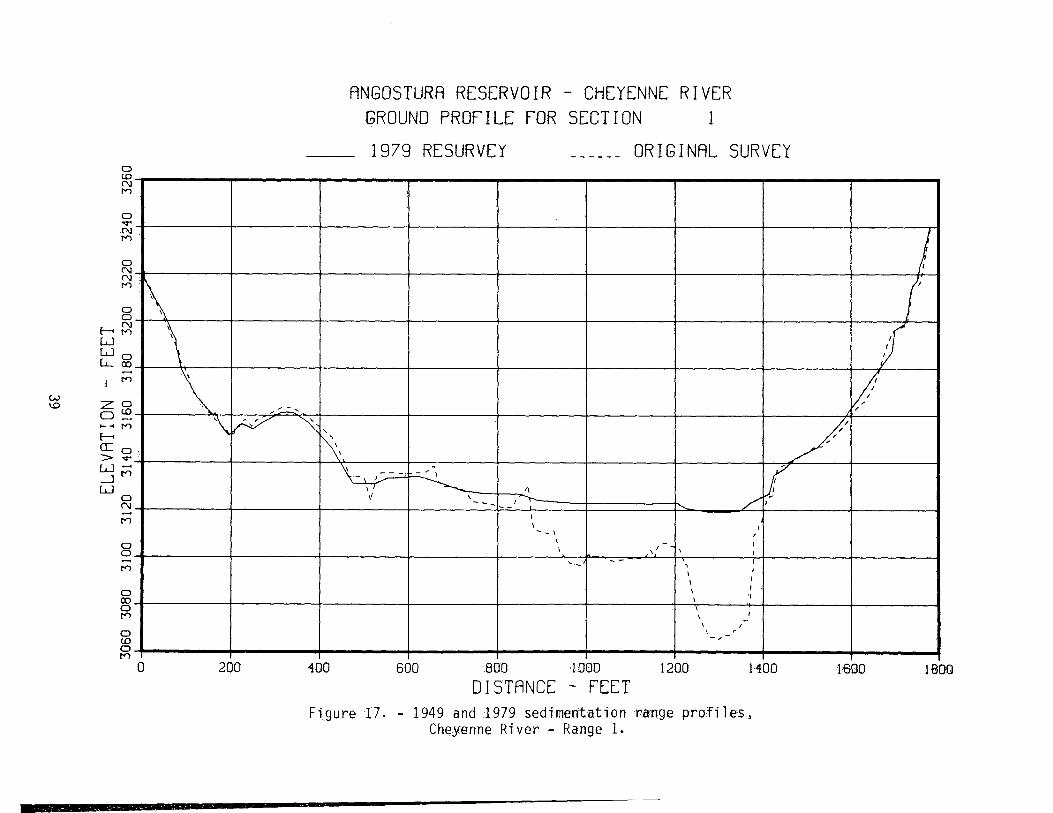
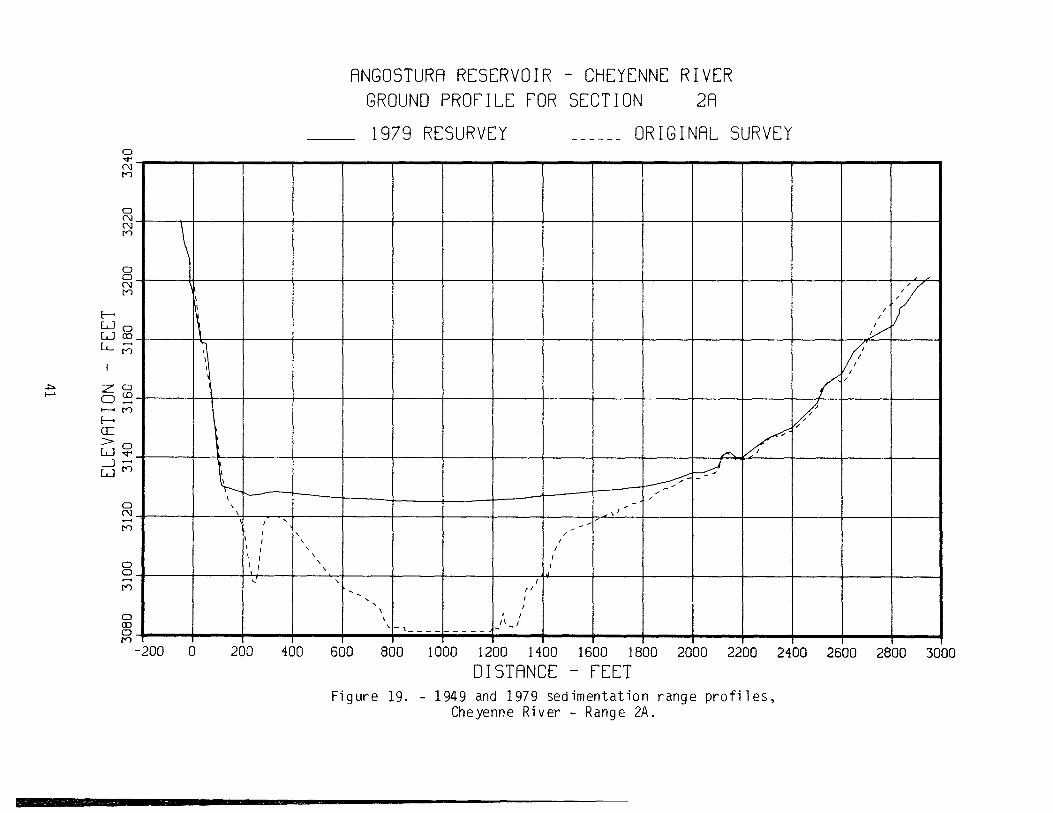
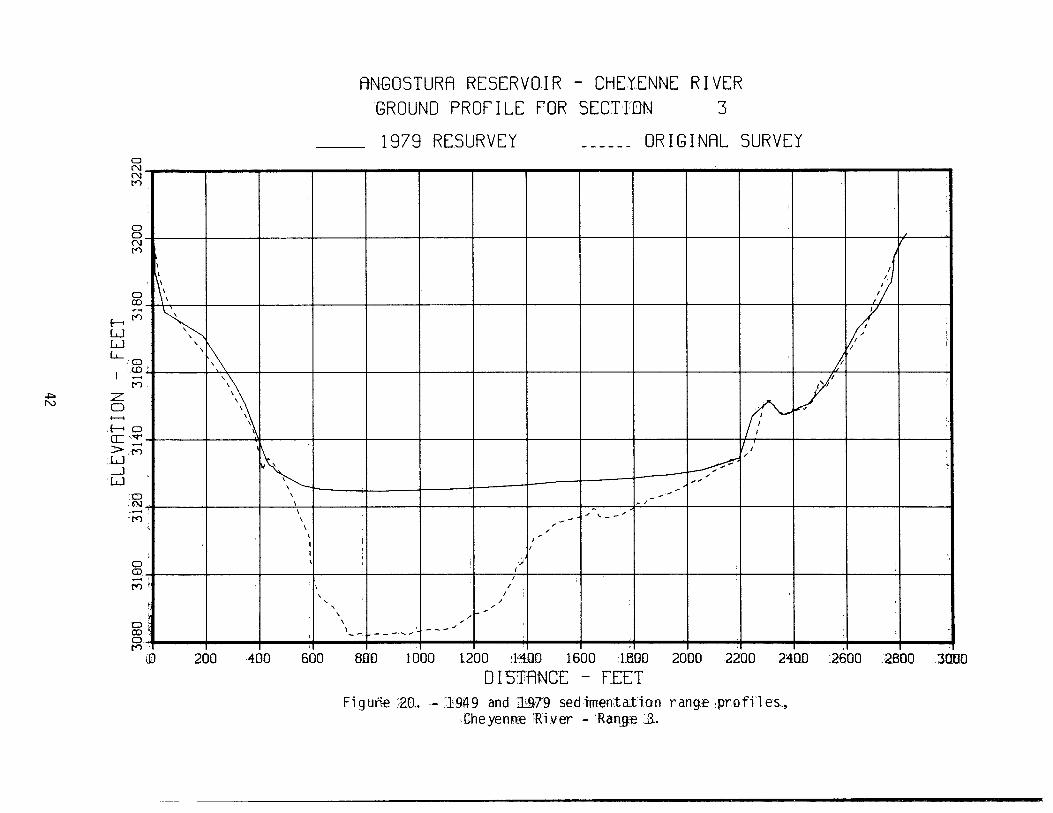
Ground profiles of 44 reservoir sedimentation ranges are plotted onfigures 17 through 60 for the 1949 (original) and 1979 surveys. Thesegraphs indicate how the sediments are deposited laterally across each sedi-ment range. Downstream of Range 8 on the main stream, the sediment has filledthe space at each range line to some approximate elevation common to theparticular range. Upstream of and including Range 8, the effect of reservoirdrawdown is evidenced by the appearance of a channel incised into thedeposited sediments. The deposition pattern, which extends laterally acrossthe range lines with a channel cutting through the deposited sediments,continues upstream to Range 18, a range line which is entirely above themaximum water surface elevation 3198.1. The deposition above the floodcontrol pool is caused by the backwater effect from the reservoir duringlarge inflow events.
The graphs of range lines on Horsehead Creek (figs. 45 through 56) indicatea similar lateral distribution as on the main stream. Remains of the originalmain channel continue to exist on each range line. Above Range 43 (fig. 48),most of the deposition has taken place in the channel with some depositionoccurring below areas of active bank erosion.
SEDIMENT ANALYSES
Sediment Accumulation
Sediments have accumulated in Angostura Reservoir to a total volume of29,151 acre-feet at normal water surface elevation (3187.2 ) since thedam was constructed nearly 30 years ago. An average annual accumulation rateof 985 acre-feet was computed for a 29.6-year period. Sediments from thedrainage area were deposited at a rate of 0.108 acre-foot per square mile peryear. A graphical portrayal of the sediment accumulation is shown by themass curve of figure 61 using the values in columns (1) and (6) of table 2.Sediment accumulations within reservoir elevation intervals are shown onfigure 62.
The amount of sediment which accumulated between closure and the 1965resurvey was 21,158 acre-feet for an annual rate of 1,322 acre-feet for theperiod and a basin yield rate of 0.145 acre-foot per square mile per year.
7
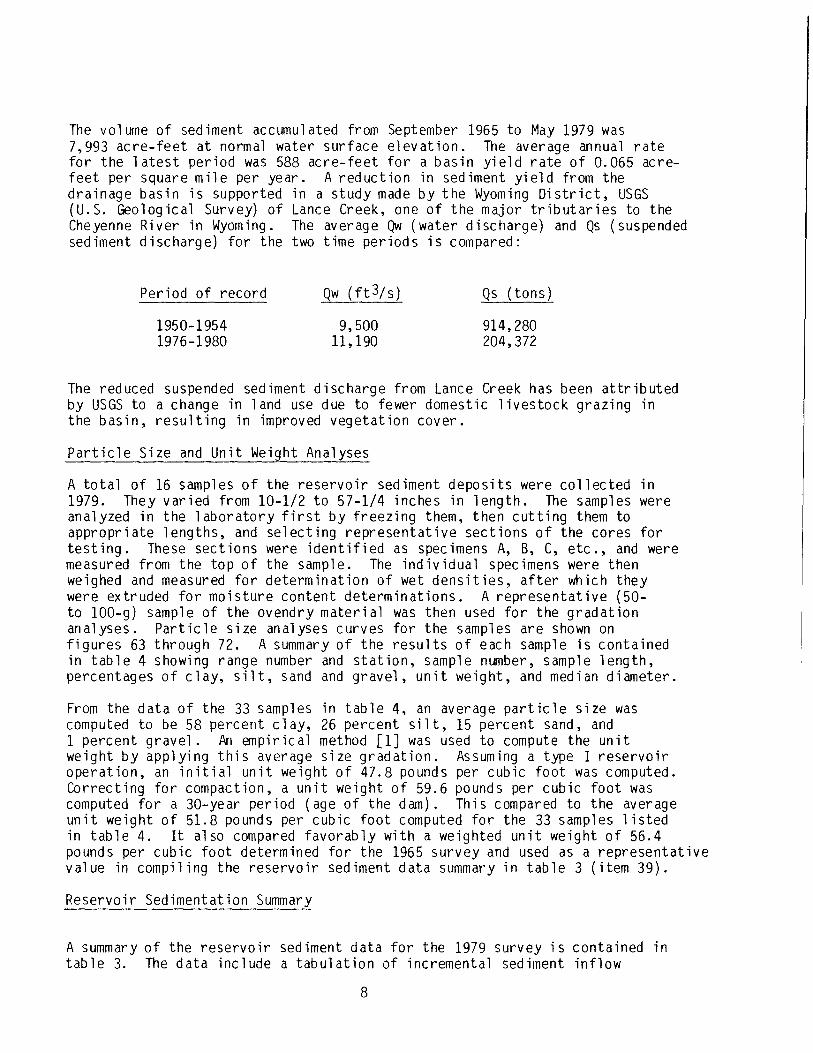
The volume of sediment accumulated from September 1965 to May 1979 was7,993 acre-feet at normal water surface elevation. The average annual ratefor the latest period was 588 acre-feet for a basin yield rate of 0.065 acre-feet per square mile per year. A reduction in sediment yield from thedrainage basin is supported in a study made by the Wyoming District, USGS(U.S. Geological Survey) of Lance Creek, one of the major tributaries to theCheyenne River in Wyoming. The average Qw (water discharge) and Qs (suspendedsediment discharge) for the two time periods is compared:
Period of record Qw (ft3/s) Qs (tons)
1950-1954 9,500 914,2801976-1980 11,190 204,372
The reduced suspended sediment discharge from Lance Creek has been attributedby USGS to a change in land use due to fewer domestic livestock grazing inthe basin, resulting in improved vegetation cover.
Particle Size and Unit Weight Analyses
A total of 16 samples of the reservoir sediment deposits were collected in1979. They varied from 10-1/2 to 57-1/4 inches in length. The samples wereanalyzed in the laboratory first by freezing them, then cutting them toappropriate lengths, and selecting representative sections of the cores fortesting. These sections were identified as specimens A, B, C, etc., and weremeasured from the top of the sample. The individual specimens were thenweighed and measured for determination of wet densities, after which theywere extruded for moisture content determinations. A representative (50-to 100-g) sample of the ovendry material was then used for the gradationanalyses. Particle size analyses curves for the samples are shown onfigures 63 through 72. A summary of the results of each sample is containedin table 4 showing range number and station, sample number, sample length,percentages of clay, silt, sand and gravel, unit weight, and median diameter.
From the data of the 33 samples in table 4, an average particle size wascomputed to be 58 percent clay, 26 percent silt, 15 percent sand, and1 percent gravel . Pn npirical method [1] was used to compute the unitweight by applying this average size gradation. Assuming a type I reservoiroperation, an initial unit weight of 47.8 pounds per cubic foot was computed.Correcting for compaction, a unit weight of 59.6 pounds per cubic foot wascomputed for a 30-year period (age of the dam). This compared to the averageunit weight of 51.8 pounds per cubic foot computed for the 33 samples listedin table 4. It also compared favorably with a weighted unit weight of 56.4pounds per cubic foot determined for the 1965 survey and used as a representativevalue in compiling the reservoir sediment data summary in table 3 (item 39).
Reservoir Sedimentation Summar
A summary of the reservoir sediment data for the 1979 survey is contained intable 3. The data include a tabulation of incremental sediment inflow
8
vol uiie and sediment acciniulation computed for the periods between 1949(original) and the 1965 and 1979 surveys. These data and other informationin the table are valuable for future surveys and other reservoir sedimentinvestigations.
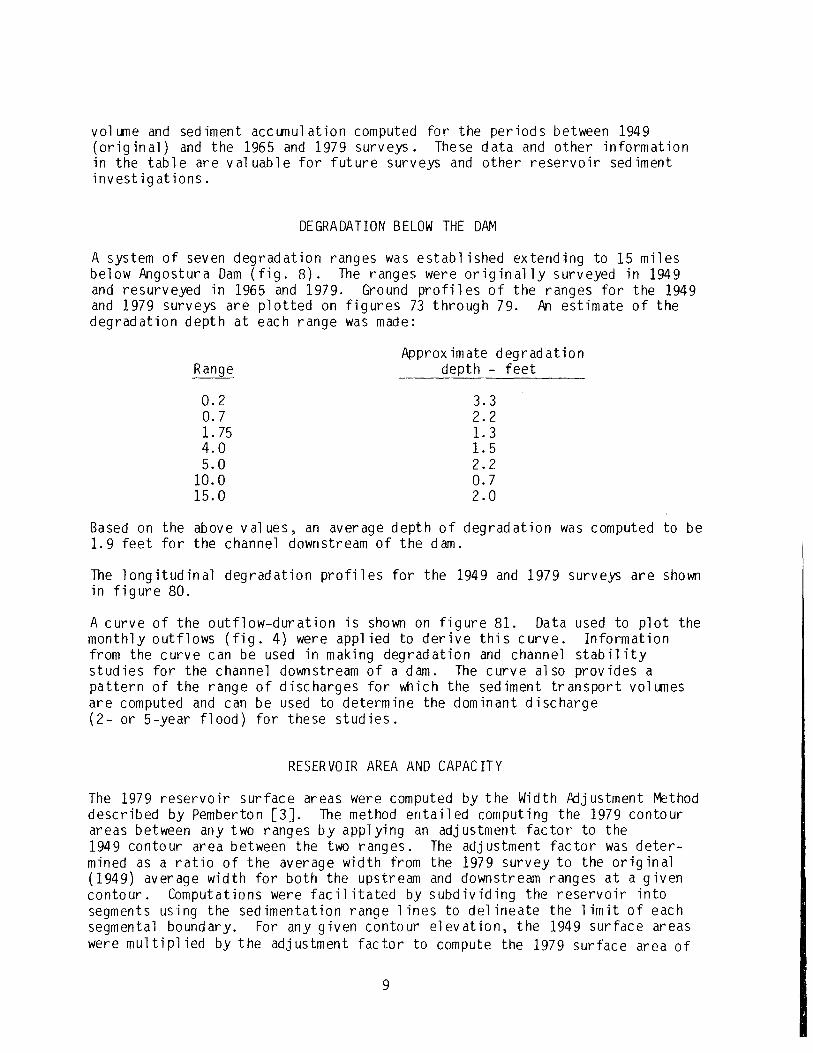
DEGRADATION BELOW THE DAM
A system of seven degradation ranges was established extending to 15 milesbelow Angostura Dam (fig. 8). The ranges were originally surveyed in 1949and resurveyed in 1965 and 1979. Ground profiles of the ranges for the 1949and 1979 surveys are plotted on figures 73 through 79. An estimate of thedegradation depth at each range was made:
Approximate degradationRange depth - feet
0.2 3.30.7 2.21.75 1.34.0 1.55.0 2.2
10.0 0.715.0 2.0
Based on the above val ues, an average depth of degradation was computed to be1.9 feet for the channel downstream of the dam.
The longitudinal degradation profiles for the 1949 and 1979 surveys are shownin figure 80.
A curve of the outflow-duration is shown on figure 81. Data used to plot themonthly outflows (fig. 4) were applied to derive this curve. Informationfrom the curve can be used in making degradation and channel stabilitystudies for the channel downstream of a dam. The curve also provides apattern of the range of discharges for which the sediment transport vol wiesare computed and can be used to determine the dominant discharge(2- or 5-year flood) for these studies.
RESERVOIR AREA AND CAPACITY
The 1979 reservoir surface areas were computed by the Width Mjustment Methoddescribed by Pemberton [3]. The method entailed computing the 1979 contourareas between any two ranges by applying an adjustment factor to the1949 contour area between the two ranges. The adjustment factor was deter-mined as a ratio of the average width from the 1979 survey to the original(1949) average width for both the upstream and downstream ranges at a givencontour. Computations were facilitated by subdividing the reservoir intosegments using the sedimentation range lines to delineate the limit of eachsegmental boundary. For any given contour elevation, the 1949 surface areaswere multiplied by the adjustment factor to compute the 1979 surface area of
9
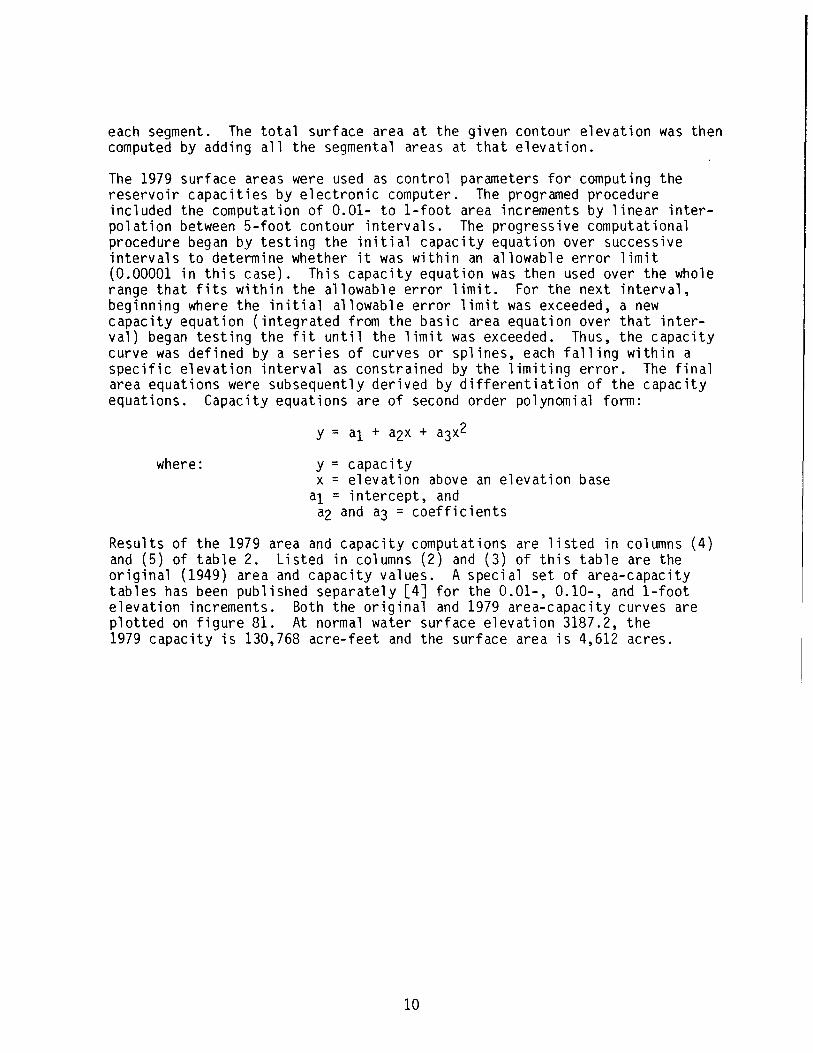
each segment. The total surface area at the given contour elevation was thencomputed by adding all the segmental areas at that elevation.
The 1979 surface areas were used as control parameters for computing thereservoir capacities by electronic computer. The programed procedureincluded the computation of 0.01- to 1-foot area increments by linear inter-polation between 5-foot contour intervals. The progressive computationalprocedure began by testing the initial capacity equation over successiveintervals to determine whether it was within an allowable error limit(0.00001 in this case). This capacity equation was then used over the wholerange that fits within the allowable error limit. For the next interval,beginning where the initial allowable error limit was exceeded, a newcapacity equation (integrated from the basic area equation over that inter-val) began testing the fit until the limit was exceeded. Thus, the capacitycurve was defined by a series of curves or splines, each falling within aspecific elevation interval as constrained by the limiting error. The finalarea equations were subsequently derived by differentiation of the capacityequations. Capacity equations are of second order polynomial form:
y = ai + a2x + a3x2
where: y = capacityx = elevation above an elevation baseal = intercept, anda and a = coefficients
Results of the 1979 area and capacity computations are listed in columns (4)and (5) of table 2. Listed in columns (2) and (3) of this table are theoriginal (1949) area and capacity values. A special set of area-capacitytables has been published separately [4] for the 0.01-, 0.10-, and 1-footelevation increments. Both the original and 1979 area-capacity curves areplotted on figure 81. At normal water surface elevation 3187.2, the1979 capacity is 130,768 acre-feet and the surface area is 4,612 acres.
10

BIBLIOGRAPHY
[1] Design of Small Dams, 2nd ed., Bureau of Reclamation, App. H, U.S.vernment Printing Office, Washington, D.C., 1973.
[2] Sedimentation Engineering, Piierican Society of Civil Engineers,ch. III B, 745 pages, New York, New York, 1977.
[3] Pemberton, E. L., "Survey and Prediction of Sedimentation in Reservoirs,"Application of Stochastic Processes in Sediment Transport, edited bylIT W. Shen and H. Kikkawa, ch. 15, Water Resourübliations,Littleton, Cob., 1980.
[4] "Mgostura Reservoir Area and Capacity Tables," Pick-Sloan MissouriBasin Program, UM Region, Bureau of Reclamation, July 1981.
11

Table 1. - Sediment distribution computations
ANGO$TURA RESERVOIR -- CHEYENNE RIVER -- TYPE IRESERVOIR SEDIMENT DEPOSITION STUDY
EMPIRICAL AREA REDUCTION METHODSEDIMENT INFLOW 29151.AF RESERVOIR TYPE I
ORI GINAL RELATIVE SEDI MENT REV ISEDELEV AREA CAPACITY DEPTH AREA AREA VOLUME AREA CAPACITY(Fl) (AC) (AF) (AC) (AF) (AC) (fl)3187.2 4841.0 159919. 1.000 OI000 0.0 29151. 4841.0 130768.3185.0 46500 149471. .982 1.149 275.3 28848. 4374.7 120623.3180.0 4210e0 127307. .941 1.628 389.9 27185. 3820.1 100122.317.0 3720.0 107474. .900 1.812 434.2 25125. 3285.8 82349.3170.0 3245.0 90082. .859 1.882 450.9 22912. 2794.1 67170.3165.0 2860.0 74845. .818 1.885 451.6 20656. 2408.4 54189.3160.0 2520.0 61401. .777 1.844 441.9 18422. 2078.1 42979.3155.0 2170.0 49677. .736 1.773 424.9 16255. 1745.1 33422.3150.0 1840.0 39669. .696 1.680 402.6 14186. 1437.4 25483.3145.0 1580.0 31118. .655 1.572 376.6 12238. 1203.4 18880.3140.0 1260.0 24030. .614 1.452 348.0 10427. 912.0 13603.3135.0 1065.0 18235. .573 1.326 317.6 8763. 747.4 9472.3130.0 835.0 13482. .532 1.194 286.2 7253. 548.8 6229.3125.0 630.0 9825. .491 1,062 254.3 5902. 375.? 3923.3120.0 441.0 716?. .450 .929 222.6 4710, 218.4 2457.3115.0 340.0 5236. .409 .799 191.5 3674. 148.5 1962.3110.0 266.0 3725. .368 .674 161.5 2792. 104.5 933.3105.0 193.0 2583. .327 .554 132.8 2056. 60.2 527.3100.0 152.0 1723. .286 .442 106.0 1459. 46.0 264.3095.0 99.0 1097, .245 .339 81.3 991. 17.? 106.3090.0 77.0 659. .205 .24? 62.5 632. 14.5 2?.3086.0 46.0 416. .172 .182 46.0 416. 0.0 0.3085.0 38.0 373. .164 .166 38.0 373. 0.0 0.3080.0 22.0 230. .123 .099 22.0 230. 0.0 0.3075.0 18.0 128. .082 .048 12.0 128. 0.0 0.3070.0 16.0 42. .041 .013 16.0 42. 0.0 0.3065.0 0.0 0. 0.000 0.000 0.0 0. 0.0 0.
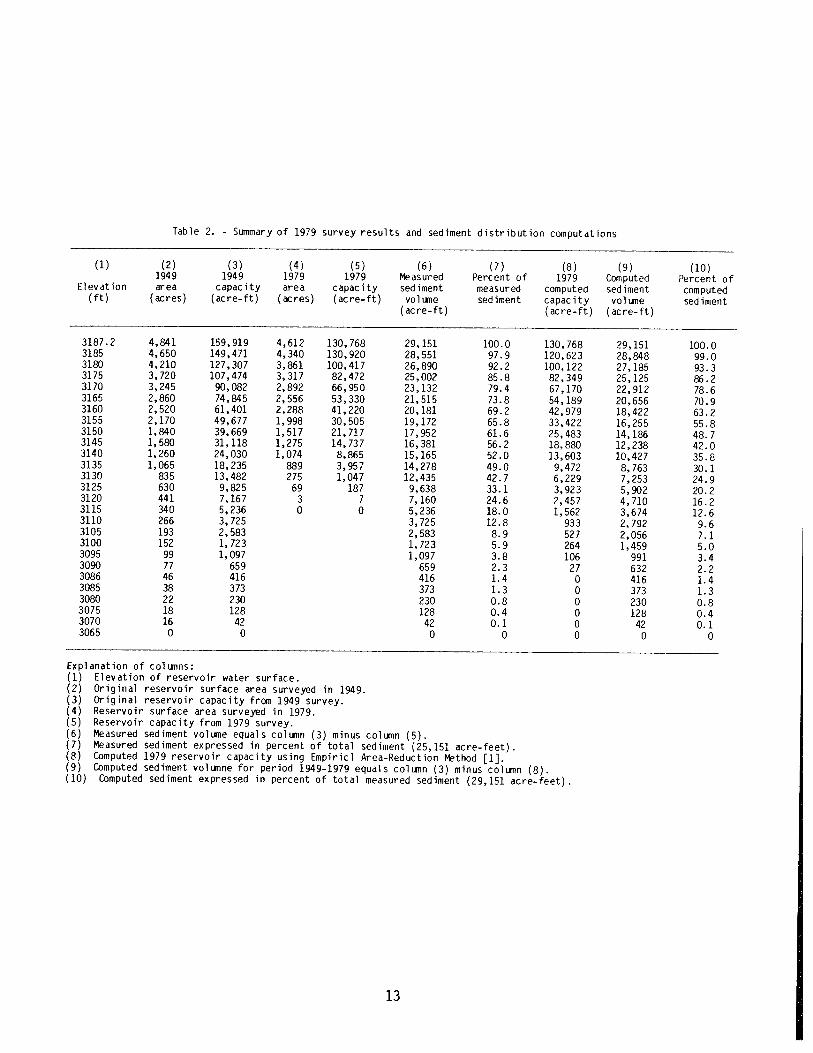
Table 2. - Summary of 1979 survey results and sediment distribution computations
(1)
Elevation(ft)
(2)1949area
(acres)
(3)1949
capacity(acre-ft)
(4)1979area
(acres)
(5)1979
capacity(acre-ft)
(6)Measuredsedimentvolume(acre-ft)
(7)Percent ofmeasuredsediment
(8)1979
computedcapacity(acre-ft)
(9)Computedsedimentvolume(acre-ft)
(10)Percent ofcomputedsediment
3187.2 4,841 159,919 4,612 130,768 29,151 100.0 130,768 29,151 100.03185 4,650 149,471 4,340 130,920 28,551 97.9 120,623 28,848 99.03180 4,210 127,307 3,861 100,417 26,890 92.2 100,122 27,185 93.33175 3,720 107,474 3,317 82,472 25,002 85.8 82,349 25,125 86.23170 3,245 90,082 2,892 66,950 23,132 79.4 67,170 22,912 78.63165 2,860 74,845 2,556 53,330 21,515 73.8 54,189 20,656 70.93160 2,520 61,401 2,288 41,220 20,181 69.2 42,979 18,422 63.23155 2,170 49,677 1,998 30,505 19,172 65.8 33,422 16,255 55.83150 1,840 39,669 1,517 21,717 17,952 61.6 25,483 14,186 48.73145 1,580 31,118 1,275 14,737 16,381 56.2 18,880 12,238 42.03140 1,260 24,030 1,074 8,865 15,165 52.0 13,603 10,427 35.83135 1,065 18,235 889 3,957 14,278 49.0 9,472 8,763 30.13130 835 13,482 275 1,047 12,435 42.7 6,229 7,253 24.93125 630 9,825 69 187 9,638 33.1 3,923 5,902 20.23120 441 7,167 3 7 7,160 24.6 2,457 4,710 16.23115 340 5,236 0 0 5,236 18.0 1,562 3,674 12.63110 266 3,725 3,725 12.8 933 2,792 9.63105 193 2,583 2,583 8.9 527 2,056 7.13100 152 1,723 1,723 5.9 264 1,459 5.03095 99 1,097 1,097 3.8 106 991 3.43090 77 659 659 2.3 27 632 2.23086 46 416 416 1.4 0 416 1.43085 38 373 373 1.3 0 373 1.33080 22 230 230 0.8 0 230 0.83075 18 128 128 0.4 0 128 0.43070 16 42 42 0.1 0 42 0.13065 0 0 0 0 0 0 0
Expi anation of columns:(1) Elevation of reservoir water surface.(2) Original reservoir surface area surveyed in 1949.(3) Original reservoir capacity from 1949 survey.(4) Reservoir surface area surveyed in 1979.(5) Reservoir capacity from 1979 survey.(6) Measured sediment volume equals column (3) minus column (5).(7) Measured sediment expressed in percent of total sediment (25,151 acre-feet).(8) Computed 1979 reservoir capacity using Empiricl Area-Reduction Method [1).(9) Computed sediment volumne for period 1949-1979 equals column (3) minus column (8).(10) Computed sediment expressed in percent of total measured sediment (29,151 acre-feet)
13
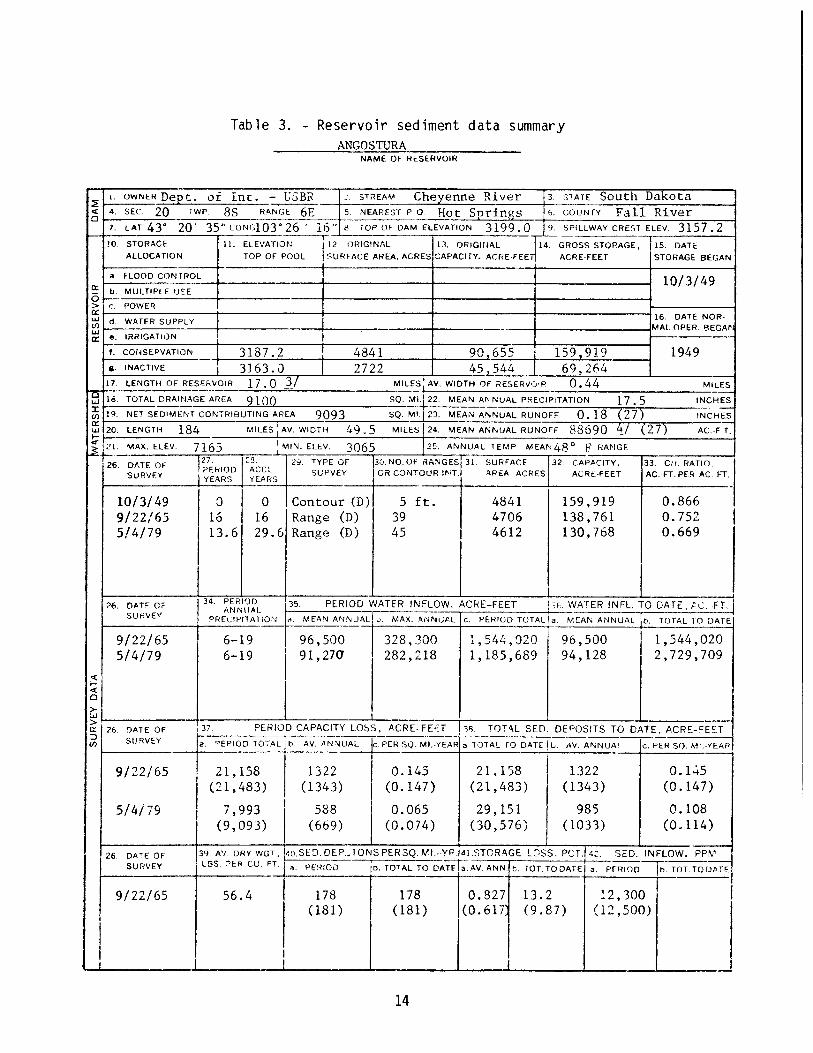
Table 3. - Reservoir sediment data summary
ANCOSTURANAME OF RESERVOIR
_
t. OWNER Dept. of Inc. - USBP z. STREAM Cheyenne River STATE South Dakota4. SEC. 20 TWP, 8S RANGE 6E I - NEAREST P 0 Hot Springs 6. COUNTY Fall River7. LAT 4V 20' 35'oNGlO326 '_16j _JOPOFDAM ELEVATION__3199.0 J SPILLWAYCRESTELEV. 3157.2
- O. STORAGE 11. ELEVATIOFJ 12 ORIGINAL 13. ORIGINAL 14. GROSS STORAGE, 1 15. DATEALLOCATION TOP OF POOL SURFACE AREA, ACRES CAPACITY. ACRE-FEE ACRE•FEET STORAGE BEGAN
a. FLOOD CONTROL______________ _______________ 10/3/49
0ti. MULTIPLE USE-
______________ ________________
> C. PO'NER
d. WATER SUPPLY_________________ __________________
16. DATE NOR-MAL OPER BEGAF
e. IRRIGATION -
________ ___________________ .
f. CONSERVATION 3187.2 4841 90,655 159,919 1949. INACTIVE 3163.3 2722 45,544 69,2E'4
__________
17. LENGTH OF RESERVOIR 17 .0 3/ MILES AV. WIDTH OF RESERVOP 0.44 MILES
1. TOTAL DRAINAGE AREA 1 SQ. MI. 22. MEAN ANNUAL PRECIPITATION 17 .5 INCHES
19. NET SEDIMENT CONTRIBUTING AREA 9093 SQ. MI. 23. MEAN ANNUAL RUNOFF 0. 18 (27) INCHES
20. LENGTH 184 M!I.ES AV. WIDTH 49.5 MILES 24. MEAN ANNUAL RUNOFF 88690 J (27) AC-FT.
21. MAX. ELEY. 7165 MIN. ELEV. 3065 25. ANNUAL TEMP MEAN48° F RANGE
26 DATE OF27. 23. 2Y. TYPE OF 30. NO. OF RANGES 31. SURFACE 32. CAPACITY, 33. C/I. RATIO.
SURVEY SURVEY OR CONTOUR NT. APEA ACRES ACRE-FEET AC.-FT. PER AC. FT.
10/3/49 0 0 Contour CD) 5 ft. 4841 159,919 0.8669/22/65 16 16 Range (D) 39 4706 138,761 0.7525/4/79 13.6 29.6 Range (D) 45 4612 130,768 0.669
26. DATE OF ANNIIAI35. PERIOD WATER INFLOW, ACRE-FEET . WATER INFL, TO DATE, C. FT.
SURVEY °REC?PITA1ON a. MEAN_ANNUAL 1b. MAX. ANNUAL C. PERIOD TOTAL a. MEAN ANNUAL b. TOTAL 10 DATE
9/22/65 6-19 96,500 328,300 1,544,020 96,500 1,544,0205/4/79 6-19 I 91,270 282,..18 1,185,689 94,128 2,729,709
I-
0
>-
26. DATE OF 37. PERIOD CAPACITY LOSS, ACRE-FEET . TOTAL SED. DEPOSITS TO DATE, ACRECEETSURVEY a. EPIOD TOTAL b.AV..ANNUAL :. PER SQ. Mt.-YEAR a TOTAL 10 DATE L. NV. ANNUAl c.PER SQ. Mt.-YEAP
9/22/65 21,158 1322 0.145 21,158 1322 0.15(21,483) (1343) (0.147) (21,483) (1343) (0.147)
5/4/79 7,993 588 0.065 29,151 985 0.108(9,093) (669) (0.074) (30,576) (1033) (0.114)
26. DATE OF 39. AV. DRY WGT.. 40.SED.DEP..TONSPERSQ. Mt-YR. 41.STORAGE LC1SS. POT. 42. SED. INFLOW. PPMSURVEY LBS. ?ER CU. FT. PERIOD o. TOTAL TO DATE a.AV ANN. b.TOT.TODATE a. PERI0D"J . TOT.TO DATE
9/22/65 56.4 178 178 0.827 13.2 12,300
-t _____________________ - 1
(181)
. ___________________
(181)
_____
(0.617
- .1
(9.87)
. ________________
(12,500)
________________ _____________-.
14
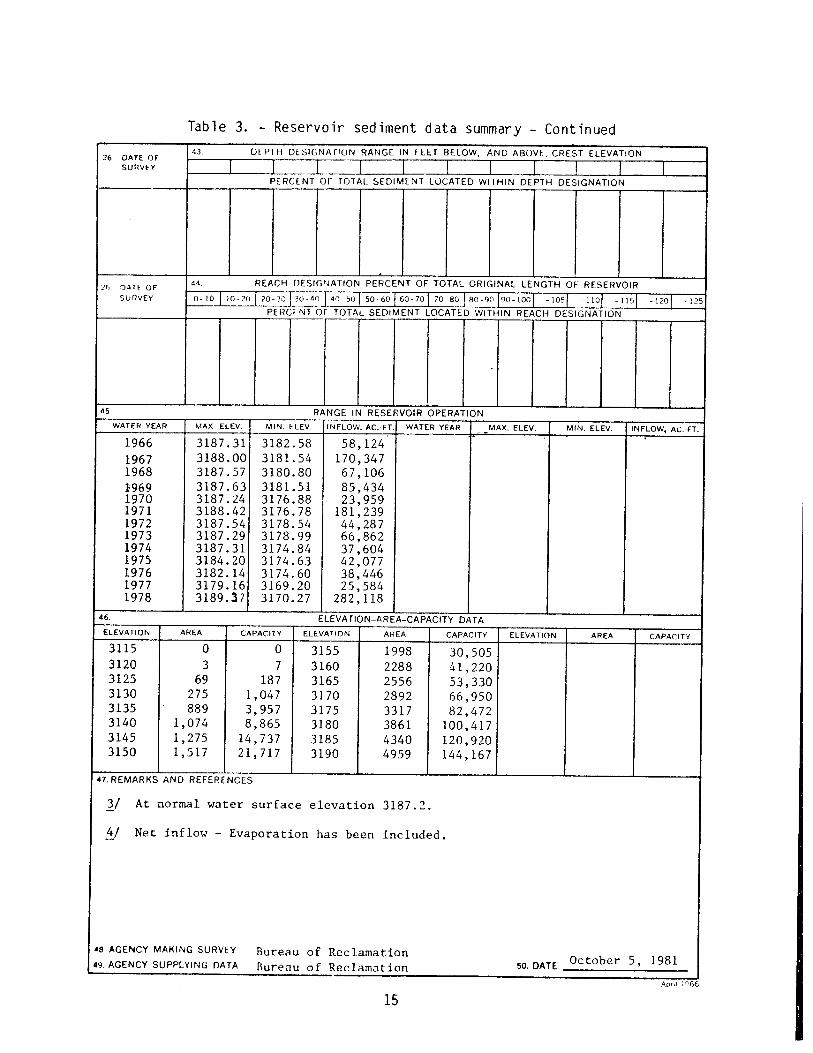
Table 3. - Reservoir sediment data summary - Continued
_26. DATE OF
43 DEPTH DESIGNATION RANGE IN FEET BELOW, AND ABOVE, CREST ELEVATION
SURVEY I ,,,,,L__ I I IPERCENT OF TOTAL SEDIMENT LOCATED WITHIN DEPTH DESIGNATION
26 DATE OF REACH DESIGNATION PERCENT OF TOTAL ORIGINAL LENGTH OF RESERVOIR
SURVEY 0-10 J 10-2012030! 50-60 60-701 70-60 80-0 f90Ioo] -1051 -1101 -1151 _120J -125
____________ PERCENT OF TOTAL SEDIMENT LOCATED WITHIN REACH DESIGNATION
45 RANGE IN RESE VOIR OPERATIONWATER YEAR MAX ELEV. MIN. ELEV. INFLOW, AC-FT. WATER YEAR - MAX. ELEV. MIN. ELEV. INFLOW, AC-FT.
1966 3187.31 3182.58 58,124' - -
1967 3188.00 3181.54 170,3471968 3187.57 3180.80 67,106969 3187.63 3181.51 85,4341970 3187.24 3176.88 23,9591971 3188.42 3176.78 181,2391972 3187.54 3178.54 44,2871973 3187.29 3178.99 66,8621974 3187.31 3174.84 37,6041975 3184.20 3174.63 42,0771976 3182.14 3174.60 38,4461977 3179.16 3169.20 25,5841978 3189.37 3170.27 282,118
46. ELEVATION-AR EA-CAPACITY DATAELEVATION AREA CAPACITY ELEVATION AREA CAPACITY I ELEVATION AREA CAPACITY
3115 0 0 3155 1998 30,5053120 3 7 3160 2288 41,2203125 69 187 3165 2556 53,3303130 275 1,047 3170 2892 66,9503135 889 3,957 3175 3317 82,4723140 1,074 8,865 3180 3861 100,4173145 1,275 14,737 3185 4340 120,9203150 1,517 21,717 3190 4959 144,167
47. REMARKS AND REFERENCES
3/ At normal water surface elevation 3187.2.
4/ Net inflow - Evaporation has been included.
48. AGENCY MAKING SURVEY Bureau of Reclamation49. AGENCY SUPPLYING DATA Bureau of Reclamation 50. DATE October 5, 1981
Aprd
15
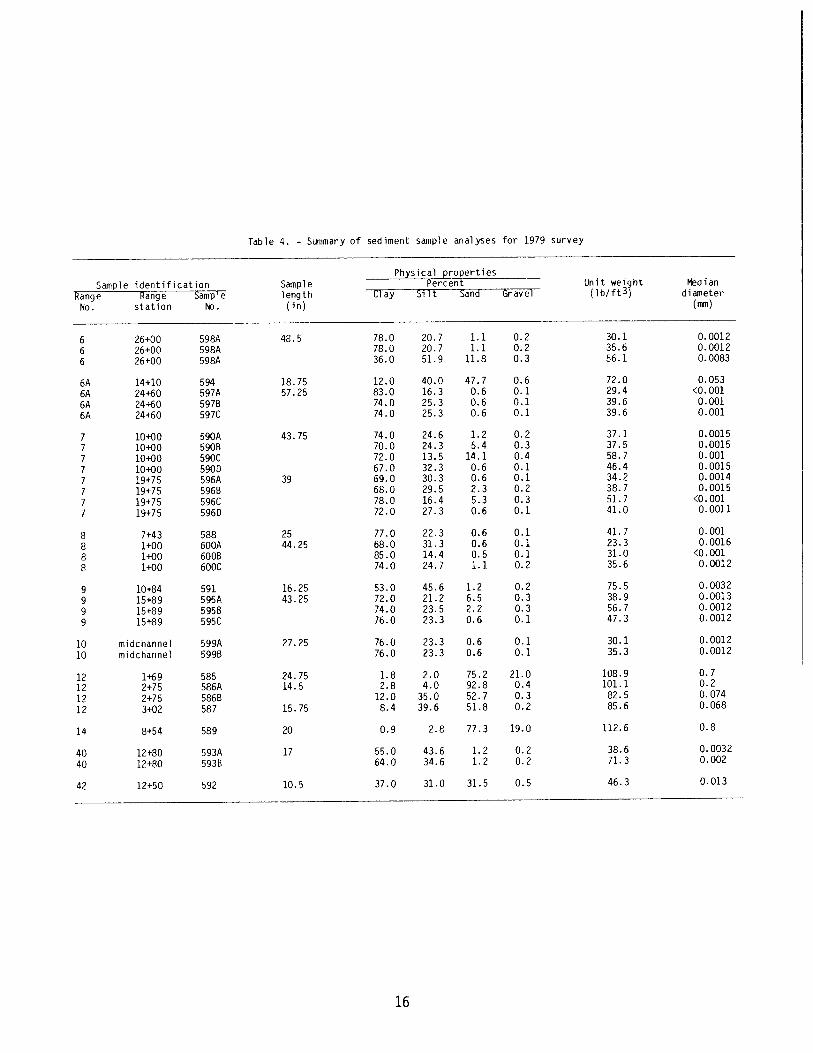
Table 4. - Summary of sediment sample analyses for 1979 survey
Physical propertiesSample identification Sample Percent Unit weight Nodian
Range Sample length Clay Silt Sand Gravel (lb/ft3) diameter
No. station No. (in) (m)
6 26+00 598A 48.5 78.0 20.7 1.1 0.2 30.1 0.0012
6 26+00 598A 78.0 20.7 1.1 0.2 35.6 0.0012
6 26+00 5994 36.0 51.9 11.8 0.3 56.1 0.0083
6A 14+10 594 18.75 12.0 40.0 47.7 0.6 72.0 0.0536A 24+60 597A 57.25 83.0 16.3 0.6 0.1 29.4 <0.0016A 24+60 597B 74.0 25.3 0.6 0.1 39.6 0.001
6A 24+60 597C 74.0 25.3 0.6 0.1 39.6 0.001
7 10+00 590A 43.75 74.0 24.6 1.2 0.2 37.1 0.0015
7 10+00 5908 70.0 24.3 5.4 0.3 37.5 0.0015
7 10400 590C 72.0 13.5 14.1 0.4 58.7 0.001
7 10+00 590D 67.0 32.3 0.6 0.1 46.4 0.0015
7 19+75 596A 39 69.0 30.3 0.6 0.1 34.2 0.0014
7 19+75 5968 68.0 29.5 2.3 0.2 38.7 0.0015
7 19+75 596C 78.0 16.4 5.3 0.3 51.7 <0.001
7 19+75 5960 72.0 27.3 0.6 0.1 41.0 0.0011
8 7+43 588 25 77.0 22.3 0.6 0.1 41.7 0.001
8 1+00 600A 44.25 68.0 31.3 0.6 0.1 23.3 0.0016
8 1+00 600B 85.0 14.4 0.5 0.1 31.0 <0.001
8 1+00 6000 74.0 24.7 1.1 0.2 35.6 0.0012
9 10+84 591 16.25 53.0 45.6 1.2 0.2 75.5 0.0032
9 15+89 595A 43.25 72.0 21.2 6.5 0.3 38.9 0.0013
9 15+89 5958 74.0 23.5 2.2 0.3 56.7 0.0012
9 15+89 595C 76.0 23.3 0.6 0.1 47.3 0.0012
10 rnidchannel 599A 27.25 76.0 23.3 0.6 0.1 30.1 0.0012
10 midchannel 5998 76.0 23.3 0.6 0.1 35.3 0.0012
12 1+69 585 24.75 1.8 2.0 75.2 21.0 108.9 0.7
12 2+75 586A 14.5 2.8 4.0 92.8 0.4 101.1 0.2
12 2+75 5868 12.0 35.0 52.7 0.3 82.5 0.074
12 3+02 587 15.75 8.4 39.6 51.8 0.2 85.6 0.068
14 8+54 589 20 0.9 2.8 77.3 19.0 112.6 0.8
40 12+80 593A 17 55.0 43.6 1.2 0.2 38.6 0.0032
40 12+80 5938 64.0 34.6 1.2 0.2 71.3 0.002
42 12+50 592 10.5 37.0 31.0 31.5 0.5 46.3 0.013
16

Space intentionally left blank due to security concerns
w
C-)4
§a>
UU,U
4
DC-(C)0
24
0-JU-z
Figure 2. - Monthly inflow to Angostura Reservoir - Sheet 1 of 3.
61
INF
LO
W T
O A
NG
OS
TU
RA
RE
SE
RV
OIR
-I,0
00 A
CR
E-F
EE
T
m (a -S CD
0 c-t-
0 C-,-
0 (a 0 tO C-,
-
-S CD
(0 CD -S a -S.
(I, CD CD N)
0 0
f.-
IT
fl
IT
T 4
ft
• -
-f*
--
4*
----
-k-
--
-- .--
---
.-- -
-.--
--
ft
a-
---
*t
*_*
*-, -
F*
-t
*F
- -
--
-;;:
-tt
'-
- ii-t
:r
- -
_-
_*_
*F
*-
_*
-.
--
--
--
-4
--
T
.f
---
--
- --
r-
F
.- -- -
- --
*-
. -*--
-*-
-
*
-*-1
_
-- *_
__
-_1-
__*_
* F-- '
_*___-
*
_F-*
__*
--
- -
--
F-*-
F*
- *_*-
*
-.
--
--
- :
--
-
F-
.-
.r
.-
-.
F
*- -*
--
-rr
FF
-ff
-
-___-
--
--
*-*-
*
-4
4FF
-
_______
-F
---
___-
•4.
---
---
--
--
---
-
4
_-
--*
I-
-+
_-
F--
IF
F___
F.L
:--
*--
---.
-___
of
-F
--
o__
----
--
FF
F+
*-
-_
--,
I____
___.
-
F 5
--
-.
---
*---
F
-
a_ •
__
__
-
-
:--
__
_F
_
_
-
____
___
-
-
m-
-T
--
-
--- -•
__
;
L++
çi4tir
-
iiii
L:
F5
_-
FF
___
-
- *
-I-
•-••
•__
5*5
__
-__--
___
__
___
--
4F
- -
-- F
a-
•-
-
-- -
___
--
i-
-F
--
-
-
-I
FF
+-
--
. -
44t4
1441
44.
4144
41
--
tn
--
-45F
--,
FF
a--
___
___-
¶
__ +
F¶
*F
-a
TF
--
--
---
-,*
F-
a
-
-.
-44
4141
41-
- F
S
*F
-*
t¶
-t
-*-
-- *
F- *
a-I
F4
*-
*
:F-
I ¶
--
-I, -s CD 0 -h
0 0 0 -5 CD 'I,
CD -s 0 1 (/1
CD CD 0 -h
()
INFLOW TO ANGOSTURA RESERVOIR- 1,000 ACRE-FEET
U'0)
0)0
00
00
00
8
LiJuJL
Lii
z
__UJOocY-
'Ii00
IC
IC0
ANCOSTUHA PESEEVOE NFLOW - CHEYENNE HVERPERCENT OF TIME CREATEREQUAL INDtCATED AMOUNT
CO aJ C
QO C C C 0 C 0 C 0 0 C C 9 9 0 90 0 0 0 0 0 0 0 C C C C C C 0 0 0 0 0
LEGENDINFLOW - DURA11ON
- C C C (N " d 0 d 0 d d d c3 d Li a o9 2 0 0 0 0 C C C C 0 0 0 0 0 0 0 0o 0 0 0 0
0 0
PERCENT OF TIME LESS-EQUAL NDICATED AMOUNT
Figure 3. - Inflow-duration curve for monthly inflow discharges.

lb
100
90
8cU-UJ
U
070
60
50
4C
0-JU-
3C0
20
IC
C
+ l i
t __ I I I
__ __ __ __ I I
__Th +± __ __ __
__
-
__
_
____
___
L ffH _ iti t t H
LH
__ __ _____
4 t I 1 t H i i I
I HH 4 _ _ t t _
950 1951 952 I95 954 1955 956 957 958 959
Figure 4. - Monthly outflow from Angostura Reservoir - Sheet 1 of 3.
90
80
6C
N 5C
4C
liii!f.______ -___
-
-
••• •__ ___ __
-+
LT HIHt1 Hi-t
t1 : ii
_____________ ____________ ____________ ____________ ____________ _____________ ____________ ____________
1160 [ I96 1962 1963 1964 965 1966 1967 1968 1969
Figure 4. - Monthly outflow from Angostura Reservoir - Sheet 2 of 3.

tic
bc
SC
80
1I
U400700
60
4
50
z4
r30
0
2C
IC
0
jniiTHth !jl__ __ __ __ __ __ ____Th --- _-1-- - - 4 - ___ _7'• ____
T1____ tr r -
____4..4 2L
____+. ____ ----- :-:
________-+ -,---4-_-4. ----------- - - -
__+JtJi __
---t Tr- Hl____ ____
- -
__________ _________ ________ 1fl __________ ____ _________ __________
970 1971 972 1973 1974 19Th 1976 1977 1978 1979
Figure 4. - Monthly outflow from Angostura Reservoir - Sheet 3 of 3.
N.)71
Figure 5. - End-of-month Pngostura Reservoir elevation- Sheet 1 of 3.
I'.)
3200
3&90
I-
e0
z0
> I70w-JU,
L60U,U,
z
3140
3l30U,
320
3140
- -
t 4 T r II
{ [ - T
. ru r .
1 H i ft . . ..
l
H I I ±
; t , ! ' - - :- -- _i i
i-i-i - f- - T • : j . 1 r L H H H H
z- -- - H
-
- ± - - I I
I- I L - -t -I t
- - 1- t 4, .
_l_l_ _{-f . - 4 t-
' 4 t i
; H 1 i t h r
-.-4 1 F T f_ _: i I
l
'
-t 4- -,- t - *_ r L
d -: t h i 1
L H L J Fi fII U 1 t tr I I ' H - j H
1960 1961 %2 963 964 t96 966 967 968 4969
Figure 5. - End-of-month Angostura Reservoir elevation - Sheet 2 of 3.
I\)'-.4
32C
319
I-ww 31 B
3l7
316<
315(U,0
3I4C
3130w
3120
3110
*UI _ _ __
o j i__ __
ti i i tt i Ttr Tt ffET
__
_
1T H
97 972 1973 1974 1975 976 977 978 1979
Figure 5. - End-of-month Angostura Reservoir elevation- Sheet 3 of 3.

±N44
LIRA
N43
to 0 0 20 30I 1-4 fr4 1-4 I-i 14 1
SCALE OF MILES
Figure 6. - Reservoir drainage area.
28
ID (k
N)
-__________________ _____
/ NGOSTUP4 DAM
r I 20T-
'kIpRI
$IIEPS C4N ITW
29 28
KEY MAP
(ONY CPEEK
EXPLANATION
- •1J( LINE
HORSEHEAD CREEK
Figure 7. - Layout of reservoir sedimentation ranges.

Figure 8. - Layout of degradation ranges.
I
Figure 9. - Sounding boat for hydrographic survey.
31

N)
3200
3190
3180
3170
3160
3150
LJJU
I 3140z0I-
3130U-JU
3120
3110
3100
3090
3080
3070
3200
3190
3180
3170
3160
3150I-UU
31400
3130
3120
3110
3100
3090
3080
3070
00 90 80 70 60 50 40 30 20 10 0
DISTANCE ABOVE DAM-l,0FEET
Figure 10. - Longitudinal profiles for Cheyenne River.
c)c)
Figure 11. - Longitudinal profiles for Horsehead Creek.
z0
42 40 38 36 34 32 30 28 26 24 22 20 18 6 4 2 0 8 6 4 2 0
DISTANCE ABOVE CONFLUENCE OF HORSEHEAD CREEK AND CHEYENNE RIVER - 1000 FEET

I-0.w
I-zIaU
Ia0
-- -- - ItiuPERCENT- OPSTANCE
Figure 12. - Percent depth-percent distance relationship forCheyenne River above Angostura Dam.
.i-_t- {
-H-
-i;-L-L1--
,.
,
:f
II
Lf
It
:
ft
}H
-
.j
ftl
.
::
..
**
t:
I.
...:
HI!
tM
fl....
j1.
ff4
tt t
HtH1d
H.
ih.
ft:r
ljf
Yl
..
J•
.,Ht
.;
tJ:
JH:
:..
..1
:tt:
tI
?-
t0
00
L L LJ4. L I £L1. I Li LI LU_I_i. L LI .1_I_LI_U
L1I_EE
ITD
_UT
T2
0H
.Ld
30 -iN
333d
a)
0.-
a)a
)0=
= =
(Sa)
.-
L)
=0
a)ow
.L
4U
C
JW
za)
a)
4 I
P..-
()
i.-4-=
TZ
I.--
U4)
a) a
)=>v)
0
0.0
0L
=a)
(?)
P-I
C)S.-
U..
35
1,000 -
6-
4-
2-
U-00 -
r
8-
0 -
6-
4-
2-
0 -
02
m=3.67, Type I
m=2.55, Type III
2 4 6 8 IO 2 4 6 8 2 4 6 8
CAPACITY (ACRE FT)
Figure 14. - Depth-capacity relationship.
2 4 6 8106
OO
90
80
70
z 60wc)
Ua-
I-50
0>
UU,w 40
30
20
l0
00 10 20 30 40 50 60 70 80 90 00
SEDIMENT DEPOSITED (PERCENT)
Figure 15. - Sediment distribution curves.
I I I I
Type I Dis tribution
,"
- '/
___ __
- / t uaI DistributIon from 979 Survey -
I__
_____________________ I
_
I.
_
_____________________
_
______________________
_
_____________________ ______________________ _____________________ I _____________________
37
0Oc
V)
0LU
q0LU
LUUIUI
cc'
UI0
H-
cLU(0N)
0a(0
ANCOSTUA ESEVOPPERCENT OP TIME GREATER-EQUAL INDICATED AMOUNT
cc cccc cc cc cc cc
ccc cc cc cc cc U U U U ° ° ° c' aCc cc cc cc cc cc cc cc cc N cc UN t C (N cC (N 0 0 0 0 0
L E GE NDSTAGE DURATON
cc- U U U a U U cc o U U a U U a3 c' cc cc cccC ccU U a a 0 N -N cc cc N cc cc cc cc cc cc cc0 0 cc cc cc
cc cc
PERCENT OP TIME LESS-EQUAL INDICATED AMOUNT
Figure 16. - Stage-duration curve for end-of-month elevations.
ANGOSTURR RESERVOIR - CHEYENNE RIVERGROUND PROFILE FOR SECTION 1
1979 RESIJRVEY ORIGINAL SURVEY
(.)
D
LiLia-
zcD--4
>Li
Li
D
t)
0
---' -------- 'I
- -- _______ - -
-
-- -
V)- - -
-
0 I
N)
0
0 _______ _______________ _______ _______ _______________ _______ _______
0 200 400 600 800 t000 120C 1400 i6O0 IBf
DISTANCE - FEETFigure 17. - 1949 and 1979 sedimentation vnge pro1i1es
Cheyenne River - Range 1.

ANGOSTURFI RESERVOIR - CHEYENNE RIVERGROUND PROFILE FOR SECTION 2
1979 RESURVEY ORIGINAL SURVEY0(0(NN)
0
(NN)
0(N(NN)
00(N
LiU0LLcO
N)
Z0
>'cr
-JLi
0(N
Ni
C
Ni
C
CNi
C(CCNi
II
___________ I 1 ___________ ______________________ ___________ ___________ ___________
I /
I ______________
I /
______________ ______________ ______________ ______________
-SOn 0 500 1000 1500 2000 2500 3000 3500 40
DISTANCE - FEETFigure 18. - 1949 and 1979 sedimentation range profiles,
Cheyenne River - Range 2.
)0
ANGOSTURA RESERVOIR - CHEYENNE RIVERGROUND PROFILE FOR SECTION 2A
_
1979 RESURVEY0
0(\L
0
to
[JJOLJa).
Z0
>0
-J-LJ
0CN.
to
00
to
0a)0to
-200
ORIGINAL SURVEY
'1,
____
/_________
/_
____________ _
-I ;: ______,0 200 400 600 800 1000 1200 1400 1600 1800 2000 2200 2400 2600 2800 3000
DISTANCE - FEETFigure 19. - 1949 and 1979 sedimentation range profiles,
Cheyenne River - Range 2A.
ANOSTUftR RESERVOIR - CHEYENNE RIVERGROUND PROPILE FOR SECTIDN 3
1979 RESURVEY ORIGINAL SURVEY
N)
(N(N
cD(Nr)
Dco
IdId
D
f- D
-JLi
Q
t)
__________1" ____/4
-- - - - -i1 -
-I--/
I
200 4O0 600 800 1000 1200 F400 1600 1800 2000 2200 2400 2600 :2800 aiDI5TRNCE - F'EET
Fig ue 20. 1949 and ]179 ediinen:t&ton range prDfii es.,Cheyenne River - Ran:ge 3.

ANGOSTURA RESERVOIR - CHEYENNE RIVERGROUND PROFILE F'OR SECTION 3A
1979 RESURVEY ORIGINAL SURVEY
cj(N
D
LiLi
(C
D
cE>Li-JLi
(N
t)
Q
-_______________
- '
I, /
- _
0 500 1000 1500 2000 2500 3000 3500 4000 4500 5000 5500 60DISTANCE - PEET
Figure 21. - 1949 and 1979 sedimentation range profiles,Cheyenne River - Range 3A.
ANGOSTURA RESERVOIR - CHEYENNE RIVERGROUND PROFILE FOR SECTION 4
1979 RESURVEY ORIGINAL SURVEYCD
(N
CD
(N
CD(N(N
D
LJUJ
CIcx:
D'-I
(CcE>Li
CLi
C
V
CC
V
C
CV
I'
-'N
fl flfl 1000 1500 2000 2500 3000 3500 40'
DISTANCE - FEET
Figure 22. - 1949 and 1979 sedimentation range profiles,Cheyenne River - Range 4.
ANGOSTURA RESERVOIR - CHEYENNE RIVERGROUND PROFILE FOR SECTION 5
1979 RESURVEY ORIGINAL SURVEY
0
D
(N
CC
CaD
LiiLU
C(C
D
F-IC
N)Lii-j1-U
C(N
CC
CaDC
II
\ -
_/ \_/
'/
0 1000 2000 3000 4000 5000 6000 7000 8000 9000 IOCDISTANCE - FEET
00
Figure 23. - 1949 and 1979 sedimentation range profiles,Cheyenne River - Range 5.

ANGOSTURA RESERVOIR - CHEYENNE RIVERGROUND PROFILE FOR SECTION 6
1979 RESURVEY ORIGINAL SURVEY(N.(N
D0.(Nr)
0
Li-LJU-
Z0
Li-JoLi .
0
V)
00
-1000
j_ _
7_ _
_ _ _ _ _
II .
- - -
I -
0 1000 2000 3000 4000 5000 6000 7000 8000 9000 10000
DISTANCE - FEETFigure 24. - 1949 and 1979 sedimentation range profiles,
Cheyenne River - Range 6.

ANGOSTURA RESERVOIR - CHEYENNE RIVER
GROUND PROFILE F'OR SECTION BA
1979 RESURVEY ORIGINAL SURVEY
D('4
O)
rD
QD
u-JoLi N..
-
>0Ldu-
LJ'
0
0
0(N
- -r--
--
-
- _________ _________ _________ _________ _________ __________________ _________ _________ _________ _________ _________
- ___________________________________________________________________- I
I_______________________________________________________________________ _______________________________________________________________________ ___________________________________________________________________ ___________________________________________________________________ _______________________________________________________________________ _______________________________________________________________________ __________ _______________________________________________________________________ _______________________________________________________________________ ___________________________________________________________________ ___________________________________________________________________
-I 'II -
'I,'I
.- I'.
IIl
I
1I
o 500 1000 1500 2000 2500 3000 3500 4000 4500 5000 5500 601DISTANCE - FEET
Figure 25. - 1949 and 1979 sedimentation range profiles,Cheyenne River - Range 6A.
ANGOSTURA RESERVOIR - CHEYENNE RIVERGROUND PROFILE FOR SECTION 7
1979 RESURVEY ORIGINAL SURVEY
OD
D
(N
D
(NND
D
LiLi
cJ
NDzD
E-o
>N)Li-JLi
0(0
0U-,-
0
-200
fi______________,
I
-
//
/ \I
___-/
0 200 400 600 800 1000 1200 1400 1600 1800 2000 2200 2400 2600 2800 3000 3200
DISTANCE - FEETFigure 26. - 1949 and 1979 sedimentation range profiles,
Cheyenne River - Range 7.
ANGOSTURA RESERVOIR - CHEYENNE RIVERGROUND PROFILE FOR SECTION 8
---
1979 RESURVEY ORIGINAL SURVEYD
Li[Liz
a>U-J[Li
(N
1
I_____________
'r
-- -
I II\E _
0 100 200 300 400 500 600 700 800 900 1000 11 00 1200 1300 14 00 11DISTANCE - FEET
Figure 27. - 1949 and 1979 sedimentation range profiles,Cheyenne River - Range 8.

ANGOSTURA RESERVOIR - CHEYENNE RIVERGROUND PROFILE FOR SECTION 9
-
1979 RESURVEY ORIGINAL SURVEY
01C
C
UU
zD-4
>U-JLi
(Nr-)
C(0. ______ ______ ______ ______ ______(N
______ ______ ______ ______
C
(N
C(N. ______ ______ ______ ______ ______(N
______ ______ ______ ______ ______
CC. ______ ______ ______ ______ ______ ______ ______ ______ ______ ______
______ ______
.-.-.\----
______
0 200 400 600 800 1000 1200 1400 1600 1800 2fl
DISTANCE - FEETFigure 28. - 1949 and 1979 sedimentation range profiles,
Cheyenne River - Range 9.
ANGOSTURA RESERVOIR - CHEYENNE RIVERGROUND PROFILE FOR SECTION 10
1979 RESURVEY ORIGINAL SURVEY
01
0
(N
0
(N
0(N(N
LJcLi-LL
Z00
LJ(N
>0LJo-
LLJ
C
C
C(C
:\
I-.
0 50 100 150 200 250 300 350 400 450 500 550 600 650 700 750 8CDISTANCE - FEET
Figure 29. - 1949 and 1979 sedimentation range profiles,Cheyenne River - Range 10.
D

0.,N)
(N
0t..)(Nr)
0(N(N
LiLi
(Nr)
z
>roLi
Li00)
r)
0aD
0N..
rd-)
ANGOSTURA RESERVOIR CHEYENNE RIVERGROUND PROFILE FOR SECTION 11
1979 RESUIRVEY ORIGINAL SURVEY
N jn/I_0 100 200 300 400 500 600 700 800
DISTANCE - FEETFigure 30. - 1949 and 1979 sedimentation range profiles,
Cheyenne River - Range 11.
0
ANGOSTURA RESERVOIR - CHEYENNE RIVERGROUND PROFILE FOR SECTION 12
- -
1979 RESURVEY ORIGINAL SURVEY
01C..)
c
C")V)
QC')C")
LiLi
zD
>N')Li-JLi
0)
0
0r-..
'
'IJ
. \
___
___
' --
0 50 100 150 200 250 300 350 400 450 500 550 600 650 71DISTANCE - FEET
D
Figure 31. - 1949 and 1979 sedimentation range profiles,Cheyenne River - Range 12.
ANGOSTURFi RESERVOIR - CHEYENNE RIVERGROUND PROFILE FOR SECTION 13
1979 RESURVEY ORIGINAL SURVEY
0,
U-)(N
(N
(N
LiLi
Q(N
I (NV)
z
cE>,Li-jLi
C(N
C
C
fl 11111 700 flfl 4flfl flO BOO 700 800 9C
DISTANCE - FEETFigure 32. - 1949 and 1979 sedimentation range prof'Hes,
Cheyenne River - Range 13.
0

ANGOSTURA RESERVOIR - CHEYENNE RIVERGROUND PROFILE FOR SECTION 14
1979 RESURVEY ORIGINAL SURVEY
0)C,,
DU-,(NN)
cD,t.(NN)
DN)(N
LiiLi
(N
N)
z
cE>N)Li-JLi
Q
(NN)
Q0)
N)
cD
N)0 100 200 300 400 500 600 700 800 900 lOt
DISTANCE - FEETFigure 33. - 1949 and 1979 sedimentation range profiles,
Cheyenne River - Range 14.
ANGOSTURA RESERVOIR - CHEYENNE RIVER
GROUND PROPILE POR SECTION 14A
1979 RESURVEY ORIGINAL SURVEY
(N
DN•)(Nt)
cD
LJ
>Li-lcDUJc
(N
/
0 100 200 300 400 500 600 700 800 900 101
DISTANCE - PEETFigure 34. - 1949 and 1979 sedimentation range profiles,
Cheyenne River - Range 14A.
ANGOSTURA RESERVOIR - CHEYENNE RIVERGROUND PROFILE POR SECTION 15
01-'-A
DQD.(NN')
a(N
a(0.(N
aL4JLJV)
a(N
D
>U
U] C'4(N
a(NN")
a0.(NN')
a0)N')
0
1979 RESURVEY ORIGINAL SURVEY
100 200 300 400 500 600 700 800 900DISTANCE - FEET
Figure 35. - 1949 and 1979 sedimentation range profiles,Cheyenne River - Range 15.
1000 1100
ANGOSTURA RESERVOIR - CHEYENNE RIVER
GROUND PROFILE POR SECTION 16
1979 RESURVEY ORIGINAL SURVEY
Q1
U-)
(N
CD
[)J)
zc(N
f-4
>
CD
(Nv)
CD0)
-
_ __1/
_
/-
/
- - - -
_I ____
0 100 200 300 400 500 600 700 600 qiDISTANCE - PEET
0
Figure 36. - 1949 and 1979 sedimentation range profiles,Cheyenne River - Range 16.
ANGOSTURA RESERVOIR - CHEYENNE RIVERGROUND PROFILE FOR SECTION 17
1979 RESURVEY ORIGINAL SURVEY
01
(Nr)
U-)(NN-)
ci[JrsJLJr)L
zD
a:
LJc1(NND
ci
(NND
C)C)(NNi
r•
_ __ _
\______
(I_____
I
-- -
-
o so ioo 150 200 250 300 350 400 450 500 550 600 650 700 7Sf) RI
DISTANCE - FEET0
Figure 37. - 1949 and 1979 sedimentation range profiles,Cheyenne River - Range 17.
-
Q
('1C-)
D(0
0In
LiLi
0
C-)
D
>rLi-JLi
C(N(N
C
(N
CC
ANGOSTURA RESERVOIR - CHEYENNE RIVERGROUND PROFILE FOR SECTION 18
1979 RESURVEY ORIGINAL SURVEY
_______
//___
0 50 100 150 200 250 300 350 400 450 500 550 6CDISTANCE - FEET
Figure 38. - 1949 and 1979 sedimentation range profiles,Cheyenne River - Range 18.
0
ANGOSTURA RESERVOIR - CHEYENNE RIVERGROUND PROPILE POR SECTION 20
1979 RESURVEY ORIGINAL SURVEY0(0
0
LJ
0
>U-JoUJco
0(0
0
• _ __
_
_ ____________
• ____________
-
___
II,
o ioo 200 300 400 500 600 700 800 900 1000 11 00 1200 1300 1400 1500 16(
DISTANCE - PEETFigure 39. - 1949 and 1979 sedimentation range profiles at mouth of
first downstream unnamed canyon - Range 20.
ANGOSTURA RESERVOIR - CHEYENNE RIVERGROUND PROFILE FOR SECTION 30
1979 RESURVEY ORIGINAL SURVEY
N)
Dto
cJ
0
LJ
zic
>Li-JoLJ
C(C
C
I'
1±
____
0 500 10
__
00 1500 2000 2500 3000 351
DISTANCE - FEET10
Figure 40. - 1949 and 1979 sedimentation range profiles,Sheps Cann, Range 30.

ANGOSTURA RESERVOIR - CHEYENNE RIVERGROUND PROFILE FOR SECTION 31
_
1979 RESURVEY ORIGINAL SURVEYD
LiLi
zD
>Li-JLi
(Nt)
(N. N____________ __________________ __________________ ___________________(N
V)
cD(N ________
1//
- _________ ________
-
_________ ________ -_
N________ ________ ________ _________
0 100 200 300 400 500 600 700 800 90DISTANCE - FEET
Figure 41. - 1949 and 1979 sedimentation range profiles,Sheps Cann, Range 31.
D
Dc
N)
InC)
t')
D
LLJV)LL
InQJ
DF-co
>U-JulLJN
0
rl
u-iCD
0CD
ANGOSTURA RESERVOIR - CHEYENNE RIVER
GROUND PROFILE FOR SECTION 32
1979 RESURVEY ORIGINAL SURVEY
fl Inn 7flfl flfl 4flfl flfl AflO 700 800 9C
DISTANCE - FEETFigure 42. - 1949 and 1979 sedimentation range profiles,
Sheps Canyon - Range 32.
0
ANGOSTURFI RESERVOIR - CHEYENNE RIVERGROUND PROPILE POR SECTION 33
1979 RESURVEY ORIGINAL SURVEY
0)
If)
r)
If)0)
LiLi
z0
cr>;;Li-JLi
D
0
/I
,
50 100 150 200 250 300 350 400 450 500 550 6u0 650DISTANCE - PEET
Figure 43. - 1949 and 1979 sedimentation range profiles,Sheps Canyon - Range 33.

ANGOSTURA RESERVOIR - CHEYENNE RIVERGROUND PROFILE POR SECTION 34
1979 RESURVEY ORIGINAL SURVEY
(N
(U
(N
(N
LJLJ
QID
(NZt")D
>Li
LJOD
OJ
(NC)
C-,
00)
C-)
4'
_ _ _ _
-
0 50 100 150 200 250 300 350 4CDISTANCE - FEET
Figure 44. - 1949 and 1979 sedimentation range profiles,Sheps Can)vn - Range 34.
0
ANGOSTURA RESERVOIR - CHEYENNE RIVERGROUND PROFILE FOR SECTION 40
1979 RESURVEY ORIGINAL SURVEYD(NN)
0
N)
0
L3a-
Z10
>Li-oLi n.
N)
0
N)
c(NN)
-400
,II
II_______-
-J'----
-200 0 200 400 600 800 1000 1200 1400 1600 1800 2000 2200 2400 2600
DISTANCE - FEETFigure 45. - 1949 and 1979 sedimentation range profiles,
Horsehead Creek - Range 40.

ANGOSTURA RESERVOIR - CHEYENNE RIVERGROUND PROF'ILE FOR SECTION 41
1979 RESURVEY ORIGINAL SURVEY
co
0Co(N
0
(N
0(N(N
LiLiU-
00(NV)
z
cE>rLi-iLi
0CD
r)
0
0(N
///
/_ _
- -
I,
'I,
-
o 200 400 800 800 1000 1200 1400 1800 1800 201
DISTANCE - FEETFigure 46. - 1949 and 1979 sedimentation range profiles,
I-brsehead Creek - Range 41.
ANGOSTURA RESERVOIR - CHEYENNE RIVERGROUND PROFILE FOR SECTION .2
1979 RESURVEY ORIGINAL SURVEY0(NN)
0OJ
0
LJ
z0
>[4J-JOLii (0
N)
0tiI
0
\N //1/
It
! jI___________ I
1/
_ -' ___ 1__ _ ___ __
I,
III s
"
K
IsI s-
________ ________ ________ ________ ________ _______ _______ _______ ________ ________
IsI -
_ _ _
________ ________ ________ ________
7
_/f,
,,
________
_ _ _ __
-
o ioo 200 300 400 500 600 700 600 900 1000 11 00 1200 1300 1400 1500 16(
DISTANCE - FEETFigure 47. - 1949 and 1979 sedimentation range profiles,
brsehead Creek - Range 42.
ANGOSTURA RESERVOIR - CHEYENNE RIVERGROUND PROFILE FOR SECTION 43
1979 RESURVEY ORIGINAL SURVEYDcJt)
0)r)
C
Li-
ZC
>Li
r1
CU)
C
1
/
- ___ _ I!_ ________
1!_
-
o ioo 200 300 400 500 600 700 800 900 1000 11 00 1200 1300 1400 15DISTANCE - FEET
Figure 48. - 1949 and 1979 sedimentation range profiles,I-brsehead Creek - Range 43.
ANGOSTURA RESERVOIR - CHEYENNE RIVERGROUND PROFILE FOR SECTION 44
1979 RESURVEY ORIGINAL SURVEY(Nt•)
r-)
cD
(N
LLJ(NLJ
D
(N
D
>LU
LiD(N
D
(0
D
-
__
- __
-200 0 200 400 600 800 1000 1200 1400 1600 1800 2000 2200 2400 26(
DISTANCE - FEETFigure 49. - 1949 and 1979 sedimentation range profiles,
I-brsehead Creek - Range 44.
10
ANGOSTURA RESERVOIR - CHEYENNE RIVERGROUND PROF'ILE POR SECTION 45
1979 RESURVEY ORIGINAL SURVEY
N.)
(0
(N
LiLJcjLr
(N
z
>Q
Li
D
(0
• N 1 .tTT - -
o ioo 200 300 400 500 600 700 800 900 1000 11 00 12
DISTANCE - PEETFigure 50. - 1949 and 1979 sedimentation range profiles,
I-brsehead Creek - Range 45.
)0
ANGOSTURA RESERVOIR - CHEYENNE RIVERGROUND PROPILE POR SECTION 46
1979 RESURVEY ORIGINAL SURVEY
-4
N)
N)
D
N)
UJN)
f-4N)
a>U-DUJcr'
N)
D
N)
N-.
N)
I ,',
0 200 400 600 800 1000 1200 14 00 1600 1800 2000 22(
DISTANCE - PEETFigure 51. - 1949 and 1979 sedimentation range profiles,
Horsehead Creek - Range 46.

ANGOSTURA RESERVOIR - CHEYENNE RIVERGROUND PROFILE FOR SECTION 47
1979 RESURVEY ORIGINAL SURVEY
c'J
In
(LJD
-
l-lr•)
>LILJO)-3-LLJ
0)F)
LJ)
ri
r)
- ____________
----
o too 200 300 400 500 600 700 800 900 1000 liiDISTANCE - FEET
Figure 52. - 1949 and 1979 sedimentation range profiles,Horsehead Creek - Range 47.
ANGOSTURA RESERVOIR - CHEYENNE RIVER
GROUND PROFILE FOR SECTION 48
1979 RESURVEY ORIGINAL SURVEY
-401
(0(Nt)
Lfl(N
(N
Li[Lia-
CD
zD
>t)Li-LiLi
CD
(N
CDCD(N
CD0)
0 100 200 300 400 500 600 700 800 900 1000 11 00 1200 1300 1400 IS(DISTANCE - FEET
Figure 53. - 1949 and 1979 sedimentation range profiles,Horsehead Creek - Range 48.
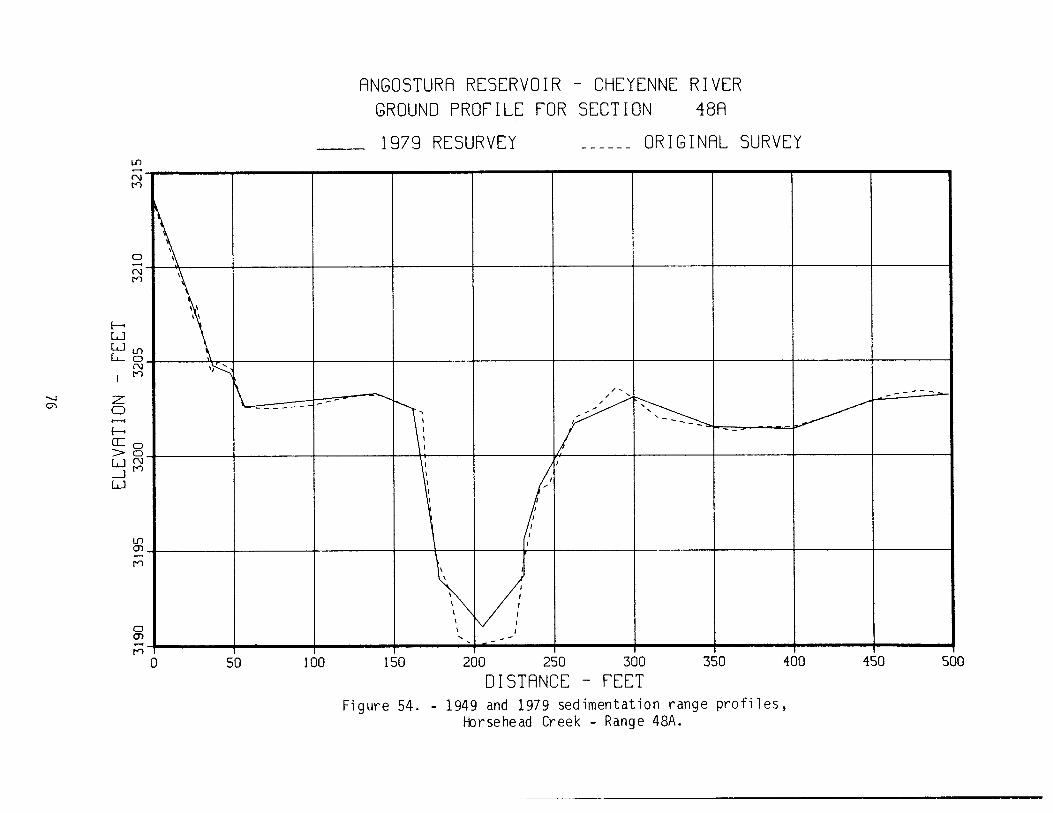
ANGOSTURA RESERVOIR - CHEYENNE RIVERGROUND PROFILE FOR SECTION 48A
1979 RESURVEY ORIGINAL SURVEYLfl
(N
0
(N
Li
LLcD(N
zD
a::0>0LJ-JLi
U-,a-)
t)
00-)
•
_ _ _ _ _ _ _
o_
s__
o 100 150 200 250 300 350 400 450 SCDISTANCE - FEET
Figure 54. - 1949 and 1979 sedimentation range profiles,}-brsehead Creek - Range 48A.
0
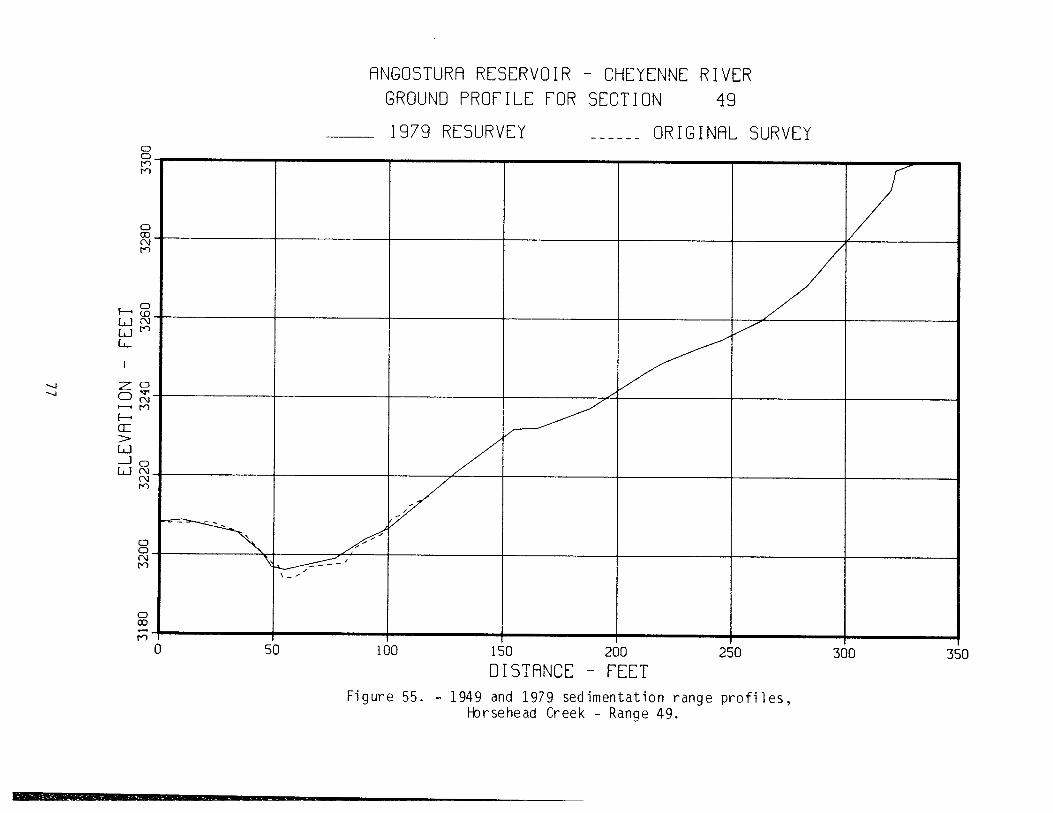
-4-4
00NDND
C
C
[JND
z0D (N
>Li-cjLJ'a
(NN)
C
(NND
C
ND
ANGOSTURA RESERVOIR - CHEYENNE RIVER
GROUND PROFILE FOR SECTION 49
1979 RESURVEY ORIGINAL SURVEY
- _ _ _ _ _ _ _
o 50 100 150 200 2fl flfl
DISTANCE - FEETFigure 55. 1949 and 1979 sedimentation range profiles,
I-brsehead Creek - Range 49.
)

Lr)
LiLiLfl
zD
Li
Li
0CN
0C(N
ANGOSTURA RESERVOIR - CHEYENNE RIVERGROUND PROFILE FOR SECTION 51
1979 RESURVEY ORIGINAL SURVEY
- - - -
0 50 100 150 200 250 300 350 400 450 500 550 SC
DISTANCE - FEETFigure 56. - 1949 and 1979 sedimentation range profiles,
Horsehead Creek - Range 51.
D
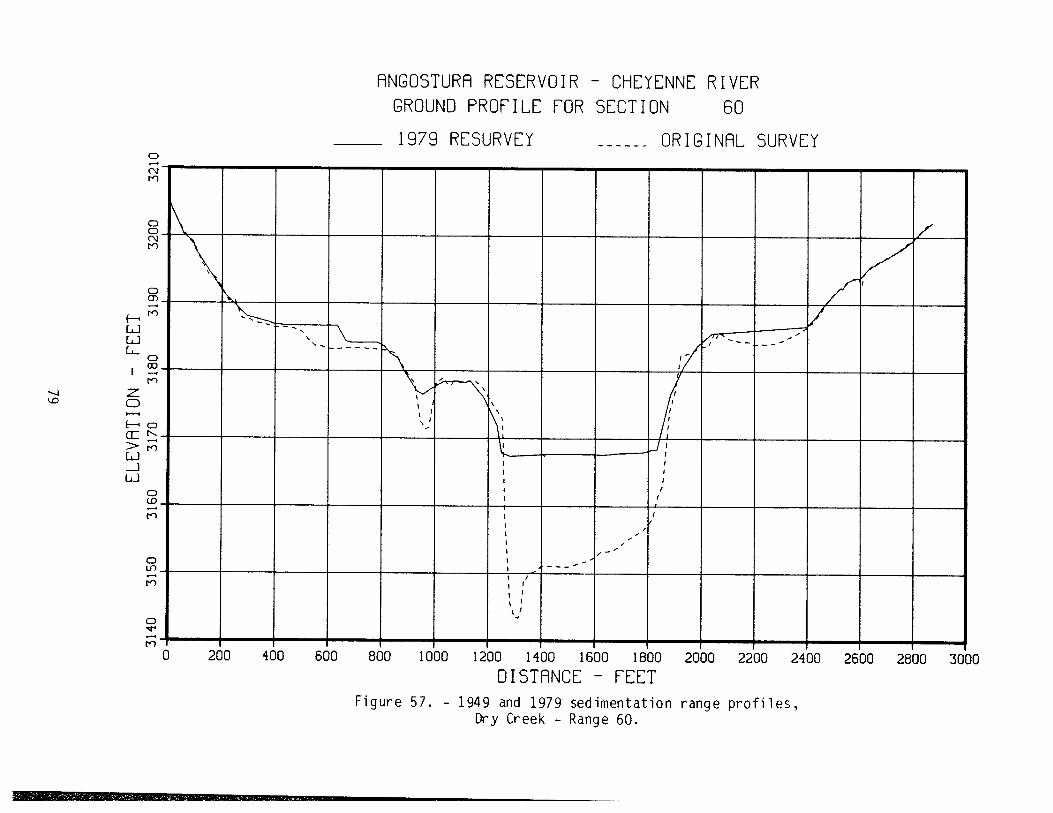
ANGOSTURFI RESERVOIR - CHEYENNE RIVERGROUND PROFILE F'OR SECTION 60
-----
1979 RESURVEY ORIGINAL SURVEY
LiLi
z
>Li-JLi
(N
7cD
'7_-
D'I-
U - I
V)7
DU). __ __ __ __ __ __
II
-- ---
7
7--
I /
\ 10
.
0 200 400 600 800 1000 1200 1400 1600 1800 2000 2200 2400 2600 2800 301DISTANCE - FEET
Figure 57. - 1949 and 1979 sedimentation range proffles,Dry Creek - Range 60.

ANGOSTURA RESERVOIR - CHEYENNE RIVER
GROUND PROPILE POR SECTION 61
1979 RESURVEY ORIGINAL SURVEY
0
0V)
0
0
t)
[i-Jo[i-Jo
ZD
>0Liico
0
0(0
N)
0U,
/ ' I J / '
.-
-
____________ ____________ ____________ ____________ '1 -
0 200 400 600 800 1000 1200 1400 1600 1800 2000 2200 2400 2600 281
DISTANCE - FEETFigure 58. - 1949 and 1979 sedimentation range profiles,
Dry Creek - Range 61.
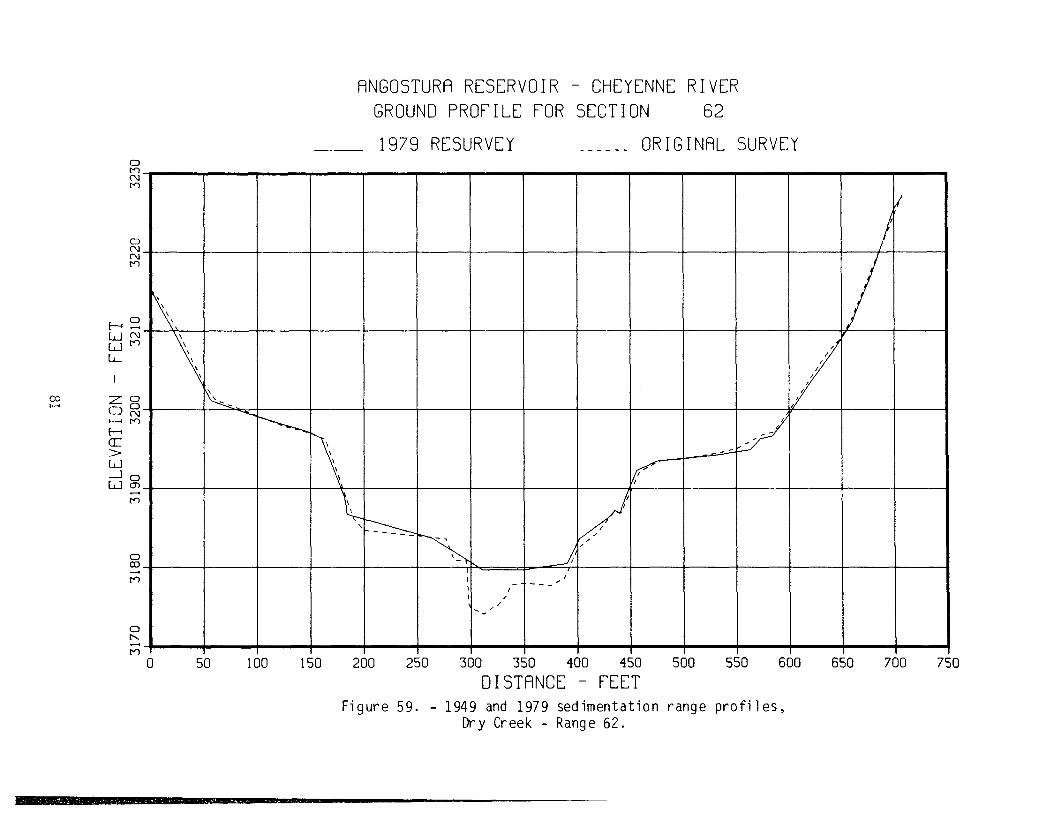
ANGOSTURA RESERVOIR - CHEYENNE RIVER
GROUND PROFILE FOR SECTION 82
1979 RESURVEY ORIGINAL SURVEY
co
Ni.
Ni
Ni
ZDD.
LJ(\J4Ni
>U-JoLJ ci.
Ni
0
Ni
N..
Ni0
//____ ________ _
1/
:,
50 100 150 200 250 300 350 400 450 500 550 600 650 700 750
DISTANCE - FEET
Figure 59. - 1949 and 1979 sedimentation range profiles,Dry Creek - Range 62.

ANGOSTURA RESERVOIR - CHEYENNE RIVER
GROUND PROFILE FOR SECTION 7A
1979 RESURVEY ORIGINAL SURVEY
LiLii
zci
>-Li-JLi
--
1'I
-- - -
/
/
- -
,
- - - /- - - - - - --
-
0 50 100 150 200 250 300 350 400 450 Snfl Scfl flfl cn 7fln 7cfl
DISTANCE - FEETFigure 60. - 1949 and 1979 sedimentation range proffles at mouth of
unnamed cann entering reservoir upstream ofRange 7 - Range 7A.
BOO
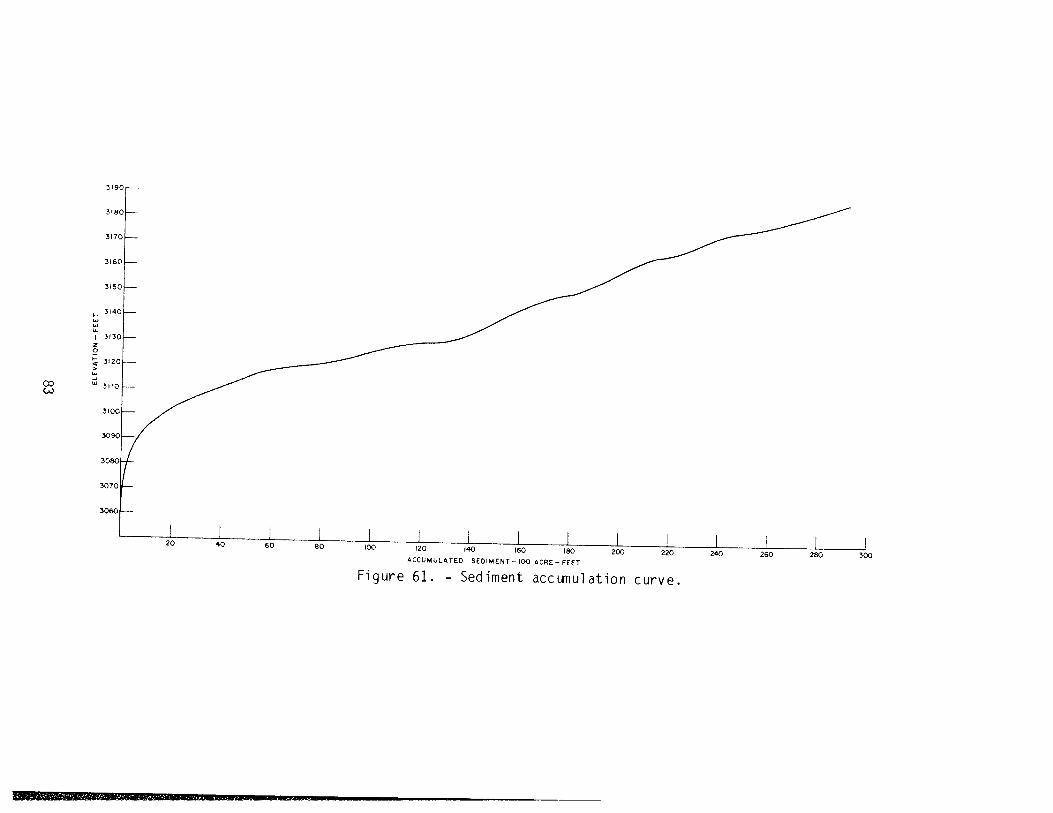
z0
C
OD
Figure 61. - Sediment accwiulation curve.
- - -2?O 240 260 280 3C)D
ACCUMULATED SEDIMENT -00 ACRE - FEET
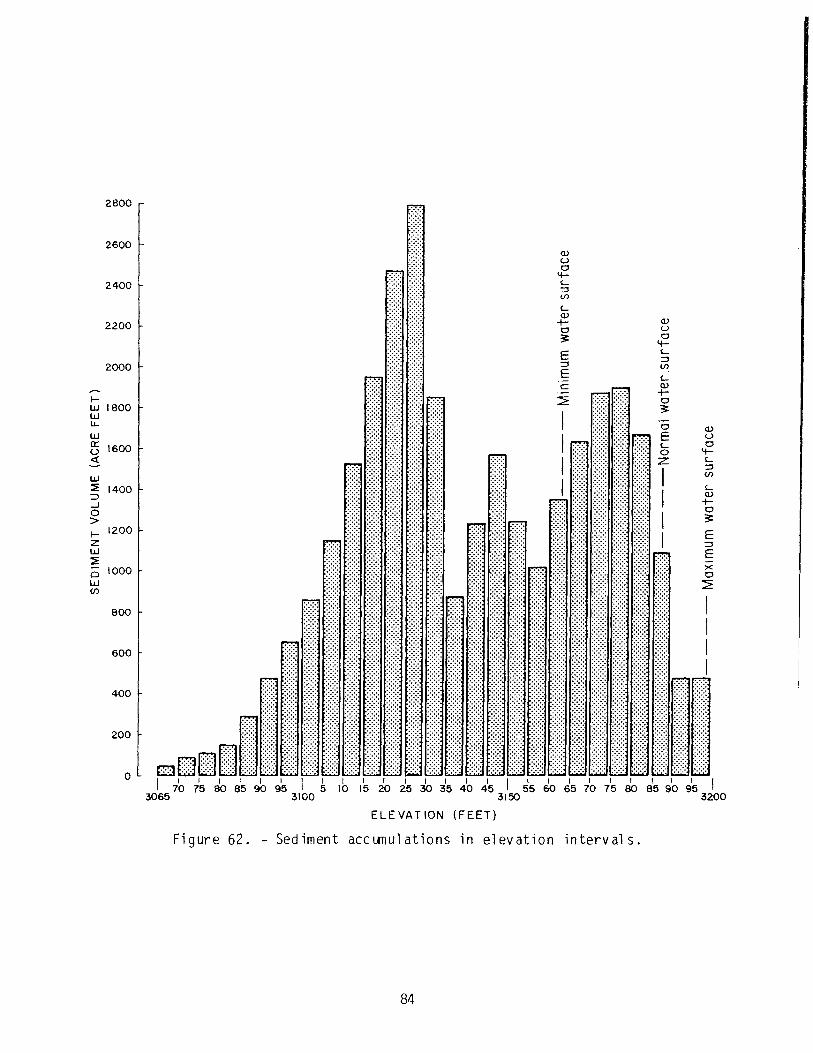
2800
2600
2400
2200
2000
I.-w 1800wLL
lii
1600
Iii1400
-J0>
200zw
1000UC',
800
600
400
200
0707580859095 I
3065 3100
ELEVATION (FEET)
3150
Figure 62. - Sediment accuiiulations in elevation intervals.
84
C)()0
C-
(1)
C-C)
0
E
E
0
90 953200
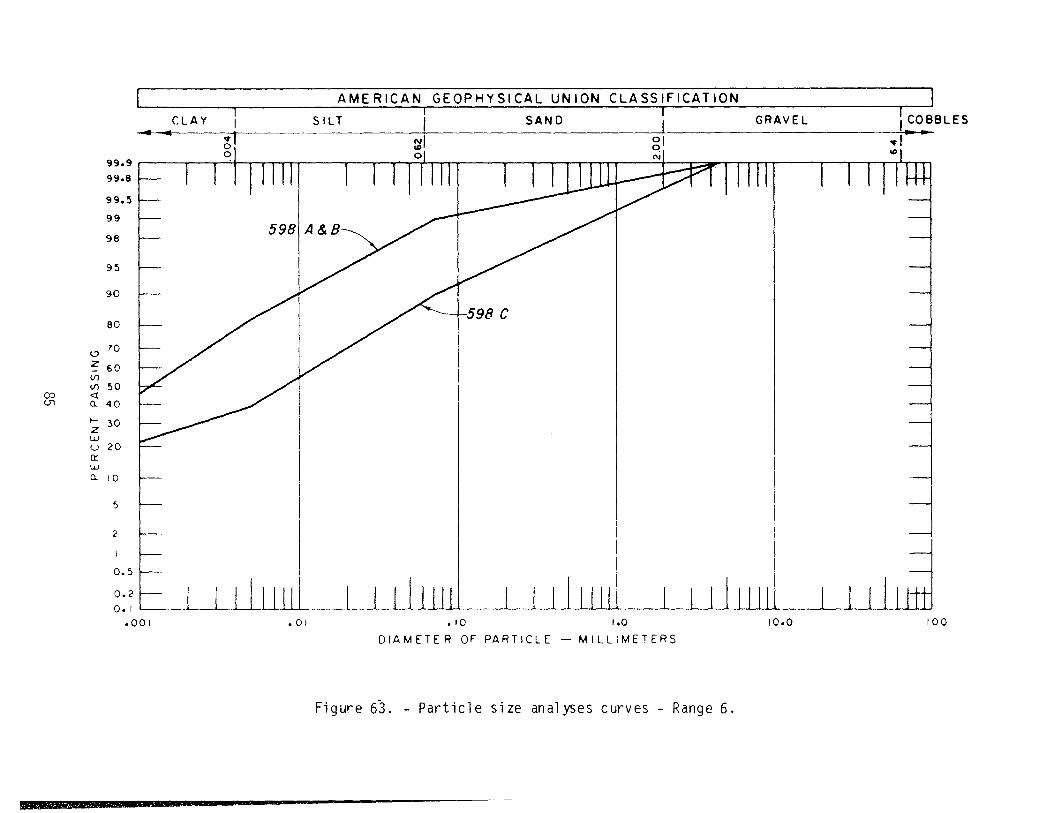
AMERICAN GEOPHYSICAL UNION CLASSIFICATION ICLAY I SILT SAND GRAVEL CO6BLES
99.9
99.8
99.5
99
98
95
90
80
70
60
ti) 500(71 a 40
30
(.i 20Cr
a
5 -
2 -
0.5 -.
0.2 -
0.' -
.00
Figure 63. - Particle size analyses curves - Range 6.
.Ot .10 .0 0.0 00
DIAMETER OF PARTICLE - MILLIMETERS
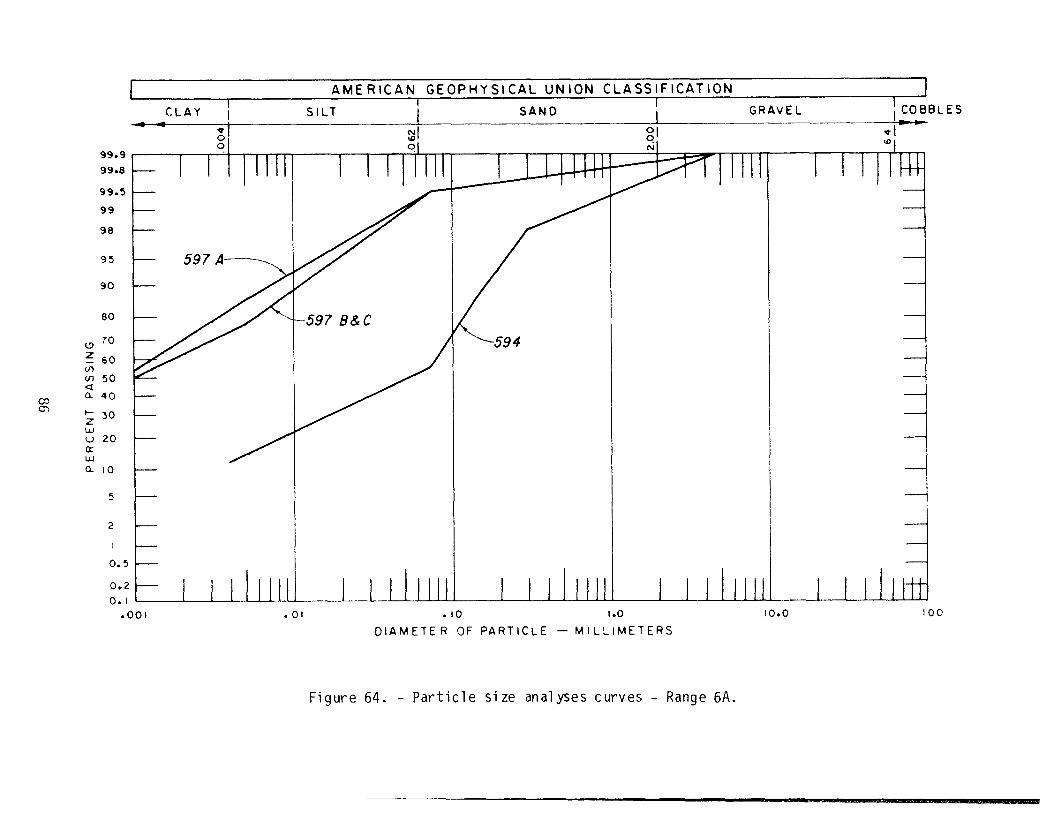
__________ AMERICAN GEOPHYSICAL UNION CLASSIFICATION
CLAY SILT SAND GRAVEL COBBLES
21
OD
99.999.8
99.5
99
98
95
90
80
70
60(r)V) 50
U- 40
30
u 20
wU- 0
5
2
0.5
0.20. I.001
'I Hill
597A
I H1I HI HH I HH
I j liii I I I I IW I I 111111 I I uN I I ii II.01 .10 1.0 0.0 00
DIAMETER OF PARTICLE -MILLIMETERS
Figure 64. - Particle size analyses curves - Range 6A.
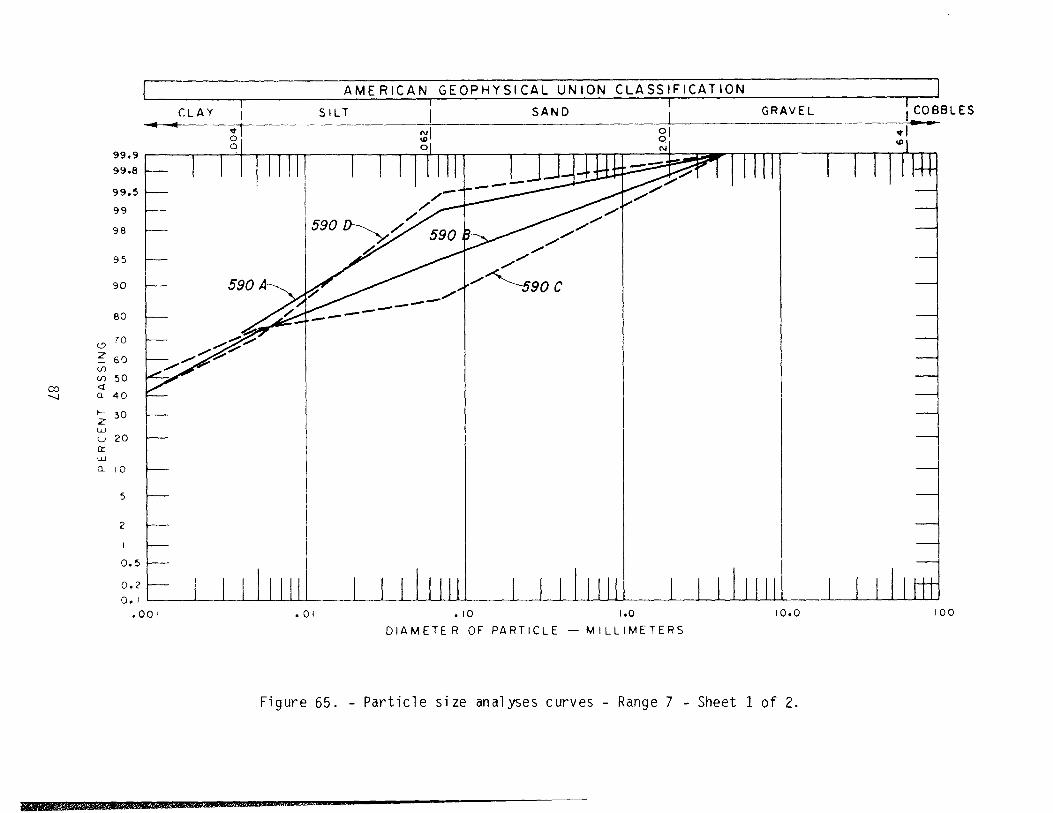
AMERICAN GEOPHYSICAL UNION CLASSIFICATION
CLAY j SILT SAND GRAVEL____
kOBBLEScI
co
99.999.8
99.5
99
98
95
90
80
70
60'I)(1) 50
0. 40
30
20auJ0. 10
5
2
0.5
0.20
590
0
590
0
- - -- - -
590 C
.001 .0! .10 .0 10.0
DIAMETER OF PARTICLE - MILLIMETERS
00
Figure 65. - Particle size analyses curves - Range 7 - Sheet 1 of 2.

CLAY
99.999.8
99.5
99
98
95
90
80
70
60
i) 503- 40
30
o 20
LJ3- 0
5
2
0.5
0.2
AMERICAN GEOPHYSICAL UNION CLASSIFICATION
SILT SAND GRAVEL
0I0
COBBLES
I I'II1II I lIjII1I> -
-
- 596 D- 596 C -
596A- -
- I I IItH ______ iHi I I IIII1 I I II.001 .01 .10 .0 0.0
DIAMETER OF PARTICLE - MILLIMETERS
00
Figure 65. - Particle size analyses curves - Range 7 - Sheet 2 of 2.
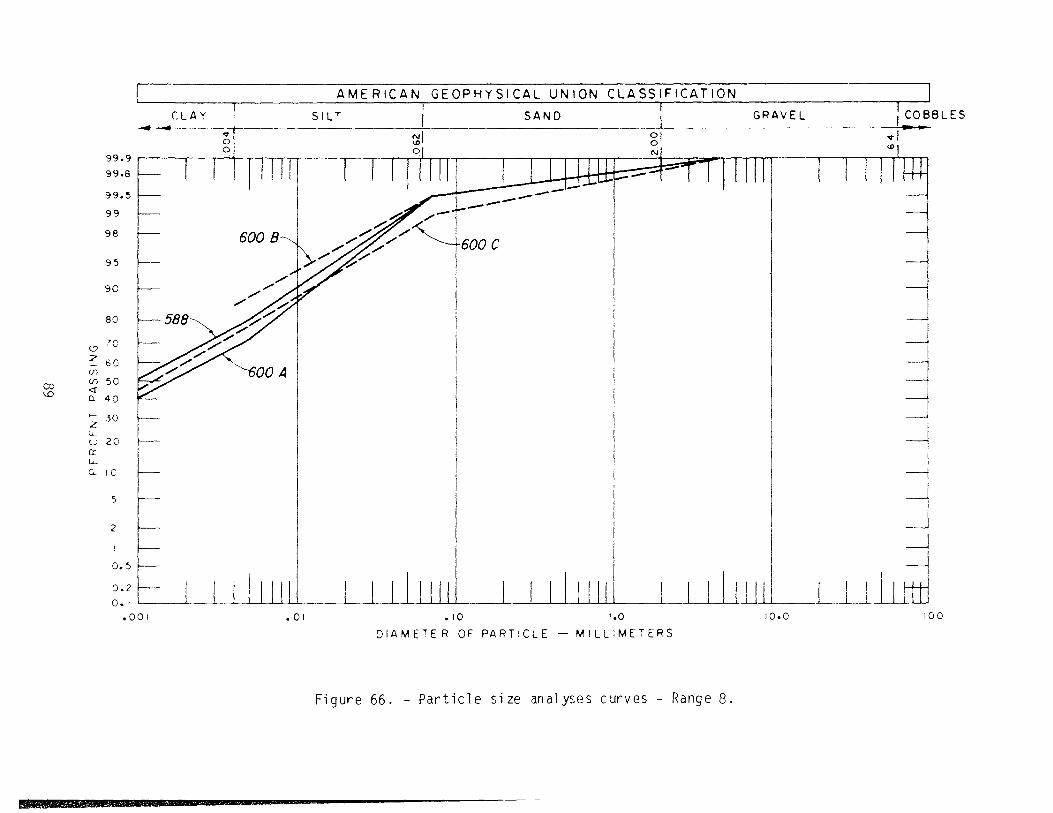
AMERICAN GEOPHYSICAL UNION CLASSIFICATIONI I
CLAY SILT SAND GRAVEL COBBLES0
- Io .0 001 I
00
99.9
99.8
99.5
99
98
95
90
80
70
60(I-)(1) 50
ci 40
30
20aUici o
5
2
0. 5
0.2
0.
.00
-t littIti ltJJI.-1..l..
- 600 B 600 C
00 A
_liLLLLllL i 1JH HHU ___ _____ __ __
.0! .io .0 o.o cooDIAMETER OF PARTICLE - MILLIMETERS
Figure 66. - Particle size analyses curves - Range 8.
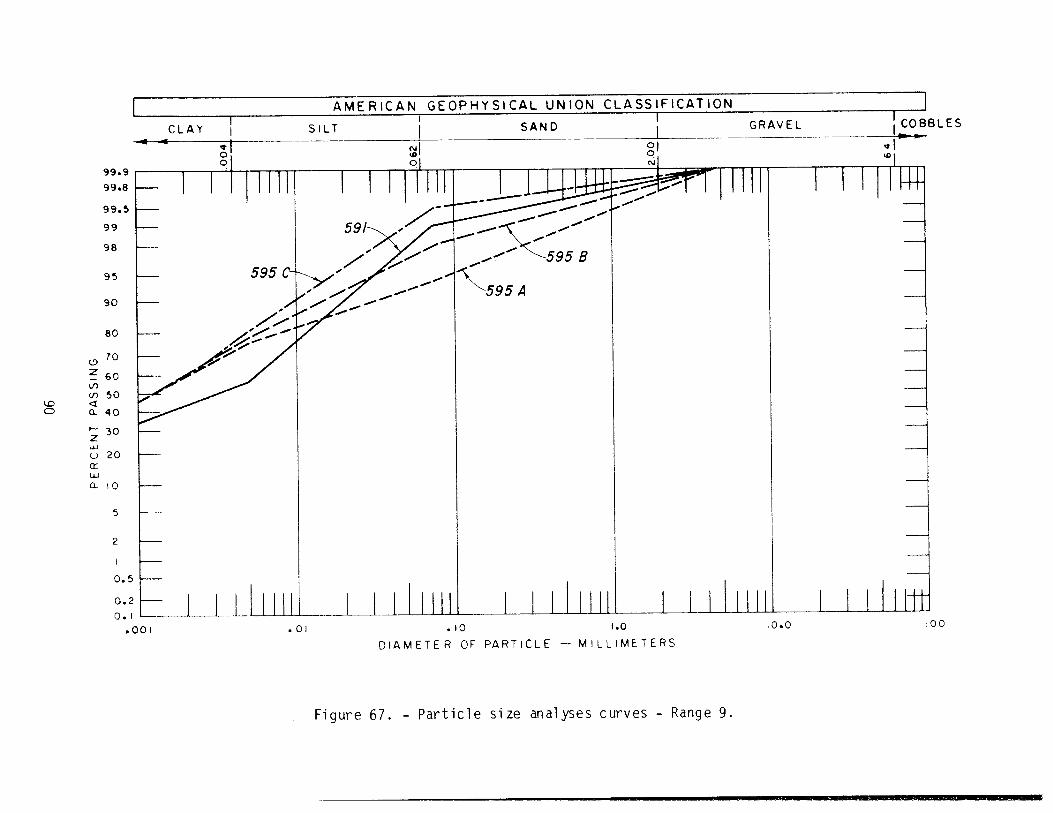
99 • 9
99.8
99.5
99
98
95
90
80
70
60(I,v 50
a- 40
30
L) 20
uJa- 0
5
2
0.
0.20. I
.00
CLAY
AMERICAN GEOPHYSICAL UNION CLASSIFICATIONSILT SAND GRAVEL
(00p
COBBLES
to'
1111111 I I I1II-••1••l••-
- 595 B -
-
'-
595A
7- .
_____ HHII HH1 iiiHii _____
.01 .0 .0 0.0
DIAMETER OF PARTICLE - MILLIMETERS
100
Figure 67. - Particle size analyses curves - Range 9.
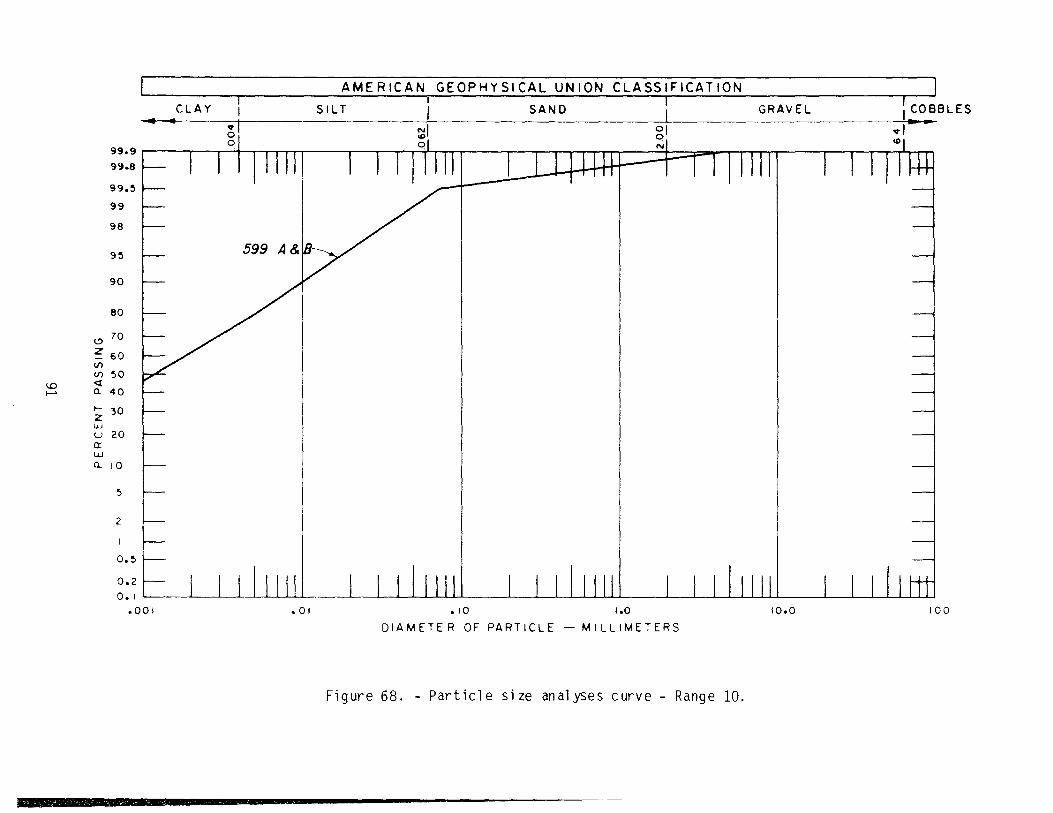
I AMERICAN GEOPHYSICAL UNION CLASSIFICATION ICLAY SILT SAND GRAVEL COBBLES
99.999.8
99.5
99
98
95
90
80
70
60
(1) 50
140
30
20
u-iQ- 0
5 -
2 -
0.5 -
0.2 -
0.' -
.00l
Figure 68. - Particle size analyses curve - Range 10.
.01 .J0 1.0 0.0 00
DIAMETER OF PARTICLE -MILLIMETERS
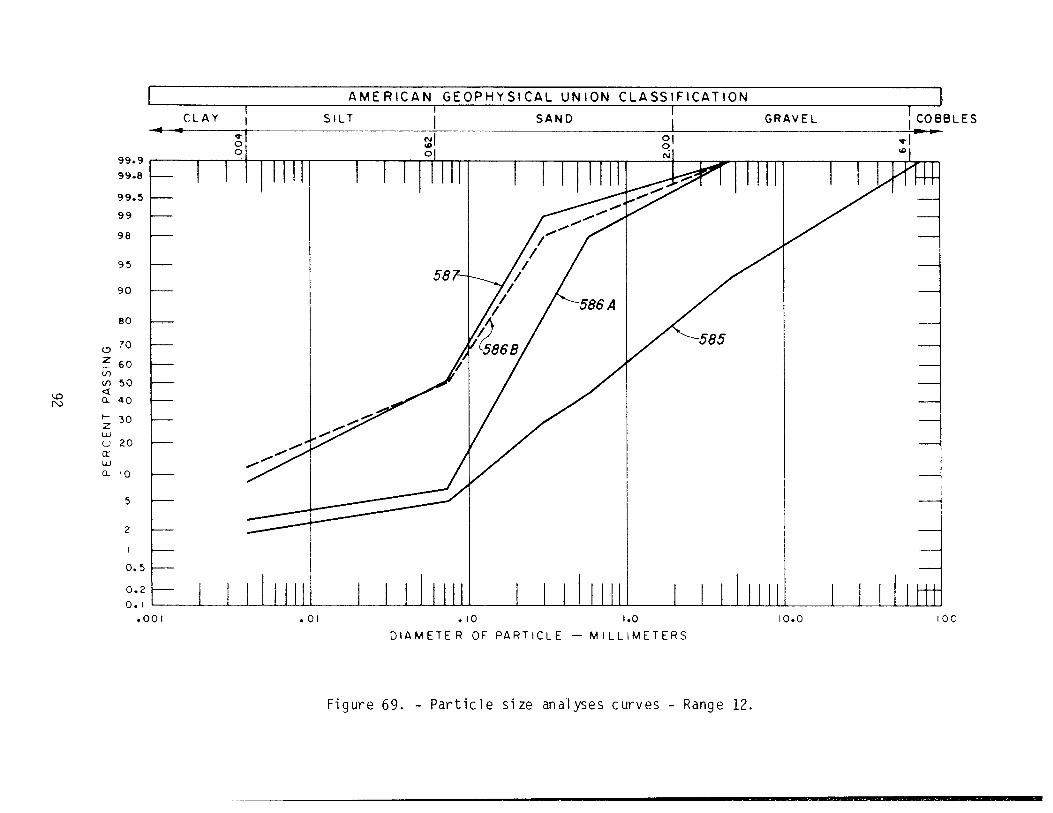
AMERICAN GEOPHYSICAL UNION CLASSIFICATION 1CLAY SILT SAND GRAVEL COBBLES
SJI 010 ..DI 0ol 01 .s1 tDI
99.999.8
99.5
99
98
95
90
80
70
60V)v) 50
O 40
30
() 20
uJa- to
5
2
0.5
0.2 -
0.1 -
.001 .01 .10 .0 10.0 100
DIAMETER OF PARTICLE -MILLIMETERS
Figure 69. - Particle size analyses curves - Range 12.
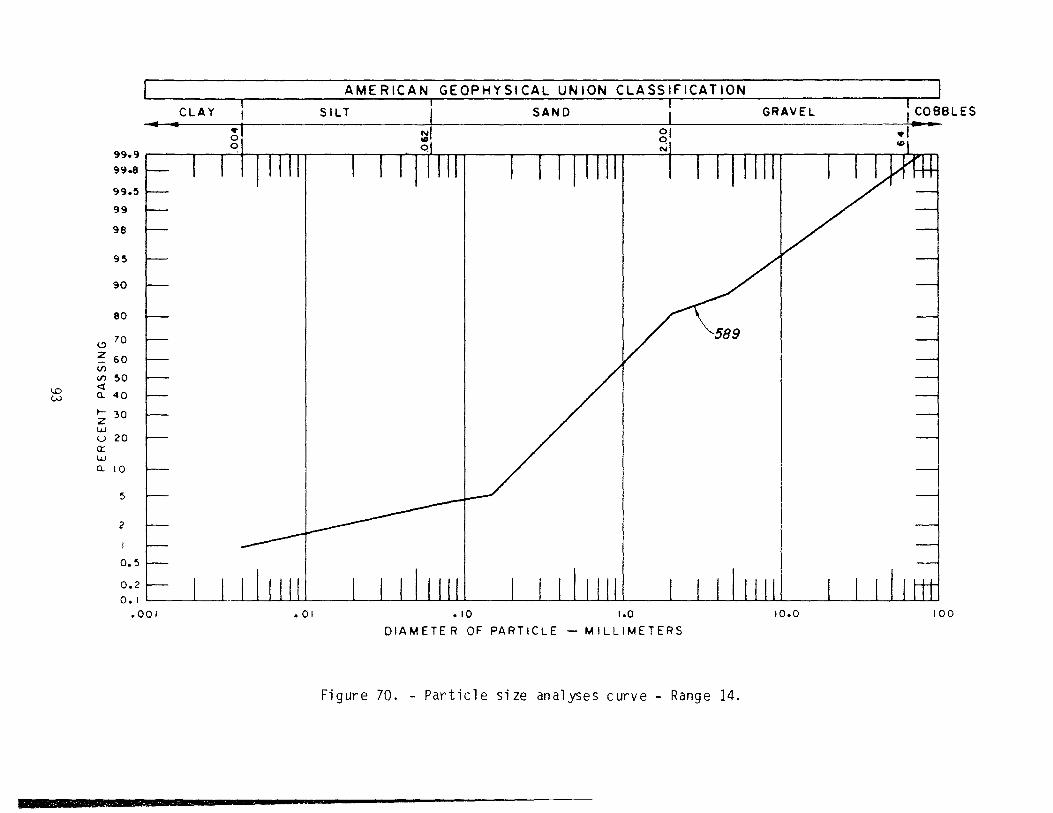
99.999.8
99.5
99
98
95
90
80
70
60(I)(1) 50
0. 40
30
20
Li0 '0
5
2
0.5
AMERICAN GEOPHYSICAL UNION CLASSIFICATIONCLAY SILT SAND GRAVEL COBBLES
NI 01o lo 0ol 01 Nt
0.2 -
0.l -
.00 .01 .10 1.0 0.0
DIAMETER OF PARTICLE - MILLIMETERS
00
Figure 70. - Particle size analyses curve - Range 14.
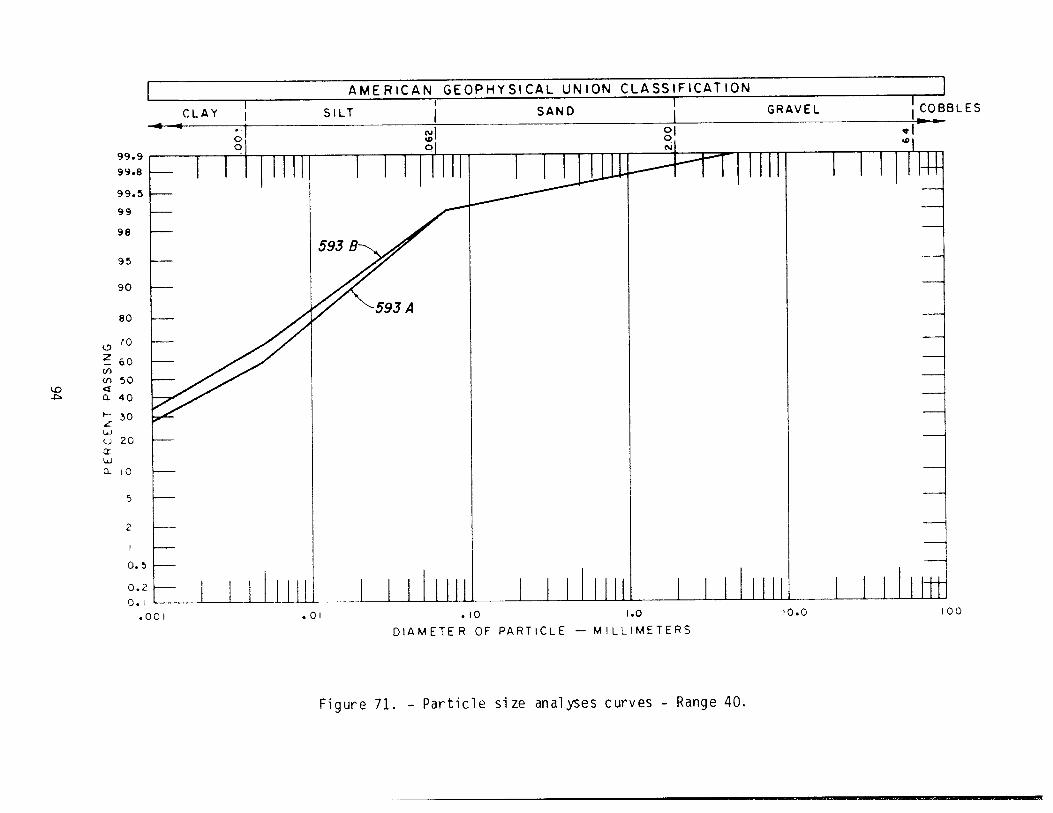
AMERICAN GEOPHYSICAL UNION CLASSIFICATION
CLAY SILT SAND GRAVEL
2I
99 • 9
99.8
99.5
99
98
95
90
80
70
60(1)U, 50
a 40
30
u 20a
a
5
2
0.5
0.2
COBBLES- -
11111 I II'IIIHIII 1 HTI
593 B
593 A
____JJLLll I III! I I III I II III II.001 .01 .10 1.0 0.0
DIAMETER OF PARTICLE - MILLIMETERS
00
Figure 71. - Particle size analyses curves - Range 40.
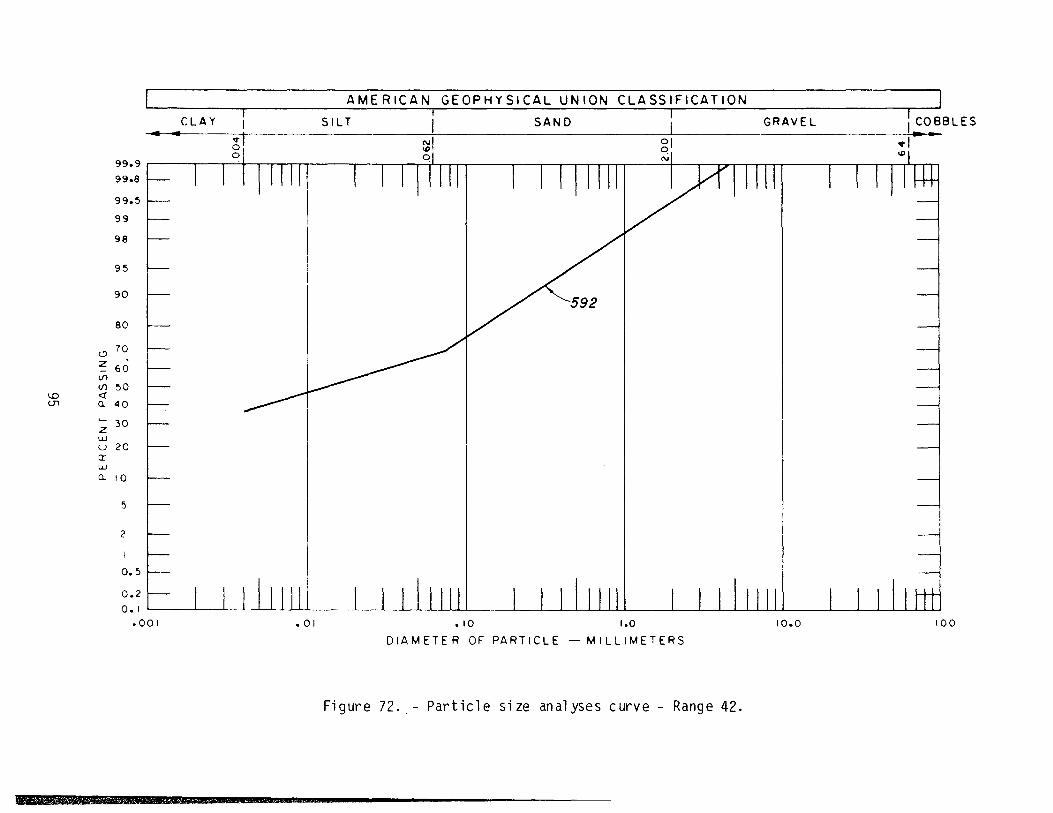
AMERICAN GEOPHYSICAL UNION CLASSIFICATION ICLAY I SILT SAND GRAVEL COBBLES
99.999.8
99.5
99
98
95
90
80
70
(I)(1) 50
Q 40
30
c) 20
uJ- 0
5 -
2 -
0.5 -
0.2 -
0.' -
.00
Figure 72. - Particle size analyses curve - Range 42.
.01 .10 1.0 10.0 00
DIAMETER OF PARTICLE - MILLIMETERS
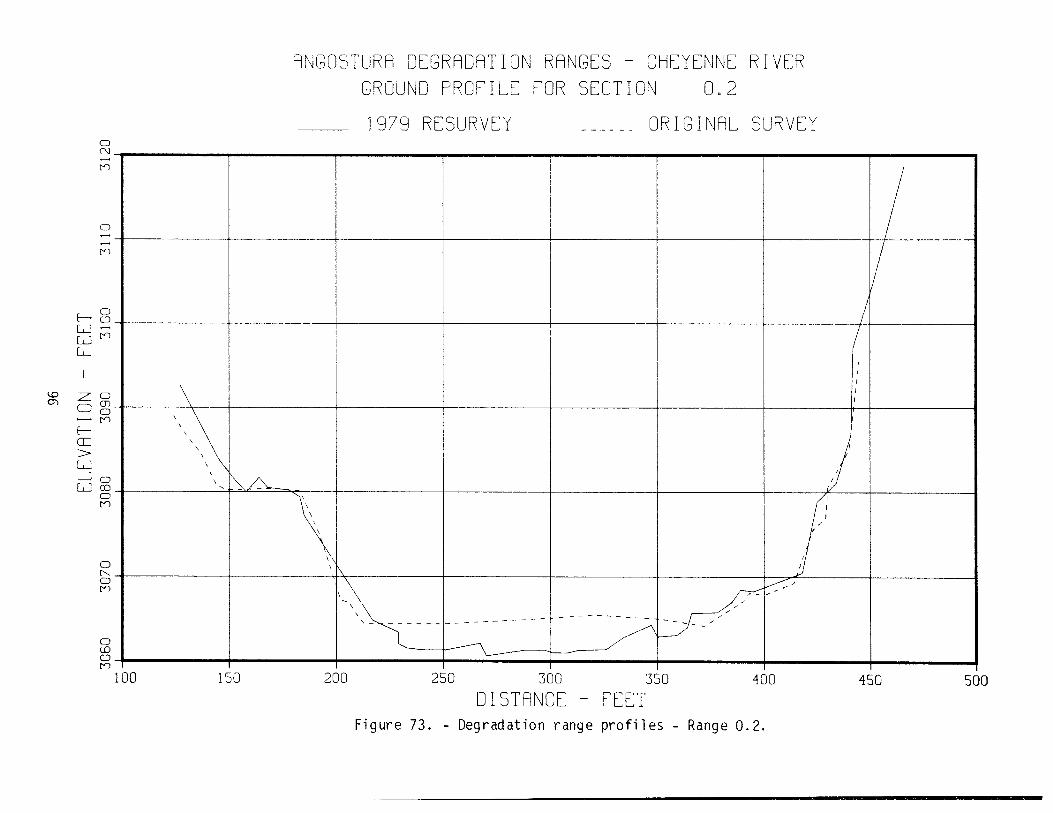
ANGOSTUPA DEGRADAT ION RANGES - CHEYENNE RIVER
GROUND PROTILE TOP SECTION O2
c'J-
N)
D
N)
DHcLjJ
L}D
cE>Li-JoLJ
0
0
0V)
0(U
N)
100
1979 RESURVEY ORIGINAL SURVEY
I_____
______
______
_______
______
I _____
150 200 250 300 350 400
DISTANCE - TEETFigure 73. - Degradation range profiles - Range 0.2.
450 500
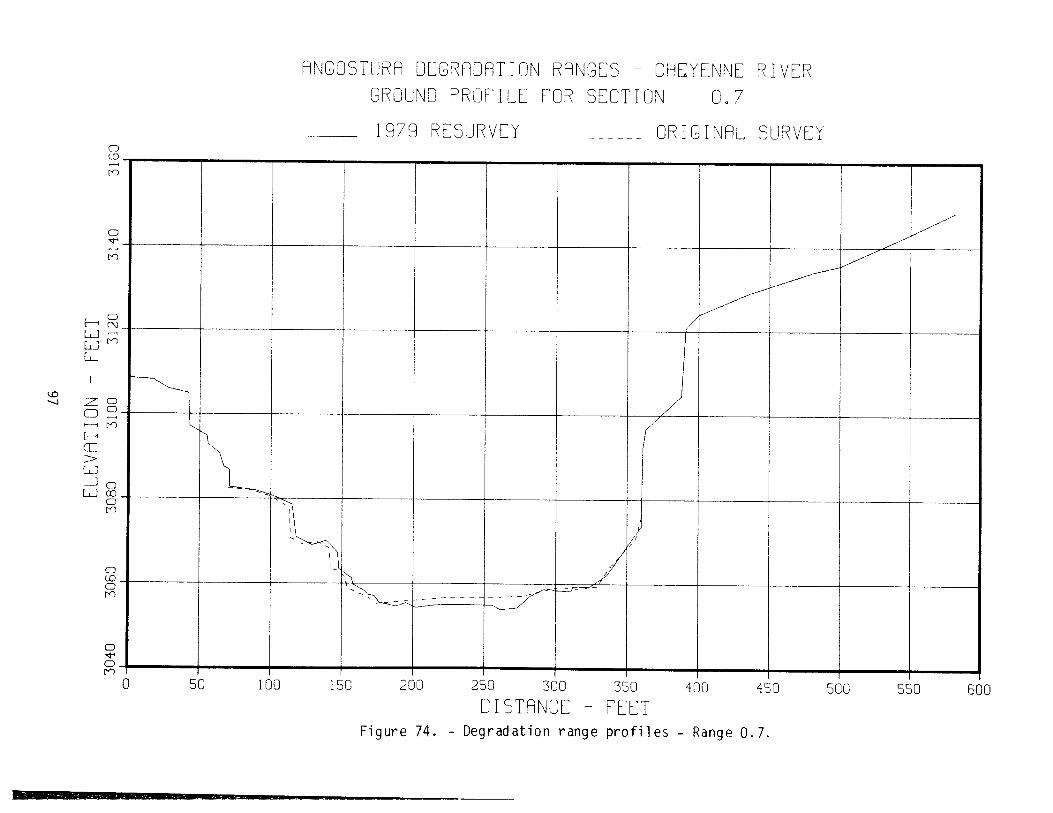
ANGOSTURA DEGRADATION RANGES - CHEYENNE RIVERGROUND PROPILE POR SECTION O7
1979 RESURVEY ORIGINAL SURVEYD
0 50 10 0 150 200 250 300 350 400 450 500 550 Afl
LiLiLi
zcc
cc>Li-JLi
DISTANCE - PEETFigure 74. - Degradation range profiles - Range 0.7.

ANGOSTURA DEGRADATION RANGES - CHEYENNE RIVER
GROUND PROPILE POR SECTION L75
1979 RESURVEY ORIGINAL SURVEY
t)
DLU
N)
D
LiLiLi
C')
V)
D
cEc>V)Li-JLi
Dcc
D(UD
D
n inn 2flfl 00 400 500 800 700 800 900 10'
DISTANCE - PEElFigure 75. - Degradation range profiles - Range 1.75.
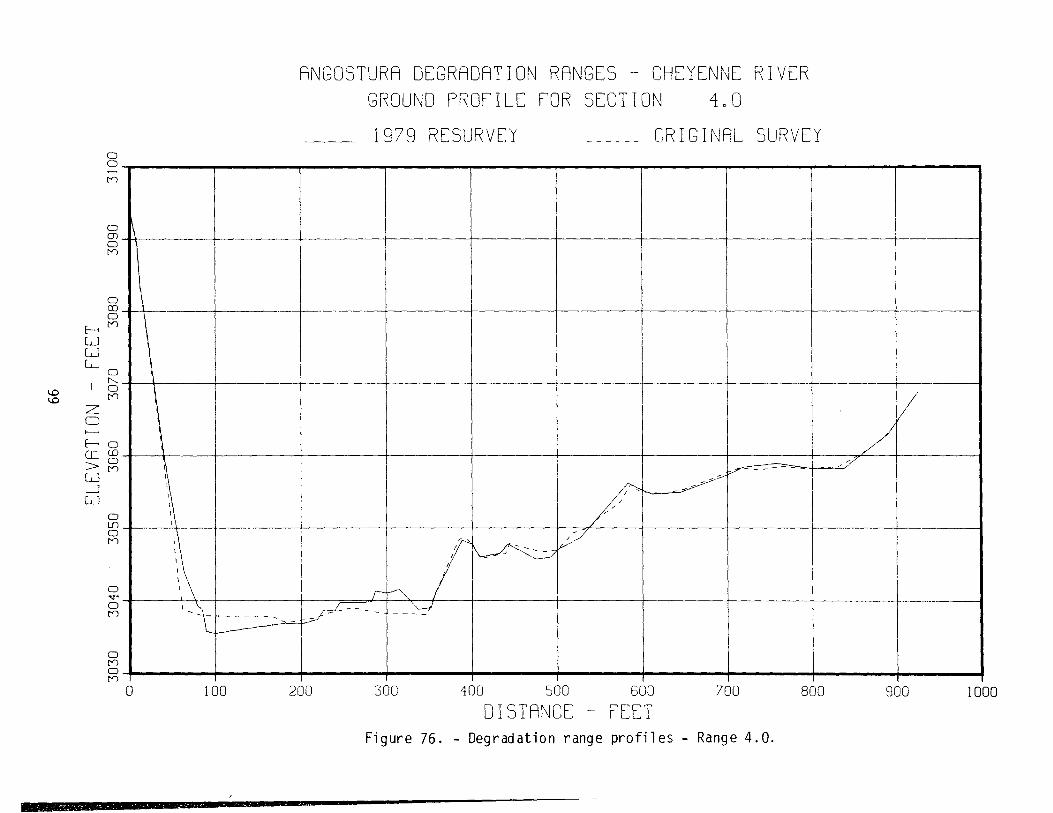
ANGOSTURA DEGRADATION RANGES - CHEYENNE RIVER
GROUND PROCILE POP SECTION 4O
lo
D
O)0V)
0
0
LiLiLi
0
0
z
>V)Li-iLi
0U)0
0
N)
0
0N)
0
1979 RESURVEY ORIGINAL SURVEY
/
i_ __
100 200 300 400 500 600 700 800
DISTANCE - PEETFigure 76. - Degradation range profiles - Range 4.0.
900 1000
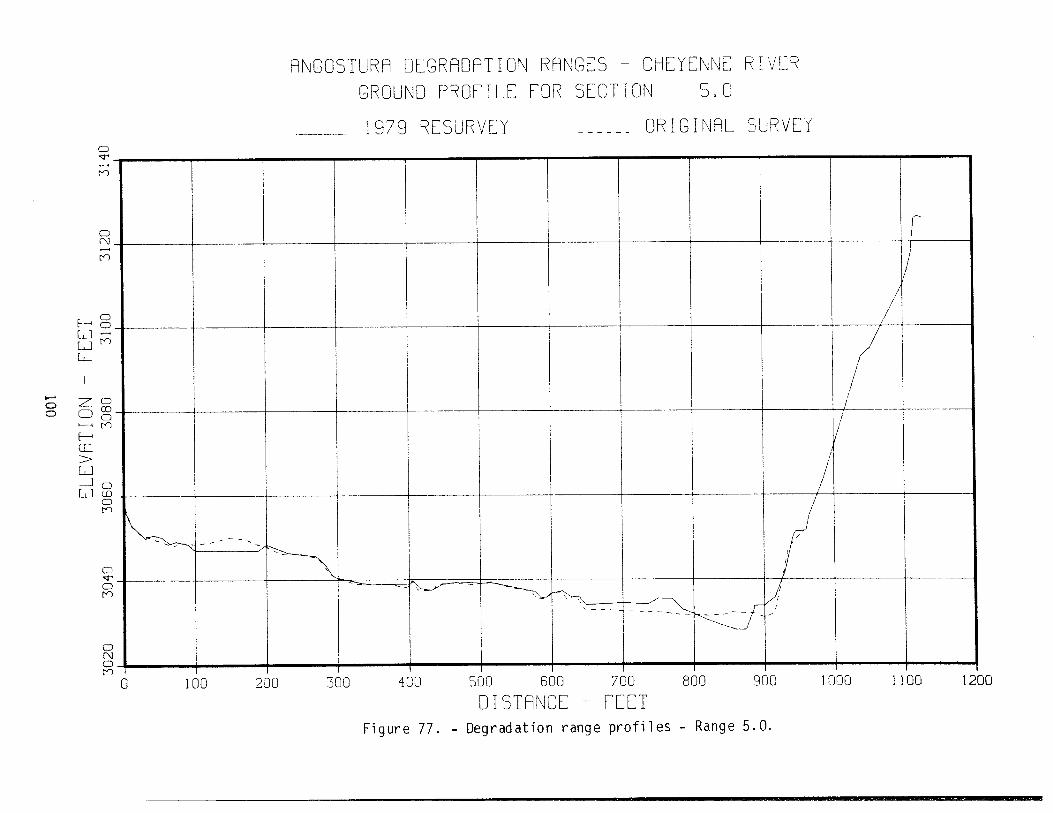
ANGOSTURA DEGRADATION RANGES - CHEYENNE RIVLPGROUND PROPILE POP SECTION 5O
1979 RESURVEY ORIGINAL SURVEY
H-
--
ID
IDrj
ID
LJ
D ID
>Li-JoLJcc
C
C
C
C
C
o ioo 200 300 400 5UU 6UU /UU dUU dUU
DISTANCE - PEElFigure 77. - Degradation range profiles - Range 5.0.
1000 1100 1200
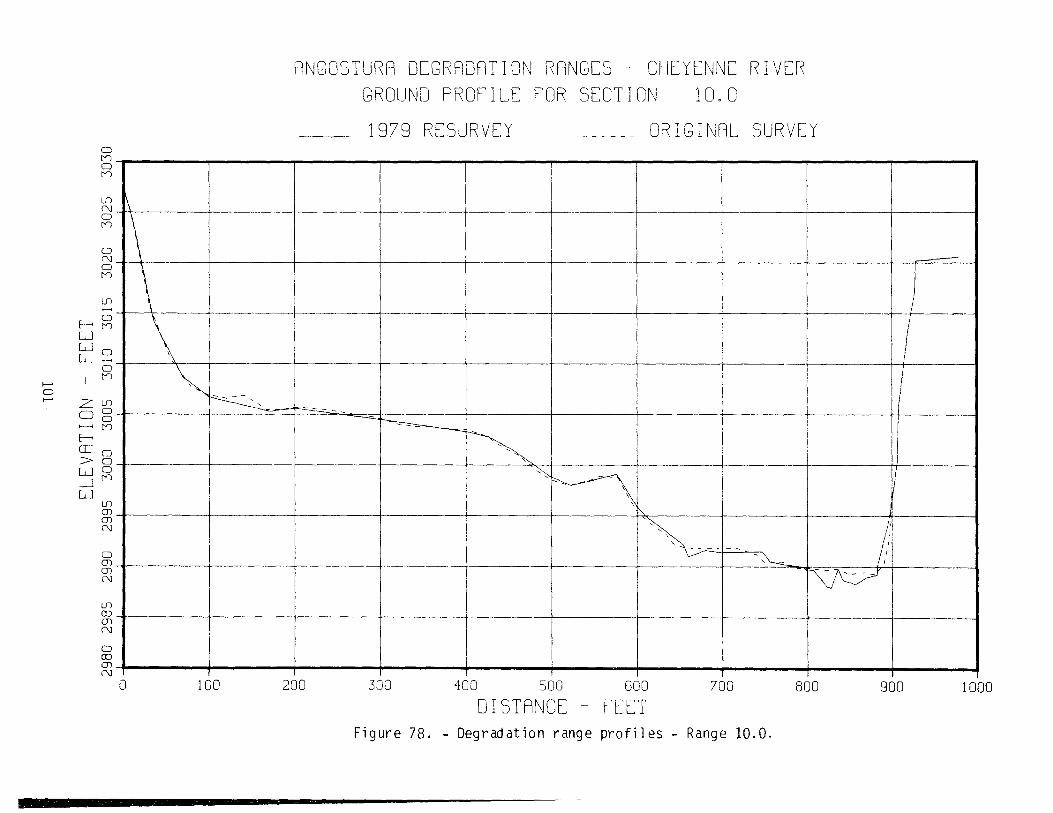
ANGOSTURA DEGRADATION RANGES - CHEYENNE RIVER
GROUND PROFILE POR SECTION 1OO
1979 RESURVEY ORIGINAL SURVEYD
5
I)
____ ____ _____ ____ __-
1)
j-):j _________ ______________________---=-- __________ ____________ _______ ______________ _____ __________
0 100 200 300 400 flfl AflO 7fl0 Rflfl mi
LiLiLi
za:
>Li
Li
DISTANCE - [lETFigure 78. - Degradation range profiles - Range 10.0.
Jo
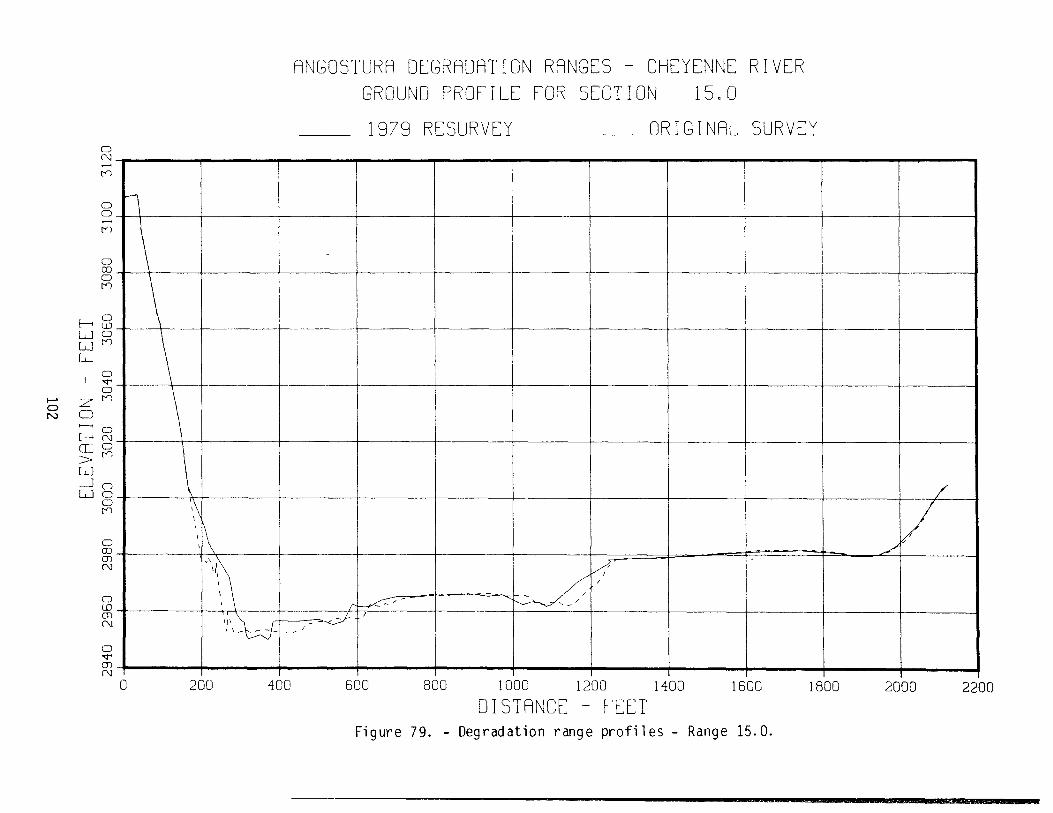
ANGOSTURA DEGRADATION RANGES - CHEYENNE RIVER
GROUND PROPILE POR SECTION 15O
1979 RESURVEY ORIGINAL SURVEYD
_____ ____ __________ _____-___ ____ ___ ___ __________
D. ____ ______ ______ _______ ______ _______ ______ ______ ______ ______ ______
N ________ ________ _____ _____ ________ ______ ______ ________ ______ _______
-
- _______ _______ ______ _______ _______ _______ _____
- ____ _____ __ ___ ___ _______________ _____ _____
/-
- _________ _________ I
- _____' / _______ _____ ______- _____'!\ T<->[
N
ULiLi
z
cE>U-JLi
U 2UU 4UU 5UU UUU 1UUU 1200 1400 1600 1800
DISTANCE - PELTFigure 79. - Degradation range profiles - Range 15.0.
2000 2200
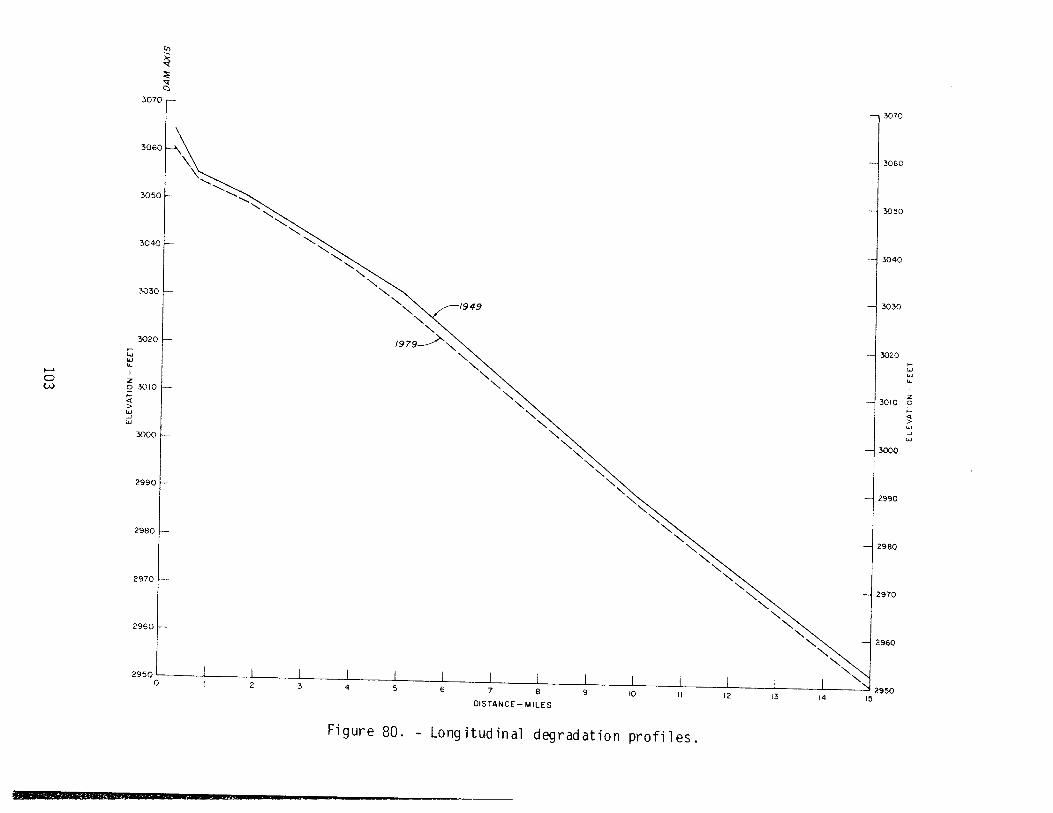
I)
3070 -
3060
3050
3040
3030
302CI-
LJU.
z2 30(0I->
UJ
2990
2980
2970
2960
2950
3070
3060
3050
3040
3030
3020
- 30(0 2
I >
30
2990
2980
NN
2970N
NN
N2960
NN
NN
150 0
DI S TA N CE - MILES
Figure 80. - Longitudinal degradation profiles.
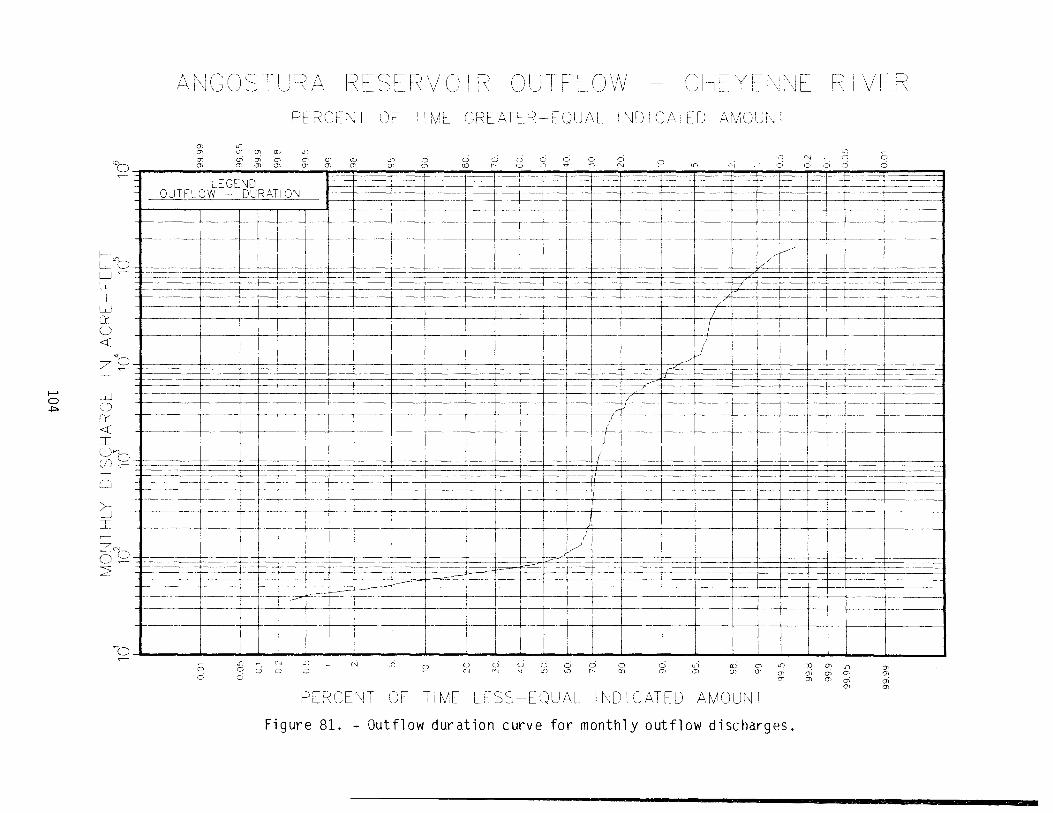
H-
Lo
UU0
z0
up0Do
I00
up
>
I
z
0
ANCOSTURA RESERVOR OUTFLOW CHEYENNE HVEPPERCENT OF TIME CREATEREQUAL INDICATED AMOUNT
0 00 0 0 0 06 66 o- 6 a 0 a a 0 0 6 6
0 0 0 0 0 0 0 0 J 0 0 0 0 0 0 0 0 0 0 0 0
LEGENDOUTFLOW DURATFON
- 0 - 0 0 0 (N 0 6 0 0 6 6 6 6 6 6 6 0 00 0P 0 0 0 0 - (N (N 0 (0 0 (0 0 0 0 0 6 6 6 0 00 0 0 0 06 6
0 0
PERCENT OF TIME LESS-EQUAL INDICATED AMOUNT
Figure 81. - Outflow duration curve for monthly outflow discharges.
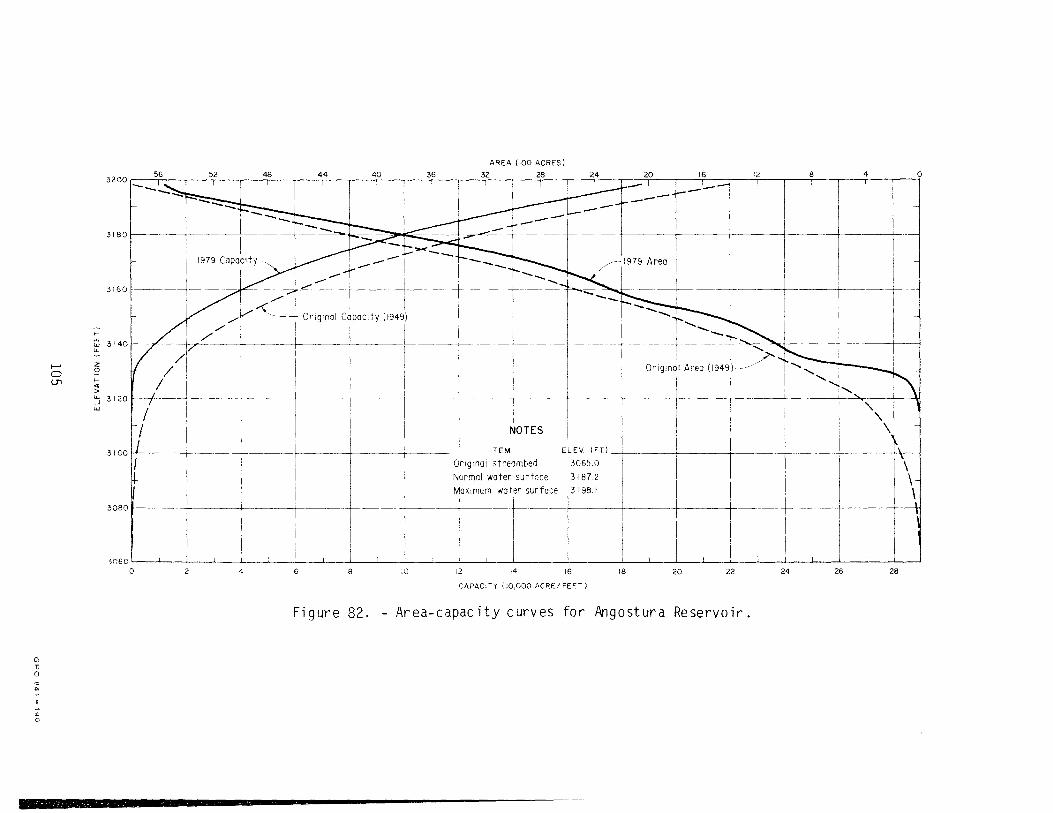
AREA (100 ACRES)56 52 48 44 40 36 32 28 24 20 6
3200
3 80
3160
3140Is-
z
(J>
3120s-i
3 I 00
3080
0
0
A
C
2 4 6 8 0 2 4 6 8 20 22 24 26 28
CAPACITY (10,000 ACRE/FEET)
Figure 82. - Area-capacity curves for Angostura Reservoir.
30600
2 8 41 1 _ f - - - -
F
- -
NOTES \
O
ITEM ELEV, )FT)_rFgna streambed 3065.0
N f 3)87 2) ter sur ace .orma wa
_. J F I I
M
I
axtmum water surface 3198.1
I F I J I __________ I I -
Mission of the Bureau of Reclamation
The Bureau of Reclamation of the U.S. Department of the Interior isresponsible for the development and conservation of the Nation'swater resources in the Western United States.
The Bureau's original purpose "to provide for the reclamation of aridand semiarid lands in the West" today covers a wide range of interre-lated functions. These include providing municipal and industrial watersupplies; hydroelectric power generation; irrigation water for agricul-ture; water quality improvement flood control; river navigation; riverregulation and control; fish and wildlife enhancement; outdoor recrea-tion; and researcli on water-related design, construction, materials,atmospheric management, and wind and solar power.
Bureau programs most frequently are the result of close cooperationwith the U.S. Congress, other Federal agencies, States, local govern-ments, academic institutions, water-user organizations, and otherconcerned groups.
A free pamphlet is available from the Bureau entitled "Publicationsfor Sale." It describes some of the technical publications currentlyavailable, their cost, and how to order them. The pamphlet can beobtained upon request from the Bureau of Reclamation, Attn D-922,P 0 Box 25007, Denver Federal Center, Denver CO 80225-0007.