nile basin reservoir sedimentation · 5.4 gis approach for sedimentation analysis ... present an...
TRANSCRIPT

Nile Basin Reservoir Sedimentation
Prediction and Mitigation
BY
Kamaleldin E. Bashar
ElTahir Osman ElTahir
Sami Abdel Fattah
Alnazir Saad Ali
Muna Musnad
Ishraqa Osman S.
Coordinated By
Dr. Ahmed Musa Siyam
UNESCO Chair in Water Resources-Sudan
Scientific Advisor
Dr. Alessandra Crosato UNESCO-IHE
2010

Produced by the Nile Basin Capacity Building network (NBCBN-SEC) office Disclaimer The designations employed and presentation of material and findings through the publication don’t imply the expression of any opinion whatsoever on the part of NBCBN concerning the legal status of any country, territory, city, or its authorities, or concerning the delimitation of its frontiers or boundaries. Copies of NBCBN publications can be requested from: NBCBN-SEC Office Hydraulics Research Institute 13621, Delta Barrages, Cairo, Egypt Email: [email protected] Website: www.nbcbn.com Images on the cover page are property of the publisher © NBCBN 2010

Project Title
Knowledge Networks for the Nile Basin
―Using the innovative potential of Knowledge Networks and CoP’s in strengthening human and
institutional research capacity in the Nile region‖
Implementing Leading Institute
UNESCO-IHE Institute for Water Education, Delft, The Netherlands (UNESCO-IHE)
Partner Institutes
Nine selected Universities and Institutions from Nile Basin Countries.
Project Secretariat Office
NBCBN-SEC office, Hydraulics Research Institute – Cairo - Egypt
Beneficiaries
Water sector professionals and institutions in the Nile Basin Countries
Short Description
The idea of establishing a Knowledge Network in the Nile region emerged after encouraging experiences
with the first Regional Training Centre on River Engineering in Cairo since 1996. In January 2002 more
than 50 representatives from all ten Nile basin countries signed the Cairo Declaration at the end of a kick-
off workshop was held in Cairo. This declaration in which the main principles of the network were laid
down marked the official start of the Nile Basin Capacity Building Network in River Engineering
(NBCBN-RE) as an open network of national and regional capacity building institutions and professional
sector organizations.
NBCBN is represented in the Nile basin countries through its nine nodes existing in Egypt, Sudan,
Ethiopia, Tanzania, Uganda, Kenya, Rwanda, Burundi and D. R. Congo. The network includes six
research clusters working on different research themes namely: Hydropower, Environmental Aspects, GIS
and Modelling, River Morphology, flood Management, and River structures.
The remarkable contribution and impact of the network on both local and regional levels in the basin
countries created the opportunity for the network to continue its mission for a second phase. The second
phase was launched in Cairo in 2007 under the initiative of; Knowledge Networks for the Nile Basin. New
capacity building activities including knowledge sharing and dissemination tools, specialised training
courses and new collaborative research activities were initiated. The different new research modalities
adopted by the network in its second phase include; (i) regional cluster research, (ii) integrated research,
(iii) local action research and (iv) Multidisciplinary research.
By involving professionals, knowledge institutes and sector organisations from all Nile Basin countries,
the network succeeded to create a solid passage from potential conflict to co-operation potential and
confidence building between riparian states. More than 500 water professionals representing different
disciplines of the water sector and coming from various governmental and private sector institutions
selected to join NBCBN to enhance and build their capacities in order to be linked to the available career
opportunities. In the last ten years the network succeeded to have both regional and international
recognition, and to be the most successful and sustainable capacity building provider in the Nile Basin.


1 INTRODUCTION.........................................................................................................................................1
1.1 Introduction................................................................................................................................................1
1.2 Statement of the Problem..........................................................................................................................1
1.3 Purpose of the Study..................................................................................................................................2 1.3.1 Long Term Objective ......................................................................................................................... 2 1.3.2 Short Term Objectives ....................................................................................................................... 2
1.4 Significance of the Study...........................................................................................................................2
1.5 Research Questions and Hypothesis........................................................................................................3
2 BACKGROUND.........................................................................................................................................4 2.1 Preamble............................................................................................................................................. 4 2.2 Reservoir Sediment Transportation and Deposition .......................................................................... 5
2.2.1 Types of Reservoir Sedimentation ..................................................................................................... 6 2.3 Sediment Impacts ............................................................................................................................... 8
2.3.1 Impact of Sediments on Hydro-plant Equipments ............................................................................. 8 2.3.2 Impact of Sediments on Cooling System ........................................................................................... 8 2.3.3 Impact of Sedimentation on Power Intake Blockage and the Practiced Sediment Removal Measures
.................................................................................................................................................................... 8 2.4 Sediment Removal Activities in Sudan .............................................................................................. 9 2.5 Reservoir Sedimentation previous Studies ....................................................................................... 10 2.6 Trap Efficiency ................................................................................................................................ 10
3 METHODOLOGY...............................................................................................................................15 3.1 Introduction ...................................................................................................................................... 15 3.2 Inventory of Dams in Sudan ............................................................................................................ 15 3.3 Selection Criterion of Case Studies .................................................................................................. 18 3.4 Selected Case Studies ....................................................................................................................... 18
4 ROSEIRES RESERVOIR................................................................................................................ ..19 4.1 Introduction ...................................................................................................................................... 19 4.2 The Study Area ................................................................................................................................ 19 4.3 The Data ........................................................................................................................................... 20 4.4 Roseires Reservoir Operations ......................................................................................................... 20 4.5 Sediment Accumulation ................................................................................................................... 20 4.6 Siltation Rate .................................................................................................................................... 21 4.7 Trap Efficiency ................................................................................................................................ 21 4.8 Storage Capacity Variation and Silt Deposited ................................................................................ 22 4.9 Trap Efficiency ................................................................................................................................ 24 4.10 Accumulation Rate ........................................................................................................................... 25 4.11 Impacts of Sediment in Hydropower Plants ..................................................................................... 26 4.12 Impact of Sediment on Cooling Systems ......................................................................................... 26 4.13 Impact of Sedimentation on Power Intake Blockage and the Practiced Sediment Removal Measures
...........................................................................................................................................................28 4.14 References ........................................................................................................................................ 28
5 ASWAN HIGH DAM (AHD)...............................................................................................................29 5.1 Introduction ...................................................................................................................................... 29 5.2 Previous Sediment Studies at AHD ................................................................................................. 30
5.3 Traditional Approach for Sedimentation Analysis........................................................................... 30 5.4 GIS Approach for Sedimentation Analysis ...................................................................................... 30 5.5 Methodology .................................................................................................................................... 31 5.6 Sediment Deposition Mapping ......................................................................................................... 32 5.7 Conclusions and Recommendations ................................................................................................ 33 5.8 References ........................................................................................................................................ 34 List of Research Group Members
LIST OF FIGURES
FIGURE 2-1: LONGITUDINAL CROSS SECTION OF RESERVOIR SEDIMENTATION ................................................... 6 FIGURE 2-2: TRAP EFFICIENCY CURVES DUE TO BRUNE ..................................................................................... 11 FIGURE 2-3: TRAP EFFICIENCY CURVE FOR RESERVOIRS, CHURCHILL (1948). .................................................. 12 FIGURE 2-4: COMPARISON OF ROSEIRES RESERVOIR TRAP EFFICIENCY DATA WITH THAT OF BRUNE’S (SIYAM,
2005) .......................................................................................................................................................... 14
FIGURE 4- 1: LOCATION OF THE ROSEIRES DAM AND RESERVOIR WITHIN THE BLUE NILE IN ETHIOPIA AND
SUDAN ........................................................................................................................................................ 19 FIGURE 4- 2: VARIATION OF STORAGE WITH TIME AND RESERVOIR LEVEL ....................................................... 23 FIGURE 4- 3: VARIATION OF STORAGE WITH TIME AND RESERVOIR LEVEL ....................................................... 23 FIGURE 4-4: VARIATION OF TRAP EFFICIENCY OF THE RESERVOIR WITH YEARS OF OPERATION ....................... 24 FIGURE 4-5: VARIATION OF % SILTATION RATE WITH TIME AND RESERVOIR LEVEL ......................................... 25 FIGURE 4-6: VARIATION OF THE SILTATION RATE WITH AREA IN 2005 AND 2007 ............................................. 26
FIGURE 5- 1: CROSS SECTIONS OF AHDR FOR YEARS 1964, 1998, AND 2003 ...................................................... 32 FIGURE 5- 2: RESERVOIR BED ELEVATION (2003) AND SEDIMENT DEPOSITION (2003) ..................................... 33
LIST OF TABLES
TABLE 2-1: RESERVOIR SEDIMENTATION IN SOME DAMS IN THE NILE RIVER AND NEIGHBOURING RIVERS AND
ADDITIONAL STUDIES CARRIED OUT ............................................................................................................. 4 TABLE 2- 2:DIFFERENT SEDIMENT REMOVAL EQUIPMENTS USED IN EVACUATING SEDIMENTS ....................... 9 TABLE 2-3: COEFFICIENTS FOR CLAY, SILT AND SAND (KG/M3) ...................................................................... 13 TABLE 2-4: K VALUE FOR RESERVOIR OPERATION 2 (USPR, 1982) ................................................................ 13 TABLE 2-5: ASSUMED COMPOSITION OF DEPOSITED SEDIMENT IN ROSEIRES RESERVOIR. ............................. 13
TABLE 3-1: INVENTORY OF OPERATIONAL DAMS IN SUDAN ............................................................................. 15 TABLE 3- 2A: INVENTORY OF DAMS UNDER CONSTRUCTION: MERAWI DAM .................................................. 16 TABLE 3-2B: INVENTORY OF DAMS UNDER CONSTRUCTION: HEIGHTENING OF THE ROSEIRES ....................... 17
TABLE 3- 3: INVENTORY OF PROPOSED DAMS ................................................................................................... 17 TABLE 3-4: RESERVOIR SEDIMENTATION IN SOME DAMS IN THE NILE RIVER AND NEIGHBOURING RIVERS AND
ADDITIONAL STUDIES CARRIED OUT ........................................................................................................... 18
TABLE 4-1: STORAGE CAPACITY ....................................................................................................................... 22 TABLE 4-2: ACCUMULATED SILT VOLUME DEPOSIT FOR DIFFERENT SURVEYS................................................. 23 TABLE 4-3: ROSEIRES RESERVOIR TRAP EFFICIENCY % ................................................................................... 24 TABLE 4-4: SILTATION RATE FOR DIFFERENT SURVEYS (MM3/YEAR) ............................................................. 25 TABLE 4-5: SILT DEPOSITED PER YEAR AS A PERCENTAGE OF STORAGE CAPACITY (2005, 2007) .................... 25 TABLE 4-6: EQUIPMENTS DEPRECIATION DUE TO SILTATION IN ROSEIRS RESERVOIR .................................... 26 TABLE 4- 7: COST OF ENERGY DUE TO COOLING SYSTEM BLOCKAGE ............................................................. 27
TABLE 5- 1: NAMES AND LOCATIONS OF THE HYDROGRAPHIC SURVEY STATIONS IN AHDR ......................... 31

This report is one of the final outputs of the research activities under the second phase of the Nile Basin Capacity Building Network
(NBCBN). The network was established with a main objective to build and strengthen the capacities of the Nile basin water
professionals in the field of River Engineering. The first phase was officially launched in 2002. After this launch the network has
become one of the most active groupings in generating and disseminating water related knowledge within the Nile region. At the
moment it involves more than 500 water professionals who have teamed up in nine national networks (In-country network nodes)
under the theme of “Knowledge Networks for the Nile Basin”. The main platform for capacity building adopted by NBCBN is
“Collaborative Research” on both regional and local levels. The main aim of collaborative research is to strengthen the individual
research capabilities of water professionals through collaboration at cluster/group level on a well-defined specialized research theme
within the field of River and Hydraulic Engineering.
This research project was developed under the “Cluster Research Modality”. This research modality is activated through
implementation of research proposals and topics under the NBCBN research clusters: Hydropower Development, Environmental
Aspects of River Engineering, GIS and Modelling Applications in River Engineering, River Morphology, flood Management, and
River structures.
This report is considered a joint achievement through collaboration and sincere commitment of all the research teams involved with
participation of water professionals from all the Nile Basin countries, the Research Coordinators and the Scientific Advisors.
Consequently the NBCBN Network Secretariat and Management Team would like to thank all members who contributed to the
implementation of these research projects and the development of these valuable outputs.
Special thanks are due to UNESCO-IHE Project Team and NBCBN-Secretariat office staff for their contribution and effort done in
the follow up and development of the different research projects activities.

This research is a follow up-in depth- of the Phase I completed research titled ―Assessment of the Current
state of the Nile Basin Reservoir Sedimentations Problems”. The main objective of this research is to
present an overview of the reservoir sedimentation problems in the Nile Basin. Some specific objectives
were carried out e.g. Determination of optimum reservoir operation policies, providing guidelines for the
assessment of remaining capacity and useful life of reservoirs, assessment of the suitability of the selected
models, creating database and data inventory of the operated, on going and proposed dams.
Two case studies were selected. The selection criteria based on the availability of data, suitability of the
site research problems and contribution of the case study to the general understanding of the research
problems. One case study was selected from Sudan at Rosiers reservoir and the other case study was from
Egypt at Aswan High Dam.
For Rosiered reservoir case study, secondary data was collected from the dams’ operation unit in the
Ministry of Irrigation and Water Resources. Bathymetric surveys carried at Roseires reservoir (1976, 1981,
1985, 1992, 2005 and 2007) were composed and used to estimate the sediment accumulation,
sedimentation rate and trap efficiency. The 1966 data was used as the base line information and all other
surveys were compared to it for storage and sedimentation estimation.
Remote sensing and GIS techniques were applied in Aswan High Dam case study. Different surface maps
were generated with different subsequent survey to illustrate the seasonal sediment transport characteristics
of the system. Based on the results of the GIS applications, identification of the major zones ranging from
low to high sediment deposits, accumulation of sediment deposits over the years, associated depths, and
their geographical distributions were recognized.
The conclusion achieved can be summarized as follows: -
A- Roseirs Reservoir
A-1. Storage capacity losses
It is found that the average annual silt deposited in Roseirse reservoir since first filling is about 273 Mm3,
that means the storage capacity of the reservoir have been decreased by 37% from the install capacity
A-2. Trap Effecieny
A relationship between observed trap efficiency and years of operation was found. The trap efficiency for
the reservoir follows linearly the square root of time and is inversely proportional to it. It is projected that
the trap efficiency of Roseires reservoir after 100 tears will be in the order of 14%.
A-3. Accumulation Rate
It is observed that the siltation rate has been dropped from 16.01 million cubic meters per year to 15.22
million cubic meters per year at 467 reduce level and from 35.75 million cubic meters per year to 34.34
million cubic meters per year at 481 reduce levels.
A-4 Socio Economic Impact
The cost due to loss of efficiency in energy generation and repair shutdown was estimated. It is found that
the silt loads which inflow to power intakes cause wear to all water ways and result in decrease of its life
span. The energy lost due to cooling system blockage in Roseirse hydro plant:
B- High Aswan Dam
By comparing sediment deposition maps of year 1999, 2001 and 2003 resulted from applying GIS
techniques, it is concluded that a significant sediment deposition was achieved since more than 80% of the
deposit thickness was more than 2.5. The larger changes from year 1999 to year 2003 occurred in the
wider entrance of the reservoir


AHDR: Aswan High Dam Reservoir
GIS: Geographic Information System
GPS: Geographic Position System
MOIWR: Ministry of Irrigation and Water Resources
NEC: National Electricity Corporation
RS: Remote Sensing
SI: sedimentation index
. : Trap Efficiency
UTM: Universal Transverse Mercator

River Morphology Research Cluster 2010
Nile Basin Capacity Building Network ( NBCBN ) 1
1
INTRODUCTION
1.1 Introduction
Reservoir sedimentation is a severe threat to the optimal use of water resources in many river basins. The Nile
Basin is no exception in this respect. Some of the reservoirs in the basin have already silted up substantially
(see below) and also new reservoirs like the Merowi dam and dams in Ethiopia and Uganda will be subject to
sedimentation and hence storage losses. Good prediction of the future reservoir sedimentation is important,
but even more important is to find optimal mitigation methods to reduce sedimentation after some years in
which inevitable sedimentation is taking place. A number of reservoirs elsewhere for example is now
regularly flushed and no further storage loss is experienced.
The Nile Basin Capacity Building Network for River Engineering (NBCBN-RE) was initiated in year 2000,
with the objective to create an environment where the professionals from the water sector sharing the River
Nile resources can exchange their ideas, practice and learn from each other to reach a common vision to
develop the water resources of the basin efficiently. Within this framework the phase II is now starting and the
present proposal was developed in line with the broad objectives of the NBCBN to materialize the exchanging
and learning processes. The network has created very good opportunities for the exchange of knowledge and
information between engineers and scientists on different technical issues and reservoir sedimentation is one
of the most important in this respect.
Hence this proposal outlines a research plan on Reservoir Sedimentation prepared for phase II (2006 – 2010)
by the River Morphology cluster. In the first phase of the NBCBN-RE project, the cluster completed a
research report titled ―Assessment of the Current State of the Nile Basin Reservoir Sedimentation Problems‖,
which presents an overview of reservoir sedimentation problems in the Nile Basin. For phase II and according
to this proposal a follow up in-depth research is proposed for a four year period from October 2006 to 2010.
The planned research is based on the outputs and recommendations of phase 1 report as well as the output of
the bridging workshop, 22-23 May 2005. It is split up in two parts, in line with the planning of Phase II of the
NBCBN-RE project.
1.2 Statement of the Problem
Worldwide Reservoir Sedimentation is a serious problem and considered as salient enemy. The graduate loss
of capacity reduces the effective life of dams and diminishes benefits for irrigation, hydropower generation,
flood control, water supply, navigation and recreation. On one hand sediment deposition propagates upstream
and up tributaries, raises local groundwater table, reduces channel flood capacity and bridge navigation
clearance, and affects water division and withdrawals. On the other hand, the reduction of the sediment load
downstream can result in channel and tributary degradation, bank erosion and in changes of the aquatic habits
to these more suited to a clearer water discharge.
As for the River Nile, there exist a number of dams that have been constructed during the last century. For
some others designs have either been completed or at feasibility stages as well as potential sites do exist for
new dam projects to come.
The existing reservoirs especially those on the Blue Nile and the River Nile are seriously affected by sediment
deposition at unexpected rates. Currently, for some reservoirs, costly sediment control measures are being
practiced. Decision of postponing the problem by heightening the dam has been taken and unresolved
River Morphology Research Cluster 2010
Nile Basin Capacity Building Network ( NBCBN ) 2
situation is waiting for those in design and planning stage. Also the Aswan High Dam, though large, it is
facing the problem of 100% trap efficiency. Further, in Sudan, Ethiopia and Uganda new dam projects are
underway or have been proposed.
Data pertaining to sedimentation, current adopted operation polices and practiced control measures in these
reservoirs in general are far from being comprehensive and/or optimised. In addition the impact of theses
polices and measures on new dam/reservoir projects or vies-versa need a thorough understanding and special
tackling as usually the consequences propagate in both upstream and downstream directions. It is expected
that launching joint research, within the basin, will contribute to the common understanding of the siltation
characteristics of the reservoirs in the region, help in defining the most suitable assessing tools (models), and
in selecting the most appropriate combat measures. The outcome is vital piece of information for both dam
owners and users as operation polices can be modified to prolong the useful life of reservoirs for future
generation.
1.3 Purpose of the Study
This study has two objectives long term and short term. The short-term objectives should be realized in the
Phase II studies.
1.3.1 Long Term Objective
1. Determination of optimum operation policy to combat sedimentation problems in the selected
reservoir.
2. Guidelines for the assessment of remaining capacity and useful life of reservoirs
3. Assessment of the suitability of the selected models.
4. Publishing papers to disseminate knowledge gained in regional and international peer-reviewed
journals
1.3.2 Short Term Objectives
1. Completion and creation of database with respect to the
I. Sediments and water in flows and out flows in the exciting reservoir.
II. Sedimentation rates
III. Adopted operation policies.
IV. State of water quality
V. Socio-economic and environmental impacts.
VI. General information about dams and reservoirs.
VII. Identification of problems and mitigation mechanism.
VIII. Inventory of proposed dams.
2. Exploring study in the use of satellite imagery to determine reservoir sedimentation
3. Simulation with a numerical model of sedimentation processes in some selected reservoirs to explore
the use of models to improve the understanding of sedimentation processes in reservoirs, including
the effect of some mitigation methods
4. Development of new mitigation measures to combat reservoir sedimentation measures and testing
them with the numerical model.
5. Building capacity in the field of reservoir sedimentation prediction and mitigation.
1.4 Significance of the Study
The reservoir storage is used for water supply, irrigation, power generation and flood control but in the Sudan,
creeping problem of sedimentation causes several implications. First, the lost storage capacity has an
opportunity cost in the form of replacement costs for construction of new storage since the present level of
supply is to be maintained. Second, there are direct losses in the form of less hydropower production capacity

River Morphology Research Cluster 2010
Nile Basin Capacity Building Network ( NBCBN ) 3
available, less irrigated land to produce food and reduced flood routing capacity. Finally the fully silted
reservoirs created a decommissioning problem that has both direct and indirect costs.
For example in Roseires reservoir, regardless of the all efforts done by National Electricity Corporation
(NEC) and MOIWR, the sediment problems are still in growing, The adverse effects of these problems can be
clearly reflected on the socio-economical part to the all users of the dam. The average cost of sediment
removal may reach more than 626,000 million US$ per year. Currently the average annual volume of
sediment removed from the hydropower intakes is estimated to be 125 Mm3/year at an average cost of 5 US$
per cubic meter.
From this point of view, this study attempted to promote the deep investigation in the reservoir sedimentation
problems, obtaining all the necessary data, searching for the modern silt removal techniques worldwide used,
pointing the appropriate analytical tools to provide reasonably reliable results, investigating the existing
reservoir operational rules and policies and come up with recommendations that can provide the decision
makers with appropriate solution.
1.5 Research Questions and Hypothesis
The research questions to be answered include:
1. How much storage capacity lost in the reservoirs under consideration?
2. At what rate is the loss of capacity taking place?
3. What is the current trap efficiency of the reservoirs under consideration?
4. What are the available techniques to de silt the reservoirs and their relative costs?
5. What are the socio-economic impacts of the sedimentation?
6. Can the new techniques such as hydro suction be used in our reservoirs?
River Morphology Research Cluster 2010
Nile Basin Capacity Building Network ( NBCBN ) 4
2
BACKGROUND
2.1 Preamble
Causes of reservoir sedimentation along with the range of problems caused were discussed in research report
―Assessment of the current state of the Nile basin reservoir sedimentation problems‖ prepared in Phase I.
Table 2.1 gives an overview of to what extent some reservoirs in the Nile basin and neighbouring basins have
been affected by reservoir sedimentation. For some reservoirs the sedimentation has seriously affected the
available storage.
As stated in the first report the overall objective of Reservoir Sedimentation research (Group I) is develop
methods to manage efficiently and economically reservoir sedimentation in the Nile basin. Research carried
out in the first phase has achieved the following results.
Overview of existing reservoir sedimentation problems in the Nile Basin.
Estimation of sediment deposition and distribution on five reservoirs on the Nile system and one
neighbouring river system.
Investigation of socio-economic impacts of reservoir sedimentation problem.
Critical examination of control measures, practices, successes and failures.
Design and early start of database on reservoir sedimentation.
Identification of future research needs.
Identify cross-cutting themes for future joint research work between and among research groups/clusters.
Identified capacity building needs for the Nile Basin researchers in river engineering in general and
reservoir sedimentation in particular.
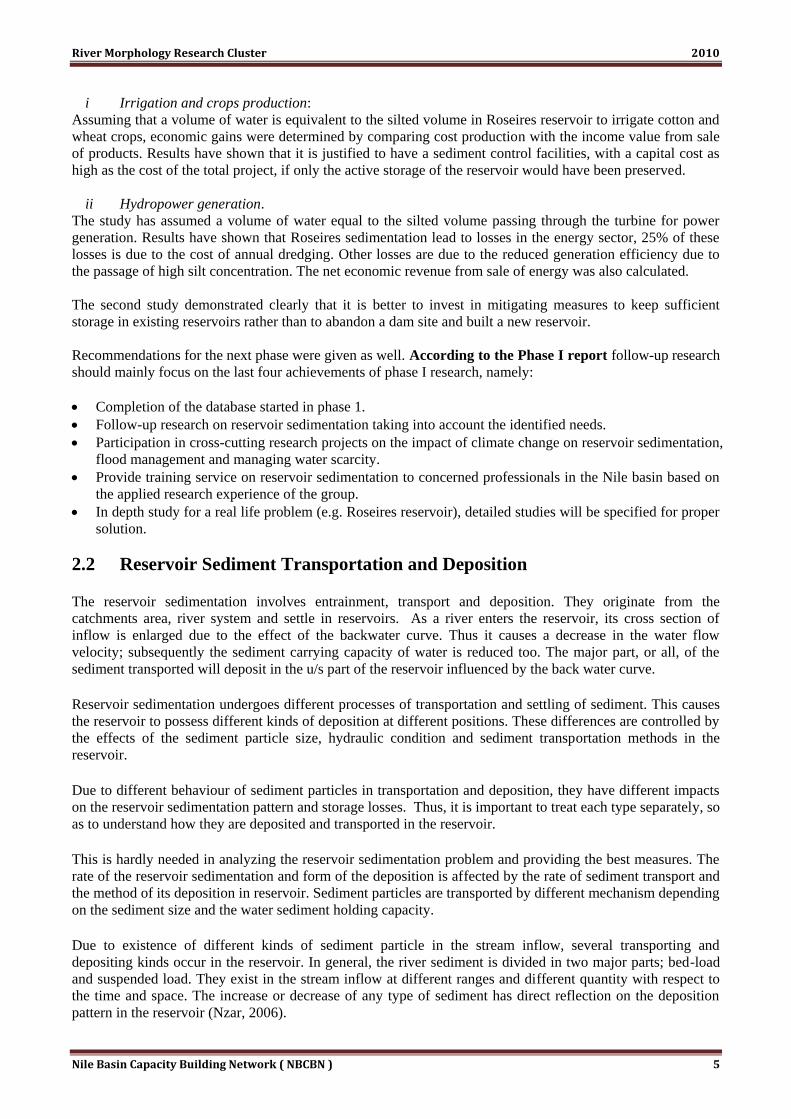
Table 2-1: Reservoir sedimentation in some dams in the Nile River and Neighbouring rivers and additional
studies carried out
Reservoir Country Period
considered
Storage
losses
Additional studies carried
out under Phase I
Angereb
Ethiopia 1986-2005 15%
Koka (Awash R.) Ethiopia 1960-1999 32%
Roseires Sudan 1966-1995 40% Economic studies of reservoir
sedimentation.
Khashm
El-girba
Sudan 1964- 60% Study of the socio-economic
impact of reservoir
sedimentation.
Aswan high Dam Egypt 1964-1995 1.84%
It is relevant to summarize below the results of the investigation of socio-economic impacts of sedimentation
in Roseires reservoir.
In this study, two aspects were studied, the impact of reservoir sedimentation in the rates and availability of
water for crop production and power generation.
River Morphology Research Cluster 2010
Nile Basin Capacity Building Network ( NBCBN ) 5
i Irrigation and crops production:
Assuming that a volume of water is equivalent to the silted volume in Roseires reservoir to irrigate cotton and
wheat crops, economic gains were determined by comparing cost production with the income value from sale
of products. Results have shown that it is justified to have a sediment control facilities, with a capital cost as
high as the cost of the total project, if only the active storage of the reservoir would have been preserved.
ii Hydropower generation.
The study has assumed a volume of water equal to the silted volume passing through the turbine for power
generation. Results have shown that Roseires sedimentation lead to losses in the energy sector, 25% of these
losses is due to the cost of annual dredging. Other losses are due to the reduced generation efficiency due to
the passage of high silt concentration. The net economic revenue from sale of energy was also calculated.
The second study demonstrated clearly that it is better to invest in mitigating measures to keep sufficient
storage in existing reservoirs rather than to abandon a dam site and built a new reservoir.
Recommendations for the next phase were given as well. According to the Phase I report follow-up research
should mainly focus on the last four achievements of phase I research, namely:
Completion of the database started in phase 1.
Follow-up research on reservoir sedimentation taking into account the identified needs.
Participation in cross-cutting research projects on the impact of climate change on reservoir sedimentation,
flood management and managing water scarcity.
Provide training service on reservoir sedimentation to concerned professionals in the Nile basin based on
the applied research experience of the group.
In depth study for a real life problem (e.g. Roseires reservoir), detailed studies will be specified for proper
solution.
2.2 Reservoir Sediment Transportation and Deposition
The reservoir sedimentation involves entrainment, transport and deposition. They originate from the
catchments area, river system and settle in reservoirs. As a river enters the reservoir, its cross section of
inflow is enlarged due to the effect of the backwater curve. Thus it causes a decrease in the water flow
velocity; subsequently the sediment carrying capacity of water is reduced too. The major part, or all, of the
sediment transported will deposit in the u/s part of the reservoir influenced by the back water curve.
Reservoir sedimentation undergoes different processes of transportation and settling of sediment. This causes
the reservoir to possess different kinds of deposition at different positions. These differences are controlled by
the effects of the sediment particle size, hydraulic condition and sediment transportation methods in the
reservoir.
Due to different behaviour of sediment particles in transportation and deposition, they have different impacts
on the reservoir sedimentation pattern and storage losses. Thus, it is important to treat each type separately, so
as to understand how they are deposited and transported in the reservoir.
This is hardly needed in analyzing the reservoir sedimentation problem and providing the best measures. The
rate of the reservoir sedimentation and form of the deposition is affected by the rate of sediment transport and
the method of its deposition in reservoir. Sediment particles are transported by different mechanism depending
on the sediment size and the water sediment holding capacity.
Due to existence of different kinds of sediment particle in the stream inflow, several transporting and
depositing kinds occur in the reservoir. In general, the river sediment is divided in two major parts; bed-load
and suspended load. They exist in the stream inflow at different ranges and different quantity with respect to
the time and space. The increase or decrease of any type of sediment has direct reflection on the deposition
pattern in the reservoir (Nzar, 2006).

River Morphology Research Cluster 2010
Nile Basin Capacity Building Network ( NBCBN ) 6
2.2.1 Types of Reservoir Sedimentation
The river flow usually carries a wide range of the sediment particle sizes and they are transported either as a
bed load or as a suspended load. In general, the bed load material (coarse sediment particles) move near the
bed and start to deposit in the beginning of the reservoir entrance in the form of the delta as shown in figure
(2.1). The suspended sediments (fine sediment particle with lower settling velocities) are transported deeper
into the reservoir either by non stratified flow forming a uniform deposition at the middle of reservoir, or by
stratified flow depositing at lower part of the reservoir forming a muddy lake. Generally the suspended load is
divided in two parts; one comes from the bed of the river, and the other load from the catchments area as wash
load.
Batuca and Jordaan (2000) have classified the reservoir sedimentation based on the location of deposition
into three categories, with inclusion of the sedimentation in backwater reaches as a part of the reservoir
sedimentation. The position of each type of reservoir sedimentation can be seen in the longitudinal profile of
the reservoir shown in figures 2.1 which are classified as Back water deposition, Delta deposition and Bottom
set deposition.
Figure 2-1: longitudinal cross section of reservoir sedimentation
Back water Deposition
This type of deposition occurs in the river reach before entering the reservoir. After changing the water level
in the river by the effect of back water curve, the velocity of water will be reduced. Subsequently a small part
of the coarse sediment will deposit in this region till it reaches the reservoir delta deposition. It is considered
as a transition between the original river bed and delta formation as shown in figure (2-1). In theory, the
backwater deposit should grow progressively, into upward and downward direction of the river, because it
extends with changes of bed forms. However this growth is limited, because the stream adjusts its channel by
eliminating meanders, forming a channel having an optimum width-depth ratio or varying bed form
roughness. These factors make the stream transports its sediment load through the reach with evolution done
in one direction (Nzar, 2006).
The backwater deposition is not fixed, but it is fluctuated and advanced toward the reservoir and delta. As a
result of the variation of the reservoir water surface and water flow velocity, the backwater sediment is re-
eroded, transported toward the reservoir and contributes in the formation of the delta.
Delta formation
Delta formation is caused by rivers that enter a reservoir, lake, or sea. The process involves deposition of
sediment of large sand sizes (bed load) due to the reduction of stream sediment holding capacity.
River Morphology Research Cluster 2010
Nile Basin Capacity Building Network ( NBCBN ) 7
Mainly, the change of the water level and the expansion of the inflow cross section in the reservoir are
considered to be the most important reasons to diminish the water velocity and continuity of sediment
movement in the stream at the delta reach. Therefore the deposition happens in this place at the beginning.
The deltaic deposition takes place along and across the reservoir and its basin (in the main river reach and
over the flood plain as well) (Betuca and Jordaan, 2000).
From the observation of the reservoir sedimentation, the delta formation may contribute the majority of the
sedimentation in the hydrologic ally small reservoir. While for the large reservoir the delta constitutes only a
small part of sedimentation (Fan and Morris, 1997).
Due to the small volume of shallow part at head of reservoir, the deposition and formation of delta even with
small volume will be problematic from the standpoint of upstream aggradations. The longitudinal cross
section of the delta can be divided in two zones, the top-set bed and front-set bed which are different in
surface slope and deposition texture as given in figure (2-1). According to the US Bureau of Reclamation
(1986) the slope of top-set of the delta is in the range from 100% to 20% of the original bed slope, which was
found to be based on observation of 31 reservoirs in the United States.
For design purposes 50% slope is acceptable. Hence: -
S topset = 0.5S river
Based on the same survey data done by US Bureau of Reclamation (1986) the slope of front set can be have
the relation:-
S frontset = 6.5S topset
In some cases the delta formation takes the major part of the reservoir sedimentation. For example in
Glenmore reservoir at Canada, about 10 percent of its total water capacity was lost in the year 1968, with
about 70 percent of the deposits that occurred in the delta area (Fan and Morris, 1997).
The advancing shapes of the delta formation toward the reservoir are different. They are affected by
hydraulics and geometric shape of the reservoir inlet. This results in different advancing speed in delta
propagation, subsequently having different impacts on reservoir sedimentation. Sloff (1991) has indicated that
the parameters which affect the shape of delta formation are namely, Slope of the valley, length and shape of
the valley, sediment particle size and its distribution, and Reservoir operation and capacity of inflow ratio.
According to the empirical criterion which was developed by Zhang and Qian (1985), there are two major
type of delta formation. The 1st are the Wedge-shape deposits; in which the front reaches to the dam wall and
sediment site are uniformly distributed in the basin. The second are the delta-shape deposits; in which the
front does not reach to the dam wall and sediment site are non-uniformly distributed in the basin.
According to the experimental investigation made by Chang (1982) in the laboratory, the delta formation
starts with the deposition of the bed load at the channel mouth. The suspended load is deposited rather
uniformly over reservoir bottom (Nzar, 2006).
Bottom-set bed depositions
Bottom deposition of the reservoir is formed by transporting and depositing the fine sediment, which is carried
by the water to the middle and end of the reservoir in suspension stage. This type of deposition is mainly
composed of clay and silt fraction, which are transported in the reservoir water body either by the turbulent
suspension or by turbidity currents. Its deposition starts beyond the delta up stream the dam wall site.
The shape and configuration of the deposit is affected by the process of transporting and depositing of
suspended material. There are two main ways of transporting fine sediment into the reservoir body. First one
is by suspension action of the sediment particle. In this case they travel beyond the delta toward the reservoir
body either by the action of electro-magnetic of small particles or by turbulence action of flowing water. The
River Morphology Research Cluster 2010
Nile Basin Capacity Building Network ( NBCBN ) 8
second way is by gravity action on the sediment-laden water which enters to the bottom of the reservoir in the
form of turbidity current.
Depress flow
Woods and light material that come with flow cause many troubles and interruption during dams operation.
They are quite dangerous to gates and especially to running turbines when the protecting screens are broken
under the heavy pressure of the accumulated materials. The best method to get red of depress is to direct these
floating materials towards the spillways to pass downstream. However, since the depress (wood) come from
the upper catchments then it would be better to treat the problem there by improving and protecting the
environment of the wood source. For more information on this topic consult the reference (Nzar, 2006).
2.3 Sediment Impacts
2.3.1 Impact of Sediments on Hydro-Plant Equipments
The presence of sediment in water flowing through the turbine causes wear on all water ways components by
its abrasive impact. The higher the sediment content and the harder minerals it contain the greater the wear.
The wearing of the water ways results in poor performance of the plant than its optimum. This result in loss of
energy production during operation and ultimately the loss becomes so high that the plant has to be shutdown
to allow for the equipments to be repaired to its original performance. In such conditions there is cost due to
loss of efficiency in energy generation, repair shutdown. Moreover silt loads which inflow to power intakes
cause wear to all water ways and result in decrease of its life span.
2.3.2 Impact of Sediments on Cooling System
In spite of using effective water filtration systems to cooling water system in Roseirse hydro plant such as
screens, cyclones and double filters silt occasionally cause blocking to the coolers and results in rising
temperature in oil coolers for bearings and air coolers for generator. These resulted in tripping or isolating
units due to high temperature and this leads to decrease in generated power from the plant.
2.3.3 Impact of Sedimentation on Power Intake Blockage and the Practiced Sediment Removal
Measures
The Blue Nile, which is virtually unregulated in Ethiopia , carries a very heavy silt load (up to 3 million tones
per day) during the flood season , with the result that the Roseirse Reservoir below minimum operating level
become effectively to fill with sediment within about 10 years of first impounding. large quantities of
sediment both in suspension and as bed load were being transported through the reservoir during July to
august period. Blue Nile river catchments are rich with forest and farms, so the inflow from tributaries carries
very heavy loads of debris in addition to sediment load. It is anticipated that debris consisting of grass, roots,
and logs of all sizes need to be cleaning by special equipments. Since the time when the silt deposits first
reached the dam, the operation of the existing power station has been shown to be liable to serve disruption by
the effects of trashes and sediments inundating the intake screens during the rising spates of the flood.
Deposition in reservoir has restricted the flow within the main river channel by the formation of levees and
silt banks. The main channel of river is located in front of the deep sluices area. Flow to the spill ways and
power station intakes has tended to keep open a subsidiary channel to these two structures which run from the
deep sluices along the face of the dam. The effect of silt deposition in the front of the spillway have created
deeper channel 40 to 50 meters wide adjacent to the spillway where water will flow from the deep sluice
channel to the power plant intakes. It’s also possible that more submerged logs will be moved by these higher
velocities to the power plant.
River Morphology Research Cluster 2010
Nile Basin Capacity Building Network ( NBCBN ) 9
From the dam site, one can clearly identify three islands of silt located in back water upstream of the dam.
This is regarded as the delta deposits on the east embankment side and the biggest one in the west
embankment near the old power station intakes. Sediment deposition influences the physical aspects of water
quality and the aquatic system of the streams .The accumulation of sediment disturbed the operation of the
dam for flood control, power generation and irrigation.
The Ministry of Irrigation and Water Resources (MoIWR) has been responsible for all dams and reservoirs in
the Sudan before the newly formed Dams Implementation Unit. The Roseirse dam administration is
responsible for both operation and maintenance of the dam and reservoir.
During the flood seasons, Roseirse reservoir deposits large quantities of sediments in different area inside the
reservoir. The accumulation of sediment increase yearly and this could result in block of the water intakes. In
the case of Roseirse sedimentation emergency conditions prevailed in august 1980 with the intake to the
power plant blocked with trash and debris which severely reduced power generation. Large quantities of
sediment both in suspension and as bed load were being transported through the reservoir during the flood
season. The sediment combined with the trash blocks completely the trash screens at the power plant intakes.
Roseirse hydro power plant administration tried to decrease the effects of the power intakes blockage by
removing the accumulated debris and sediment in the front area of the power intakes by using trucks cranes.
Also they use a debris boom to stop debris to reach the screen of the power intakes moreover they installed
trash rake cranes for trashing the floating debris. The above efforts improve the performance of the power
plant during the flood season.
2.4 Sediment Removal Activities in Sudan
Due to very critical situation during the rainy season since 1975, the situation becomes so urgent that an
instant solution had to be found. In September 1980 based on efforts of PEWC and MOI, teamwork from
USAID (Agency for International Development) visited Roseirse reservoir to study the sedimentation
problems at Roseirse Dam project. The team recommended using special equipments for sediment removal
based on a full bathymetric surveys and direct site observation.
In 1984 a joint project was initiated by USAID, the Netherlands Development Cooperation Programme and
the Sudanese authorities. The donors of this project supplied the necessary grab dredgers, dump barges, tugs
and survey vessels. They dredging sediment from the morning area in the front of the power house and send
the dump barges to the main river channel for evacuation. In the flood season after opening the deep sluice
gates the evacuated sediment flushing by high current of river flow. The Dump Barge dredger now is
practice to carry out dredging in advance of the flood season (in summer season) in order to open out the
approach channel to the power intakes , and this has improved the situation during the flood season by letting
the incoming sediment trapping in the morning area before reaching near the power intakes.
A debris boom consisting of assembled sections of oil barrels about 100 meters in length was installed
upstream from the west abutment of the spillway.
During the flood season special type of pump (Toyio pump) used to suction slurry water from the front area of
the power intakes and delivered to down stream of the dam over the concrete body. Table 2.2 below shows the
different sediment removal equipments using for evacuation sediments from Roseirse reservoir.
Table 2- 2:Different Sediment Removal Equipments Used in Evacuating Sediments
NO- Equipments Install year Notes
1 Trash rake (gantry) 1983 Improve efficiency of generation
2 Adebris boom (oil
barrels boom)
1983 Isolating floating debris to reach the
power intakes
3 American Crane 1983 Cleaning sediment &debris in front of
River Morphology Research Cluster 2010
Nile Basin Capacity Building Network ( NBCBN ) 10
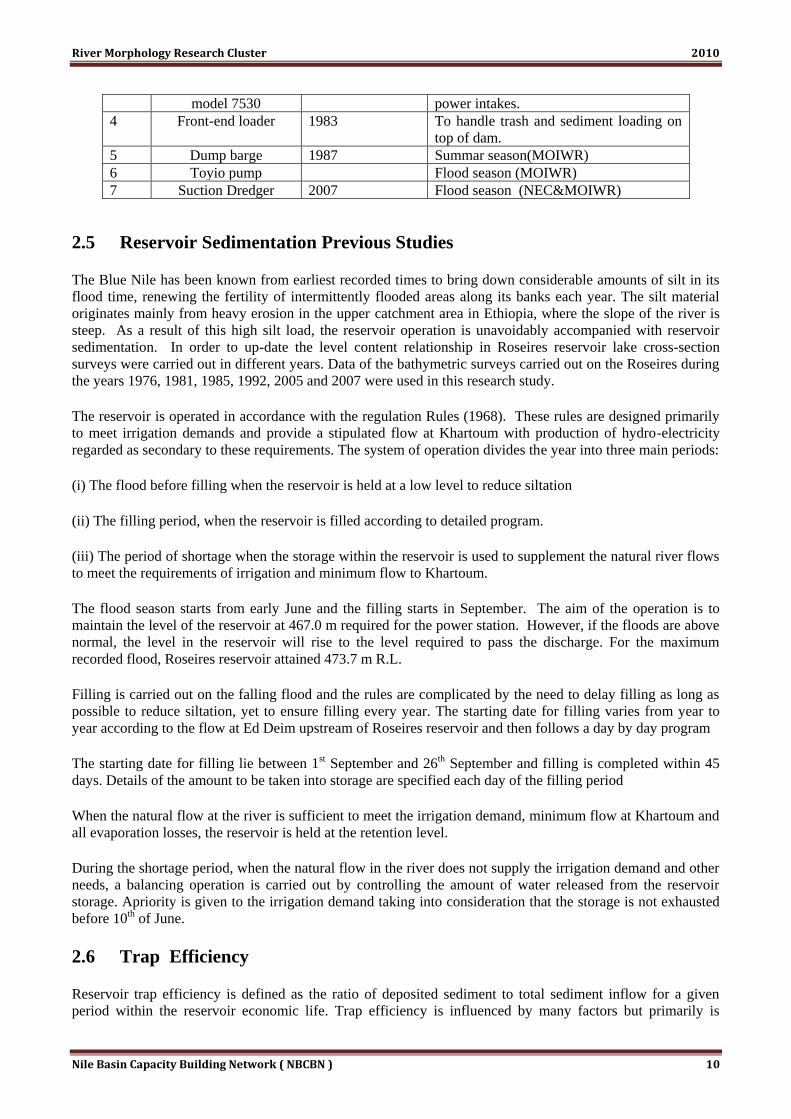
model 7530 power intakes.
4 Front-end loader 1983 To handle trash and sediment loading on
top of dam.
5 Dump barge 1987 Summar season(MOIWR)
6 Toyio pump Flood season (MOIWR)
7 Suction Dredger 2007 Flood season (NEC&MOIWR)
2.5 Reservoir Sedimentation Previous Studies
The Blue Nile has been known from earliest recorded times to bring down considerable amounts of silt in its
flood time, renewing the fertility of intermittently flooded areas along its banks each year. The silt material
originates mainly from heavy erosion in the upper catchment area in Ethiopia, where the slope of the river is
steep. As a result of this high silt load, the reservoir operation is unavoidably accompanied with reservoir
sedimentation. In order to up-date the level content relationship in Roseires reservoir lake cross-section
surveys were carried out in different years. Data of the bathymetric surveys carried out on the Roseires during
the years 1976, 1981, 1985, 1992, 2005 and 2007 were used in this research study.
The reservoir is operated in accordance with the regulation Rules (1968). These rules are designed primarily
to meet irrigation demands and provide a stipulated flow at Khartoum with production of hydro-electricity
regarded as secondary to these requirements. The system of operation divides the year into three main periods:
(i) The flood before filling when the reservoir is held at a low level to reduce siltation
(ii) The filling period, when the reservoir is filled according to detailed program.
(iii) The period of shortage when the storage within the reservoir is used to supplement the natural river flows
to meet the requirements of irrigation and minimum flow to Khartoum.
The flood season starts from early June and the filling starts in September. The aim of the operation is to
maintain the level of the reservoir at 467.0 m required for the power station. However, if the floods are above
normal, the level in the reservoir will rise to the level required to pass the discharge. For the maximum
recorded flood, Roseires reservoir attained 473.7 m R.L.
Filling is carried out on the falling flood and the rules are complicated by the need to delay filling as long as
possible to reduce siltation, yet to ensure filling every year. The starting date for filling varies from year to
year according to the flow at Ed Deim upstream of Roseires reservoir and then follows a day by day program
The starting date for filling lie between 1st September and 26th September and filling is completed within 45
days. Details of the amount to be taken into storage are specified each day of the filling period
When the natural flow at the river is sufficient to meet the irrigation demand, minimum flow at Khartoum and
all evaporation losses, the reservoir is held at the retention level.
During the shortage period, when the natural flow in the river does not supply the irrigation demand and other
needs, a balancing operation is carried out by controlling the amount of water released from the reservoir
storage. Apriority is given to the irrigation demand taking into consideration that the storage is not exhausted
before 10th of June.
2.6 Trap Efficiency
Reservoir trap efficiency is defined as the ratio of deposited sediment to total sediment inflow for a given
period within the reservoir economic life. Trap efficiency is influenced by many factors but primarily is
River Morphology Research Cluster 2010
Nile Basin Capacity Building Network ( NBCBN ) 11
dependent upon the sediment fall velocity, the detention-storage time, flow rate through the reservoir and
reservoir operation. The relative influence of each of these factors on the trap efficiency has not been
evaluated to the extent that quantitative values could be assigned to individual factors. The detention-storage
time in respect to character of sediment appears to be the most significant controlling factor in most reservoirs
(Siyam, 2005)
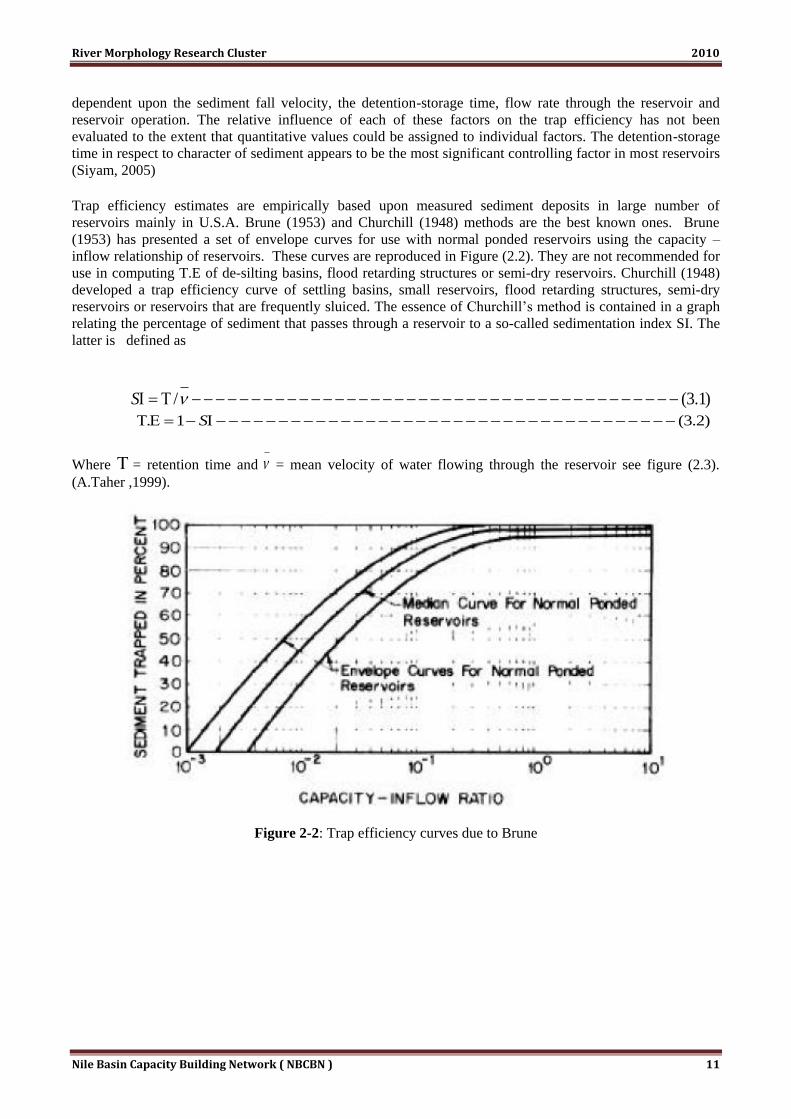
Trap efficiency estimates are empirically based upon measured sediment deposits in large number of
reservoirs mainly in U.S.A. Brune (1953) and Churchill (1948) methods are the best known ones. Brune
(1953) has presented a set of envelope curves for use with normal ponded reservoirs using the capacity –
inflow relationship of reservoirs. These curves are reproduced in Figure (2.2). They are not recommended for
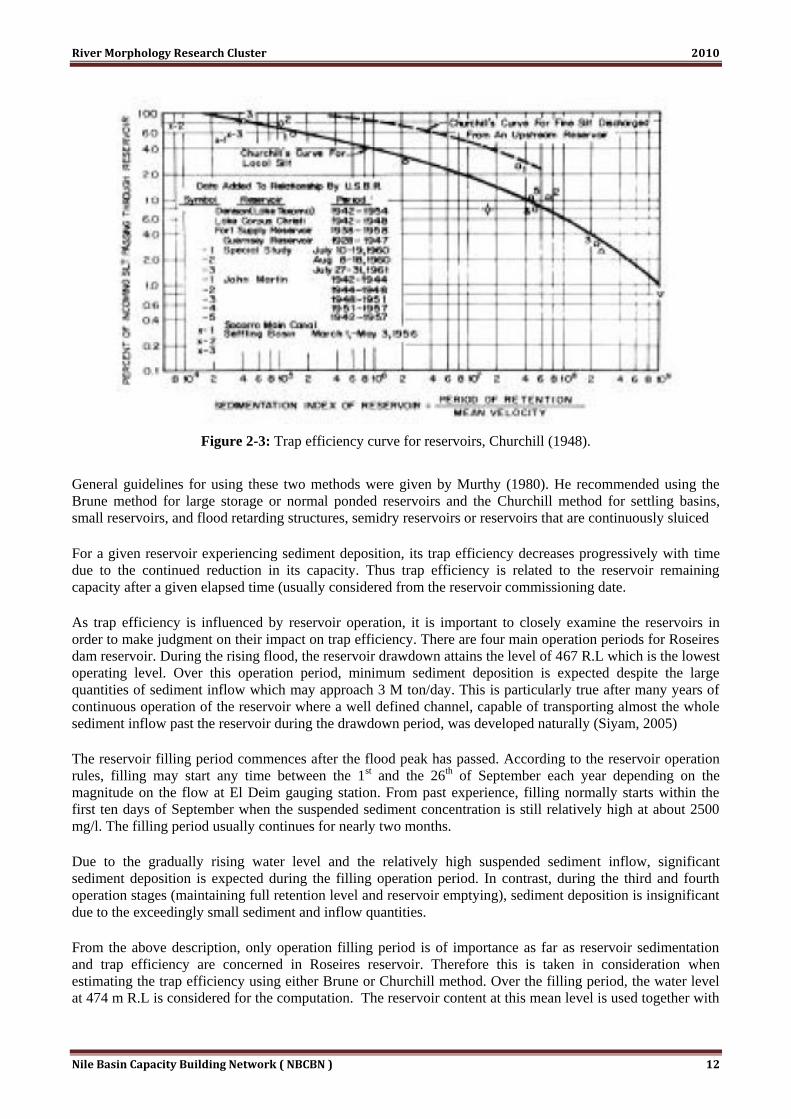
use in computing T.E of de-silting basins, flood retarding structures or semi-dry reservoirs. Churchill (1948)
developed a trap efficiency curve of settling basins, small reservoirs, flood retarding structures, semi-dry
reservoirs or reservoirs that are frequently sluiced. The essence of Churchill’s method is contained in a graph
relating the percentage of sediment that passes through a reservoir to a so-called sedimentation index SI. The
latter is defined as
)1.3(/ S
)2.3(1. S
Where = retention time and = mean velocity of water flowing through the reservoir see figure (2.3).
(A.Taher ,1999).
Figure 2-2: Trap efficiency curves due to Brune
River Morphology Research Cluster 2010
Nile Basin Capacity Building Network ( NBCBN ) 12
Figure 2-3: Trap efficiency curve for reservoirs, Churchill (1948).
General guidelines for using these two methods were given by Murthy (1980). He recommended using the
Brune method for large storage or normal ponded reservoirs and the Churchill method for settling basins,
small reservoirs, and flood retarding structures, semidry reservoirs or reservoirs that are continuously sluiced
For a given reservoir experiencing sediment deposition, its trap efficiency decreases progressively with time
due to the continued reduction in its capacity. Thus trap efficiency is related to the reservoir remaining
capacity after a given elapsed time (usually considered from the reservoir commissioning date.
As trap efficiency is influenced by reservoir operation, it is important to closely examine the reservoirs in
order to make judgment on their impact on trap efficiency. There are four main operation periods for Roseires
dam reservoir. During the rising flood, the reservoir drawdown attains the level of 467 R.L which is the lowest
operating level. Over this operation period, minimum sediment deposition is expected despite the large
quantities of sediment inflow which may approach 3 M ton/day. This is particularly true after many years of
continuous operation of the reservoir where a well defined channel, capable of transporting almost the whole
sediment inflow past the reservoir during the drawdown period, was developed naturally (Siyam, 2005)
The reservoir filling period commences after the flood peak has passed. According to the reservoir operation
rules, filling may start any time between the 1st and the 26th of September each year depending on the
magnitude on the flow at El Deim gauging station. From past experience, filling normally starts within the
first ten days of September when the suspended sediment concentration is still relatively high at about 2500
mg/l. The filling period usually continues for nearly two months.
Due to the gradually rising water level and the relatively high suspended sediment inflow, significant
sediment deposition is expected during the filling operation period. In contrast, during the third and fourth
operation stages (maintaining full retention level and reservoir emptying), sediment deposition is insignificant
due to the exceedingly small sediment and inflow quantities.
From the above description, only operation filling period is of importance as far as reservoir sedimentation
and trap efficiency are concerned in Roseires reservoir. Therefore this is taken in consideration when
estimating the trap efficiency using either Brune or Churchill method. Over the filling period, the water level
at 474 m R.L is considered for the computation. The reservoir content at this mean level is used together with
River Morphology Research Cluster 2010
Nile Basin Capacity Building Network ( NBCBN ) 13
an annual inflow of 50x109 m3 to estimate the trap efficiency using both methods. The results are compared
with measured values for the years when reservoir surveys were made. The measured trap efficiency is
computed from the following equation.
)3.3())10140/()(((%). 6
0 xxvv
Where, . = trap efficiency after T years of operation
0v = original reservoir volume, m3
v = volume remaining after T year of operation
= average specific weight of deposited sediment over T years (t/m3)
is calculated from the following equation (Miller, 1953)
4.311/434.0 Lnxi
Where i the initial is value of and is given by
5.3 sasaslslclcli
Where slcl , and sa are fractions of clay, silt and sand respectively of the incoming sediment.
slcl , and sa are coefficients of clay, silt and sand respectively which can be obtained from the table (2.3),
(USPR, 1982) for normally moderate to considerable reservoirs drawdown (Reservoir Operation 2) which is
the case for Roseires reservoir.
Table 2-3: Coefficients for Clay, Silt and Sand (kg/m3)
Clay Silt Sand
561 1140 1550
The compaction Coefficient K is found similarly from the table (2.4).
Table 2-4: K Value for Reservoir Operation 2 (USPR, 1982)
Clay Silt Sand
135 29 0
The composition of deposited sediment in Roseires reservoir differs widely. A reasonable approximate
composition assumed in this study is given in the table (2.5) below.
Table 2-5: Assumed Composition of Deposited Sediment in Roseires Reservoir.
Clay Silt Sand
25% 45% 30%
For theses assumed values γi = 1.118 t/m3 and K = 0.0468 t/m3.
Comprehensive field measurement core sampling programmer of deposited sediment in a number of major
and minor canals in Gezira Scheme was made in 1989 (HRL,1990). The mean value of γi for a depth below
bed level varying from 80 mm to 500 mm was 1.061 t/m3 which is very close to the adopted value for
Roseires reservoir considering that the Gezira Scheme draws its water from the Blue Nile.
River Morphology Research Cluster 2010
Nile Basin Capacity Building Network ( NBCBN ) 14
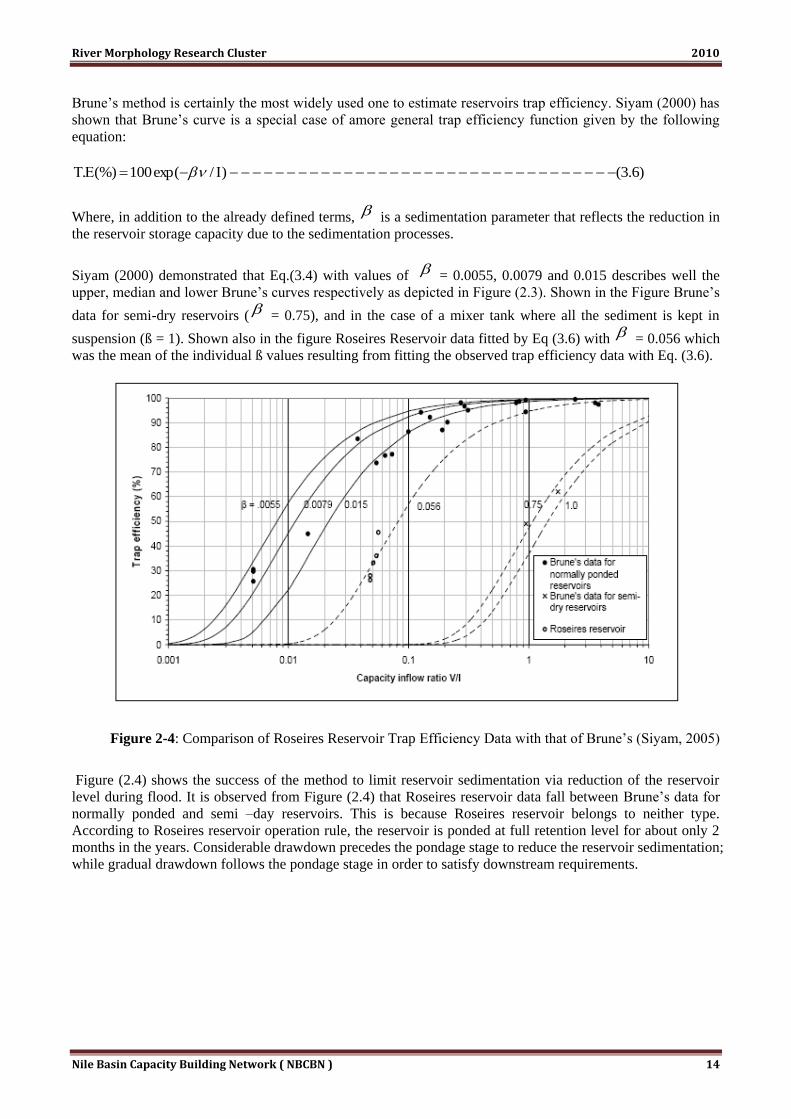
Brune’s method is certainly the most widely used one to estimate reservoirs trap efficiency. Siyam (2000) has
shown that Brune’s curve is a special case of amore general trap efficiency function given by the following
equation:
)6.3()/exp(100(%).
Where, in addition to the already defined terms, is a sedimentation parameter that reflects the reduction in
the reservoir storage capacity due to the sedimentation processes.
Siyam (2000) demonstrated that Eq.(3.4) with values of = 0.0055, 0.0079 and 0.015 describes well the
upper, median and lower Brune’s curves respectively as depicted in Figure (2.3). Shown in the Figure Brune’s
data for semi-dry reservoirs ( = 0.75), and in the case of a mixer tank where all the sediment is kept in
suspension (ß = 1). Shown also in the figure Roseires Reservoir data fitted by Eq (3.6) with = 0.056 which
was the mean of the individual ß values resulting from fitting the observed trap efficiency data with Eq. (3.6).
Figure 2-4: Comparison of Roseires Reservoir Trap Efficiency Data with that of Brune’s (Siyam, 2005)
Figure (2.4) shows the success of the method to limit reservoir sedimentation via reduction of the reservoir
level during flood. It is observed from Figure (2.4) that Roseires reservoir data fall between Brune’s data for
normally ponded and semi –day reservoirs. This is because Roseires reservoir belongs to neither type.
According to Roseires reservoir operation rule, the reservoir is ponded at full retention level for about only 2
months in the years. Considerable drawdown precedes the pondage stage to reduce the reservoir sedimentation;
while gradual drawdown follows the pondage stage in order to satisfy downstream requirements.

River Morphology Research Cluster 2010
Nile Basin Capacity Building Network ( NBCBN ) 15
3
METHODOLOGY
3.1 Introduction
The objective this study is to assess the sedimentation and its effects in some selected reservoirs in the Nile
basin. The study will explore the use of satellite imagery and GIS to determine reservoir sedimentation.
Simulation models of sedimentation processes will be used in some selected reservoirs to explore the use of
models to improve our understanding of sedimentation processes in reservoirs, including the effect of some
mitigation methods. The study aims at the development of new mitigation measures to combat reservoir
sedimentation and testing them with the numerical model.
In this chapter an overview of the dams in Sudan, a brief description of the criteria used to select the case
studies and the selected case studies will be given. The methodology used to achieve each objective is
described in its respective chapter.
3.2 Inventory of Dams in Sudan
The inventory of dams in Sudan is categorized into three groups namely operational dam, Dams under
construction and proposed dams. The inventory includes some basic information on dam’s characteristics.
Table 3.1, 3.2, 3.3 and 3.4 give the inventory of operational dams, dams under construction and proposed
dams respectively.
A. Operational Dams
Table 3-1: Inventory of operational dams in Sudan
Dam Name Time of
construct
ion
Water Level (m)
a.m.s.l
Design
Capacity
(Mm3)
Reduced
Capacity due
to
sedimentatio
n (Mm3)
No. Of Sluice
Gates
Minimum Maximum
Sennar
Dam
1925 417.2 421.7 930103 400 80 (8.4*2m)
&
72 (3.4*3m)
Gabel
Awlia Dam
1937 372.5 377.5 3.5 50 (4.5*3m)
Khashm
Elgirba
Dam
1964 463.5 474 1300 662
Roserois
Dam
1966 467 481 3.1*103 2*103 5
River Morphology Research Cluster 2010
Nile Basin Capacity Building Network ( NBCBN ) 16
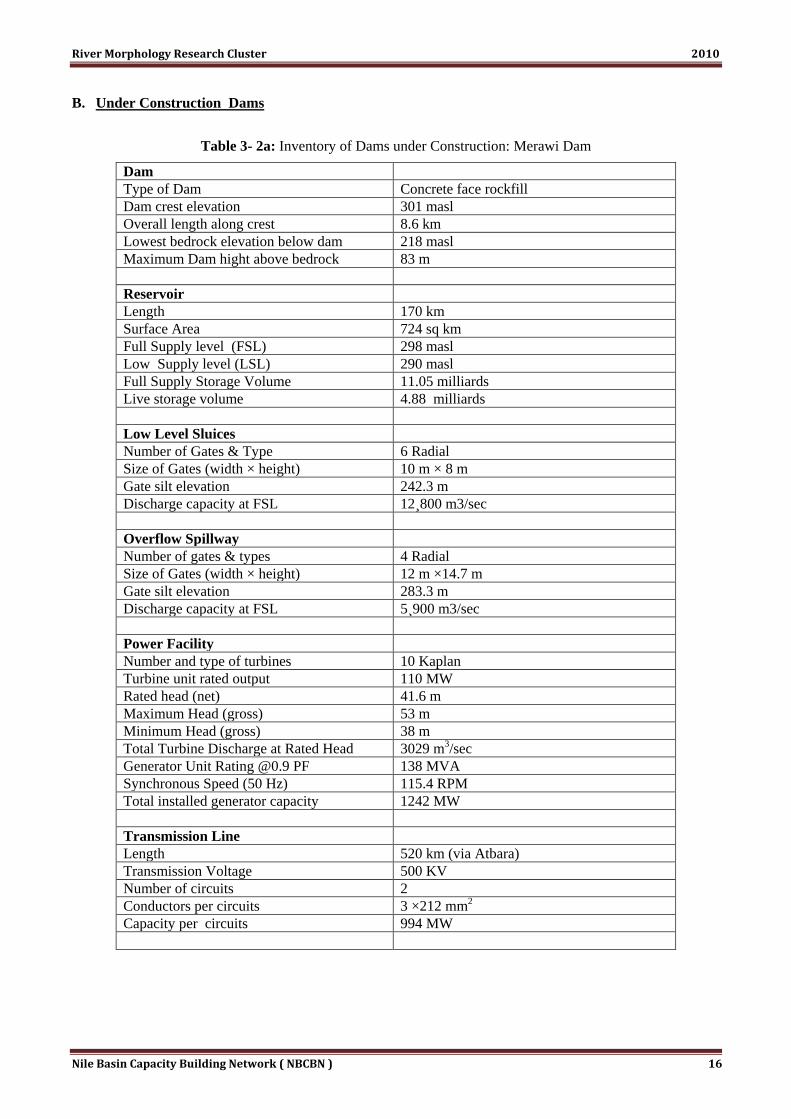
B. Under Construction Dams
Table 3- 2a: Inventory of Dams under Construction: Merawi Dam
Dam
Type of Dam Concrete face rockfill
Dam crest elevation 301 masl
Overall length along crest 8.6 km
Lowest bedrock elevation below dam 218 masl
Maximum Dam hight above bedrock 83 m
Reservoir
Length 170 km
Surface Area 724 sq km
Full Supply level (FSL) 298 masl
Low Supply level (LSL) 290 masl
Full Supply Storage Volume 11.05 milliards
Live storage volume 4.88 milliards
Low Level Sluices
Number of Gates & Type 6 Radial
Size of Gates (width × height) 10 m × 8 m
Gate silt elevation 242.3 m
Discharge capacity at FSL 12¸800 m3/sec
Overflow Spillway
Number of gates & types 4 Radial
Size of Gates (width × height) 12 m ×14.7 m
Gate silt elevation 283.3 m
Discharge capacity at FSL 5¸900 m3/sec
Power Facility
Number and type of turbines 10 Kaplan
Turbine unit rated output 110 MW
Rated head (net) 41.6 m
Maximum Head (gross) 53 m
Minimum Head (gross) 38 m
Total Turbine Discharge at Rated Head 3029 m3/sec
Generator Unit Rating @0.9 PF 138 MVA
Synchronous Speed (50 Hz) 115.4 RPM
Total installed generator capacity 1242 MW
Transmission Line
Length 520 km (via Atbara)
Transmission Voltage 500 KV
Number of circuits 2
Conductors per circuits 3 ×212 mm2
Capacity per circuits 994 MW

River Morphology Research Cluster 2010
Nile Basin Capacity Building Network ( NBCBN ) 17
Table 3-2b: Inventory of dams under construction: Heightening of the Roseires
Max Reservoir level 490 m a.m.s.l
Estimated surface area 600 km2
Estimated Heightening 10 m concrete dam
Length of embankment dam 25 km at the two embankment
C. Proposed Dams
Table 3-3: Inventory of proposed dams
Feature Data
1. Kajbar Dam and Reservoir
Location of dam Near the village of Soba, about 120 km downstream of
Dongla
Crest elevation of dam 218.5 m a.s.l
Full supply level (FSL) 213 m a.s.l
Maximum flood level 216.5 m a.s.l
Downstream level during floods (DSL) 207 m a.s.l
Reservoir storage capacity 360*106 m3
Headrace and tailrace canal
Headrace canal length 250 m
Headrace canal width 160 m
Invert elevation canal 200 m a.s.l
Forebay powerhouse 179.3 m a.s.l
Tailrace canal length 280 m
Tailrace canal width 180 m
Tailrace canal invert elevation 194 m a.s.l
Canal outlet powerhouse 176.6 m a.s.l
Powerhouse with erection bay
Location Right bank
Type Surface
Turbines 6 Kaplan runners
Rated head 15 m
Rated output 34.7 MW each
Spillway dam
Location River channel
Type Combination of overflow dam and gated spillway
Spillway gates 20 fixed wheel gates, each 10 m*9.5 m
Design flood 19900 m3/s
Concrete and embankment dams
Total length of dam 2201 m
Dam on right bank, height 4 m/23 m
Overflow dam in river channel, height 22 m
Non- Overflow dam on left bank height 20 m
Power and energy
Installed capacity 208 MW
Annual average energy 1046 *106 KWh
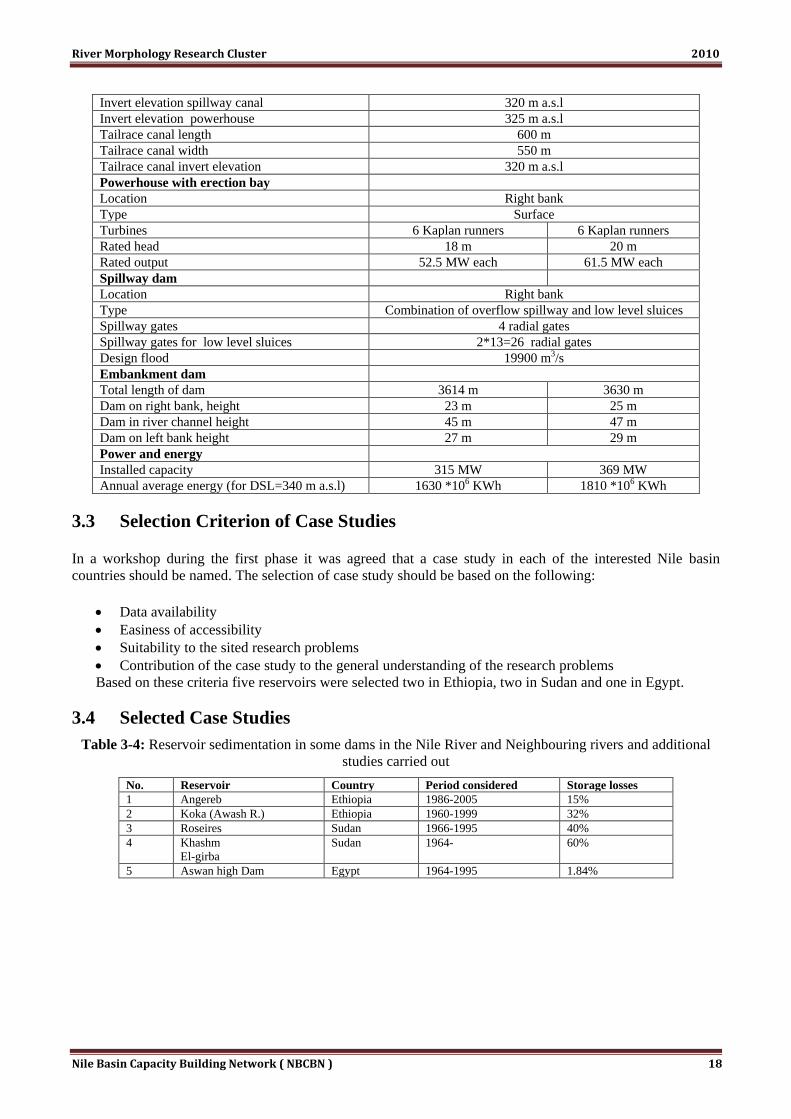
2. Shereik Dam and Reservoir
Location of dam Near Shereik village, about 290 km upstream of Merwe
Dam
Crest elevation of dam 347 m a.s.l 349 m a.s.l
Full supply level (FSL) 343 m a.s.l 345 m a.s.l
Downstream level during floods (DSL) 340 m a.s.l 342 m a.s.l
Reservoir storage capacity 2.2 *109 m3 2.84 *109 m3
Headrace and tailrace canal
Headrace canal length 800 m
Headrace canal width 550 m
River Morphology Research Cluster 2010
Nile Basin Capacity Building Network ( NBCBN ) 18
Invert elevation spillway canal 320 m a.s.l
Invert elevation powerhouse 325 m a.s.l
Tailrace canal length 600 m
Tailrace canal width 550 m
Tailrace canal invert elevation 320 m a.s.l
Powerhouse with erection bay
Location Right bank
Type Surface
Turbines 6 Kaplan runners 6 Kaplan runners
Rated head 18 m 20 m
Rated output 52.5 MW each 61.5 MW each
Spillway dam
Location Right bank
Type Combination of overflow spillway and low level sluices
Spillway gates 4 radial gates
Spillway gates for low level sluices 2*13=26 radial gates
Design flood 19900 m3/s
Embankment dam
Total length of dam 3614 m 3630 m
Dam on right bank, height 23 m 25 m
Dam in river channel height 45 m 47 m
Dam on left bank height 27 m 29 m
Power and energy
Installed capacity 315 MW 369 MW
Annual average energy (for DSL=340 m a.s.l) 1630 *106 KWh 1810 *106 KWh
3.3 Selection Criterion of Case Studies
In a workshop during the first phase it was agreed that a case study in each of the interested Nile basin
countries should be named. The selection of case study should be based on the following:
Data availability
Easiness of accessibility
Suitability to the sited research problems
Contribution of the case study to the general understanding of the research problems
Based on these criteria five reservoirs were selected two in Ethiopia, two in Sudan and one in Egypt.
3.4 Selected Case Studies
Table 3-4: Reservoir sedimentation in some dams in the Nile River and Neighbouring rivers and additional
studies carried out
No. Reservoir Country Period considered Storage losses
1 Angereb Ethiopia 1986-2005 15%
2 Koka (Awash R.) Ethiopia 1960-1999 32%
3 Roseires Sudan 1966-1995 40%
4 Khashm
El-girba
Sudan 1964- 60%
5 Aswan high Dam Egypt 1964-1995 1.84%
River Morphology Research Cluster 2010
Nile Basin Capacity Building Network ( NBCBN ) 19
4 ROSEIRES RESERVOIR
4.1 Introduction
This chapter is dedicated to discuss the case study of Roseires reservoir in Sudan. Roseires dam is known to
lose one third of its reservoir by sedimentation. In the following subsections the case of the Reservoir will be
discussed.
4.2 The Study Area
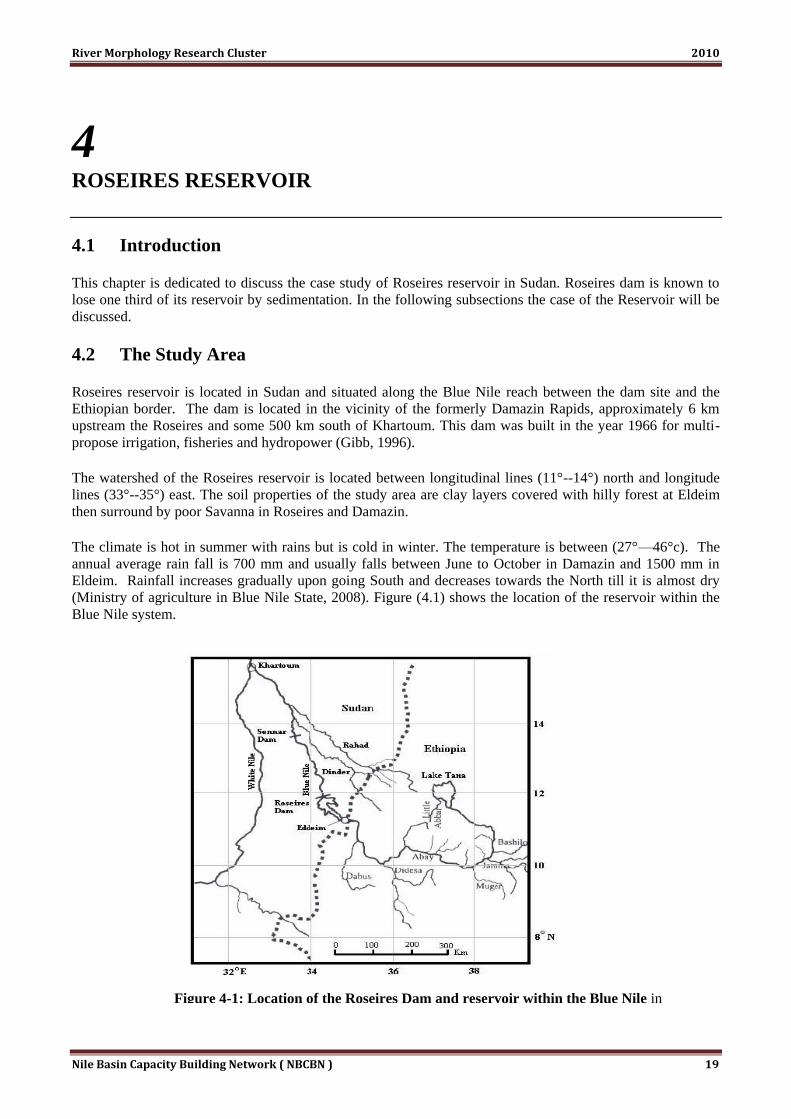
Roseires reservoir is located in Sudan and situated along the Blue Nile reach between the dam site and the
Ethiopian border. The dam is located in the vicinity of the formerly Damazin Rapids, approximately 6 km
upstream the Roseires and some 500 km south of Khartoum. This dam was built in the year 1966 for multi-
propose irrigation, fisheries and hydropower (Gibb, 1996).
The watershed of the Roseires reservoir is located between longitudinal lines (11°--14°) north and longitude
lines (33°--35°) east. The soil properties of the study area are clay layers covered with hilly forest at Eldeim
then surround by poor Savanna in Roseires and Damazin.
The climate is hot in summer with rains but is cold in winter. The temperature is between (27°—46°c). The
annual average rain fall is 700 mm and usually falls between June to October in Damazin and 1500 mm in
Eldeim. Rainfall increases gradually upon going South and decreases towards the North till it is almost dry
(Ministry of agriculture in Blue Nile State, 2008). Figure (4.1) shows the location of the reservoir within the
Blue Nile system.
Figure 4-1: Location of the Roseires Dam and reservoir within the Blue Nile in
Ethiopia and Sudan
River Morphology Research Cluster 2010
Nile Basin Capacity Building Network ( NBCBN ) 20
4.3 The Data
This study uses secondary data available from the dams’ operation unit in the Ministry of Irrigation and Water
Resources. The bathymetric surveys carried at Roseires reservoir (1976, 1981, 1985, 1992, 2005 and 2007)
were collected and used to estimate the sediment accumulation, sedimentation rate and trap efficiency. The
1966 data was used as the base line information and all other surveys were compared to it for storage and
sedimentation estimation.
4.4 Roseires Reservoir Operations
Since the trap efficiency is influenced by reservoir operation, it is important to closely examine the reservoirs
in order to make judgment on their impact on trap efficiency. The roseires reservoir filling period commences
after the flood peak has passed. According to the reservoir operation rules, filling may start any time between
the 1st and the 26th of September each year depending on the magnitude of the flow at El Deim gauging
station. From past experience, filling normally starts within the first ten days of September when the
suspended sediment concentration is still relatively high at about 2500 mg/l. The filling period usually
continues for nearly two months.
There are four main operation periods for Roseires reservoir. During the rising flood, the reservoir drawdown
attains the level of 467 R.L which is the lowest operating level. Over this operation period, minimum
sediment deposition is expected despite the large quantities of sediment inflow which may approach 3 M
ton/day. This is particularly true after many years of continuous operation of the reservoir where a well
defined channel, capable of transporting almost the whole sediment inflow past the reservoir during the
drawdown period, was developed naturally (Siyam, 2005).
Due to the gradually rising water level and the relatively high suspended sediment inflow, significant
sediment deposition is expected during the filling operation period. In contrast, during the third and fourth
operation stages (maintaining full retention level and reservoir emptying), sediment deposition is insignificant
due to the exceedingly small sediment and inflow quantities.
From the above description, only operation filling period is of importance as far as reservoir sedimentation
and trap efficiency are concerned in Roseires reservoir. Therefore this is taken in consideration when
estimating the trap efficiency using either Brune or Churchill method. Over the filling period, the water level
at 474 m R.L is considered for the computation. The reservoir content at this mean level is used together with
an annual inflow of 50x109 m3 to estimate the trap efficiency using both methods. The results are compared
with measured values for the years when reservoir surveys were made.
4.5 Sediment Accumulation
Sediment accumulation in the reservoir is calculated using the bathymetric survey data collected from the
Dams Directorate of the Ministry of Irrigation and Water Resources. The base line was taken as the design
storage capacity of the reservoir at the different levels in 1966. The storage capacity in the different
bathymetric surveys compared to that of 1966 at different level enables estimation of sediment accumulation
rates. Thus, the comparison between accumulated silt volumes deposited between the different surveys is
obtained. This work is done using spreadsheet analysis in excel.
The accumulated volume of deposited sediment Vd can also be calculated Empirically from the following
formula
/*10140*100/. 6 TxVd
Where Vd = accumulative volume of deposited sediment, m3
River Morphology Research Cluster 2010
Nile Basin Capacity Building Network ( NBCBN ) 21
. = trap efficiency after T years of operation (%)
T = years of operation
= average specific weight of deposited sediment over T years (t/m3) calculated from Miller, 1953
formula
4.6 Siltation Rate
The average silt deposit per year for the different reduced levels is calculated by dividing the sediment
accumulated by the corresponding number of years of operation.
The percentage of silt deposited is obtained by the following calculation:
%age silt deposited per year = NdAV /// .
Where:
V = Volume of silt in the given range in m3
A = Average surface area of the reservoir at the middle of given levels in m2
D = difference between given levels in m.
N = number of years of operation.
4.7 Trap Efficiency
Reservoir trap efficiency is defined as the ratio of deposited sediment to total sediment inflow for a given
period within the reservoir economic life. Trap efficiency is influenced by many factors but primarily is
dependent upon the sediment fall velocity, the detention-storage time, flow rate through the reservoir and
reservoir operation. The relative influence of each of these factors on the trap efficiency has not been
evaluated to the extent that quantitative values could be assigned to individual factors. The detention-storage
time in respect to character of sediment appears to be the most significant controlling factor in most reservoirs
(Siyam, 2005).
Trap efficiency estimates are empirically based upon measured sediment deposits in large number of
reservoirs mainly in U.S.A. Brune (1953) and Churchill (1948) methods are the best known ones.
For a given reservoir experiencing sediment deposition, its trap efficiency decreases progressively with time
due to the continued reduction in its capacity. Thus trap efficiency is related to the reservoir remaining
capacity after a given elapsed time (usually considered from the reservoir commissioning date).
The measured trap efficiency is computed from the following equation:
6
0
10*140*(%).
VV
Where, T.E. = trap efficiency after T years of operation
V0 = original reservoir volume, m3
V = volume remaining after T year of operation
= average specific weight of deposited sediment over T years (t/m3)
is calculated from the following equation (Miller, 1953)
1*1/434.0 Lni
Where i the initial is value of and is given by: sasaslslclcli
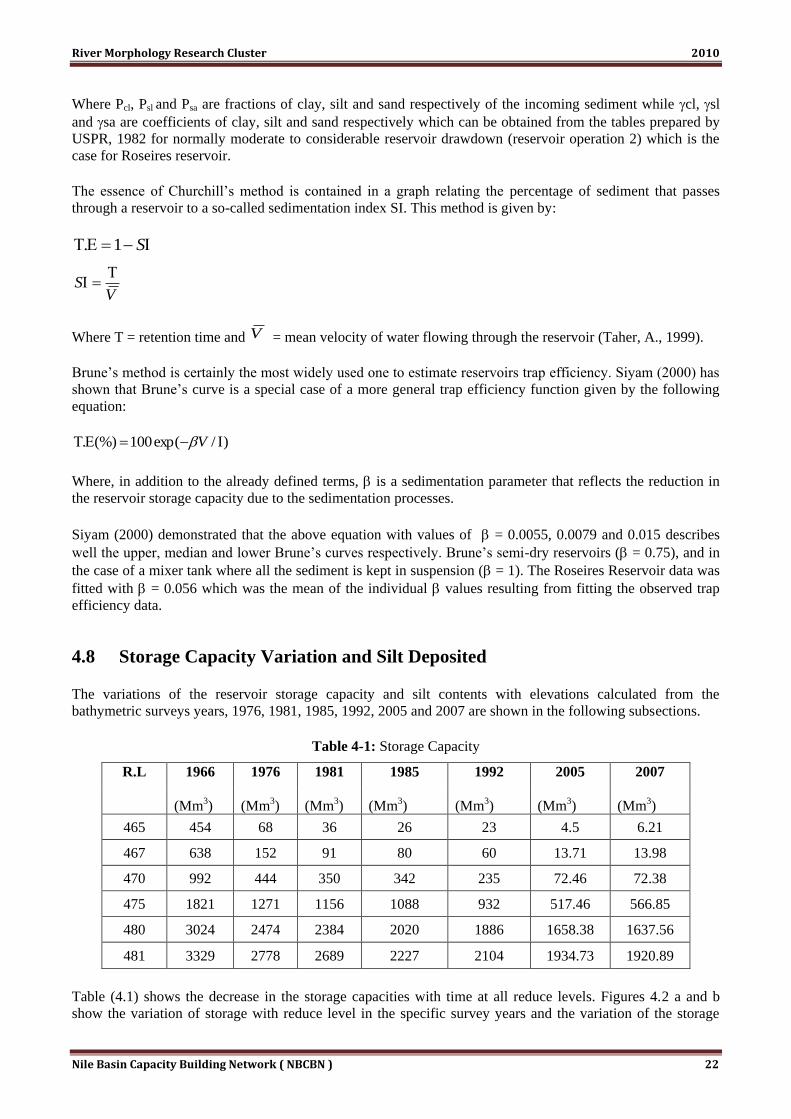
River Morphology Research Cluster 2010
Nile Basin Capacity Building Network ( NBCBN ) 22
Where Pcl, Psl and Psa are fractions of clay, silt and sand respectively of the incoming sediment while cl, sl
and sa are coefficients of clay, silt and sand respectively which can be obtained from the tables prepared by
USPR, 1982 for normally moderate to considerable reservoir drawdown (reservoir operation 2) which is the
case for Roseires reservoir.
The essence of Churchill’s method is contained in a graph relating the percentage of sediment that passes
through a reservoir to a so-called sedimentation index SI. This method is given by:
S1.
VS
Where T = retention time and V = mean velocity of water flowing through the reservoir (Taher, A., 1999).
Brune’s method is certainly the most widely used one to estimate reservoirs trap efficiency. Siyam (2000) has
shown that Brune’s curve is a special case of a more general trap efficiency function given by the following
equation:
)/exp(100(%). V
Where, in addition to the already defined terms, is a sedimentation parameter that reflects the reduction in
the reservoir storage capacity due to the sedimentation processes.
Siyam (2000) demonstrated that the above equation with values of = 0.0055, 0.0079 and 0.015 describes
well the upper, median and lower Brune’s curves respectively. Brune’s semi-dry reservoirs ( = 0.75), and in
the case of a mixer tank where all the sediment is kept in suspension ( = 1). The Roseires Reservoir data was
fitted with = 0.056 which was the mean of the individual values resulting from fitting the observed trap
efficiency data.
4.8 Storage Capacity Variation and Silt Deposited
The variations of the reservoir storage capacity and silt contents with elevations calculated from the
bathymetric surveys years, 1976, 1981, 1985, 1992, 2005 and 2007 are shown in the following subsections.
Table 4-1: Storage Capacity
R.L 1966 1976 1981 1985 1992 2005 2007
(Mm3) (Mm3) (Mm3) (Mm3) (Mm3) (Mm3) (Mm3)
465 454 68 36 26 23 4.5 6.21
467 638 152 91 80 60 13.71 13.98
470 992 444 350 342 235 72.46 72.38
475 1821 1271 1156 1088 932 517.46 566.85
480 3024 2474 2384 2020 1886 1658.38 1637.56
481 3329 2778 2689 2227 2104 1934.73 1920.89
Table (4.1) shows the decrease in the storage capacities with time at all reduce levels. Figures 4.2 a and b
show the variation of storage with reduce level in the specific survey years and the variation of the storage
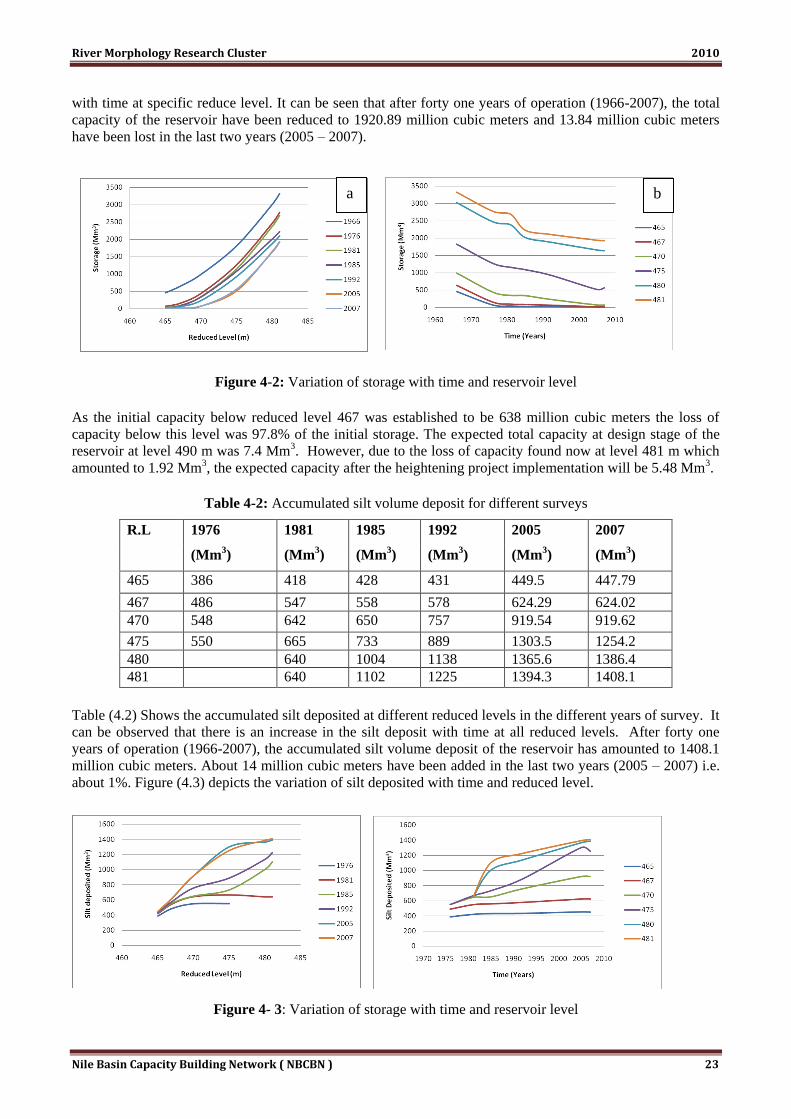
River Morphology Research Cluster 2010
Nile Basin Capacity Building Network ( NBCBN ) 23
with time at specific reduce level. It can be seen that after forty one years of operation (1966-2007), the total
capacity of the reservoir have been reduced to 1920.89 million cubic meters and 13.84 million cubic meters
have been lost in the last two years (2005 – 2007).
Figure 4-2: Variation of storage with time and reservoir level
As the initial capacity below reduced level 467 was established to be 638 million cubic meters the loss of
capacity below this level was 97.8% of the initial storage. The expected total capacity at design stage of the
reservoir at level 490 m was 7.4 Mm3. However, due to the loss of capacity found now at level 481 m which
amounted to 1.92 Mm3, the expected capacity after the heightening project implementation will be 5.48 Mm3.
Table 4-2: Accumulated silt volume deposit for different surveys
R.L 1976 1981 1985 1992 2005 2007
(Mm3) (Mm
3) (Mm
3) (Mm
3) (Mm
3) (Mm
3)
465 386 418 428 431 449.5 447.79
467 486 547 558 578 624.29 624.02
470 548 642 650 757 919.54 919.62
475 550 665 733 889 1303.5 1254.2
480 640 1004 1138 1365.6 1386.4
481 640 1102 1225 1394.3 1408.1
Table (4.2) Shows the accumulated silt deposited at different reduced levels in the different years of survey. It
can be observed that there is an increase in the silt deposit with time at all reduced levels. After forty one
years of operation (1966-2007), the accumulated silt volume deposit of the reservoir has amounted to 1408.1
million cubic meters. About 14 million cubic meters have been added in the last two years (2005 – 2007) i.e.
about 1%. Figure (4.3) depicts the variation of silt deposited with time and reduced level.
Figure 4- 3: Variation of storage with time and reservoir level
a b
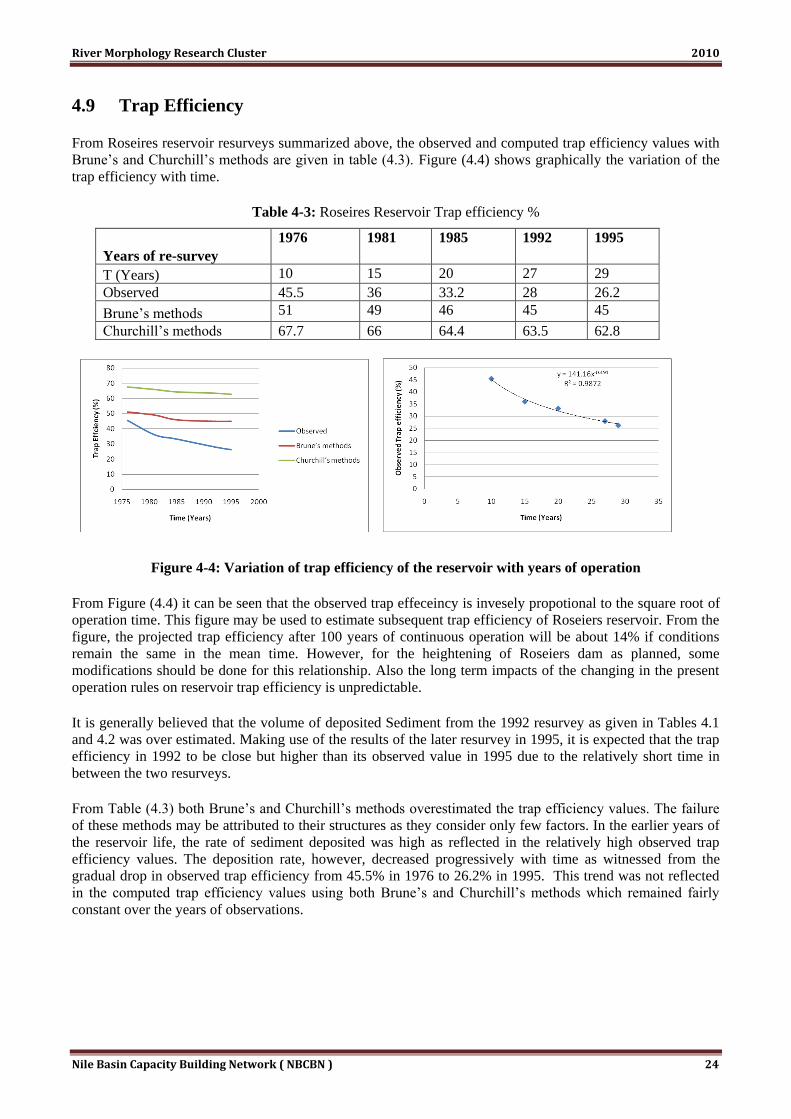
River Morphology Research Cluster 2010
Nile Basin Capacity Building Network ( NBCBN ) 24
4.9 Trap Efficiency
From Roseires reservoir resurveys summarized above, the observed and computed trap efficiency values with
Brune’s and Churchill’s methods are given in table (4.3). Figure (4.4) shows graphically the variation of the
trap efficiency with time.
Table 4-3: Roseires Reservoir Trap efficiency %
Years of re-survey
1976 1981 1985 1992 1995
T (Years) 10 15 20 27 29
Observed 45.5 36 33.2 28 26.2
Brune’s methods 51 49 46 45 45
Churchill’s methods 67.7 66 64.4 63.5 62.8
Figure 4-4: Variation of trap efficiency of the reservoir with years of operation
From Figure (4.4) it can be seen that the observed trap effeceincy is invesely propotional to the square root of
operation time. This figure may be used to estimate subsequent trap efficiency of Roseiers reservoir. From the
figure, the projected trap efficiency after 100 years of continuous operation will be about 14% if conditions
remain the same in the mean time. However, for the heightening of Roseiers dam as planned, some
modifications should be done for this relationship. Also the long term impacts of the changing in the present
operation rules on reservoir trap efficiency is unpredictable.
It is generally believed that the volume of deposited Sediment from the 1992 resurvey as given in Tables 4.1
and 4.2 was over estimated. Making use of the results of the later resurvey in 1995, it is expected that the trap
efficiency in 1992 to be close but higher than its observed value in 1995 due to the relatively short time in
between the two resurveys.
From Table (4.3) both Brune’s and Churchill’s methods overestimated the trap efficiency values. The failure
of these methods may be attributed to their structures as they consider only few factors. In the earlier years of
the reservoir life, the rate of sediment deposited was high as reflected in the relatively high observed trap
efficiency values. The deposition rate, however, decreased progressively with time as witnessed from the
gradual drop in observed trap efficiency from 45.5% in 1976 to 26.2% in 1995. This trend was not reflected
in the computed trap efficiency values using both Brune’s and Churchill’s methods which remained fairly
constant over the years of observations.
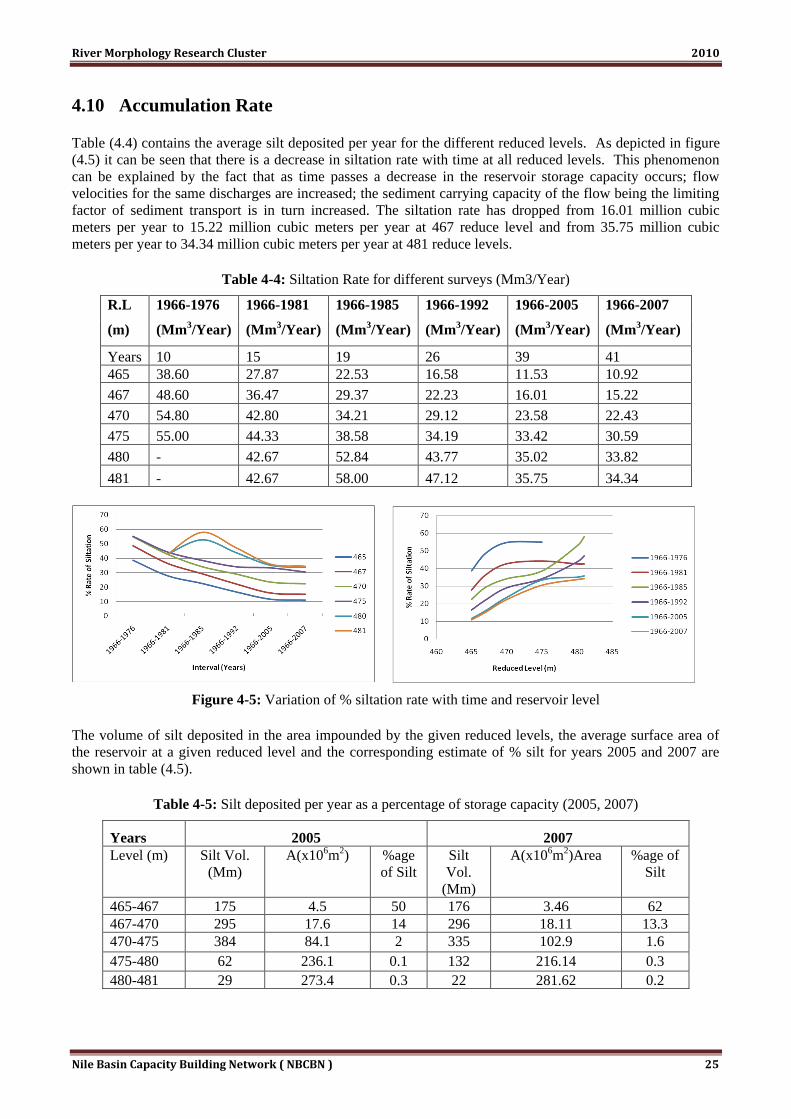
River Morphology Research Cluster 2010
Nile Basin Capacity Building Network ( NBCBN ) 25
4.10 Accumulation Rate
Table (4.4) contains the average silt deposited per year for the different reduced levels. As depicted in figure
(4.5) it can be seen that there is a decrease in siltation rate with time at all reduced levels. This phenomenon
can be explained by the fact that as time passes a decrease in the reservoir storage capacity occurs; flow
velocities for the same discharges are increased; the sediment carrying capacity of the flow being the limiting
factor of sediment transport is in turn increased. The siltation rate has dropped from 16.01 million cubic
meters per year to 15.22 million cubic meters per year at 467 reduce level and from 35.75 million cubic
meters per year to 34.34 million cubic meters per year at 481 reduce levels.
Table 4-4: Siltation Rate for different surveys (Mm3/Year)
R.L 1966-1976 1966-1981 1966-1985 1966-1992 1966-2005 1966-2007
(m) (Mm3/Year) (Mm
3/Year) (Mm
3/Year) (Mm
3/Year) (Mm
3/Year) (Mm
3/Year)
Years 10 15 19 26 39 41
465 38.60 27.87 22.53 16.58 11.53 10.92
467 48.60 36.47 29.37 22.23 16.01 15.22
470 54.80 42.80 34.21 29.12 23.58 22.43
475 55.00 44.33 38.58 34.19 33.42 30.59
480 - 42.67 52.84 43.77 35.02 33.82
481 - 42.67 58.00 47.12 35.75 34.34
Figure 4-5: Variation of % siltation rate with time and reservoir level
The volume of silt deposited in the area impounded by the given reduced levels, the average surface area of
the reservoir at a given reduced level and the corresponding estimate of % silt for years 2005 and 2007 are
shown in table (4.5).
Table 4-5: Silt deposited per year as a percentage of storage capacity (2005, 2007)
Years 2005 2007
Level (m) Silt Vol.
(Mm)
A(x106m2) %age
of Silt
Silt
Vol.
(Mm)
A(x106m2)Area %age of
Silt
465-467 175 4.5 50 176 3.46 62
467-470 295 17.6 14 296 18.11 13.3
470-475 384 84.1 2 335 102.9 1.6
475-480 62 236.1 0.1 132 216.14 0.3
480-481 29 273.4 0.3 22 281.62 0.2

River Morphology Research Cluster 2010
Nile Basin Capacity Building Network ( NBCBN ) 26
As expected, siltation rate is generally heavy below the minimum draw-down R.L maintained during the flood
period which is 467. Siltation rate is small above this minimum draw-down level. There is no increase in the
percentage silt deposited in the ranges 475- 480. Figure (4.6) show the variation of the siltation rate for a
given area in the reservoir in 2005 and 2007.
Figure 4-6: Variation of the siltation rate with area in 2005 and 2007
4.11 Impacts of Sediment in Hydropower Plants
The cost due to loss of efficiency in energy generation and repair shutdown was estimated. Moreover silt
loads which inflow to power intakes cause wear to all water ways and result in decrease of its life span. Table
4.6 below shows the decrease of life span to Roseirse plant equipment due to use of slurry water.
4.12 Impact of Sediment on Cooling Systems
Table 4.7 below shows the energy lost due to cooling system blockage in Roseirse hydro plant:
Table 4-6: Equipments Depreciation Due to Siltation in Roseirs Reservoir
0
10
20
30
40
50
60
70
% S
ilt
Interval (m)
2005
2007
TURBINE PARTS NORMAL
LIFE
OPERATION
LIFE
LIFE
DESTRICTION
DEPRECIATION
DAMAGE %
PART COST
EURO
DAMAGE
COST
INTAKE SCREEN 50 35 15 0.3 3393000 1017900 U\S MENT- GATE 50 20 30 0.6 150000 90000 INTAKE
CONTROL GATE 50 20 30 0.6 256500 153900
D\S MENT- GATE 50 20 30 0.6 120000 72000 THE PENSTOCK 50 40 10 0.2 99128 19825.6 SPIRAL CASE 50 40 10 0.2 2450 490 STAY VANES 50 35 15 0.3 1500000 450000 GUIDE VANES 50 20 30 0.6 1243333 745999.8 RUNNER BLADES 50 15 35 0.7 1678725 1175107.5 TURBINE HUB 50 20 30 0.6 16760 10056 RUNNER
CHAMBER WALL 50 40 10 0.2 9450 1890
DRAFT TUBE 50 45 5 0.1 49067 4906.7 THE SHAFT SEAL 10 2 8 0.8 53545 42836 TURBINE SHAFT 50 48 2 0.04 40976 1639.04
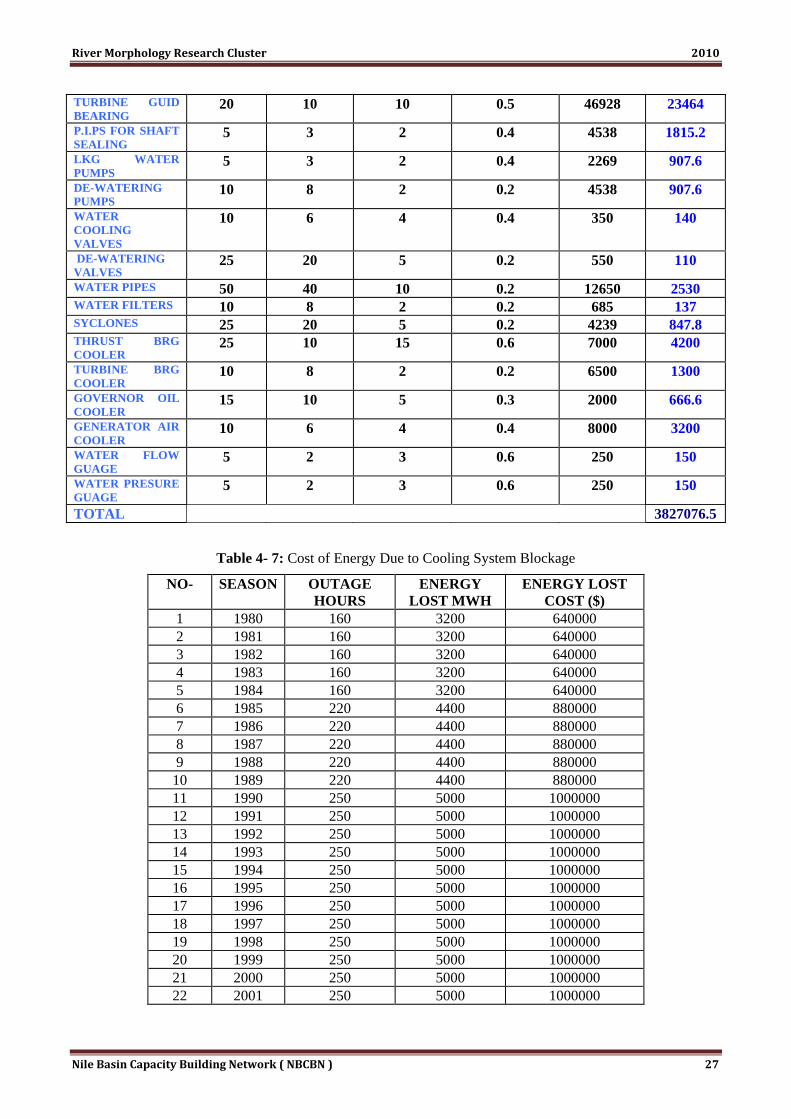
River Morphology Research Cluster 2010
Nile Basin Capacity Building Network ( NBCBN ) 27
Table 4- 7: Cost of Energy Due to Cooling System Blockage
NO- SEASON OUTAGE
HOURS
ENERGY
LOST MWH
ENERGY LOST
COST ($)
1 1980 160 3200 640000
2 1981 160 3200 640000
3 1982 160 3200 640000
4 1983 160 3200 640000
5 1984 160 3200 640000
6 1985 220 4400 880000
7 1986 220 4400 880000
8 1987 220 4400 880000
9 1988 220 4400 880000
10 1989 220 4400 880000
11 1990 250 5000 1000000
12 1991 250 5000 1000000
13 1992 250 5000 1000000
14 1993 250 5000 1000000
15 1994 250 5000 1000000
16 1995 250 5000 1000000
17 1996 250 5000 1000000
18 1997 250 5000 1000000
19 1998 250 5000 1000000
20 1999 250 5000 1000000
21 2000 250 5000 1000000
22 2001 250 5000 1000000
TURBINE GUID
BEARING 20 10 10 0.5 46928 23464
P.I.PS FOR SHAFT
SEALING 5 3 2 0.4 4538 1815.2
LKG WATER
PUMPS 5 3 2 0.4 2269 907.6
DE-WATERING
PUMPS 10 8 2 0.2 4538 907.6
WATER
COOLING
VALVES
10 6 4 0.4 350 140
DE-WATERING
VALVES 25 20 5 0.2 550 110
WATER PIPES 50 40 10 0.2 12650 2530 WATER FILTERS 10 8 2 0.2 685 137 SYCLONES 25 20 5 0.2 4239 847.8 THRUST BRG
COOLER 25 10 15 0.6 7000 4200
TURBINE BRG
COOLER 10 8 2 0.2 6500 1300
GOVERNOR OIL
COOLER 15 10 5 0.3 2000 666.6
GENERATOR AIR
COOLER 10 6 4 0.4 8000 3200
WATER FLOW
GUAGE 5 2 3 0.6 250 150
WATER PRESURE
GUAGE 5 2 3 0.6 250 150
TOTAL 3827076.5
River Morphology Research Cluster 2010
Nile Basin Capacity Building Network ( NBCBN ) 28
23 2002 250 5000 1000000
24 2003 250 5000 1000000
25 2004 250 5000 1000000
26 2005 250 5000 1000000
27 2006 250 5000 1000000
TOTAL 24600000
4.13 Impact of Sedimentation on Power Intake Blockage and the Practiced
Sediment Removal Measures
The efforts of sediment removal systems are very costly. The cost of 1 m3 of sediment may reached 6$ in
addition to the power loss due to shutting down of units under sediment removal process.
From the operation history complete blockage of the power intakes took place during flood seasons of 1975,
1983 and again in 2002 but partial blockage happen in most of the years during the flood season.
The average annual silt deposited in Roseirse reservoir since first filling is about 273 Mm3. Referring to the
last reservoir survey in 2007 the storage capacity decrease by 37% from the install capacity and this is reflect
the very critical situation in this reservoir.
4.14 References
Agarwal, K.K. and K.C. Idiculla. (2000): ―Reservoir sedimentation surveys using Global Positioning System‖,
Central Water Commission, Ministry of Water Resources, R.K.Puram, New Delhi-110066.
Nazar, A. R. (2006): ―Exploratory Study of Reservoir Sedimentation by 2D and 3D Mathematical Modeling‖,
MSc Thesis WSE-HERBD 06.11.
Gibb and Coyne ET Bellier (1996): ―Roseires Dam‖, Ministry of Irrigation, Hydro- Electric power Republic
of the Sudan and Gibb and Coyne ET Bellier.
Siyam, A.M. (2005): ―Assessment of the current state of the Nile Basin reservoir sedimentation problems‖,
Nile Basin Capacity Building Network (NBCBN), River morphology Research Cluster, Group1.
Taher, A. S. and M.R.M. Tabatabai (1999): ―Assessment of Reservoir Trap Efficiency Methods‖.
TOTAL COST = 3827076.5 (EURO) = 3827076 *1.5 = 5740614 $(AMERICAN DOLLAR)

River Morphology Research Cluster 2010
Nile Basin Capacity Building Network ( NBCBN ) 29
5
ASWAN HIGH DAM (AHD)
5.1 Introduction
Reservoirs are considered as a vital source of water supply, provide hydroelectric power, support diverse
aquatic habitat, and provide flood protection. Reservoirs offer many benefits to the communities including
flood control, water supply, fish, and hydropower. Determining the impacts of sediment on the reservoir
operations is critical to maintain current operations and planning for future needs. Sedimentation within the
reservoirs is the main problem that could reduce the reservoir capacity and sequently affecting its economic
life. Proper management of the reservoir requires determination of current reservoir volumes and
sedimentation rates. Current trend towards a more efficient management of reservoir is using the application
of Geographical Information System (GIS). GIS is used for importing, analyzing, modelling, visualizing, and
reporting information for the reservoir and gives functions of spatial data management, mapping and analysis
to assist decision-making. Mapping the reservoir bathymetry has been used to define reservoir bed
characteristics. Repetitive bathymetric mapping can help in determining the sedimentation rates, scour and
deposition of bed material, and the effectiveness of dredging.
It was estimated that more than 134 million ton per year is deposit in the Aswan High Dam Reservoir (AHDR)
and has altered reservoir volume. It was recognized that the potential ability for sedimentation has an effect on
the capacity of the reservoir and the need for data to assess the status of sediment deposition. These
management goals require a thorough knowledge of the reservoirs' characteristics including their volumes.
A research dealing with the investigation of sediment deposits in (AHDR) using geographic information
systems based application is presented. AHDR is the second largest man-made reservoir in the world. It
extends from the southern part of Egypt to the northern part of Sudan, about 500 km length. Annually
bathymetric survey for the reservoir using Differential Global Positioning System (DGPS) was conducted.
Spatial data were collected from aerial photographs, bathymetric data, and satellite images corresponding to
the study area. The research was performed on a number of stages. These stages are: survey planning, survey
execution and storage, data preparation and pre-processing, spatial data and attributes data creation, database
building, and the results presentation and analysis.
The results included a detailed GIS database from which contour maps, color-by-depth hill shade maps, and
surface difference maps of the reservoir bed elevations were generated. Surface difference maps were
produced with each subsequent survey to illustrate the seasonal sediment transport characteristics of the
system. Based on the results of the GIS applications, it was identified the major zones ranging from low to
high sediment deposits. The accumulation of sediment deposits over the years, associated depths, and their
geographical distributions was recognized by GIS capabilities.
The research utilized the Aswan High Dam Reservoir-related data to develop GIS application in order to meet
the following three objectives:
- A comparison between the traditional and the GIS approaches for sedimentation analysis in the reservoir.
- A definition of sediment deposition patterns by taking the advantage of GIS capabilities to produce sediment
deposition mapping for the reservoir bottom.
- An evaluation of usage of GIS technique for estimating the lateral and longitudinal distribution of deposited
sediment in reservoir.
River Morphology Research Cluster 2010
Nile Basin Capacity Building Network ( NBCBN ) 30
5.2 Previous Sediment Studies at AHD
Since 1964, as a result of the construction of the Aswan High Dam (AHD), virtually all of the annual 80-130
million tons of sediment load carried by the Nile River has been deposited behind the dam. The main concern
has been for the effect of accumulation of these huge sediment deposits on the reservoir's storage capacity and
hydropower production capability.
Early prognostications depicted that sedimentation in the reservoir would limit its storage capacity within a
few years after the construction of the AHD (Sterling, 1972; George, 1972). Eighteen years after the closure
of the river at Aswan, it seems that these predictions were highly exaggerated. Research findings provide an
up-to-date quantitative assessment of the temporal and geographical distribution of sediments in the reservoir.
This information is considered essential for the development of more realistic predictions of the effect of
sedimentation and appropriate management of the reservoir.
5.3 Traditional Approach for Sedimentation Analysis
Traditional methods of sediment deposition analysis in the Aswan High Dam Reservoir were based on the
comparison of the surveyed cross sections in different years to estimate the sediment volumes of the reservoir.
The total amount of deposited sediment was evaluated by assuming gradual distribution to the amount of
sediment between each two successive cross sections. Reservoir volumes were calculated by measuring the
area of the cross sections and lengths between these sections. The volume was calculated as the sum product
of the mean area of every two successive sections and the length between them. From a comparison of the
year 2003 reservoir volume with the year 1964 (original volume), It was estimated that more than 5.2 billions
tons of sediment deposit in the reservoir. In addition, the deposition thickness for each cross section of the
reservoir was obtained from year 1964, to year 2003 as shown in Table 5.1. It was concluded that the
traditional method has provided adequate results and accurately represents the sediment volume and it can
represent the longitudinal distribution of sediment deposition along the reservoir. However, the traditional
method would never be used for mapping as it lacks a visual component to represent the extent of sediment
deposition.
5.4 GIS Approach for Sedimentation Analysis
The advantages of the new technologies such as GPS and GIS have been taken into consideration in order to
create methodology of sedimentation analysis in reservoirs by offering a detailed characterization of sediment
deposition distribution.
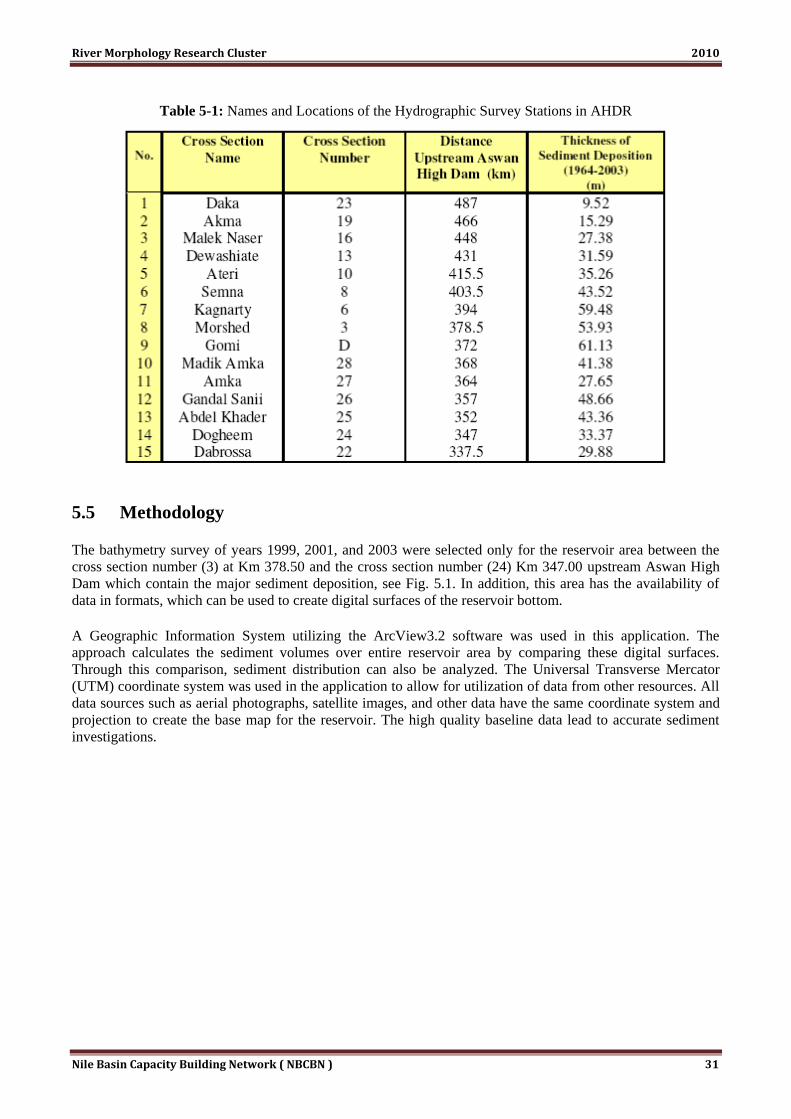
River Morphology Research Cluster 2010
Nile Basin Capacity Building Network ( NBCBN ) 31
Table 5-1: Names and Locations of the Hydrographic Survey Stations in AHDR
5.5 Methodology
The bathymetry survey of years 1999, 2001, and 2003 were selected only for the reservoir area between the
cross section number (3) at Km 378.50 and the cross section number (24) Km 347.00 upstream Aswan High
Dam which contain the major sediment deposition, see Fig. 5.1. In addition, this area has the availability of
data in formats, which can be used to create digital surfaces of the reservoir bottom.
A Geographic Information System utilizing the ArcView3.2 software was used in this application. The
approach calculates the sediment volumes over entire reservoir area by comparing these digital surfaces.
Through this comparison, sediment distribution can also be analyzed. The Universal Transverse Mercator
(UTM) coordinate system was used in the application to allow for utilization of data from other resources. All
data sources such as aerial photographs, satellite images, and other data have the same coordinate system and
projection to create the base map for the reservoir. The high quality baseline data lead to accurate sediment
investigations.
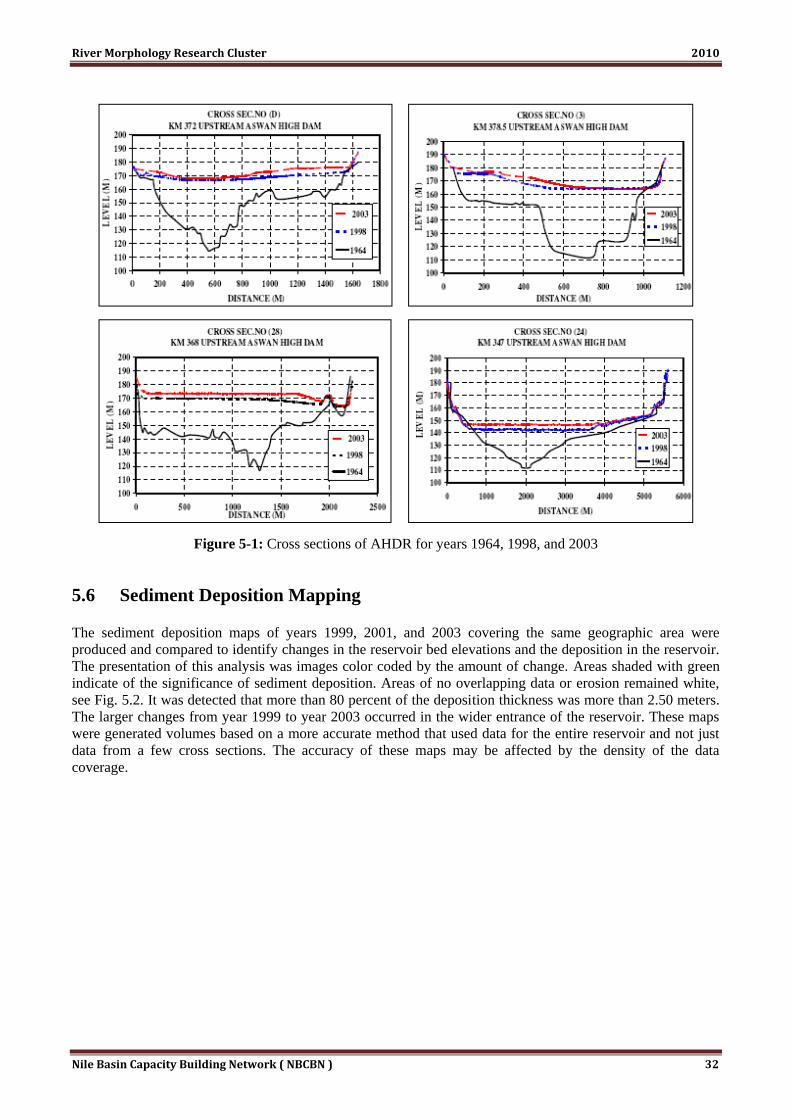
River Morphology Research Cluster 2010
Nile Basin Capacity Building Network ( NBCBN ) 32
Figure 5-1: Cross sections of AHDR for years 1964, 1998, and 2003
5.6 Sediment Deposition Mapping
The sediment deposition maps of years 1999, 2001, and 2003 covering the same geographic area were
produced and compared to identify changes in the reservoir bed elevations and the deposition in the reservoir.
The presentation of this analysis was images color coded by the amount of change. Areas shaded with green
indicate of the significance of sediment deposition. Areas of no overlapping data or erosion remained white,
see Fig. 5.2. It was detected that more than 80 percent of the deposition thickness was more than 2.50 meters.
The larger changes from year 1999 to year 2003 occurred in the wider entrance of the reservoir. These maps
were generated volumes based on a more accurate method that used data for the entire reservoir and not just
data from a few cross sections. The accuracy of these maps may be affected by the density of the data
coverage.
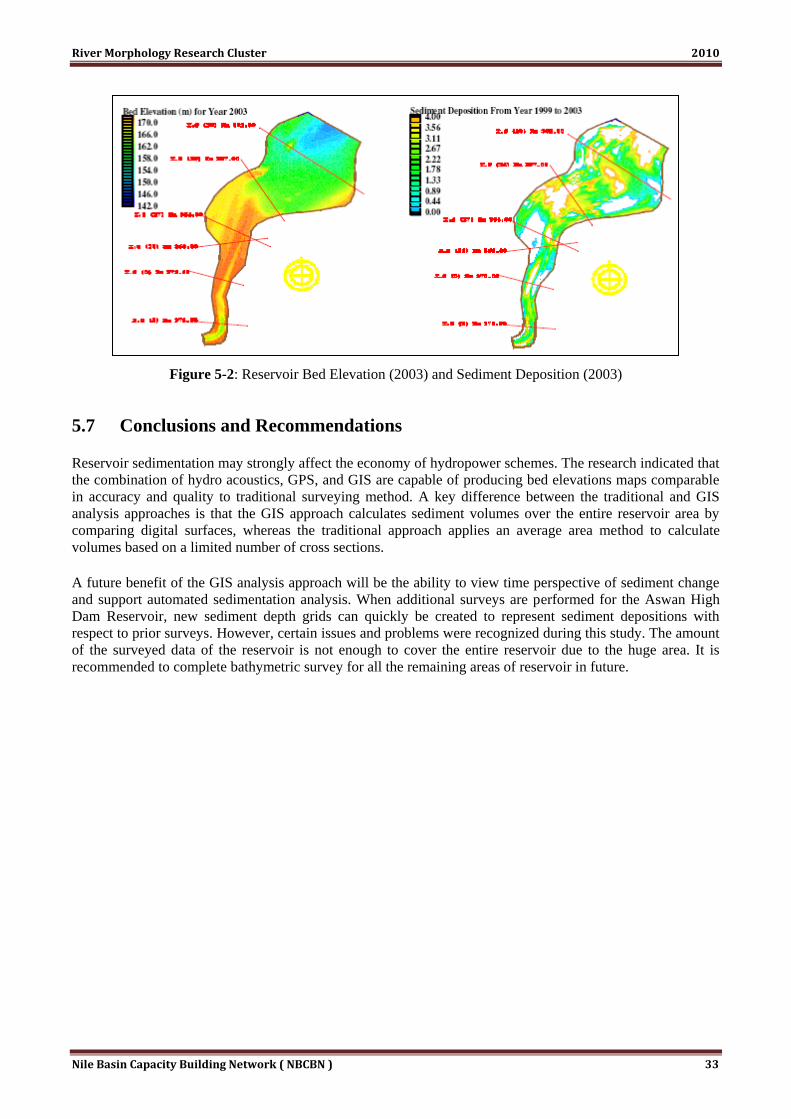
River Morphology Research Cluster 2010
Nile Basin Capacity Building Network ( NBCBN ) 33
Figure 5-2: Reservoir Bed Elevation (2003) and Sediment Deposition (2003)
5.7 Conclusions and Recommendations
Reservoir sedimentation may strongly affect the economy of hydropower schemes. The research indicated that
the combination of hydro acoustics, GPS, and GIS are capable of producing bed elevations maps comparable
in accuracy and quality to traditional surveying method. A key difference between the traditional and GIS
analysis approaches is that the GIS approach calculates sediment volumes over the entire reservoir area by
comparing digital surfaces, whereas the traditional approach applies an average area method to calculate
volumes based on a limited number of cross sections.
A future benefit of the GIS analysis approach will be the ability to view time perspective of sediment change
and support automated sedimentation analysis. When additional surveys are performed for the Aswan High
Dam Reservoir, new sediment depth grids can quickly be created to represent sediment depositions with
respect to prior surveys. However, certain issues and problems were recognized during this study. The amount
of the surveyed data of the reservoir is not enough to cover the entire reservoir due to the huge area. It is
recommended to complete bathymetric survey for all the remaining areas of reservoir in future.
River Morphology Research Cluster 2010
Nile Basin Capacity Building Network ( NBCBN ) 34
5.8 References
1. Abdel-Fattah, S., A. Amin and L. Van Rijn, (2004), ―Sand Transport in Nile River, Egypt―, Journal of
Hydraulic Engineering, American Society of Civil Engineers, ASCE, Vol. (130), No. (6), P488-500.
2. Adongo FG (1975) Phosphorus removal efficacy of Phragmites mauritianus (Kunth) constructed wetland
in Jinja, Uganda. M.Sc. thesis, D.E.W. 015 IHE Delft, The Netherlands.
3. Barbanti A, Bergamini MC, Frascari F, Miserochi S, Ratta M and Rosso G (1995) Diagenetic Processes
And Nutrient Fluxes At The Sediment-Water Interface, Northern Adriatic Sea, Italy. Marine
Freshwater Research Vol. 46 No.1 pp 56-57.
4. George, C.J. (1972) In: The Careless Technology: Ecology and International Development (ed. by Farvar &
Milton). The National History Press, Garden City.
5. Maguire, D.J., (1992), ―Geographical Information Systems: Principles and Applications‖, Long man,
England
6. Mau, D.P., and Christensen, V.G., (2000), Comparison of Sediment Deposition in Reservoirs of Four
Kansas Watersheds: U.S. Geological Survey Fact Sheet
7. Morris, L.M., and Fan, J., (1998), Reservoir Sedimentation Handbook: New York, McGraw-Hill, p. 4.17.
8. Mostafa, M.G. (1978) Sediment processes in the Nile River. United Nations Development Program Report
no EGY/73/024, New York.
9. Mostafa, G. (1987). Reservoir Sedimentation, Post Graduate Course in Sediment Transport Technology,
proceeding Vol. 2 Ankara, Turkey
10. Sheppard, S.R., (2000), ―Visualization Software: Bringing GIS Applications to Life‖, GeoEurope, Issue 8.
11. Roberts, J. D., Jepsen, R. A., and James, S. C. (2003). ―Measurements of sediment erosion and transport
with the adjustable shear stress erosion and transport flume‖, J. Hydr. Eng., ASCE, Vol. (129), No.
(11), 862-871.
12. Van Rijn, L. C. (1984a). "Sediment transport, Part I: bed load transport" J. Hydr. Eng., ASCE, Vol. (110),
No. (10), 1431-1456.
13. Van Rijn, L.C. (1984b). ―Sediment transport, Part II: Suspended load transport‖, J. Hydr. Eng., ASCE,
Vol. (110), No. (11), 1613-1641.
14. Van Rijn, L. C. (1990). ―Principles of fluid flow and surface waves in rivers, estuaries, seas and oceans‖,
Aqua Publications, Amsterdam, The Netherlands.
15. Sterling, C. (1972) The Aswan disaster. In: Our Chemical Environment (ed. by G.Giddings & J.B. 508
Scot E.Smith et al.)
16. Wagner, H.L. (1976) The Landsat Interactive Grey Map and Level Slice System. Master of Science Thesis,
the University of Michigan, Ann Arbor, Michigan.

River Morphology Research Cluster 2010
Nile Basin Capacity Building Network ( NBCBN ) 35
List of Research Group Members
Name Country Organisation E-mail
Dr. Ahmed Musa Siyam Sudan UNESCO-CWR [email protected]
Dr. Kamaleldin E. Bashar Sudan UNESCO-CWR [email protected]
Eng. ElTahir Osman ElTahir Sudan MPPPU- Kh. State [email protected]
Ms. Semunesh Golla Ethiopia MoWR [email protected]
Dr. Sami Abdel Fattah Egypt Hydraulics Research Institute [email protected]
Eng. Nindamutsa Astere Burundi IGEBU, Burundi [email protected]
Mr. Musenze Ronald S. Uganda Makerere University [email protected]
Prof. Ahmed Salih Sudan MoIWR-HRS [email protected]
Mr. Alnazir Saad Ali Sudan NEC [email protected]
Eng. Muna Musnad Sudan UNESCO-CWR [email protected]
Prof. Sami Omer Sudan Nilein University [email protected]
Ms. Ishraqa Osman S. Sudan UNESCO-CWR [email protected]
Shokry M.A.Abdelaziz Egypt Stuttgart University [email protected]
Scientific Advisor:
Dr. Alessandra Crosato
Senior Lecturer in River Morphology
UNESCO-IHE, the Netherlands
Full Profiles of Research Group Members are available on: The Nile Basin Knowledge Map
http://www.NileBasin-Knowledgemap.com


Publisher: The Nile Basin Capacity Building Network, 2010
Reservoir sedimentation is a severe threat to the optimal use of water resources in many river basins. The Nile Basin is no exception in this respect. Some of the reservoirs in the basin have already silted up substantially and also new reservoirs like the Merowi dam and dams in Ethiopia and Uganda will be subject to sedimentation and hence storage losses. Good prediction of the future reservoir sedimentation is important, but even more important is to find optimal mitigation methods to reduce sedimentation after some years in which inevitable sedimentation is taking place. A number of reservoirs elsewhere for example is now regularly flushed and no further storage loss is experienced.
The existing reservoirs especially those on the Blue Nile and the River Nile are seriously affected by sediment deposition at unexpected rates. Currently, for some reservoirs, costly sediment control measures are being practiced. Decision of postponing the problem by heightening the dam has been taken and unresolved situation is waiting for those in design and planning stage. Also the Aswan High Dam, though large, it is facing the problem of 100% trap efficiency. Further, in Sudan, Ethiopia and Uganda new dam projects are underway or have been proposed.
Data pertaining to sedimentation, current adopted operation polices and practiced control measures in these reservoirs in general are far from being comprehensive and/or optimised. In addition the impact of theses polices and measures on new dam/reservoir projects or vies-versa need a thorough understanding and special tackling as usually the consequences propagate in both upstream and downstream directions. It is expected that launching joint research, within the basin, will contribute to the common understanding of the siltation characteristics of the reservoirs in the region, help in defining the most suitable assessing tools (models), and in selecting the most appropriate combat measures. The outcome is vital piece of information for both dam owners and users as operation polices can be modified to prolong the useful life of reservoirs for future generation.