angles & perspectives - psg.co.za · risk/return profile 18 9. unit trust summary 19 ... calm...
TRANSCRIPT

ANGLES & PERSPECTIVES THIRD QUARTER 2015

Contents
We believe that we can achieve the best investment outcomes when our interests are aligned with those of our investors. It enables us to be true stewards of client capital.
1. Introduction – Anet Ahern 1
2. Market volatility: the background, its impact and our outlook – An interview with Shaun le Roux, Paul Bosman, Ian Scott, Jan Mouton and Greg Hopkins 2
3. Why 'management' is a critical building block of our approach (in more ways than one) – Greg Hopkins 6
4. True colours: are bond markets starting to show their true nature of stability? – Ian Scott 8
5. Our global funds: offering the benefits of long-term growth and diversification – Philipp Wörz 11
6. Portfolio holdings at 30 September 2015 14
7. Percentage annualised performance to 30 September 2015 (net of fees) 17
8. Risk/return profile 18
9. Unit trust summary 19
10. Contact information 20

| 1THIRD QUARTER 2015
Introduction Anet Ahern
As long-term investors, don’t confuse variability and stability
There is no such thing as a steady straight-line returnMarkets have a way of lulling investors into believing that there is safety in the crowd, and that a steadily rising equity market is an endless possibility. Reality tells us that a consistently steady, growing market, especially measured over the shorter term, is a fantasy. The last few months have once again shaken up investors’ beliefs, strategies, portfolio values and ability to sleep.
In this edition, we look at whom you should have on your side during uncertain times, which parts of the portfolio play a role in adding some stability, and how our team have responded to the unfolding of recent market moves across all asset classes.
We are accustomed to positive equity returns so the recent volatility feels even more unpleasant Since 2009, we have not experienced a down year (measured every month over any rolling 12 months) in the FTSE/JSE All Share Index (ALSI) apart from a brief period in August. Investors have become accustomed to positive and, in some months high, returns from equities. Along with other commentators, we have been cautioning against high expectations of future returns. However, even with more sober expectations, it is never pleasant when volatility strikes.
In this edition, we give some helpful background to the volatility and share our views on thisWe therefore start this edition with a conversation with some of our fund managers to provide some insight into the backdrop of recent market developments, how it impacted our funds, and how we have responded.
Our CIO, Greg Hopkins, then explores the importance of culture and unfailingly applying a proven process, as well as the importance of learning in an investment team.
Ian Scott, our Head of Fixed Income, highlights the role of bonds in a portfolio. Their recent behaviour demonstrates their important role in a multi asset class portfolio.
Philipp Wörz, Co-Fund Manager on the Global Funds, comments on the two funds we manage in this space.
Lastly, we share three things that we believe can improve your investment outcome1. Accept that volatility will be present during the course of
your investment path when you invest in growth assets.2. Have a plan that fits with your investment horizon, financial
position and goals. 3. It helps to partner with a team that is able to respond to
turbulence in a consistent, calm and rational manner – we remain committed to being that partner to you.
We trust that you find our insights useful and thank you for your interest and support.
Anet has over 25 years’ experience in investment and business management. After starting her career at Allan Gray in 1986, where she fulfilled various roles in trading and investment management, she worked as a portfolio manager at Syfrets, and later BoE Asset Management, where she was CIO and CEO. She also spent six years at Sanlam, where she was the CEO of Sanlam Multi Manager International, with assets totalling R100 billion in local and global mandates. Anet joined PSG Asset Management as CEO in 2013.
"Never think that lack of variability is stability. Don’t confuse a lack of volatility with stability, ever."
Nassim Taleb

2 |
The third quarter of 2015 saw a pull-back in global equity markets and South Africa was not unscathed. In the article below, we share our investment team’s views about the changes in the market. Most importantly, we get their insights on how they have responded, the way forward and how they are positioning the PSG Asset Management funds to protect your wealth and take advantage of current market dynamics.
What is the background to the recent market movements?Shaun le Roux: Equity markets have been very kind to investors over the past six years. In the graph below, we can see that, until two months ago, investors in the FTSE/JSE All Share Index (ALSI) had not experienced negative returns over a rolling twelve-month period since October 2009. There was a 10% drawdown during August and one-year returns briefly dropped into negative territory, but prices have subsequently recovered. It is worth pointing out that the strong performance of a handful of heavyweights (like Naspers and SABMiller) and rand weakness have supported the ALSI.
Paul Bosman: We have been operating in an investment environment where companies that generate predictable cash flows have been too expensive, while companies that generate more volatile cash flows have been too cheap. The prices of the ‘expensive’ companies have started dropping towards fair value but some of the ‘cheap’ companies have become even cheaper
at a rapid rate. This has had a negative effect on the unit prices of our funds that invest in equities.
Ian Scott: During the last quarter, there have been moments of significant volatility in emerging market currency and equity markets. Despite this, global bond markets have kept their composure and our own market has been no exception. The rand weakened against all the major currencies over the quarter and equity markets came under severe pressure.
Where did the market changes affect our funds the most? Shaun le Roux: The correction affected cyclical sectors the most, particularly the mining stocks. Glencore and Anglo American have been significant holdings in our funds and the share price declines in 2015 have had a material impact on short-term fund performance. The Glencore share price was particularly volatile in September. September saw panic selling in the mining sector, with indebted companies enduring most of the aggressive price moves.
We believe that sentiment around the mining sector is very poor and many stocks are therefore trading at very depressed prices. The range of outcomes for profits from miners and other heavily cyclical price-takers is very wide.
Market volatility: the background, its impact and our outlook
Source: Bloomberg, PSG Asset Management (13.10.2015)
Nominal Inflation
FTSE/JSE All Share Index return over a rolling 12-month period
0%
-20,0%
-40,0%
-60,0%
20,0%
40,0%
60,0%
OCT‘09
OCT‘10
OCT‘11
OCT ‘12
OCT ‘13
80,0%
OCT ‘14
OCT ‘15
Greg HopkinsShaun le Roux Paul Bosman Ian Scott Jan Mouton

| 3 THIRD QUARTER 2015
Therefore we only like to buy these kinds of assets when we are: 1. Happy that the margin of safety is as wide as the outcomes
may be; and 2. Insulated against unforeseen events by the difference
between what we think a company is worth, and where it is trading.
How have you responded to these challenges?Shaun le Roux: We continue to carefully assess the investment case for all holdings, including a stress test of balance sheets and an assessment of tail risk (the risk of unexpected and large drops in price). We concluded that, for a stock like Glencore, the share price moves were not driven by fundamentals and that the concerns around the balance sheet were overstated. We therefore bought more Glencore in our equity-centric funds into weakness. The share price recovered sharply in October, but sentiment remains very poor.
It is important to remember that resources stocks made up only 14% of the PSG Equity Fund, 7% of the PSG Flexible Fund and PSG Balanced Fund, and only 3% of the PSG Stable Fund at the end of August 2015.
Paul Bosman: Lower share prices are only a problem if you are a forced seller. If you hold cash, you can get more shares for the same amount of money. Fortunately, we hold significant cash positions in our asset allocation funds and could therefore invest our clients’ money in great companies. We bought more shares of companies we already owned but also introduced new names like Union Pacific and Softbank.
Jan Mouton: In terms of asset allocation, just over 40%, on average, of the PSG Flexible Fund was invested in cash over the past six months – our highest average cash level since the present management took over in 2004. This record cash holding has protected investors against the current decline in markets. As Paul mentioned above, we are now gradually using this cash as we are finding more opportunities in the market turmoil, especially in certain sectors where extreme fear and pessimism exist. Our record cash holding gives us the ability to invest where others are divesting in a stampede of panic.
Source: PSG Asset Management
Asset allocation of our multi asset class funds at the start of August 2015
100%
80%
60%
40%
20%
0%
Diversified income
Stable Balanced Flexible
NCDs (Fixed/Floating)Bonds Call/Cash/Money Market Equities
41%
44%
9%
6%
18%
43%
7%
33%
13%
24%
3%
60%
40%
60%
% N
AV
4 |
Ian Scott: In a world of heightened volatility, nominal bond markets have begun to show a sense of calm and stability. The South African 10-year government bond traded in a fairly narrow band despite the volatility in related markets. Longer-dated bank NCDs (negotiable certificates of deposit) remained attractive (given the level of risk and expected path of inflation and interest rates) on a real yield basis. Certain parts of the nominal yield curve became more attractive on a real yield basis too. These asset classes provided our income and multi asset class funds with a shock-absorber against the volatility in currency and equity markets.
Many of the PSG Asset Management funds had exposure to the Volkswagen Group via a holding in Porsche Automobil Holding. How did the team handle this unfortunate event?Paul Bosman: Part of our assessment of management is whether the company’s culture is one of honesty and transparency. This
is not a matter of degree. A company that does not tick this box will not be considered for our funds. Over and above this being integral to protecting clients’ capital, the team at PSG Asset Management only want to analyse and invest in companies that we admire. This is why it was a very disappointing day for us when Volkswagen admitted that they had cheated in emission testing on a global basis over the course of six years. We exited the position as quickly as possible without putting undue pressure on the share price. Our orders were placed over the course of the three days subsequent to the news breaking. We completely exited all exposure to Porsche Automobil Holding (and therefore VW Group) across the PSG Asset Management funds.
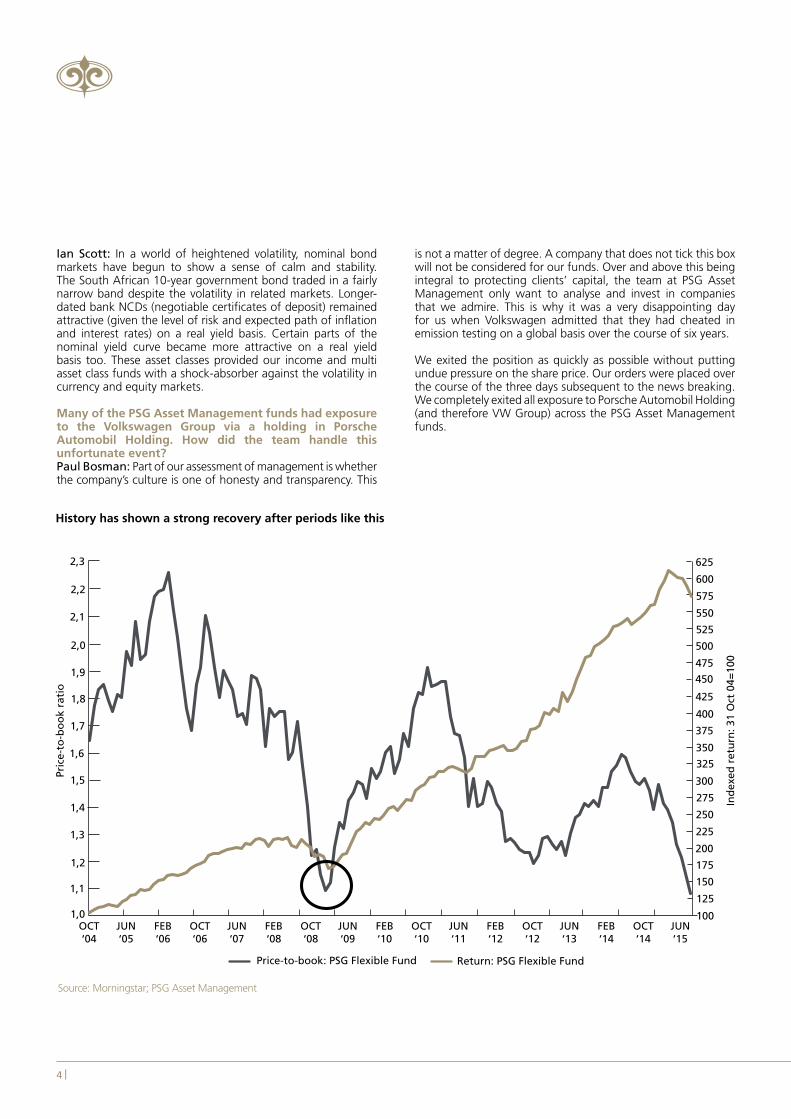
History has shown a strong recovery after periods like this
JUN ‘15
OCT ‘04
JUN ‘05
FEB‘06
OCT‘06
JUN ‘07
FEB ‘08
OCT‘08
JUN ‘09
FEB‘10
OCT ‘10
JUN ‘11
FEB‘12
OCT ‘12
JUN ‘13
FEB ‘14
OCT‘14
Source: Morningstar; PSG Asset Management
Price-to-book: PSG Flexible Fund Return: PSG Flexible Fund
1,6
1,4
1,2
1,0
1,8
2,0
2,2
2,3
2,1
1,9
1,7
1,5
1,3
1,1
Pric
e-to
-bo
ok
rati
o
100
125
150
175
200
225
250
275
300
325
350
375
400
425
450
475
500
525
550
575
600
625
Ind
exed
ret
urn
: 31
Oct
04=
100

THIRD QUARTER 2015
What is the outlook for PSG Asset Management investors? Jan Mouton: A low price-to-book (P/B) ratio is one of the indicators of a potentially low valuation. If we look at the PSG Flexible Fund, for example, we note that at the end of September 2015, the weighted average P/B ratio of the equities held was at an all-time low of 1.07. This means that based on the P/B metric, the equities the PSG Flexible Fund holds have never been more attractively priced. The current P/B of 1.07 is even lower than the 1.08 reached on 28 February 2009, at the bottom of the global financial crisis. The subsequent returns of the fund from that previous low were strong, as shown in the graph above.
Shaun le Roux: We are bottom-up managers and the discrepancy in relative prices between in-demand growth stocks and out-of-favour value stocks shows up in the opportunities we find to invest our clients’ capital. On the domestic front, we continue to find fewer opportunities in the quality sectors and think the returns from carefully selected cyclical stocks will be very favourable. Investing in this fashion requires a longer-term investment horizon, patience and emotional discipline. Our experience has shown us that this is the true path to long-term investment success.
Paul Bosman: The multi asset class funds currently own an extensive portfolio of offshore companies that have a competitive advantage in each of their respective industries. These companies are managed by exceptional individuals, who in many cases also have the majority of their net worth tied up in these companies. We expect these shares to compound for many years to come, which will reward long-term investors. In the domestic market there is a dearth of quality, local companies with good management, trading at acceptable
valuations. However, many of the more cyclical companies are trading significantly below a conservative estimate of fair value. We expect the recovery in both profits and valuations to result in very satisfactory returns over the medium to long term. The multi asset funds continue to hold large amounts of cash. We have written in the past about how our cash holdings have been invested in instruments like NCDs. These are giving our investors an attractive real return while we wait for the equity and credit of the high quality domestic companies to be available at more attractive prices.
Ian Scott: Inflation remains benign in the developed world. Robust growth remains elusive and most forecasts are being revised downwards. Domestic consumers’ disposable income is being eroded through various forms of taxation and higher interest rates, and central banks remain largely on the sidelines. All these factors paint a picture of a more muted environment for bond yields and fixed income instruments in general. If inflation falls and bond yields remain at current levels, there will be more opportunities to participate in these instruments. We will continue to deploy cash when real yields are attractive at the appropriate level of risk.
Greg Hopkins: Although one must be cautious in the current investment environment, there are still many opportunities for investors with a long-term view and cash to apply. We believe that the securities in which we are invested will provide good risk-adjusted returns in future. In the meantime, we are making the high cash holdings in our multi asset class funds work hard to provide real returns for investors.
| 5
Why ‘management’ is a critical building block of our approach (in more ways than one)
We are determined to continue creating and embedding the building blocks required to generate exceptional (and market-beating) long-term returns for our investors. We know that getting this right over time will make a significant difference to our clients’ investment outcomes and their lives. To this end, we have often written about the 3Ms, the building blocks on which we have founded our investment process: Moat, Management and Margin of Safety.
Companies in which we like to investIn previous editions of this publication we have written about one of those Ms – management – and how important their role is in the success of the companies that they manage. Essentially we have identified two key criteria that we believe are important characteristics of management success in any organisation. They are businesses that:1. are managed by individuals with proven track records2. report their earnings in an honest and transparent way
Research has shown that management teams who act as stewards of capital generate better returnsIn addition to the above two points, empirical evidence has shown over time that management teams who act as stewards of their investors’ capital generate better returns at lower risk levels. Stewardship is all about independence, and thinking and acting like owners of capital on investors’ behalf. Shaun le Roux wrote about this in PSG Angles & Perspectives in the first quarter of 2014 when he looked at William Thorndike’s ‘The Outsiders: Eight Unconventional CEOs and Their Radically Rational Blueprint for Success’.
These factors that make a successful management team resonate with us at PSG Asset Management. We have deliberately organised ourselves in a way that increases our ability to achieve long-term investment success.
Which metrics are indicators of a successful investment firm?The Focus Consulting Group wrote a paper in 2013 titled ‘Helping Investment Leaders Leverage Talent’. The group had conducted research on a number of the top investment firms in America and Canada (and one in the Netherlands) to establish what defined success. Was there a common thread? The respondents identified a number of common metrics.
They defined ‘successful investment firms’ as those that:• delivered exceptional long-term investment results• had demonstrably satisfied clients• had employees who were strongly aligned with the culture
of the company and demonstrated this via a low turnover of staff
• adopted a team-based, collaborative approach• acted in an ethical way• were profitable• constantly worked to improve
Differing results are primarily underpinned by different cultures within an investment firmThe Focus Consulting Group’s James Were defines culture as ‘the values, beliefs and behaviours that would differentiate your firm from others’. Investment management firms tend to have the same configuration. They all have a large broadband cable piping in broadly similar information to a team that diligently processes it. These teams slice, dice and organise the information in an attempt to answer one simple question: “Are the odds in our favour when we deploy our clients’ capital?” And yet, despite all firms working with this array of broadly similar information, the outcomes from this similar industry input can be vastly different over the long term. These differences can be explained by the DNA of the respective companies, the people they employ and how they gather and process that information.
The PSG Asset Management DNAThe core of our DNA is a culture that embraces a team-based, partnership approach.• Our staff are smart and passionate (it’s not just a job).• We constantly focus on making the right long-term
decisions.• We embrace our roles as stewards of our clients’ capital.• We approach our investment process in a bottom-up,
value-based way.• We value independent thinking and we grow uneasy when
we see herd-like activity.• We believe that security research is our lifeblood and most
vital activity, and we constantly strive to maximise the quality and quantity of our efforts in this regard.
• We have a culture of continual learning and development – we keep an open mind and learn from our decisions, both the successful and poorer ones.
6 |
Greg Hopkins
Greg is the Chief Investment Officer at PSG Asset Management and is the Co-Fund Manager of the PSG Equity, PSG Balanced and PSG Global Equity funds.

THIRD QUARTER 2015
We focus on hiring and retaining the best peopleIn our investment team, we have a simple objective – to hire and retain the best people. In a competitive industry like ours, that is not an easy objective to attain. However, we believe that the working environment we create will ultimately determine our success in staff attraction and retention. Words like meritocracy, decentralisation, empowerment and teamwork resonate with us. Talented people like a meritocratic environment where their positive impact on client wealth is valued. They also like to be masters of their own destiny and to be regularly given new challenges. Lastly, they like to be a member of a team that is continually learning and striving to improve their process and outcomes.
We are focused on stewardshipLast quarter, we discussed stewardship at some length. In essence, we see stewardship as being those actions and responsibilities we take when we look after our clients’ capital. These include putting the long-term interests of our investors first, being individually accountable for the decisions we take and always being prudent when we invest our clients’ money.
We have a team-based process with individual accountabilityAt PSG Asset Management we have built our process on one of the basic tenets of stewardship – individual accountability.
Fund managers are responsible for the performance of the funds that they manage and analysts are accountable for their security recommendations. However, members in the team know they are backed by an experienced team that helps them analyse, debate and stress-test all the decisions that are made. Implementing a truly integrated team-based system is not easy. One of the tools we use to get the right people on board is a checklist to confirm that candidates have a similar DNA to our existing team – a passion for value-based investing and the ability to think long-term and independently.
When we look at management as one of the 3Ms, we look at ourselves tooAlthough we are learning every day, we think that we have a good idea of what success looks like for our clients, for our people and for our business. If we repeat our process and people systems over and over again, this ultimately establishes a culture. In a world of people working off a bank of shared information, we appreciate that our only competitive advantage will come from how we embrace our culture and how this will lead to investment outcomes that differentiate us from our peers. We know that to deliver better results for clients we need to apply our disciplined process to ourselves as well!
| 7
Core building blocks of investment performance
Smart, passionate people Similar DNA
Thinking and processing
information differently
Consistently executing
on our system
Source: PSG Asset Management

Despite ongoing volatility, bond yields have been surprisingly stableThe storm clouds of price volatility have gathered ominously over the last year. After a sustained period of markets broadly trending due to a continued period of central bank support, we have seen a significant rise in market volatility. The continuation of the commodity downturn and fears of lower growth in China have had a significant effect on emerging market equities in general and have resulted in substantial movements in currency markets.
Notwithstanding the fact that most market participants expected global bond markets to show the same degree of volatility, it is surprising how muted the reaction in bond yields
has been to these rather significant events. There are obvious outliers like Brazilian and Russian bonds due to other domestic factors, but the question now is: Are bond markets once again starting to show their historically true nature of stability in a world of volatility?
Bonds are offering a significant real yield Since the introduction of quantitative easing (QE) across the globe, real yields and term premiums in global bond markets were reduced to historic lows. This has meant that bonds gave investors low real (above inflation) yields or even negative real returns. Over the past year however, emerging market bonds have slowly started to move towards pricing that is more reflective of the risks associated with the asset class. Concern over US monetary policy action and fear in emerging markets have led to a steady rise in emerging market bond yields, which are now beginning to offer a significant real yield.
In essence, as indicated in Graph 1, bonds are starting to show more value on a real basis given the duration risk (interest rate sensitivity).
True colours: are bond markets starting to show their true nature of stability? Ian Scott
Ian joined PSG in 2013, after fulfilling the role of Head of Fixed Interest at Stanlib. He first joined Stanlib in 1999 as a money market dealer, from where he moved to capital markets and was then promoted to Senior Portfolio Manager – Fixed Interest.
Nominal Inflation
6%
5%
4%
3%
7%
8%
9%
OCT ‘09
FEB‘10
JUN‘10
OCT‘10
FEB‘11
JUN ‘11
OCT ‘11
FEB‘12
JUN ‘12
OCT ‘12
FEB ‘13
JUN‘13
OCT‘13
FEB ‘14
JUN ‘14
OCT ‘14
FEB ‘15
JUN ‘15
OCT ‘15
Graph 1: South African five-year bonds – growing real yields
Source: Bloomberg
"You with the sad eyes, don't be discouragedOh I realise, it's hard to take courage
In a world full of people, you can lose sight of it allAnd the darkness inside you, can make you feel so small
But I see your true colours, shining through."Cindi Lauper – True Colors
8 |

THIRD QUARTER 2015
'Slow and low’ hiking cycles are likely in the current environment The macro environment in which we currently find ourselves is one of subdued economic growth, low commodity prices and muted private credit extension. The outlook for global inflation appears to be benign at best. In this type of environment, central banks will hesitate to make monetary policy less accommodative – as we have seen with the US Federal Reserve delaying rate hikes. This does not seem to be a world where bond yields will rise rapidly and expose investors to large capital losses. Certain central banks in emerging markets may have to increase rates due to domestic factors, but these could take the form of ‘slow and low’ hiking cycles like we are currently seeing in South Africa.
Local bonds have maintained their stability and liquidity despite the weakening in the rand Bonds demonstrated their historically stable nature before the world of QE changed bond market dynamics. South African bond yields are a good example of this. We have seen volatility in the rand (weakening to over R14 to the US dollar) as well as falling commodity prices, followed by falling equity markets. With the rand trading at such low levels, one would assume that the yield on 10-year government bonds would be at a much higher level, being the most traded bond on the yield curve. Yet with all the swings in the markets, these bonds have traded in a fairly narrow range and maintained a sense of stability in the face of volatility. For the first time in some years there seems to be value returning to certain parts of the bond yield curve, given the commensurate credit and duration risks.
As my colleague, Tyron Green, wrote in his article titled ‘Why is liquidity important?’ in the previous edition of Angles & Perspectives, liquidity in our portfolios is front of mind when we invest. The South African government bond market has retained a high level of liquidity, while bond markets in other emerging markets have become relatively illiquid. For example, it is only possible to trade Turkish two-year government bonds twice a day in a certain volume at a pre-determined price.
How bonds fit into our asset allocation processFirst and foremost, bonds must meet or exceed our hurdle rates to make it onto our fixed income buy list – as with any other asset class. Cash is always the default position, so for a bond to make it onto the buy list, it has to meet our criteria of delivering real returns above inflation with sufficient compensation to cover the perceived credit, duration and liquidity risks. Clearly not all bonds on the yield curve automatically achieve this hurdle rate.
Secondly, bonds also give protection through diversification in an environment where low inflation is becoming more persistent across the globe and central banks have to add more stimulus to the markets. The effect of the strengthening dollar should not be ignored as a deflationary force globally. While it is generally understood that the US and South Africa are on tightening cycles, 37 central banks have cut benchmark interest rates so far in 2015, indicating that global central banks are largely still accommodative in policy.
South African bond yields are still considered more attractive on a relative global yield basis. Foreign investors have become significant players in South African bond markets, with bonds serving as a source of yield enhancement. There are clear benefits to foreign participation, such as increased capital flows, but at the expense of heightened market volatility. Due to the more bond-friendly environment, developed market bond yields remain at lower levels, whereas South African bond yields have moved to more ‘normalised’ levels given the current domestic economic fundamentals.
Ten-year South African government bonds have recently offered yields close to 8.5%. When measured in relation to US- or EU-equivalent government bonds, the spread is well in excess of current headline consumer price inflation, as shown in Graph 2. It appears that South African bonds, on both an absolute and relative basis, are approaching better valuations for our investors.
We may not yet have reached the point where we would be inclined to fill up on bonds. However, it is good to know that, when volatility is in abundance, there are bond yields that are starting to show their true colours and will be able to deliver the real returns our investors need at very acceptable risk levels.
| 9

10 |
Graph 2: Yield differentials – South African, US and EU government bonds
Sources: Bloomberg, PSG Asset Management
OCT ‘05
OCT ‘06
OCT ‘07
OCT ‘08
OCT ‘09
OCT ‘10
OCT ‘11
OCT ‘12
OCT ‘13
OCT ‘14
OCT ‘15
SA Headline CPI SA 10-year spread to US 10-year SA 10-year spread to EU 10-year
8%
6%
4%
2%
10%
12%

| 11THIRD QUARTER 2015
Our global funds give investors access to some of the best listed companies across the world. They provide investors with the prospects of both long-term growth as well as the benefits of having diversified exposure to different geographies, regions, sectors and companies. Each fund has its own objectives and
benchmark, and therefore its own investment horizon and risk and return characteristics. The table below provides a comparison of our global funds, which we hope will help you to identify the most appropriate fund for you or your clients.
PSG Global Equity Sub-Fund PSG Global Flexible Sub-Fund
Fund characteristics
This fund is a Malta-domiciled fund that is denominated in US dollars and invests solely in equities on global markets. The fund aims to produce the highest real (above inflation) returns over the long term. It sits at the top end of the risk/return spectrum, so investors should be comfortable with stockmarket fluctuations and should have an investment horizon of at least five years.
This fund is a Malta-domiciled fund that is denominated in US dollars and currently invests across equities, debt instruments and money market instruments. The fund may invest up to 100% in equities. It has a flexible asset allocation mandate and equity exposure will be varied based on opportunity. This fund sits in the upper half of the risk/return spectrum, so investors should be comfortable with stockmarket fluctuations and should have an investment horizon of at least four years.
Fund objective and strategy
To outperform the average of the world’s equity markets, as represented by the MSCI Daily Return Net World USD Index. The fund invests in securities listed on recognised exchanges around the world. Because it is designed to remain substantially invested in global equities the fund will be exposed to all the risk and rewards of the global equities selected.
To achieve superior medium- to long-term capital growth through exposure to selected sectors of the global equity, bond and money markets. The asset allocation will be actively managed and the selected sectors of the equity portion of the fund’s portfolio will change from time to time in accordance with changing market conditions and economic trends.
Denomination US dollar US dollar
Benchmark MSCI World Free NR USD Index US inflation + 6%
ASISA Category Global - Equity - General Global - Multi Asset - Flexible
Income distribution frequency
This fund does not distribute. This fund does not distribute.
Regulatory limitsThe portfolio will hold a minimum of 80% of its market value in non-South African equities at all times.
The portfolio may not hold more than 20% of its market value in South African assets at any one time.
Types of instrumentsA mix of securities, assets in liquid form and participatory interests in collective investment schemes abroad as legislation permits.
A mix of securities, assets in liquid form and participatory interests in collective investment schemes abroad as legislation permits.
Suggested minimum horizon
Five years or longer Four years or longer
Suitable for investors who
• Want an equity-focused portfolio that has outstanding growth potential
• Aim to maximise potential returns within a moderate risk investment
• Focus on a long-term investment horizon
• Want a managed solution in offshore markets• Want to diversify their holdings across the world• Focus on a medium- to long-term investment horizon
Use this fund if you want to
• Invest in great companies listed outside South Africa• Grow your investment over the long term• Keep your capital intact over periods of five years
or longer• Outperform US inflation by the widest margin over
the long term• Have exposure to PSG Asset Management’s best
global stock ideas • Diversify your domestic equity exposure
geographically and via other sectors
• Invest in great companies listed outside South Africa • Grow your investment over the long term• Keep your capital intact over periods of four years or longer • Outperform US inflation by 6% over the long term• Have exposure to PSG Asset Management’s best global stock
ideas • Diversify your domestic equity exposure geographically and via
other sectors • Invest in an unconstrained fund with a flexible asset allocation
Philipp WörzOur global funds: offering the benefits of
long-term growth and diversification
Philipp joined PSG in 2007 as an Equity Analyst. Philipp is the Co-Fund Manager of the PSG Global Equity and PSG Global Flexible Funds.

12 |
Notes

THIRD QUARTER 2015
Notes
| 13
14 |
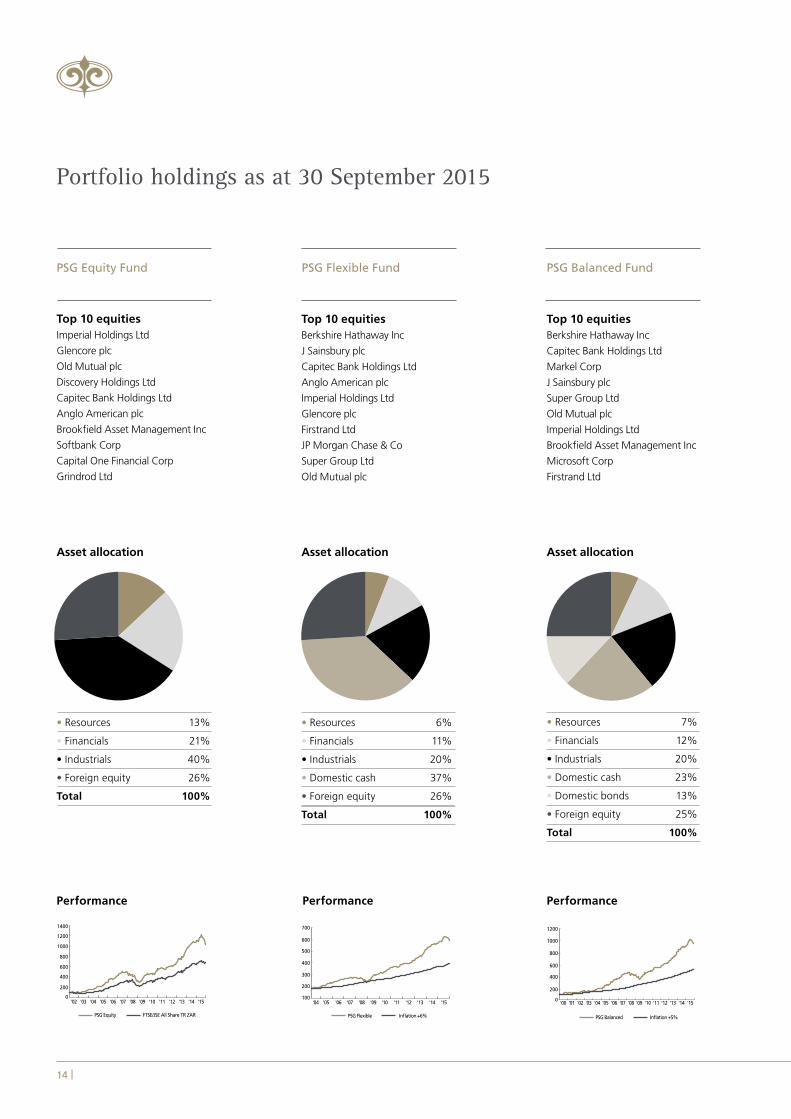
Portfolio holdings as at 30 September 2015
'15
• Resources 6%
• Financials 11%
• Industrials 20%
• Domestic cash 37%
• Foreign equity 26%
Total 100%
Top 10 equitiesBerkshire Hathaway Inc
J Sainsbury plc
Capitec Bank Holdings Ltd
Anglo American plc
Imperial Holdings Ltd
Glencore plc
Firstrand Ltd
JP Morgan Chase & Co
Super Group Ltd
Old Mutual plc
Asset allocation
Performance
'04 '05 '06 '07 '08 '09 '10 '11 '12 '13 '14100
200
300
400
500
600
700
PSG Flexible Inflation +6%
PSG Flexible Fund
Top 10 equitiesImperial Holdings Ltd
Glencore plc
Old Mutual plc
Discovery Holdings Ltd
Capitec Bank Holdings Ltd
Anglo American plc
Brookfield Asset Management Inc
Softbank Corp
Capital One Financial Corp
Grindrod Ltd
• Resources 13%
• Financials 21%
• Industrials 40%
• Foreign equity 26%
Total 100%
Asset allocation
Performance
'02 '03 '04 '05 '06 '07 '08 '09 '10 '11 '12 '13 '14 '150
200
400
600
800
1000
1200
1400
PSG Equity FTSE/JSE All Share TR ZAR
PSG Equity Fund
• Resources 7%
• Financials 12%
• Industrials 20%
• Domestic cash 23%
• Domestic bonds 13%
• Foreign equity 25%
Total 100%
Top 10 equitiesBerkshire Hathaway Inc
Capitec Bank Holdings Ltd
Markel Corp
J Sainsbury plc
Super Group Ltd
Old Mutual plc
Imperial Holdings Ltd
Brookfield Asset Management Inc
Microsoft Corp
Firstrand Ltd
Asset allocation
Performance
0
200
400
600
800
1000
PSG Balanced Inflation +5%
'00 '01 '02 '03 '04 '05 '06 '07 '08 '09 '10 '11 '12 '13 '14 '15
PSG Balanced Fund
1200

THIRD QUARTER 2015 | 15
Top 5 equitiesBerkshire Hathaway Inc
Capitec Bank Holdings Ltd
J Sainbury plc
Markel Corp
Brookfield Asset Management Inc
Top 5 bond issuer exposuresCapitec Bank Holdings Ltd
Standard Bank of SA Ltd
Netcare (Pty) Ltd
Mercedes-Benz SA Ltd
Absa Bank Ltd
Asset allocation
PSG Stable Fund
• Resources 3%
• Financials 5%
• Industrials 9%
• Domestic cash 50%
• Domestic bonds 16%
• Foreign equity 16%
• Foreign cash 1%
Total 100%
Performance
'11 '12 '13 '14 '150
20
40
60
80
100
120
140
160
PSG Stable Inflation +3%
'15
Top 5 equitiesBerkshire Hathaway Inc
Capitec Bank Holdings Ltd
Markel Corp
Microsoft Corp
Steinhoff International Holdings Ltd
Top 5 bond issuer exposuresAbsa Bank Ltd
Nedbank Group Ltd
Standard Bank of SA Ltd
Capitec Bank Holdings Ltd
Firstrand Bank Ltd
• Domestic equity 3%
• Domestic cash 56%
• Domestic bonds 36%
• Foreign equity 4%
• Foreign cash 1%
Total 100%
Asset allocation
Performance
50
100
150
200
250
'06 '07 '08 '09 '10 '11 '12 '13 '14
PSG Diversified Income Inflation +1%
PSG Diversified Income Fund
• Fixed rate note 41%
• Floating rate notes 48%
• Cash and NCDs 11%
Total 100%
Top 10 bond issuer exposuresNedbank Group Ltd
Absa Bank Ltd
Standard Bank of SA Ltd
Capitec Bank Holdings Ltd
Firstrand Bank Ltd
Firstrand/RMB Holdings Ltd
Bidvest Group Ltd
Barloworld Ltd
The Thekwini Fund (RF) Ltd
Industrial Development Corp
Asset allocation
Performance
'11 '12 '13 '14 '1560
120
PSG Income STeFI Composite ZAR
PSG Income Fund
80
100
140
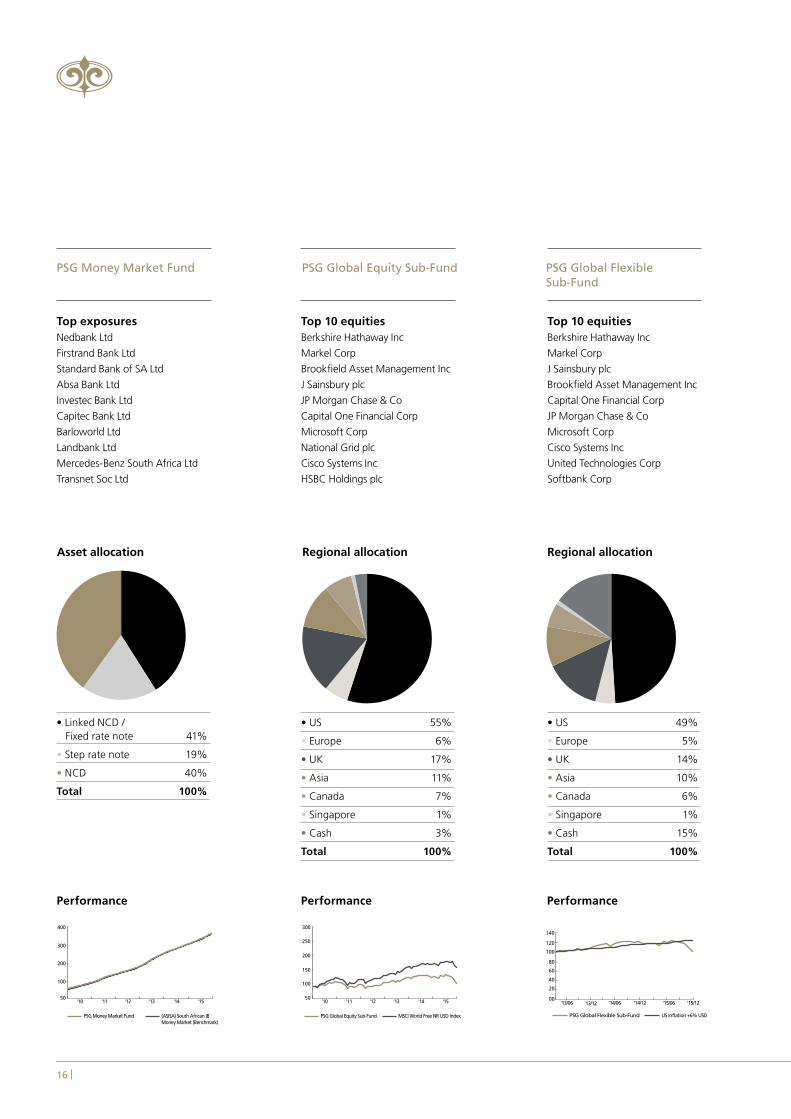
16 |
• Linked NCD / Fixed rate note 41%
• Step rate note 19%
• NCD 40%
Total 100%
Top exposuresNedbank Ltd
Firstrand Bank Ltd
Standard Bank of SA Ltd
Absa Bank Ltd
Investec Bank Ltd
Capitec Bank Ltd
Barloworld Ltd
Landbank Ltd
Mercedes-Benz South Africa Ltd
Transnet Soc Ltd
Asset allocation
Performance
PSG Money Market Fund
50
100
200
300
400
'10 '11 '12 '13 '14 '15
PSG Money Market Fund (ASISA) South African IBMoney Market (Benchmark)
• US 55%
• Europe 6%
• UK 17%
• Asia 11%
• Canada 7%
• Singapore 1%
• Cash 3%
Total 100%
Top 10 equitiesBerkshire Hathaway Inc
Markel Corp
Brookfield Asset Management Inc
J Sainsbury plc
JP Morgan Chase & Co
Capital One Financial Corp
Microsoft Corp
National Grid plc
Cisco Systems Inc
HSBC Holdings plc
Regional allocation
Performance
PSG Global Equity Sub-Fund
50
100
150
200
250
300
'10 '11 '12 '13 '14 '15
PSG Global Equity Sub-Fund MSCI World Free NR USD Index
• US 49%
• Europe 5%
• UK 14%
• Asia 10%
• Canada 6%
• Singapore 1%
• Cash 15%
Total 100%
Top 10 equitiesBerkshire Hathaway Inc
Markel Corp
J Sainsbury plc
Brookfield Asset Management Inc
Capital One Financial Corp
JP Morgan Chase & Co
Microsoft Corp
Cisco Systems Inc
United Technologies Corp
Softbank Corp
Regional allocation
PSG Global Flexible Sub-Fund
Performance
PSG Global Flexible Sub-Fund US Inflation +6% USD
00
20
40
60
80
100
120
140
'13/06 '13/12 '14/06 '14/12 '15/06 '15/12

| 17THIRD QUARTER 2015
Percentage annualised performance to 30 September 2015 (net of fees)
Source: 2015 Morningstar Inc. All rights reserved as at end of September 2015.Annualised performance shows longer term performance rescaled to a one-year period. Annualised performance is the average return per year over the period.
International funds
1 Year 2 Years 3 Years 5 Years 10 Years Inception Inception date
PSG Global Equity Sub-Fund A -16.07 -5.08 2.12 1.17 1.57 23/07/2010
MSCI World NR USD Index -5.09 3.19 8.59 8.29 9.19
PSG Global Flexible Sub-Fund A -13.07 -4.30 -0.08 02/01/2013
US Inflation +6% 6.21 6.95 7.29
Local funds
1 Year 2 Years 3 Years 5 Years 10 Years Inception Inception date
PSG Equity Fund A -4.04 7.52 16.81 15.82 13.61 18.94 01/03/2002
FTSE/JSE All Share Index 4.79 9.99 15.39 14.64 14.75 15.38
PSG Flexible Fund A 6.75 10.89 17.01 15.29 15.63 17.35 01/11/2004
Inflation +6% 10.64 11.55 11.84 11.58 12.25 12.14
PSG Balanced Fund A 6.00 9.42 14.11 13.32 11.75 14.84 01/06/1999
Inflation +5% 9.61 10.52 10.82 10.55 11.16 10.63
PSG Stable Fund A 6.13 7.04 9.59 10.21 13/09/2011
Inflation +3% 7.61 8.52 8.81 8.61
PSG Diversified Income Fund A 7.19 7.05 7.71 7.43 7.80 07/04/2006
Inflation +1% 5.60 6.51 6.81 6.55 7.37
PSG Income Fund A 6.58 6.39 5.80 5.87 01/09/2011
STeFI Composite 6.38 6.01 5.74 5.71
PSG Money Market Fund A 6.44 5.98 5.65 5.60 7.26 8.68 19/10/1998
South African Interest Bearing Money Market Mean 6.32 5.93 5.66 5.63 7.26 8.67
PSG Global Equity Feeder Fund A -0.29 9.17 18.58 13.89 03/05/2011
MSCI World Free NR USD Index (in ZAR) 16.16 20.97 28.99 24.55
PSG Global Flexible Feeder Fund A 4.53 10.89 16.62 10/04/2013
US Inflation +6% (in ZAR) 29.99 25.38 28.01

Risk
/ret
urn
prof
ile
Anticipated long-term real returns
PSG
Div
ersi
fied
Inco
me
PSG
Sta
ble
PSG
Bal
ance
d
PSG
Fle
xib
le
PSG
Eq
uit
yPS
G G
lob
al E
qu
ity
PSG
Glo
bal
Fle
xib
le
PSG
Inco
me
PSG
Mo
ney
Mar
ket
Ave
rag
e ri
sk
18 |

THIRD QUARTER 2015
Uni
t tr
ust
sum
mar
y So
uth
Afr
ican
po
rtfo
lios
Ran
d-d
eno
min
ated
off
sho
re
PSG
Equ
ity F
und
PSG
Fle
xibl
e Fu
ndPS
G B
alan
ced
Fund
PSG
Sta
ble
Fund
PSG
Div
ersi
fied
Inco
me
Fund
PSG
Inco
me
Fund
PSG
Mon
ey M
arke
t Fu
ndPS
G G
loba
l Equ
ity
Feed
er F
und
PSG
Glo
bal F
lexi
ble
Fe
eder
Fun
d
Fund
cat
egor
y
(ASI
SA c
lass
ifica
tion)
Sout
h A
fric
an -
Equ
ity
- G
ener
alSo
uth
Afr
ican
- M
ulti
Ass
et -
Fle
xibl
eSo
uth
Afr
ican
- M
ulti
Ass
et -
Hig
h Eq
uity
Sout
h A
fric
an -
Mul
ti A
sset
- L
ow E
quity
Sout
h A
fric
an
- M
ulti
Ass
et-
Inco
me
Sout
h A
fric
an -
Inte
rest
Be
arin
g -
Shor
t-te
rmSo
uth
Afr
ican
- In
tere
st
Bear
ing
- M
oney
M
arke
t
Glo
bal -
Equ
ity -
G
ener
alG
loba
l - M
ulti
Ass
et -
Fl
exib
le
Inve
stm
ent
obje
ctiv
ePr
ovid
e lo
ng-t
erm
ca
pita
l gro
wth
and
de
liver
a h
ighe
r ra
te
of r
etur
n th
an t
hat
of t
he S
outh
Afr
ican
eq
uity
mar
ket
with
in a
n ac
cept
able
ris
k pr
ofile
.
Ach
ieve
sup
erio
r m
ediu
m-
to lo
ng-t
erm
ca
pita
l gro
wth
thr
ough
ex
posu
re t
o se
lect
ed
sect
ors
of t
he e
quity
, bo
nd a
nd m
oney
m
arke
ts.
Prov
ide
long
-ter
m
capi
tal g
row
th a
nd
a re
ason
able
leve
l of
inco
me.
Gen
erat
e a
retu
rn o
f C
PI+
3% o
ver
a ro
lling
3-
year
per
iod
afte
r co
sts,
whi
le a
imin
g to
ach
ieve
cap
ital
appr
ecia
tion
with
lo
w v
olat
ility
and
low
co
rrel
atio
n to
equ
ity
mar
kets
thr
ough
all
mar
ket
cycl
es.
Pres
erve
cap
ital a
nd
max
imis
e in
com
e re
turn
s.
Max
imis
e in
com
e an
d pr
eser
ve c
apita
l whi
le
achi
evin
g lo
ng-t
erm
ca
pita
l app
reci
atio
n as
inte
rest
rat
e cy
cles
al
low
.
Prov
ide
capi
tal s
ecur
ity,
a st
eady
inco
me
yiel
d an
d hi
gh li
quid
ity.
Out
perf
orm
the
av
erag
e of
the
wor
ld’s
equi
ty m
arke
ts, a
s re
pres
ente
d by
the
M
SCI W
orld
Fre
e N
R U
SD In
dex
(in Z
AR)
.
Ach
ieve
sup
erio
r m
ediu
m-
to lo
ng-t
erm
ca
pita
l gro
wth
thr
ough
ex
posu
re t
o se
lect
ed
sect
ors
of t
he g
loba
l eq
uity
, bon
d an
d m
oney
mar
kets
.
Benc
hmar
kFT
SE/J
SE A
ll Sh
are
Inde
x af
ter
cost
sIn
flatio
n +
6%In
flatio
n +
5%In
flatio
n +
3% o
ver
rolli
ng 3
-yea
r pe
riod
afte
r co
sts
Infla
tion
+1%
STeF
I Com
posi
teSo
uth
Afr
ican
- In
tere
st
Bear
ing
- M
oney
M
arke
t m
ean
MSC
I Wor
ld F
ree
NR
USD
Inde
x (in
ZA
R)U
S In
flatio
n +
6%
Risk
rat
ing
Hig
hM
oder
ate
- H
igh
Mod
erat
e -
Hig
hM
oder
ate
Low
- M
oder
ate
Low
- M
oder
ate
Low
Hig
hM
oder
ate
- H
igh
Tim
e ho
rizon
5 ye
ar +
4 ye
ar +
3 ye
ar +
2 ye
ar +
2 ye
ar +
1 ye
ar +
1 m
onth
+5
year
+4
year
+
The
Fund
is s
uita
ble
for
Inve
stor
s w
ho:
• se
ek a
n eq
uity
-fo
cuse
d po
rtfo
lio
that
has
out
stan
ding
gr
owth
pot
entia
l
• ai
m t
o m
axim
ise
pote
ntia
l ret
urns
w
ithin
an
acce
ptab
le
risk
profi
le
• fo
cus
on a
long
-ter
m
inve
stm
ent
horiz
on
Inve
stor
s w
ho:
• se
ek e
xpos
ure
to t
he
equi
ty m
arke
t bu
t w
ith m
anag
ed r
isk
leve
ls
• ai
m t
o bu
ild w
ealth
• fo
cus
on a
med
ium
- to
long
-ter
m
inve
stm
ent
horiz
on
Inve
stor
s w
ho:
• w
ould
pre
fer
the
fund
m
anag
er t
o m
ake
the
asse
t al
loca
tion
deci
sion
s
• ai
m t
o bu
ild w
ealth
w
ithin
a m
oder
ate
risk
inve
stm
ent
Inve
stor
s w
ho:
• ha
ve a
low
ris
k ap
petit
e bu
t re
quire
ca
pita
l gro
wth
in r
eal
term
s
• fo
cus
on a
sho
rt-
to m
ediu
m-t
erm
in
vest
men
t ho
rizon
Inve
stor
s w
ho:
• ha
ve a
low
ris
k ap
petit
e an
d an
in
com
e re
quire
men
t
• w
ant
to e
arn
an
inco
me,
but
nee
d to
tr
y an
d be
at in
flatio
n
• fo
cus
on a
sho
rt-
to m
ediu
m-t
erm
in
vest
men
t ho
rizon
Inve
stor
s w
ho:
• ha
ve a
low
ris
k ap
petit
e w
ith a
n in
com
e re
quire
men
t
• fo
cus
on a
sho
rt-
to m
ediu
m-t
erm
in
vest
men
t ho
rizon
Inve
stor
s w
ho:
• se
ek c
apita
l sta
bilit
y,
inte
rest
inco
me
and
high
liqu
idity
thr
ough
a
low
- ris
k in
vest
men
t
• ne
ed a
n in
terim
in
vest
men
t ve
hicl
e or
‘par
king
bay
’ for
su
rplu
s fu
nds
• fo
cus
on a
sho
rt-
to m
ediu
m-t
erm
in
vest
men
t ho
rizon
Inve
stor
s w
ho:
• se
ek a
n eq
uity
-fo
cuse
d po
rtfo
lio
that
has
out
stan
ding
gr
owth
pot
entia
l
• ai
m t
o m
axim
ise
pote
ntia
l ret
urns
w
ithin
a m
oder
ate
risk
inve
stm
ent
• fo
cus
on a
long
-ter
m
inve
stm
ent
horiz
on
Inve
stor
s w
ho:
• w
ant
a m
anag
ed
solu
tion
in o
f fsh
ore
mar
kets
• w
ant
to d
iver
sify
the
ir ho
ldin
gs a
cros
s th
e w
orld
• fo
cus
on a
med
ium
- to
long
-ter
m
inve
stm
ent
horiz
on
Net
equ
ity e
xpos
ure
100%
0% -
100
%0%
- 7
5%0%
- 4
0%0%
- 1
0%0%
0%10
0%40
% -
75%
Inco
me
dist
ribut
ion
Bi-a
nnua
llyBi
-ann
ually
Bi-a
nnua
llyBi
-ann
ually
Qua
rter
lyQ
uart
erly
Mon
thly
Ann
ually
Ann
ually
Min
imum
inve
stm
ent
R2 0
00 lu
mp
sum
, or
R250
mon
thly
deb
it or
der
R2 0
00 lu
mp
sum
, or
R250
mon
thly
deb
it or
der
R2 0
00 lu
mp
sum
, or
R250
mon
thly
deb
it or
der
R2 0
00 lu
mp
sum
, or
R250
mon
thly
deb
it or
der
R2 0
00 lu
mp
sum
, or
R250
mon
thly
deb
it or
der
R2 0
00 lu
mp
sum
, or
R250
mon
thly
deb
it or
der
R25
000
lum
p su
mR2
000
lum
p su
mR2
000
lum
p su
m
Fees
(inc
l. VA
T)A
nnua
l man
agem
ent
fee:
Cla
ss A
: 1.7
1%C
lass
B: 1
.14%
+
22.8
%of
out
perf
orm
ance
of
benc
hmar
k
Ann
ual m
anag
emen
t fe
e:C
lass
A: 1
.14%
+
7.98
%of
out
perf
orm
ance
of
high
wat
erm
ark
Ann
ual m
anag
emen
t fe
e:C
lass
A: 1
.71%
Cla
ss B
: 1.1
4% +
7.
98%
of o
utpe
rfor
man
ce o
f hi
gh w
ater
mar
k
Ann
ual m
anag
emen
t fe
e:C
lass
A: 1
.71%
Ann
ual m
anag
emen
t fe
e:C
lass
A: 1
.14%
Ann
ual m
anag
emen
t fe
e:C
lass
A: 0
.74%
Ann
ual m
anag
emen
t fe
e:C
lass
A: 0
.57%
Cla
ss B
: 0.1
7%
Ann
ual m
anag
emen
t fe
e:C
lass
A: 0
.86%
Ann
ual m
anag
emen
t fe
e:C
lass
A: 0
.86%
Cla
ss B
: 0.2
9%
Com
plia
nce
with
Pr
uden
tial I
nves
tmen
t G
uide
lines
(Reg
ulat
ion
28)
No
No
Yes
Yes
Yes
No
Yes
No
No
| 19

20 |
PSG Asset Management unit trusts
Local unit trusts0800 600 [email protected] Offshore unit trusts0800 600 [email protected] General enquiries+27 (21) 799 [email protected]
Websiteswww.psg.co.za/asset-managementwww.psgkglobal.com
Cape Town office
Physical addressFirst Floor, PSG House Alphen ParkConstantia Main Road Constantia, Western Cape
Postal addressPrivate Bag X3 Constantia, 7848
Switchboard+27 (21) 799 8000
Guernsey office
Address11 New StreetSt Peter Port Guernsey, GY1 2PF
Switchboard+44 1481 726034
Client servicesSA Toll Free 0800 600 168
Malta Office
AddressUnit G02SmartCity MaltaRicasoli, Kakara SCM 1001Malta
Telephone+35 6218 07586
Contact information

THIRD QUARTER 2015 | 21
Disclaimer: Collective Investment Schemes in Securities (CIS) are generally medium to long-term investments. The value of participatory interests (units) or the investment may go down as well as up and past performance is not a guide to future performance. CIS are traded at ruling prices and can engage in borrowing and script lending. Fluctuations or movements in the exchange rates may cause the value of underlying international investments to go up or down. Where foreign securities are included in a portfolio, the portfolio is exposed to risks such as potential constraints on liquidity and the repatriation of funds; macroeconomic, political, foreign exchange, tax, settlement and potential limitations on the availability of market information. The portfolios may be capped at any time in order for them to be managed in accordance with their mandate. Excessive withdrawals from the fund may place the fund under liquidity pressure and, in certain circumstances a process of ring-fencing withdrawal instructions may be followed. The fund may borrow up to 10% of the market value to bridge insufficient liquidity. Fees and Performance: Prices are published daily and available on the website www.psg.co.za and in the daily newspapers. A schedule of fees and charges and maximum commissions is available on request from PSG Collective Investments Limited. Commission and incentives may be paid and, if so, are included in the overall costs. Forward pricing is used. Different classes of Participatory Interest can apply to these portfolios and are subject to different fees, charges and possibly dividend withholding tax and will thus have differing performances. Performance is calculated for the portfolio and individual investor performance may differ as a result thereof. All performance data for a lump sum, net of fees, include income and assumes reinvestment of income on a NAV-NAV basis. Source of performance: Figures quoted are from Morningstar Inc. Cut-off times: The cut-off time for processing investment transactions is 14h30 daily, with the exception of the PSG Money Market Fund which is 11h00. Additional information: Additional information is available free of charge on the website and may include publications, brochures, application forms and annual reports. Company details: PSG Collective Investments Limited is registered as a CIS Manager with the Financial Services Board, and a member of the Association of Savings and Investments South Africa (ASISA) through its holdings company PSG Konsult Limited. The management of the portfolios is delegated to PSG Asset Management (Pty) Ltd, an authorized Financial Services Provider under the Financial Advisory and Intermediary Services Act 2002, FSP no 29524. PSG Asset Management (Pty) Ltd and PSG Collective Investments Limited are subsidiaries of PSG Group Limited. Money Market: The PSG Money Market Fund maintains a constant price and targeted at a constant value. The quoted yield is calculated by annualizing the average 7 day yield. A money market portfolio is not a bank deposit account. Excessive withdrawals from the portfolio may place the portfolio under liquidity pressures and in such circumstances a process of ring-fencing of withdrawal instructions and managed payouts over time may be followed. The total return to the investor is made up of interest received and any gain or loss made on any particular instrument. In most cases the return will merely have the effect of increasing or decreasing the daily yield but in the case of abnormal losses it can have the effect of reducing the capital value of the portfolio. Fund of Funds: A Fund of Funds portfolio only invests in portfolios of other collective investment schemes, which levy their own charges, which could result in a higher fee structure for Fund of Funds portfolios. Feeder Funds: A Feeder Fund is a portfolio which, apart from assets in liquid form, invests in a single portfolio of a collective investment scheme, which levies its own charges and which could result in a higher fee structure for the feeder fund.
Trustee: The Standard Bank of South Africa Limited, Main Tower, Standard Bank Centre, 2 Hertzog Boulevard, Cape Town, 8001. Tel: 021 401 2443. Email: [email protected]. Conflict of Interest Disclosure: The Fund may from time to time invest in a portfolio managed by a related party. PSG Collective Investments Limited or the Fund Manager may negotiate a discount in fees charged by the underlying portfolio. All discounts negotiated are re-invested in the Fund for the benefit of the investor. Neither PSG Collective Investments Limited nor PSG Asset Management retains any portion of such discount for their own accounts. The Fund Manager may use the brokerage services of a related party, PSG Securities Ltd.
PSG Collective Investments Limited does not provide any guarantee either with respect to the capital or the return of the portfolio and can be contacted on 0800 600 168 or e-mail, [email protected].
© 2015 PSG Asset Management Holdings (Pty) Limited
