andre lagrange md phd abcn fana...andre lagrange md phd abcn fana advanced mri epilepsy protocol...
TRANSCRIPT
Andre Lagrange MD PhD ABCN FANA

Advanced MRI

Epilepsy Protocol Volumetric T1 Thin cut, no skip Inversion Recovery T1 (aka SPGR) Thin cut FSE- T2 or FLAIR perpendicular to hippocampus
Highly sensitive : >95% detection histopathologically defined MTS (Kuzniecky Neurology 1997)
Can have false positives, especially if bilateral (Labate Neurology 2013)
Axial FLAIR Sagittal T1 Contrast may not be needed

Is stronger always better? 3T and higher allow for faster scans, Greater signal:noise May be more sensitive to magnetic field inhomogenities
Can give false positively abnormal changes in signal intensity
Bernasconi 2011

MRI & VNS Potential Problems
Heating Device reset that could theoretically clear historical data (serial
number, implant data, stimulus parameters) Magnet mode activation during scan- prevented by setting current
to 0 mA Distorted images
Product insert specifically says to avoid use of an open MRI or trying to image the area actually containing the VNS device (usually C7-T8).
Managements Coordinate the scan with radiology (you might need to get their
approval before ordering the scan Interrogate the device prior to scan, write down the settings Re-interrogate and possibly reprogram after the scan

Morris Z et al. BMJ 2009;339:bmj.b3016
Incidental MRI findings Neoplasm
Meningioma 0.3% Pituitary adenoma 0.15% Other 0.2%
Vascular Cavernoma 0.16% AVM 0.05% Aneurysm 0.35%
Arachnoid Cyst 0.5% Chiari I 0.24% Hydrocephalus 0.1%
meta-analysis of 20,000 controls

Morris Z et al. BMJ 2009;339:bmj.b3016
Prevalence incidental MRI findings by age
2
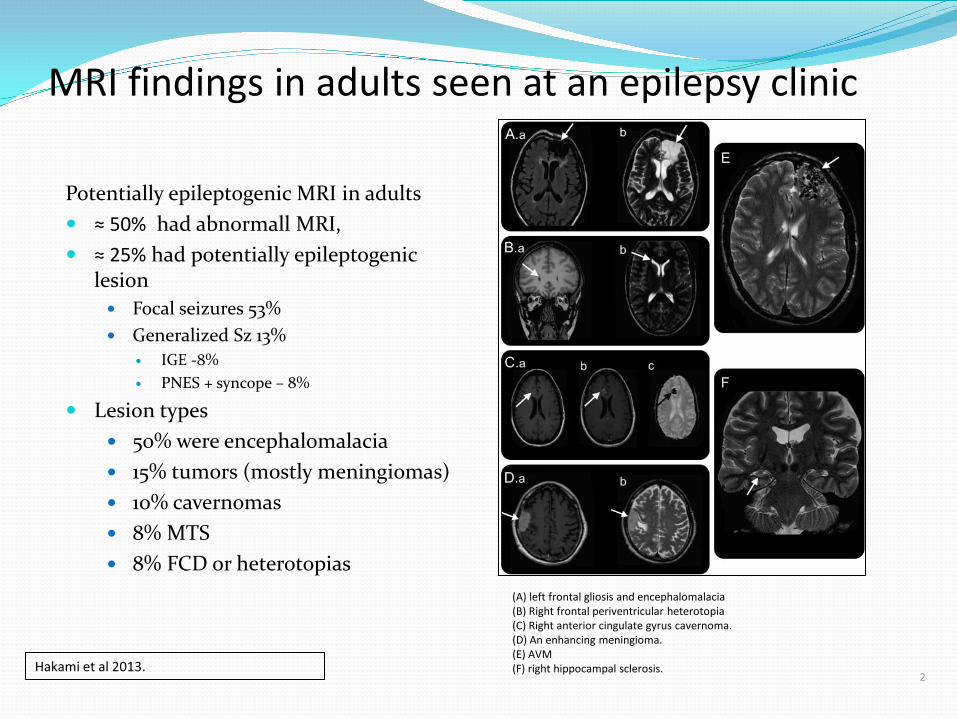
MRI findings in adults seen at an epilepsy clinic
Potentially epileptogenic MRI in adults ≈ 50% had abnormall MRI, ≈ 25% had potentially epileptogenic
lesion Focal seizures 53% Generalized Sz 13%
IGE -8% PNES + syncope – 8%
Lesion types 50% were encephalomalacia 15% tumors (mostly meningiomas) 10% cavernomas 8% MTS 8% FCD or heterotopias
Hakami et al 2013.
(A) left frontal gliosis and encephalomalacia (B) Right frontal periventricular heterotopia (C) Right anterior cingulate gyrus cavernoma. (D) An enhancing meningioma. (E) AVM (F) right hippocampal sclerosis.
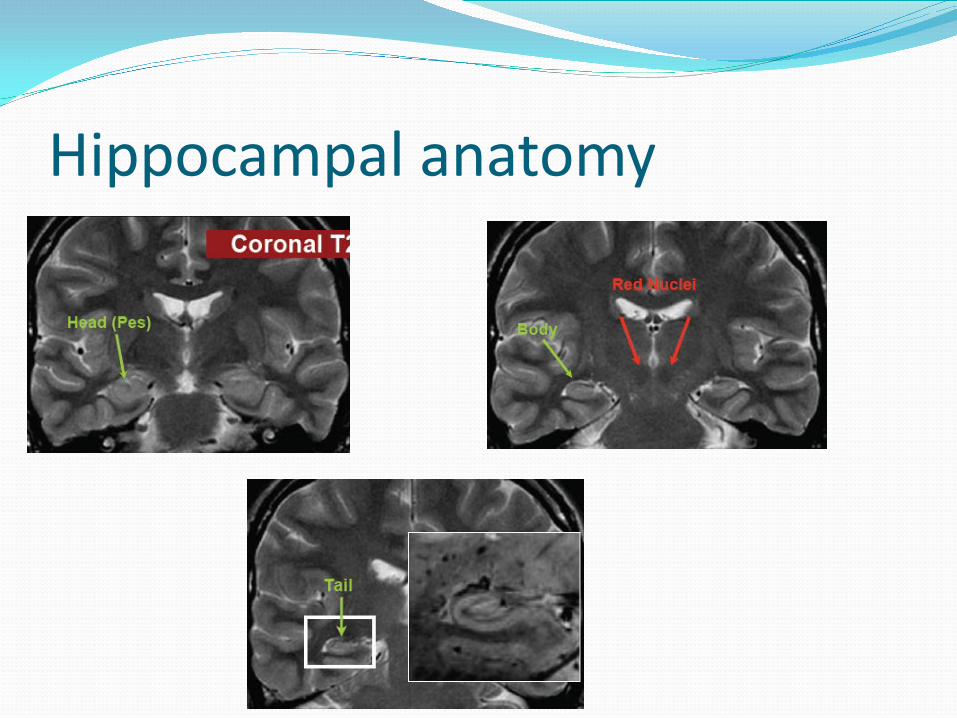
Hippocampal anatomy

2 Cendes 2013 CONTINUUM: Neurology
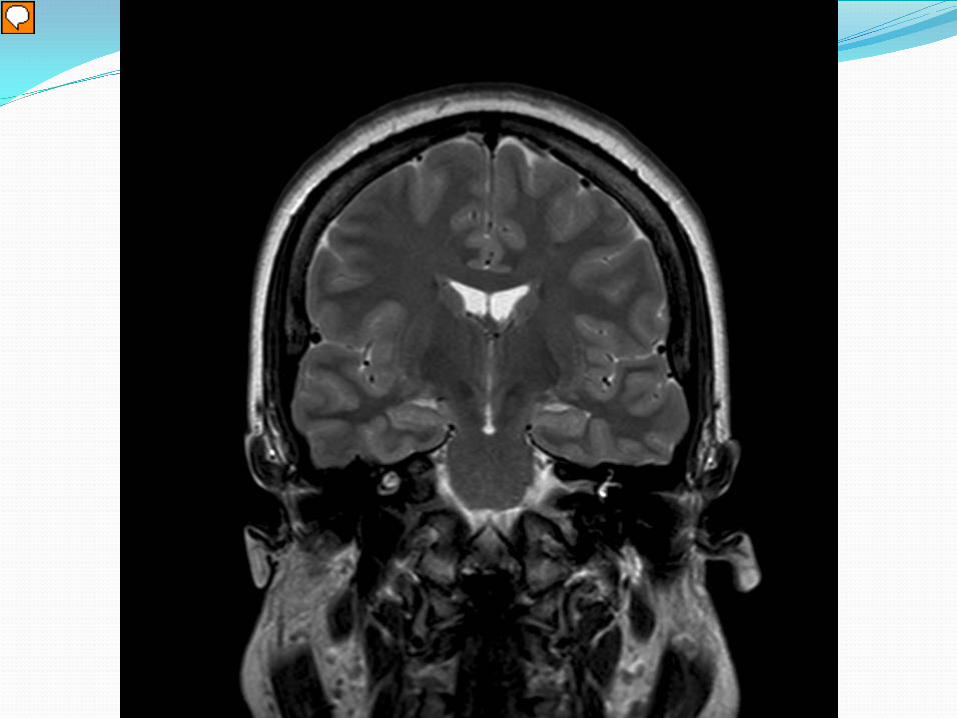
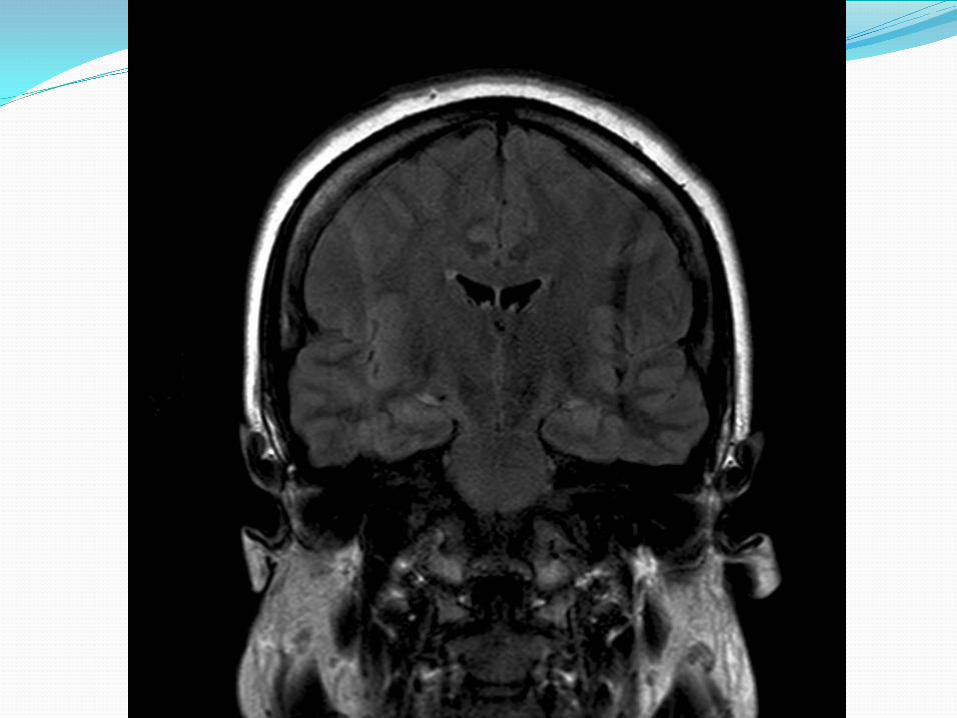
Mesial Temporal Sclerosis 1) Hippocampal atrophy 2) Increased T2 signal 3) Altered configuration
1) Normal hippo is oval 2) Abnormal can be flattened & tilted
4) Loss of internal structure- 5) Look at surrounding brain
1) Enlarged lateral ventricle 2) Atrophy of ipsalateral fornix &
mammillary body (red arrows)

Hippocampal Imaging Atrophy is more specific than T2 changes 99 young adult controls compared to 51 pt with TLE
FLAIR changes (uni or bilateral) 48% TLE vs 29% controls Unilateral atrophy 40% TLE vs 1% in controls
Labate Neurology 2010
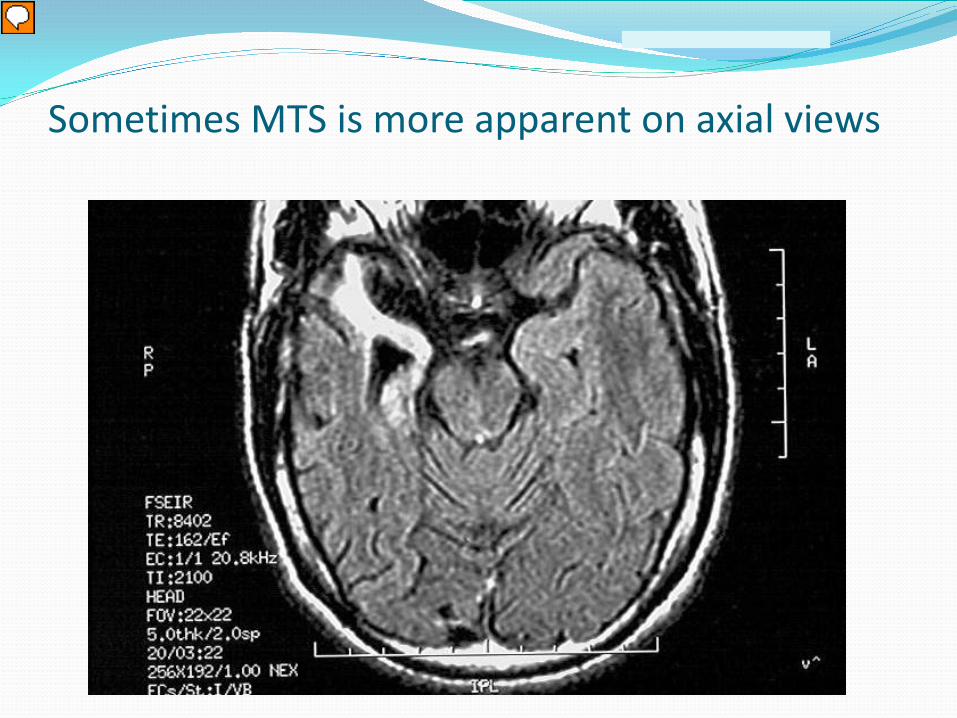
Sometimes MTS is more apparent on axial views

Cortical Development Radial migration
Subcortical, funnel shape transmantle sign polymicrogyri

Cortical Dysplasia Classification 2013 Type 1
1a: abnormal radial lamination of CTX → small hemisphere Microscopically: Microcolumns are maintained, but border to white matter is blurred Radiologically can appear as just a diffusely smaller hemisphere
1b: abnormal tangential lamination of CTX Failure to create normal 6-layered cortex.
1c both radial & tangential lamination Type 2
2a dysmorphic neurons 2b dysmorphic neurons + balloon cells
Type 3 (FCD-plus) 3a FCD + MTS 3b FCD + adjacent tumors 3c FCD + adjacent vascular malformation 3d FCD + adjacent other malformation
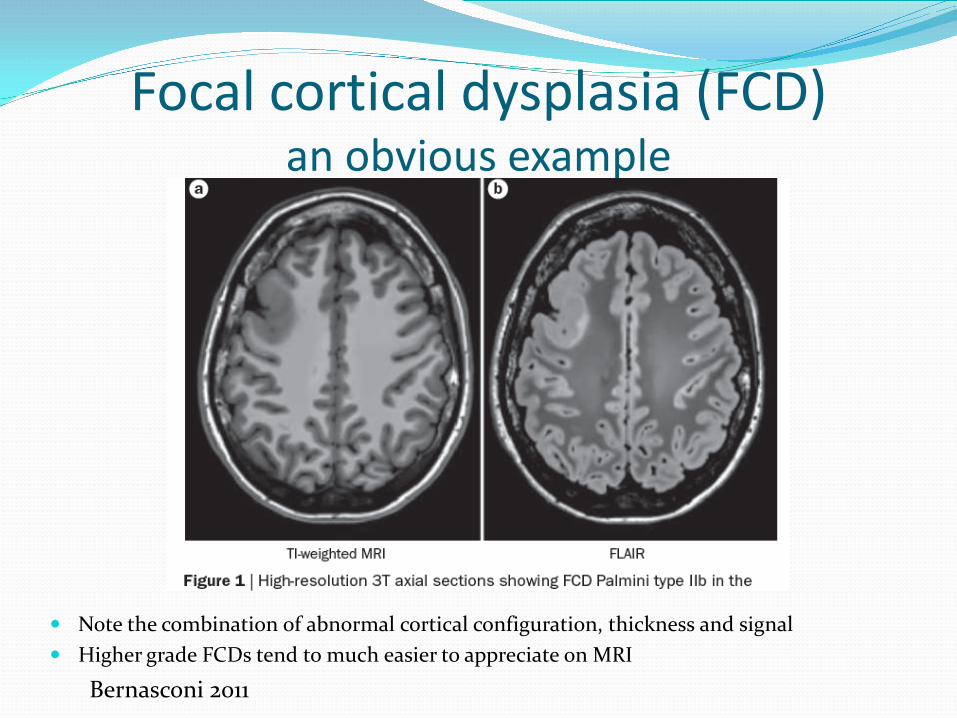
Focal cortical dysplasia (FCD) an obvious example
Note the combination of abnormal cortical configuration, thickness and signal Higher grade FCDs tend to much easier to appreciate on MRI
Bernasconi 2011

FCDs Sulcal abnormalities
The majority (≈85%) of small FCDs found at the bottom of especially deep sulci Blurred gray-white border Transmantle sign
Bernasconi 2011
Strongly consider including depth electrodes for planning invasive recording, may be more likely than subdural grids to record directly from the lesion

Subtle Transmantle sign with FCD 2a
Bernasconi 2011

2 Cendes CONTINUUM: 2013
Blue arrow cortical thickening and loss of sharpness of the cortical-subcortical transition Red arrow transmantle sign + T2 hyperintensity
Clear transmantle sign in FCD 2b

Knake et al Neurology 2005 2
FCD 3T Phased Array can help
Standard 1.5T head coil 3T phased array

Be sure to look at the proper sequences
Standard T1 SPGR (aka spoiled gradient echo or FFE)

T2-weighted FLAIR
What’s this?

T2-weighted FLAIR
Cavernoma (1)

Dating blood on MRI Dr Dre’s Musical Mnemonic
♪ Id-Dy, Bi-Ddy, Ba-By, Da-Ddy ♫
Age of blood T1 signal T2 signal
Hyperacute (min) Isointense Dark
Acute (hours) Bright Dark
Subacute (days-wks) Bright Bright
Chronic (wks-mos) Dark Dark
Low grade tumors in temporal lobe Gliomas Gangliogliomas Oligodendroglioma Dysembryoplastic neuroepithelial tumor
Dark on CT, may have calcifications Variable contrast enhancement (about 30% enhance) May be associated with FCD

Meningiomas
Hakami et al 2013.
Extraxial, compressive Look for the dural tail

2 Cendes CONTINUUM: 2013. & Velez-Ruiz Seminars in Neurology 2012
Gangliogliomas & DNETs (hard to differentiate in imaging)
Both DNET & Gangliogliomas are commonly found in temporal lobe tumors associated with epilepsy in kids/young adults. Both have variable contrast-enhancement and cystic components. They tend to be T1 dark, T2 bright A portion (≈25%) of DNETs also have calcification

2 Cendes CONTINUUM: 2013.
Oligodendrogliomas
T1 dark, T2 bright May have foci of T1 bright signal due to intratumor bleeding Usually calcified, best seen on CT. May be shell-like, ringlike, or nodular.

Oligodendrogliomas-calcification
Calcifications may be seen on CT (A), but not necessarily on MRI (B). Susceptibility-weighted images can sometimes pick up calcium (not yet reliable)
Zulfiqar M et al. AJNR Am J Neuroradiol 2012;33:858-864
fMRI- assumes intact neurovascular coupling Functional MRI (fMRI) visualizes blood flow changes
reflecting activation of brain regions. Assumes neurovascular coupling is intact
In a basic fMRI study, a subject alternates between an active task (for example naming animals) and an inactive (or control) state.
Comparison of active and inactive images shows changes in blood flow reflecting activation.

fMRI- specific testing techniques Word Generation
from Categories From Letters
Reading Descriptions of nouns Reading pseudowords Listen to a story

Magnetoencephalography (MEG)

Surface EEG Potentials
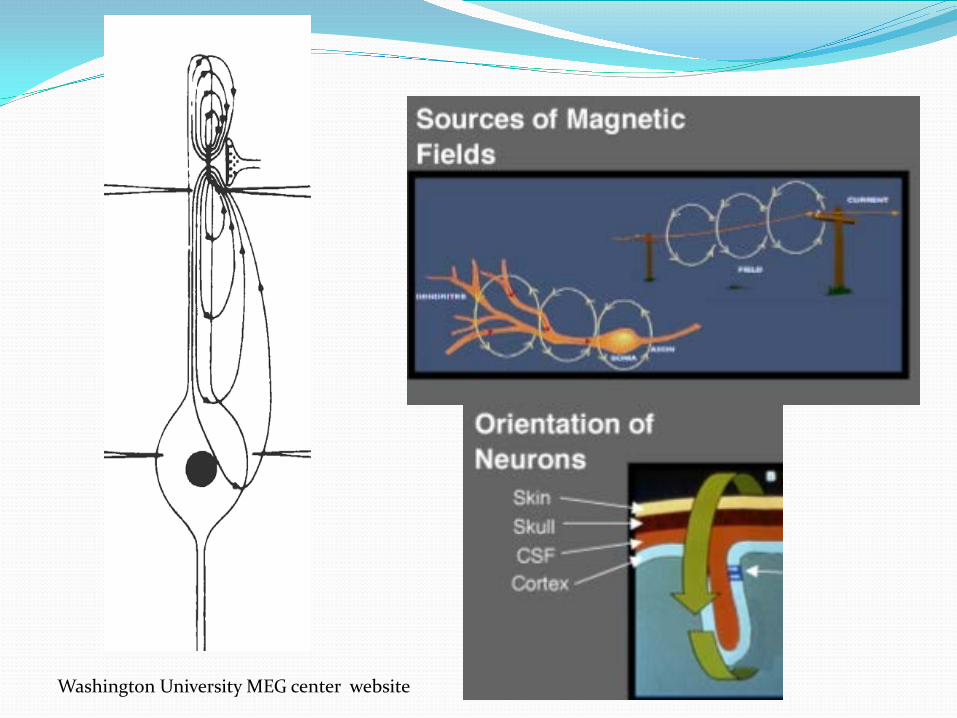
Washington University MEG center website

MEG properties MEG is essentially looking at the same physiological phenomena as EEG, just in a different way… EEG
Reports radial electrical signal (top of sulci) Sensitive to variable tissue conductivity Relatively unaffected by distance
MEG- reports tangential electrical signal (within sulci) Relatively unaffected by variable conductance (breach) Very sensitive to distance E.g. MEG only detects about 25% of mesiotemporal spikes
seen on EEG

MEG application
Variable sensitivity & specificity, and some of the information content overlaps that of EEG 5-15% of patients- spikes on only MEG or EEG (both both) Consider if suspected neocortical epilepsy & inconclusive EEG
Kaiboriboon 2010 showed MEG ⊕ in 60% with nonlocalizing EEG
Most experts advocate using MEG to fine-tune surgical plan Adjust grid placement MEG source overlaps lesion on imaging -> ↑ prognosis MEG shows multiple sources + nonlesional MRI ↓ prognosis Multifocal MRI- MEG can help determine which are
epileptogenic
Stefan, Rampp, Knowlton 2011

fMRI ↑ neural activity → ↑ local perfusion → ↑oxy/deoxy Hb Assumes neurovascular coupling is intact
May not be true in older individuals Could theoretically be altered by trauma, tumor The few studies that looked at this methodically in
epilepsy, have found intact neurovascular coupling

fMRI (2) Compares BOLD signal
during specific task (reading words) vs rest state (random sequence of symbols, [*$^)*@#!])
Requires subject can lie still & perform the task (e.g. reading without glasses)
Name object based on written description

MRI modalities used primarily for research

Voxel based morphometry Compare to a normative dataset
After correction for inhomogenities, classifying voxels by tissue type then registered to a normative dataset
One approach is to take areas with > 2 SD signal intensity over normal data. Keep in mind- about 60% of FCD pts have areas of abnormal
signal outside of the epileptogenic region False positives vs nonepilpetogenic abnormalities

MRS Quantify neuronal integrity by measuring N-
acetylaspartate vs choline/creatine Can only cover a few large voxels (rather than whole brain)
Poor signal: noise Requires long acquition times
Use with caution (if at all) Low resolution Only a few areas sampled Affected by neuronal density Dynamic marker: you might get different results from the
same patient

DTI

Ictal SPECT & SISCOM

Ictal SPECT- an easy case


Ictal
Interictal

SPECT SISCOM= subtracted Ictal SPECT Coregistered to MRI Required: ictal, interictal SPECTs and high res T1 MRI Best to use it to test/fine-tune a specific hypothesis
usually in preparation for intracranial iEEG E.g. seizures start in the right frontal area- yes/no If yes, can we further limit the area of ele
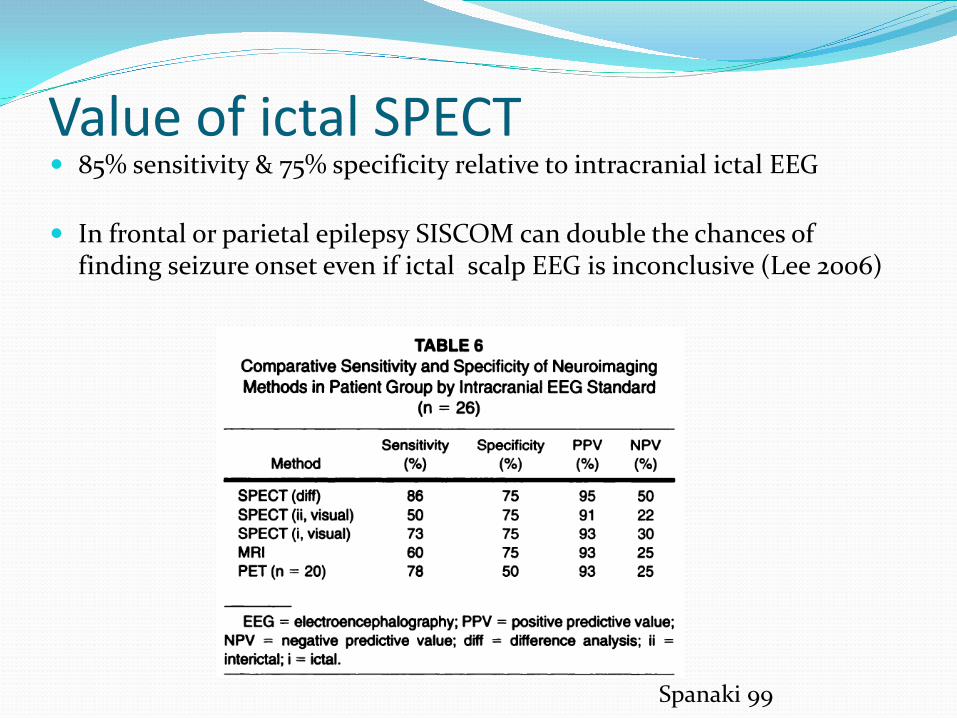
Value of ictal SPECT 85% sensitivity & 75% specificity relative to intracranial ictal EEG
In frontal or parietal epilepsy SISCOM can double the chances of
finding seizure onset even if ictal scalp EEG is inconclusive (Lee 2006)
Spanaki 99
Ictal SPECT does not always help Not helpful if there is clear MTS
Increase inpatient cost (some estimates as high as 50% increase) Von Oertzen et al estimated an extra $4000 for a 4 day stay, or an extra
$8300/hypothesis generated. Increase length of stay Doubled the risk of secondarily generalized Sz O’Brien showed it can be cost-effective helpful if MRI negative
onset
Von Oertzen et al 2011 O’Brien et al 2008

Multiple Injections May be needed if -
Seizure too short (< 15 sec) Injection too late (>20-30 sec) Not actual typical seizure Secondarily generalized seizure
Allow > 36 hours between injections to clear tracer

Interictal SPECT is almost always required

SISCOM can aid in MRI interpretation
Nocturnal hypermotor seizures every night since childhood

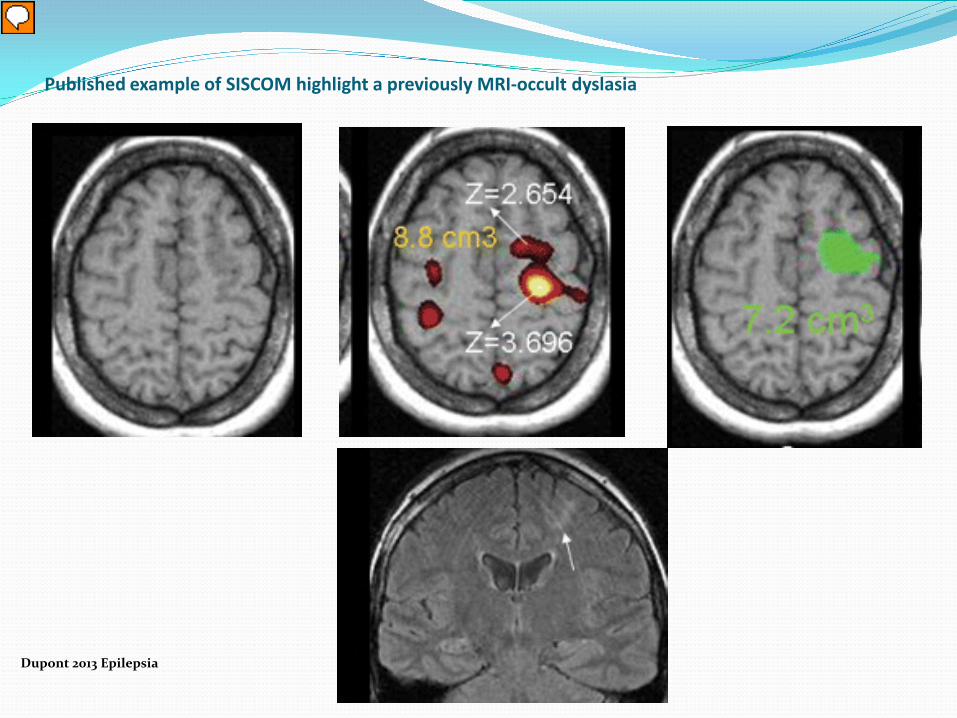
Published example of SISCOM highlight a previously MRI-occult dyslasia
Dupont 2013 Epilepsia

Getting the best study It takes 10-15 sec for tracer to reach the brain
Seizures <15-20 sec may not take up sufficient tracer Earlier Injection is Best
Preferably < 20 sec by either EEG or clinical onset (whichever comes first)
Show the nurse/technician the video and EEG of previously recorded seizures Make sure EEG is visible in room Consider having backup review in EMU control room, with ability to
call or alphanumeric page the injection nurse Low threshold to inject on patient-reported auras
Secondarily generalized Seizures?
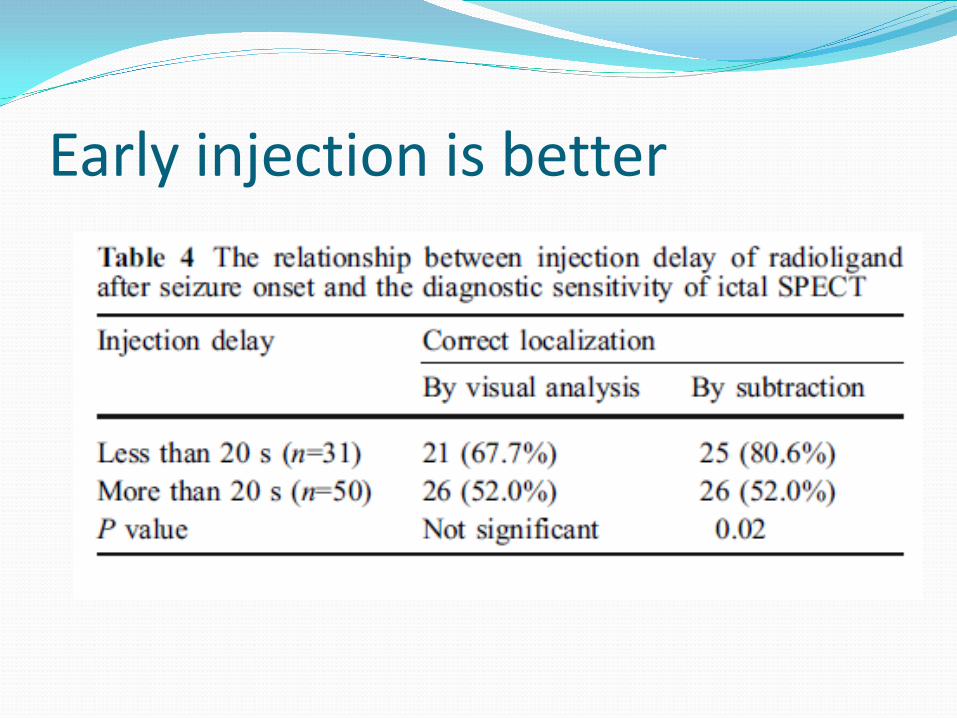
Early injection is better

2⁰ GTC can be useful (somewhat)
Much less sensitive to focal changes but hemispheric hyperperfusion can support the laterality of seizure onset (80%). Often involves one or more lobes outside the onset zone. Varghese 2008
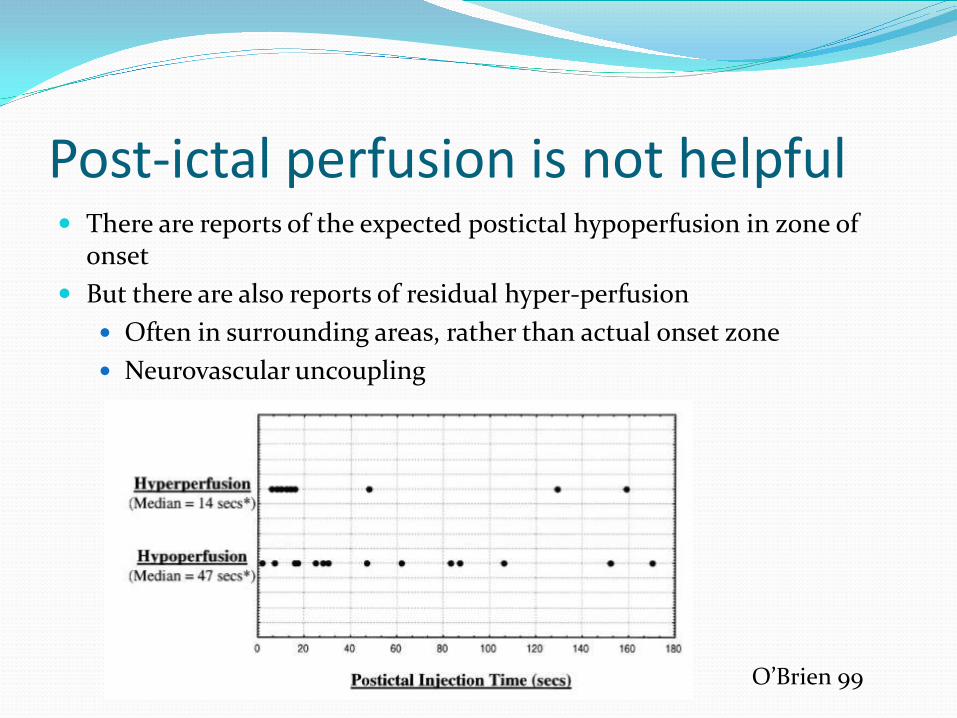
Post-ictal perfusion is not helpful There are reports of the expected postictal hypoperfusion in zone of
onset But there are also reports of residual hyper-perfusion
Often in surrounding areas, rather than actual onset zone Neurovascular uncoupling
O’Brien 99
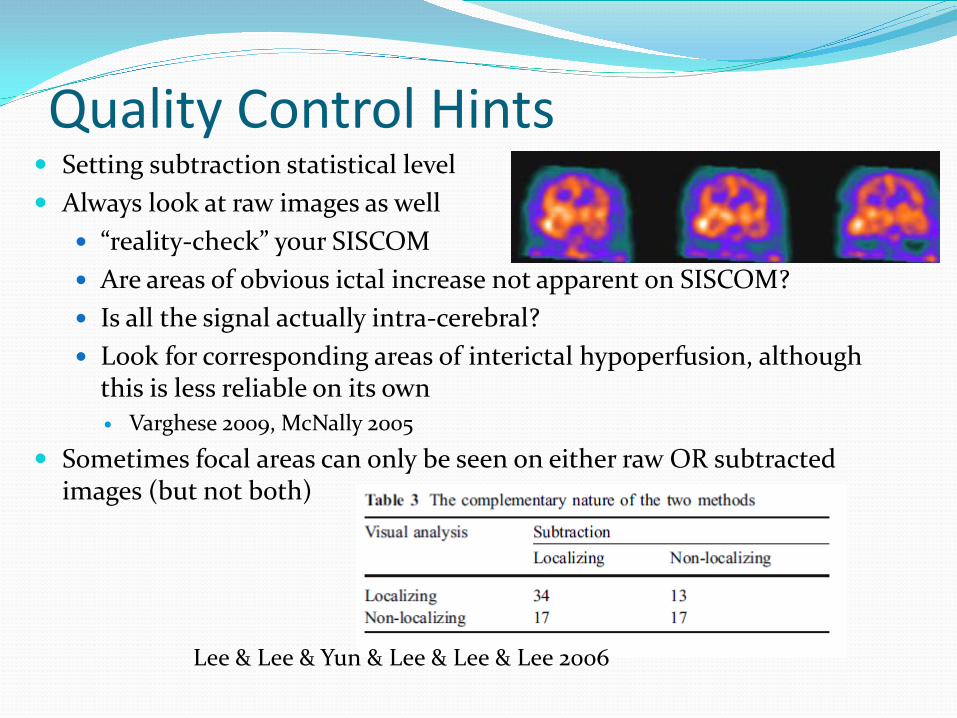
Quality Control Hints Setting subtraction statistical level Always look at raw images as well
“reality-check” your SISCOM Are areas of obvious ictal increase not apparent on SISCOM? Is all the signal actually intra-cerebral? Look for corresponding areas of interictal hypoperfusion, although
this is less reliable on its own Varghese 2009, McNally 2005
Sometimes focal areas can only be seen on either raw OR subtracted images (but not both)
Lee & Lee & Yun & Lee & Lee & Lee 2006

Don’t be fooled by signal outside the brain
Ictal Interictal
“la-la-la” Screaming and cursing

Look for concordant perfusion changes Look for other areas that can be lit up
mTLE seizures often also have ipsalateral insula. Basal ganglia (dystonic posturing)
Don’t confuse BG signal with orbitofrontal activity Thalamus (uni- or bilateral) in seizures with loss of awareness
In seizures with prominent motor activity, can often see signal in descending motor pathways
Contralateral cerebellum
Chassagnon et al 2009 Hippocampal onset post-surgery free patients Yellow= automatisms Red= dystonic posturing ± automatisms

Interictal FDG-PET Higher spatial resolution than SPECT Low temporal resolution
FDG-Glucose uptake requires > 20 minutes Provides information about interictal metabolism
(unless you get lucky & record a seizure during uptake) Should probably include EEG to confirm no seizure
during uptake Most sensitive for mesiotemporal onset (65 %
sensitivity), much less so for extratemporal neocortical seizures (20%)

Interictal FDG-PET – an easy case

FDG-PET Areas of hypometabolism often extend outside the
epileptogenic zone Useful in TLE with normal MRI
Can detect 2/3 of depth-electrode confirmed epileptic hippocampi
Neocortical epilepsy Utility is less consistent
Knowlton 2008 found FDG-PET localized ictal focus in 65% of mTLE cases, but only 20% of extratemporal onset cases

Problems with PET Averages metabolism over 30-90 minutes Can be affected by structural lesions, postictal state

FDG-PET can also show cortical dysfunction that may may complement MRI findings
Kudr 2013
PET = MRI lesion PET partially overlaps MRI lesion PET highlights subtle MRI lesion

Comparison MSI vs PET vs SISCOM
Modalities may be complimentary, depending on the case In MRI-normal patients FDG-PET was localizing in 65% of MTLE
patients, but only 20% of extra- temporal seizure patients.
Knowlton 2008 compared to surgical outcome Spanaki 1999 compared intracranial EEG

Coregistered MRI/PET can ↑ yield to find neocortical lesions
Which Modality What are you looking for? Each modality has its own
temporal and spatial resolution Epileptic focus Functional Zone Safety of resection
Need to interpret these findings in comparison to health controls – “what is abnormal?”