andersonville national park service u.s. … national park service u.s. department of the interior...
TRANSCRIPT

Andersonville National Park ServiceU.S. Department of the Interior
Andersonville National Historic SiteAndersonville National Cemetery
August Anguish at Andersonville
A Mathematical Analysis ofAndersonville’s Worst Month
Produced by Andersonville National Historic SiteTeacher-Ranger-Teacher Greg Fowler
Andersonville Prison as it appeared in August 1864 with 33,000 prisoners.NPS/A.J. Riddle
P r o d u c e d b y t h e D i v i s i o n o f I n t e r p r e t a t i o n a n d E d u c a t i o n S e p t e m b e r 2 0 1 3
E X P E R I E N C E Y O U R A M E R I C A™

Suggested Age: 4-12 Grade
Objectives (4th -6th Grade): At the end of the lesson, students will be able to do one or more of the following: -Students will be able to determine the area of a rectangle. -Students will understand that a/b = a ÷ b. -Students will be able to convert fractions to percentages.
Objectives(7th-8th Grade): At the end of the lesson, students will be able to do one or more of the following: -Determine the mean, median, and mode from a given set of data. -Calculate and compare ratios from a given set of data.
Objectives (9th-12 Grade) At the end of the lesson, students will be able to do one or more of the following: -Use the Pythagorean Theorem to solve problems. -Convert from one unit of measurement to another. -Apply appropriate mathematical strategies to solve problems.
Materials: Consolidated Monthly Returns, August 1864 Map of Andersonville Daily Returns, August 1864
Common Core Standards
CCGPS Mathematics (4th Grade) CC4.MD.1 Know relative sizes of measurement units within one system of units including km, m, cm; kg, g; lb, oz.; l, ml; hr, min, sec. Within a single system of measurement, express hr, min, sec. Within a single system of measurement, express measurements in a larger unit in terms of a smaller unit. Record measurement equivalents in a two column table. For example, know that 1 ft is 12 times as long as 1 in. Express the length of a 4 ft snake as 48 in. Generate a conversion table for feet and inches listing the number pairs (1, 12), (2, 24), (3, 36), ...
CCGPS Mathematics (5th Grade) MCC5.NF.3 Interpret a fraction as division of the numerator by the denominator (a/b = a ÷ b). Solve word problems involving division of whole numbers leading to answers in the form of fractions or mixed whole numbers leading to answers in the form of fractions or mixed numbers, e.g., by using visual fraction models or equations to represent the problem. For example, interpret ¾ as the result of dividing 3 by 4, noting that ¾ multiplied by 4 equals 3, and that when 3 wholes are shared equally among 4 people each person has a share of size ¾. If 9 people want to share a 50-pound sack of rice equally by weight, how many pounds of rice should each person get? Between what two whole numbers does your answer lie?
CCGPS Mathematics (6th Grade) MCC6.RP.3 Use ratio and rate reasoning to solve real world and mathematical problems, e.g., by reasoning about tables of equivalent ratios, tape diagrams, double number line diagrams, or equations.
CCGPS Mathematics (7th Grade) MCC7.EE.2 Understand that rewriting an expression in different forms in a problem context can shed light on the problem and how the quantities in it are related. For example, a + 0.05a = 1.05a means that “increase by 5%” is the same as “multiply by 1.05.”
CCGPS Mathematics (8th Grade) MCC8.F.4 Construct a function to model a linear relationship between two quantities. Determine the rate of change and initial value of the function from a description of a change and initial value of the function from a description of a relationship or from two (x,y) values, including reading these from a table or from a graph. Interpret the rate of change and initial value of a linear function in terms of the situation it models, and in terms of its graph or a table of values.

Common Core Standards (Continued)
CCGPS Mathematics I (9-12) MM1D3. Students will relate samples to a population. a. Compare summary statistics (mean, median, quartiles, and interquartile range) from one sample data distribution to another sample data distribution in describing center and variability of the data distributions. b. Compare the averages of the summary statistics from a large number of samples to the corresponding population parameters. c. Understand that a random sample is used to improve the chance of selecting a representative sample.
CCGPS Mathematics (9-12) MM1G3. Students will discover, prove, and apply properties of triangles, quadrilaterals, and other polygons. a. Determine the sum of interior and exterior angles in a polygon. b. Understand and use the triangle in equality, the side-angle inequality, and the exterior-angle inequality. c. Understand and use congruence postulates and theorems for triangles (SSS, SAS, ASA, AAS, HL). d. Understand, use, and prove properties of and relationships among special quadrilaterals: parallelogram, rectangle, rhombus, square, trapezoid, and kite. e. Find and use points of concurrency in triangles: incenter, orthocenter, circumcenter, and centroid.
CCGPS Mathematics II (9-12) MM2D1. Using sample data, students will make informal inferences about population means and standard deviations. a. Pose a question and collect sample data from at least two different populations. b. Understand and calculate the means and standard deviations of sets of data. c. Use means and standard deviations to compare data sets.
CCPGS Mathematics II (9-12) MM2P1. Students will solve problems (using appropriate technology). a. Build new mathematical knowledge through problem solving. b. Solve problems that arise in mathematics and in other contexts. c. Apply and adapt a variety of appropriate strategies to solve problems. d. Monitor and reflect on the process of mathematical problem solving.
In addition, this lesson incorporates several more Common Core Georgia Performance Standards that can be found at the following web addresses:
https://www.georgiastandards.org/standards/Pages/BrowseStandards/GPS_by_Grade_Level_K-8.aspx https://www.georgiastandards.org/Standards/Pages/BrowseStandards/MathStandards9-12.aspx
VOCABULARY 4th Grade-6th Grade 7th-8th Grade 9th-12th Grade Fraction Ratios Representative Sample Numerator Mean Mortality Rate Denominator Median Statistics Mode Linear Functions
Background Information
After the breakdown of the prison exchange system in mid 1863, both Union and Confederate forces were forced to hold prisoners for an extended period of time. The Confederacy first held Union prisoners in the capital city of Richmond, VA, but this placed a tremendous strain on the city’s resources. So in early 1864 the Confederacy built a new prison in rural Georgia – Camp Sumter, which quickly became known as Andersonville.
By the summer of 1864 Andersonville was incredibly overcrowded. Approximately 33,000 prisoners were held in a space intended for 10,000 and diseases related to sanitation and nutrition were rampant. By the time the prison ceased operation 45,000 men passed through the prison gates, and 13,000 of them died, making Andersonville the deadliest ground in American history.
It can sometimes be difficult for students to grasp to scale of suffering at Andersonville. This activity provides an opportunity for students to apply math skills and get a better sense of the overcrowding and death that occurred in August of 1864, when the prison was at its maximum population.

Lesson Procedure 1. Suggested Introductory Activities a. visit www.nps.gov/ande/forteachers And select one or more lesson plan activities to introduce your students to Andersonville. b. request a copy of “Voices from Andersonville,” a 30 minute introductory film to the Andersonville story
2. Review with students the appropriate mathematical skills that they will need.
3. Students may work individually or in groups. Distribute to each student or group a copy of the age appropriate worksheet.
4th-6th Grade: “The Size & Scale of Andersonville” 7th-8th Grade: “The Statistics of Death at Andersonville” 9th-12th Grade: Analyzing the Data: Understanding the Suffering at Andersonville Prison
For older or advanced students, you may assign lower grade level activities.
4. Distribute copies to each student or group copies of the following: - “Map of Andersonville Prison” -”Daily Returns, August 1864 - “Consolidated Monthly Return, August 1864”
5. Give students time to work through the assignment.
6. Using your answker key, go over the procedures with the students and help them solve each of the problems.
7. Discuss with students what these statistics mean. - How do you think it would feel to be a prisoner with so much death and suffering all around you? - Why do you think diseases were so prevalent at Andersonville? - Andersonville Prison was open for 14 months, and during that time 12,920 prisoners of war died in captivity there. August represents just a 31 day period. Do you think that the prison got better or worse? Do you think August was probably the worst time at Andersonville?
8. Have students complete the extension activites.
9. If time permits, consider taking a field trip to Andersonville. Information about field trips can be found at www.nps.gov/ande/forteachers

Andersonville National Historic Site National Park ServiceU.S. Department of the Interior
The Size & Scale of Andersonville(1): How many prisoners died in the month of August? You can use the chart “Daily Returns, August 1864” and add the number of deaths for each day.
(2): What was the total square footage of Andersonville Prison before it was expanded? And after? * 1 acre = 43,560 square feet. Before expansion – 16 acres, after expansion – 26.5 acres.
(3): What fraction of the total prison population tried to escape during August? Express your answer as both a fraction and percent. To calculate attempted escapes, use the “Daily Returns, August 1864” a. Divide the number of escapes by the number of total prisoners on hand in August. b. Multiply the number found in step “a” by 100 to get the percentage.
(4): What fraction of escape attempts was successful? What percent? Students can use the chart labeled “Daily Returns, August 1864”
A successful escape is defined as a prisoner that escapes but avoids recapture. a. To calculate the successful escapes, add the number of recaptured prisoners, and subtract these from the total number of escapes. b.Divide the number of successful escapes by the number of attempted escapes. c. Multiply the number found in step “b” by 100 to get the percentage of escapes that were successful. Andersonville Prison, as it appeared in August of 1864
NPS/AJ Riddle

Andersonville National Historic Site National Park ServiceU.S. Department of the Interior
The Statistics of Death at Andersonville1. In the month of August, what was the mean number of prisoners that died daily? To calculate this, divide the total number of prisoner deaths in August by the number of days in august. Use the data found on the Consolidated Monthly Returns, August 1864
2. Using the daily returns from August 1864, calculate the median number of deaths. Going from least to greatest, list all daily death totals for prisoners. Find the middle number in this row of numbers.
3. In the month of August, what is the mode number of daily prisoner deaths? To calculate this use the daily returns from August 1864. Going from least to greatest, list all daily death totals for prisoners. Determine the number that appears most often.
4. What is the ratio of daily totals of prisoners on hand to the daily number of deaths? List the ratios in order from August 1 to August 31. Note any trends in the increase or decrease of the ratios. Use to daily returns from August 1864. A. Divide both the number of prisoners that died and the grand total number of total prisoners each by the number of prisoners that died. For example: for August 1, you would divide 74 (the number that died) by 74, and 31,678 (the grand total) by 74. This would give you a ratio of 1:428 (1 death for every 428 prisoners on that particular day). B. List the ratios for each day and discuss any trends.
Burying the Dead Detail From a Lithograph by Andersonville Prisoner Thomas O’Dea

Andersonville National Historic Site National Park ServiceU.S. Department of the Interior
Analyzing the Data:Understanding Suffering at Andersonville Prison
Lithograph of Andersonville Prison, August 1864Thomas O’Dea
1. Using the Pythagorean Theorem and the map of the prison site, calculate the distance between the northeast corner and the southwest corner of the prison site.
2. If the total population of the prison increased by 10% on September 1st, what would the new population be? If on September 1st there was a prisoner uprising and the guards opened fire with rifles and cannons killing 25% of the prisoners and severely injuring 10% of those who were not immediately killed, then what would the new population be and how many prisoners would need medical attention?
3. Assuming that each prisoner would have needed 48 square feet (the standard size of modern jail cells) to survive the month of August, what would the new dimensions of the prison need to be? Express your answer in square feet and acres. Use the number of prisoners on hand on August 1st found in the Consolidated Monthly Return to solve this problem. 1 acre = 43,560 square feet
4. If a particular virus infected the prison population and had a 100% mortality rate, then how many days would it take for 50% of the total population to die? Use the population of the prison as of August 31st and assume that no more prisoners are added to the population because of the virus outbreak. Also, assume that once a prisoner is contagious he has 24 hours to live and will infect exactly two more prisoners before death.

Consolidated MonthlyReturns - August 1864
National Park ServiceU.S. Department of the Interior
Andersonville National Historic SiteAndersonville National Cemetery
Prisoners on hand on 1st of August, 1864: In camp…………………………………………………………………....29,985 In hospital……………………………………………….………………......1,693
TOTAL………………………………………………………………...…………..31,678 Received from various places during August………………………...……... 3,078 Recaptured…………………………………………………………..……. .......4 TOTAL……………………………………………………………..…….....3,082
TOTAL (prisoners living during August)………..………………...............………..34,760
Died during the month of August……………………………....…………. 2,993 Sent to other posts………………………………………………..……….........23 Exchanged………………………………………………………..……..............21 Escaped……………………………………………………..…………………30 TOTAL…………………………………………………………………… 3,067
GRAND TOTAL (prisoners on hand on 31st of August)…………....……….31,693
Of which there are on the 31st of August: In camp……………………………………………………...…………….29,473 In hospital…………………………………………………..…………….. 2,220 TOTAL……………………………………………………...………..…….31,693

The Prison Grounds National Park ServiceU.S. Department of the Interior
Andersonville National Historic SiteAndersonville National Cemetery

Dai
ly R
etu
rns,
A
ug
ust
186
4
Nat
ion
al P
ark
Serv
ice
U.S
. Dep
artm
ent
of
the
Inte
rio
r
An
der
son
ville
Nat
ion
al H
isto
ric
Site
An
der
son
ville
Nat
ion
al C
emet
ery
Dat
eR
ecei
ved
Rec
aptu
red
Tota
lR
ecei
ved
Tota
l in
pris
on
stoc
kade
Tota
l in
Hos
pita
lG
rand
To
tal*
Esc
aped
Die
dPa
role
d,
Rle
ased
, E
xcha
nged
Sent
to
othe
r pr
ison
s
Tota
l Esc
aped
, Tr
ansf
erre
d,
died
In p
riso
n st
ocka
deIn
H
ospi
tal
Tota
l on
Han
d
1-A
ug0
00
2998
516
9331
678
074
00
7429
985
1619
3160
4
2-A
ug42
042
2985
117
5331
646
073
00
7329
893
1680
3157
3
3-A
ug10
752
1077
2978
217
9132
650
075
00
7530
859
1716
3257
5
4-A
ug22
00
220
2997
625
9932
795
174
00
7530
195
2525
3272
0
5-A
ug1
01
3014
725
7332
721
090
00
9030
148
2483
3263
1
6-A
ug17
40
174
2977
828
4332
805
010
30
010
329
962
2740
3270
2
7-A
ug82
082
2995
427
4832
784
071
00
7130
026
2687
3271
3
8-A
ug59
059
2999
427
1932
772
095
00
9530
053
2624
3267
7
9-A
ug32
90
329
2995
827
1933
006
495
210
120
3026
226
2432
886
10-A
ug3
03
3023
026
5632
889
085
01
8630
232
2571
3280
3
11-A
ug16
90
169
2998
426
1332
766
010
30
010
330
359
2510
3286
9
12-A
ug12
31
124
3035
925
1032
993
181
00
8230
439
2472
3291
1
13-A
ug4
04
3039
025
2132
915
010
90
211
130
390
2412
3280
4
14-A
ug55
055
3030
524
9932
859
011
40
011
430
360
2385
3274
5
15-A
ug16
016
3030
324
4032
759
012
0?
??
??
3263
9
16-A
ug4
04
3017
924
6032
643
010
7?
??
??
3253
6
17-A
ug22
022
3008
324
5332
558
111
4?
??
??
3244
3
18-A
ug17
017
3002
624
1732
460
088
??
??
?32
372
19-A
ug8
08
2993
924
3332
380
010
1?
??
??
3227
9
20-A
ug26
026
2986
424
1532
305
010
7?
??
??
3219
8
21-A
ug?
??
2982
823
7032
198
086
??
??
?32
112
22-A
ug13
00
130
2973
423
8032
244
512
20
012
729
859
2258
3211
7
23-A
ug99
099
2971
724
0032
216
012
70
012
729
816
2273
3208
9
24-A
ug27
027
2974
223
6532
134
910
20
011
129
760
2263
3202
3
25-A
ug29
029
2968
523
3532
052
198
011
110
2970
222
4031
942
26-A
ug16
20
162
2969
823
4432
204
010
30
711
029
753
2241
3194
4
27-A
ug3
03
2957
223
2231
997
293
10
9629
672
2229
3190
1
28-A
ug32
133
2959
723
0431
934
190
00
9129
629
2214
3184
3
29-A
ug80
080
2952
423
1831
922
210
5?
??
??
3181
5
30-A
ug48
048
2951
822
9731
863
395
??
??
?31
764
31-A
ug20
222
2945
323
1231
787
092
??
??
?31
693
* Gra
nd T
otal
incl
udes
“To
tal o
n H
and”
and
“D
ied”
Andersonville National Historic Site National Park ServiceU.S. Department of the Interior
Extension Activities
1. Students should imagine themselves as prisoners at Andersonville. Their job is to write a letter to Abraham Lincoln describing the conditions they are forced to live in and giving a detailed report of prisoner numbers (in the hospital, deaths per day, etc.) and living space (dimensions of the prison and square feet per prisoner) using the Consolidated Returns of the Month of August.
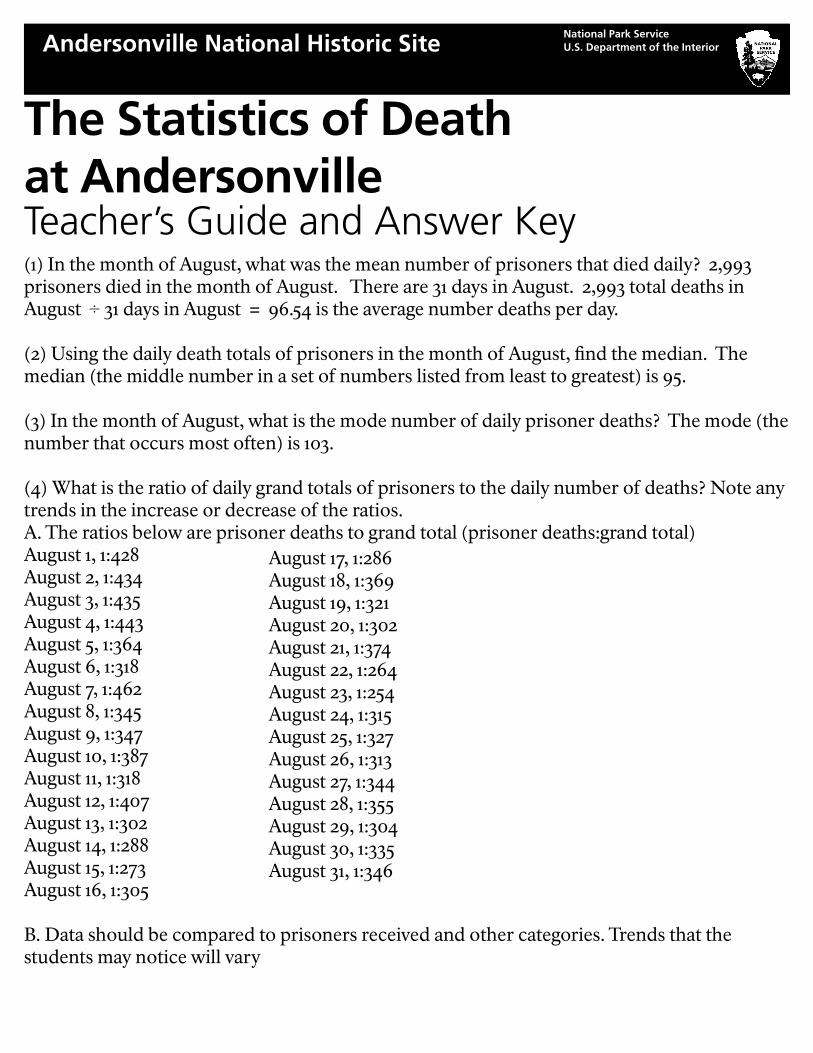
2. Angola prison in Louisiana (the largest maximum security in the United State) houses 5,000 inmates and occupies approximately 18,000 acres (not all of this acreage is used entirely for the prisoners). Andersonville held nearly 32,000 prisoners and occupied 26.5 acres. Calculate the two different prisoner-to-acre ratios and compare them.
President Abraham LincolnLibrary of Congress
Angola PrisonLuisiana Department of Corrections

Andersonville National Historic Site National Park ServiceU.S. Department of the Interior
The Size & Scale of AndersonvilleTeacher’s Guide & Answer Key
(1) How many prisoners died in the month of August? 2,993 died in the month of August
(2) What was the total square footage of the prison before it was expanded? And after? There are 43,560 square feet per 1 acre. 16 acres x 43,560 sq. ft. = 696,960 sq. ft. before the expansion 26.5 acres x 43,560 sq. ft. = 1,154,340 sq. ft. after the expansion
(3) What fraction of the total prison population tried to escape during August? What percent? 30 total prisoners tried to escape in August 34,760 is the total number of prisoners that lived at the prison during August. 30/34,760 is the fraction of the prison population that tried to escape. This fraction reduces to approximately 1/1,158. 30/34,760 expressed as a percentage is 0.0863% (less than 0.1% of all prisoners escaped)
(4) What fraction of escape attempts was successful? What percent? 30 escape attempts were made, and 6 were recaptured, meaning that 24/30 escapes of were successful. 26/30 is the fraction of escape attempts that were successful (13/15 if reduced). 26/30 expressed as a percentage is
Andersonville National Historic Site National Park ServiceU.S. Department of the Interior
The Statistics of Death at AndersonvilleTeacher’s Guide and Answer Key(1) In the month of August, what was the mean number of prisoners that died daily? 2,993 prisoners died in the month of August. There are 31 days in August. 2,993 total deaths in August ÷ 31 days in August = 96.54 is the average number deaths per day.
(2) Using the daily death totals of prisoners in the month of August, find the median. The median (the middle number in a set of numbers listed from least to greatest) is 95.
(3) In the month of August, what is the mode number of daily prisoner deaths? The mode (the number that occurs most often) is 103.
(4) What is the ratio of daily grand totals of prisoners to the daily number of deaths? Note any trends in the increase or decrease of the ratios. A. The ratios below are prisoner deaths to grand total (prisoner deaths:grand total)August 1, 1:428August 2, 1:434August 3, 1:435August 4, 1:443August 5, 1:364August 6, 1:318August 7, 1:462August 8, 1:345August 9, 1:347August 10, 1:387August 11, 1:318August 12, 1:407August 13, 1:302August 14, 1:288August 15, 1:273August 16, 1:305
B. Data should be compared to prisoners received and other categories. Trends that the students may notice will vary
August 17, 1:286August 18, 1:369August 19, 1:321August 20, 1:302August 21, 1:374August 22, 1:264August 23, 1:254August 24, 1:315August 25, 1:327August 26, 1:313August 27, 1:344August 28, 1:355August 29, 1:304August 30, 1:335August 31, 1:346

Andersonville National Historic Site National Park ServiceU.S. Department of the Interior
Analyzing the Data:Understanding Suffering at AndersonvilleTeacher’s Guide & Answer Key (p.1)1. What was the distance between the southwest corner and northeast corner of the prison?
a. The Pythagorean Theorem (a2 + b2 = c2) is used to solve this problem.b. The dimension of the stockade “rectangle” is 1,620 ft. x 779 ft. (a = length and b = width). c. 1,6202 + 7792 = c2d. 2,624,400 + 606,841 = c2e. 3,231,241 = c2f. c2 = 3,231,241g. c = √3,231,241h. c = 1797.57i. The distance between the two corners of the stockade was approximately 1798 feet.
2. If the total population of the prison increased by 10% on September 1st, what would the new population be? If on September 1st there was a prisoner uprising and the guards opened fire with rifles and cannons killing 25% of the prisoners and severely injuring 10% of those who were not immediately killed, then what would the new population be and how many prisoners would need medical attention? (Students will need to use the data from the daily returns, August 1864)
a. The total population of the prison on August 31st needs to be multiplied by 10%., giving 34,862 prisoners on September 1st.b. 25% of the population needs to be subtracted from the number found in step “a.” This will give the new population total. So 34,862 (prisoners September 1st) x 0.25 (the percent that was killed) = 8,716 (total prisoners that were killed). 34,862 (prisoners September 1st) - 8,716 (prisoners that were killed) = 26,146 (the new prison population). c. 10% of the population needs to be subtracted from the number found in step “b.” This will give you the number of prisoners that need medical attention. 26,146 (the new/remaining prison population) x 0.10 (the percent that were severely injured) = 2,615 prisoners severely injured and need medical attention.

Andersonville National Historic Site National Park ServiceU.S. Department of the Interior
Analyzing the Data:Understanding Suffering at AndersonvilleTeacher’s Guide & Answer Key (p.2)3. Assuming that each prisoner would have needed 48 square feet (the standard size of modern jail cells) to survive the month of August, what would the new dimensions of the prison need to be? Express your answer in square feet and acres. Use the number of prisoners on hand on August 1st found in the Consolidated Monthly Return to solve this problem. 1 acre = 43,560 square feet
a. The total population of the prison on August 1st needs to be multiplied by 48 square feet. 31,678 (prisoners on hand August 1st) x 48 sq. ft. per prisoner = 1,520,544 sq. ft. needed.
b. The available space INSIDE the deadline must be determined. The prison dimensions (taking into consideration that the prisoners could not occupy the space within the “dead line”) were 1,582 ft. (length) x 741 ft. (width) = 1,172,262 sq. ft. (space available inside the “dead line”).
c. The amount of additional space needed must be determined using the totals in step “a” and step “b.” 1,520,544 sq. ft. (total needed) - 1,172,262 sq. ft. (current space available) = 348,282 sq. ft. (additional space needed).
d. The value found in step “c” should be divided by the current width of the stockade inside the deadline. This will give the length that must be added. 348,282 sq. ft. (space needed) ÷ 741 ft. (the current width of the stockade rectangle inside the “dead line”) = ~470 ft. (needed to be added to the LENGTH of the stockade rectangle).
e. The current length of the stockade should be added to the value found in step “d.” This will give the total length of the prison that would be needed. 1,620 ft. (the current length of the stockade including “dead line” at both ends) + 470 ft. (length needed to be added) = 2,090 ft. (total length of the new, larger stockade). The new dimension of the prison stockade would be 2,090 ft. (length) by 779 ft. (width).
f. The new length multiplied by the old (or same) width will give the new total square footage. 7. 2,090 ft. - 38 ft. (for both “dead line” spaces) x 779 ft. - 38 ft. (“dead line”) = 1,520,532 sq. ft. of the 1,520,544 sq. ft. calculated as being needed.
g. The acre to square feet ratio needs to be used to determine acreage. There are 43,560 sq. ft. in an acre. 1,520,544 sq. ft. (amount of space needed) ÷ 43,560 (sq. ft. per acre) = 34.91 total acres occupied by the new stockade, with 8.41 of those acres added to the original 26.5 acres.

Andersonville National Historic Site National Park ServiceU.S. Department of the Interior
Analyzing the Data:Understanding Suffering at AndersonvilleTeacher’s Guide & Answer Key (p.3)4. If a particular virus infected the prison population and had a 100% mortality rate, then how many days would it take for 50% of the total population to die? Use the population of the prison as of August 31st and assume that no more prisoners are added to the population because of the virus outbreak. Also, assume that once a prisoner is contagious he has 24 hours to live and will infect exactly two more prisoners before death.
a. Divide the total number of prisoners on August 31st by two. This number represents 50% of the prison population. 1. 31,693 (prisoners on hand August 31st) x 0.50 = 15,847 (half the prison population as of August 31st).
b. Multiply 1 by 2. These numbers represent the host (the first person to be infected by the virus), and the two individuals that the host spreads the virus to. Keep multiplying by two (since each carrier infects exactly two more people before death) until you reach a number that is equal to, or more than, the number found in step “a.” 1 (the original virus host) x 2 (prisoners infected by host) = 2 (total infected after host dies). 2 (total infected at this point) x 2 (the number the infected will each infect) = 4 (total infected after the original two die). 4 (total infected at this point) x 2 (the number the infected will each infect) = 8 (total infected after the original 4 die). Continue to multiply by two (the number that each infected person will infect) until AT LEAST 15,847 (half the prison population) is reached.
c. Count the number of times you multiplied by two. Each time this is done represents one day. After multiplying by two 14 times you will reach 16,384. This is at least half the prison population.
d. Add 1 to the number found in step “c.” This represents the host and the 24 hour period that he was infected. 1 (the prisoner/host who lived for 24 hours) + 14 (the number of times multiplied by two) = 15 days it would have taken for the virus to wipe out at least half the prison population.