and - us epa 1977/qa vol iii... · either an orsat or other type of gas absorption analyzer . such...
TRANSCRIPT

Section N o . 3.2 Revision No. 0 Date January 15, 19ES Page 1 of 8
Section 3.2
METHOD 3 - DETERMINATION OF CARBON DIOXIDE, OXYGEN, EXCESS AIR, AND DRY MOLECULAR WEIGHT
OUTLINE
-I Section
SUMMARY METHOD HIGHLIGHTS METHOD DESCRIPTION
1. PROCUREMENT OF APPARATUS AND SUPPLIES
2. 3. 4. 5. 6 .
7. 8 .
9 .
CALIBRATION OF APPARATUS PRESAMPLING OPERATIONS ON-SITE MEASUREMENTS POSTSAMPLING OPERATIONS CALCULATIONS MAINTENANCE AUDITING PROCEDURE RECOMMENDED STANDARDS FOR ESTABLISHING TRACEABILITY
I. REFERENCE METHOD
11. REFERENCES 12. DATA FORMS
N u m b e r
Documentation of Pages
3.2 3.2
2
5
3.2.i 15 3.2-2 4 3.2.3 6 3.2.4 12 3.2.5 2 3.2.6 3 3.2.7 1
3.2.8 5
3.2.9 1 3.2.10 3
3.2.11 1 3.2.12 6

Sect ion N o . 3 . 2 Rev i s ion N o . C. Date January 1 5 , 155: Page 2 of 8
SUMMARY
I n t h i s procedure, a gas sample is ex t r ac t ed from E stack by one of t he following methods: s ing le-poin t grab saiz=,ling; s ingle-point i n t eg ra t ed sampling; o r mult ipoint i n t e c r a t e d sampling. The gas sample i s then analyzed f o r carbon cioxice (COz), oxygen ( 0 2 ) , and i f necessary carbon monoxide ( C O ) .
Depending on t h e desired accuracy of t h e subsequent a n a l y s i s , e i t h e r an Orsat o r o ther type of gas absorption analyzer such 2s
a Fyr i t e analyzer may be used f o r t h e ana lys i s . '
This method i s used f o r determining C 0 2 and O2 concentra- t i o n s >0.2% by volume and for ca lcu la t ing excess a i r and =be dry molecular weight of gas streams from combustion processes. The method may a l s o be appl icable t o o the r processes where I t has been determined t h a t compounds o the r than C02, 02, CO, anci n i t rc - gen (N2) a re n o t present i n concentrations s u f f i c i e n t t o a f f e c r the results. Sulfur dioxide (So2), f o r example, can a f f e c t CC2 readings s ince it would be absorbed with the C 0 2 -
Other methods and modifications t o measure these c o n s t i - t u e n t s include: a mult ipoint sampling method using ar- 0rsE.t apparatus t o d i r e c t l y analyze ind iv idua l grab samples obtzined E t
each point ; ass igning a value of 30.0 fo r dry molecular weight, i n l i e u of a c t u a l measurements for processes burning n a t u r a l g e s , coal , o r o i l ; or a method using C02 or O2 and s to i ch iomet r i c cal- cu la t ions t o determine dry molecular weight and excess a i r . These methods and modifications may be used, b u t are suhject zo
t h e approval of the adminis t ra tor , U. s . Environmental P ro rec t i cn Agency.
The Method Description which follows is based on =he lie- ference Method promulgated on August 18, 1977. A compleze cczr
- .
+
4- Mention of t r a d e names o r s p e c i f i c products does n o t cor -s t i tu rc endorsement by the Environmental Protect ion Agency.

Section N o . 3 .2 Revision N o . 0 Date January 15, 1980 Page 5 of 8
respec t ive ly , with diameters (0.61 m ( 2 4 i n . ) . A minimum of 1 2 t r ave r se poin ts s h a l l be used f o r a l l o ther cases . The sampling run must be simultaneous w i t h and f o r the same t o t a l l e n g t h of t i m e a s t he p o l l u t a n t emission r a t e determination. The Orsat analyzer must. be l eak checked before and a f t e r t h e a n a l y s i s . When analyzing l o w concentrations of cO2 ((4.0%) o r high concen- t r a t i o n s of O2 (>15.0%), the measuring b u r e t t e of the Orsat must have a t l e a s t 0.1% subdivis ions. The sample must be analyzed within 4 h of collection.
The Method Highl ights checkl i s t a t t he end of t h i s s e c t i o n may be removed from the Handbook and used i n p r e t e s t , t es t , and. p o s t t e s t operat ions. Each form has a s u b t i t l e ( i . e . , Method 3 ,
F i g u r e 3 .1) t o a i d the user i n f inding a s i m i l a r f i l l e d - i n form i n t h e Method Descr ipt ion. Each i t e m on t h e checkl i s t t h a t can cause s i g n i f i c a n t e r r o r s a re designated w i t h an a s t e r i s k . Most of t he Method Descr ipt ion and forms a r e designed f o r u s e in ca lcu la t ing excess a i r cor rec t ions , and the re fo re conta in many more cont ro ls than would be required f o r molecular weight determination only. 1. Procurement of Equijment
Section 3.2.1 (Procurement of Apparatus and Supplies ) gives the s p e c i f i c a t i o n s , c r i t e r i a , and design f ea tu res of t h e equip- ment and mater ia l s required t o perform Method 3 tes ts . This sub- sec t ion i s designed t o provide the tes ter w i t h a guide €or t h e procurement and i n i t i a l check of equipment and suppl.ies. The activity matrix (Table 1.1) a t the end of Section 3.2.1 can be used as a quick re ference , and i s a summary of t h e corresponding wr i t t en desc r ip t ions . 2 . Pretest Preparat ions ~-
Section 3.2.2 (Cal ibra t ion o f Appara tus ) provides a step-by- s t e p desc r ip t ion of the recommended c a l i b r a t i o n procedure f o r t h e Orsat analyzer and t h e flow ra te meter.
S e c t i o n 3.2.3 (Presampling Operations) provides the tester with a guide f o r suppl ies and equipment prepara t ion for f i e l d

Section No. 3.2 Revision No. 0 Date January 15, 1980 Page 4 of 8
METHOD HIGHLIGHTS
Specifications described in this method (Section 3 . 2 ) are for determining excess air and dry molecular weight of gas streams from fossil-fuel combustion processes. This method may also be applicable to other processes where it has been deter- mined that compounds other than co2, 02, CO, and N2 are not present in sufficient concentrations to affect the results. A
gas sample is extracted from a stack by one of the following methods: (1) single-point grab sampling; (2) single-point in- tegrated sampling; or ( 3 ) multipoint integrated sampling. The gas sample is analyzed for percent C02 ' percent 02, and if necessary percent CO.
Determination of dry molecular weight can be made using either an Orsat or Fyritel analyzer and any of the three sampling methods listed above. When using the single-point grab sampling or single-point integrated sampling methods, the sampling point should either be at the centroid of the cross section or at a
point >1.00 m ( 3 . 3 ft) from the stack wall, unless otherwise specified by the administrator. The sample collected for molec- ular weight determination must be analyzed within 8 h of collec- tion.
Excess air or emission rate correction factors must be determined using an Orsat analyzer and the sample collection pro- cedure specified in the applicable subpart of the standard. When using the single-point grab or single-point integrated sampling method, the sampling point should be located as specified above for molecular weight determinations. When using the multipoint integrated sampling method, a minimum of eight and nine traverse points should be used for circular and rectangular stacks,
'Mention of trade names or specific products does not constitute - . endorsement by the Environmental Protection Agency.

Section No. 3.2 Revision No. 0 Date January 15, 1980 Page 5 of 8
respectively, with diameters traverse points shall be usec
(0.61 m for a 1
(24 in.). A minimum of 12 other cases. The sampling
run must be simultaneous with and for the same total length of time as the pollutant emission rate determination. The Orsat analyzer must be leak checked before and after the analysis. When analyzing low concentrations of C02 ((4.0%) or high concen- trations of O2 (>15.0%), the measuring burette of the Orsat must have at least 0.1% subdivisions. The sample must be analyzed within 4 h of collection.
The Method Highlights checklist at the end of this section may be removed from the Handbook and used in pretest, test, and posttest operations. Each form has a subtitle (1.e. , Method 3 ,
Figure 3.1) to aid the user in finding a similar filled-in form in the Method Description. Each item on the checklist that can cause significant errors are designated with an asterisk. Most of the Method Description and forms are designed for use in calculating excess air corrections, and therefore contain many more controls than would be required for molecular weight determination only. 1. Procurement of Equipment
Section 3.2.1 (Procurement of Apparatus and Supplies) gives the specifications, criteria, and design features of the equip- ment and materials required to perform Method 3 tests. This sub- section is designed to provide the tester with a guide f o r the procurement and initial check of equipment and supplies. The activity matrix (Table 1.1) at the end of Section 3.2.1 can be used as a quick reference, and is a summary of the corresponding written descriptions. 2. Pretest Preparations
Section 3.2.2 (Calibration of Apparatus) provides a step-by- step description of the recommended calibration procedure for the Orsat analyzer and the flow rate meter.
Section 3.2.3 (Presampling Operations) provides the tester with a guide for supplies and equipment preparation f o r f i e l d

Section No. 3.2 Revision No. 0 Date January 15, 1980 Page 6 of 8
tests. The method for packing and the description of packing containers should help protect the equipment but are not required. 3 . On-site Measurements
Section 3.2.4 (On-site Measurements) contains procedures for sampling and analysis. Subsection 4.1 outlines the step-by-step procedure f o r determination of dry molecular weight. Subsection 4.2 outlines the step-by-step procedure for determination of excess air and emission rate correction factor. Subsection 4.3 includes a list of precautions that will aid in using the Orsat analyzer and improve the validity of the results. 4. Posttest Operations
Section 3.2.5 (Postsampling Operations) outlines a data comparison procedure which will allow detection of gross measure- ment error. A visual inspection procedure is also included to detect any change in the sampling and analysis apparatus that could have adversely affected the measured values.
Section 3.2.6 (Calculations) provides the tester with the required equations and nomenclature for calculating percent excess air and dry molecular weight.
Section 3.2.7 (Maintenance) outlines the necessary equipment maintenance which will help ensure high quality data. 5. Auditinq Procedure
Section 3.2.8 (Auditing Procedure) provides a description of necessary activities for conducting performance and system audits. The performance audit of the analytical phase can be conducted using certified gas samples. Auditing procedures for the analytical, data processing, and systems phases are de- scribed in this section. A checklist for a systems audit is a l s o included in this section.
Section 3.2.9 (Recommended Standards for Establishing Trace- ability) recommends the primary standards €or use in assessing the accuracy of test data. 6 . References
Sections 3.2.10 and 3.2.11 contain t h e Reference Method and the suggested references.

Apparatus check
Probe type: Borosilicate glass Stainless steel Other
Filter In-s tack Out- stack- G1 as s woo 1- Other -
I
pump One-way squeeze Di aphram Other Leak checked *
Condenser T m e
Flexible Bag Tedlar Mylar Teflon Other Leak checked*
Pressure Gauqe Type
Analyzer Orsat Fyrite Other Leak
Spare checked*
reagents
*Most significant
PRETEST PREPARATIONS (Method 3 , Figure 3 ,
Section No. 3.2 Revision No. 0 Date January 15, 1980 Page 7 of 8
Re Yes
-i
d y No
Loaded and packed Yes 1 No
L

Section N o . 3 . 2 Revision N o . 0 Date January 15 , 1980 Page 8 o f 8
ON-SITE MEASUREMENTS CHECKLIST (Method 3 , Figure 4 .1 )
S amp 1 inq Method: s ing le-poin t grab single-point i n t eg ra t ed
I s a f i l t e r used t o remove p a r t i c u l a t e matter? *Sampling t r a i n leak checked? *Orsat analyzer leak checked?
Sampling p o r t p roper ly sealed?
mult ipoint i n t eg ra t ed
A l l connections t i g h t and leak f r ee? -
Sampling r a t e held constant? - Sampling t r a i n purged? .-
Analysis Molecular Weight Determination Analyzer: Orsat Fyr i te Other Fyri t e : Reagent a t proper l e v e l and zeroed?" Leak-free connection between analyzer and sample l i n e ? Sampling l i n e purged?* Orsat:
Reagents a t proper l eve l?* -
Sample ana lyzedwi th in 8 h?* ---
Analyzer l e v e l ? Leak checked?*
Sample l i n e s purged?* Excess Air-Emission Rate Correction Orsat analyzer leak checked?* Before After Reagents a t proper l eve l?* Sampling l i n e s purged?* Analysis repeated by drawing a new sample until. t he following criteria are met?
C02 - any t h r e e analyses d i f f e r by a ) (0.3% when C02 24.0%
0, - any t h r e e analyses d i f f e r b y
b ) - 7 0 . 2 % when C 0 2 54.0% -_
a ) <0.3% when O2 (15.0% b ) 70.2% - when O2 I >15.0%
L.
CO - any t h r e e analyses d i f f e r by 50.3%
A l l readings averaged and reported t o neares t 0.1% -
*Most s i g n i f i c a n t items/parameters t o be checked.

Section No. 3.2.1 Revision No. 0 Date January 15, 1980 Page 1 of 15
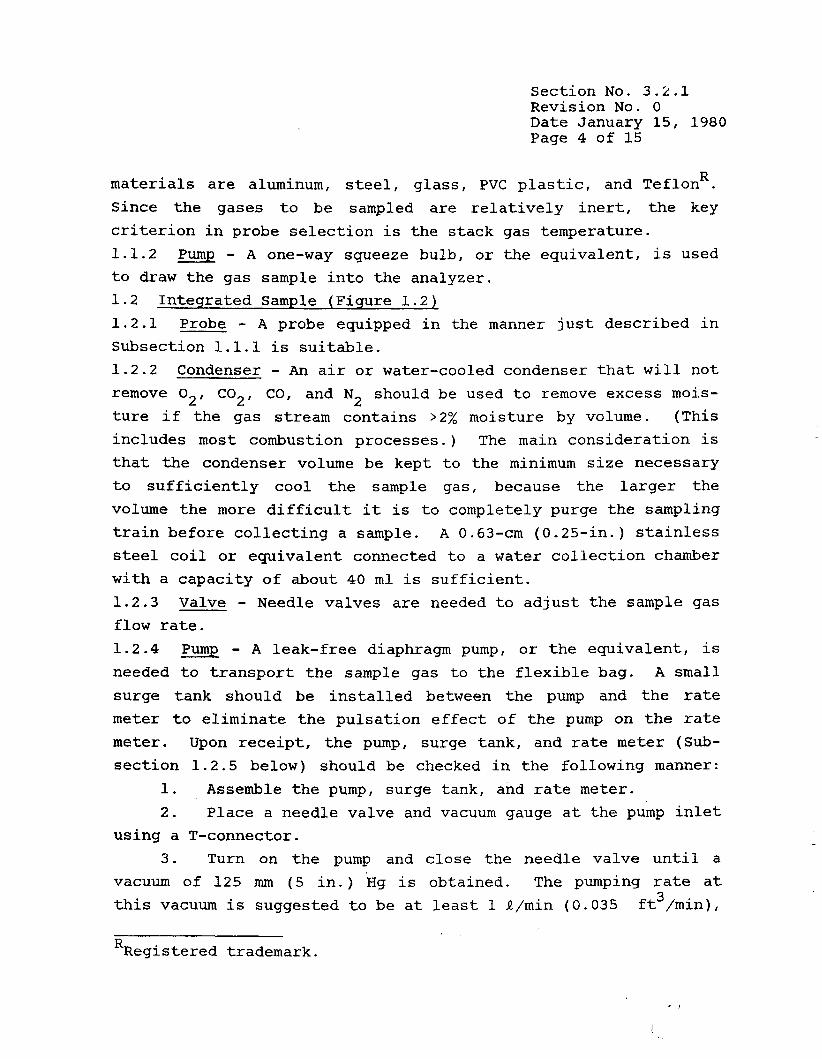
1.0 PROCUREMENT OF APPARATUS AND SUPPLIES Diagrams of the sampling trains used in the method are shown
in Figures 1.1 and 1.2. Specifications, criteria, and/or appli- cable design features are given in this section to aid in t h e
selection of equipment to assure the collection of good quality data. Procedures and, where applicable, limits for acceptance checks are given. During the procurement of equipment and sup- plies, it is suggested that a procurement log be used to record the descriptive title of equipment, the identification number (if applicable), and the results of acceptance checks. An example
' procurement log is shown in Figure 1.3; a blank form is given in Section 3.2.12 for the user. If calibration data are required as part of the acceptance check, the data should be recorded in a calibration log. Table 1.1 at the end of this section contains a summary of the quality assurance activities for procurement and acceptance of apparatus and supplies.
As alternatives to the sampling systems described herein, others (e.g., liquid displacement) may be used if they are capa- ble of obtaining a representative sample, maintaining a constant sampling rate, and yielding acceptable results. U s e of such systems is subject to the approval of the administrator. 1.1 Grab Sample (Figure 1.1) 1.1.1 Probe - The probe or probe liner should be made of stain- less steel or borosilicate glass tubing and should be equipped with an in-stack (preferred) or an out-stack filter to remove particulate matter. A plug of glass wool is generally a satis- factory filter. The probe tip should be designed to prevent the glass-wool filter from being drawn from the probe when sampling a
source that has a substantial negative pressure. Any material inert to 02, C02, CO, and N2 and resistant to temperature at the sampling conditions may be used for the probe; examples of such

Section N o . 3 . 2 . 1 Revision No . 0 Date January 15, 1 9 8 0 Page 2 of 15
FLEXIBLE TUBING JE FILTER (GLASS WOOL)
SQUEEZE BULB '
Figure 1.1 G r a b sampling t r a i n .
RATE METER . f F
b
F i g u r e 1.2 Integrated gas sampling train.

Section No. 3.2.1
Revision No. 0
Date January
15, 1980
Page 3 of 15
J
\
meter. section
1. 2.
using a 3.
Section No. 3.2.1 Revision No. 0 Date January 15, 1980 Page 4 of 15
R materials are aluminum, steel, glass, PVC plastic, and Teflon . Since the gases to be sampled are relatively inert, the key criterion in probe selection is the stack gas temperature. 1.1.2 Pump - A one-way squeeze bulb, or the equivalent, is used to draw the gas sample into the analyzer. 1.2 Integrated Sample (Figure 1.2) 1.2.1 Probe - A probe equipped in the manner just described i n Subsection 1.1.1 is suitable. 1.2.2 Condenser - An air or water-cooled condenser that will not remove 0 2, COz, CO, and N2 should be used to remove excess mois- ture if the gas stream contains >2% moisture by volume. (This includes most combustion processes.) The main consideration is that the condenser volume be kept to the minimum size necessary to sufficiently cool the sample gas, because the larger the volume the more difficult it is to completely purge the sampling train before collecting a sample. A 0.63-cm (0.25-in.) stainless steel coil or equivalent connected to a water collection chamber with a capacity of about 40 ml is sufficient. 1.2.3 Valve - Needle valves are needed to adjust the sample gas flow rate. 1.2.4 Pump - A leak-free diaphragm pump, or the equivalent, is needed to transport the sample gas to the flexible bag. A small surge tank should be installed between the pump and the rate meter to eliminate the pulsation effect of the pump on the rate
Upon receipt, the pump, surge tank, and rate meter (Sub-
1.2.5 below) should be checked in the following manner: Assemble the pump, surge t ank , and rate meter. Place a needle valve and vacuum gauge at the pump inlet
Turn on the pump and close the needle valve until a T-connector.
vacuum of 125 mm (5 in.) Hg is obtained. The pumping rate at this vacuum is suggested to be at least 1 Q/min (0.035 ft3/min),
RRegistered trademark.
Section N o . 3.2.1 Revision N o . 0 Date January 15 , 1 9 8 0 Page 5 o f 15
and the r a t e meter when the flow i s adjusted between 0 . 5 and 1 . 0 2/min ( 0 . 0 1 8 and 0 .035 f t /min) should y i e ld steady readings.
If the pump capac i ty is i n s u f f i c i e n t , r e p a i r , rep lace , o r re turn it t o t h e manufacturer. I f rotameter readings f l u c t u a t e >2% of the f u l l - s c a l e reading, u s e a l a r g e r surge tank. Be s u r e t h a t the rotameter i s c l e a n and dry. 1 . 2 . 5 Rate Meter - A rotameter o r an equivalent r a t e meter, capable of measuring flow r a t e s w i t h i n f2% of t h e selected flow r a t e should be used.
The c a l i b r a t i o n curve (Figure 1 . 4 ) supplied by t h e manufac- t u r e r should be checked by comparing the rotameter readings against t h e w e t t e s t meter readings. I f the rotameter i s no t within *5% of t h e manufacturer 's c a l i b r a t i o n curve, r e c a l i b r a t e and construct a new curve.
Changes i n sample gas pressure , densi ty , and v i s c o s i t y w i l l a f f e c t the sampling r a t e . However, s ince sampling i s performed a t a constant r a t e and s i n c e t h e t o t a l volume sampled need n o t be
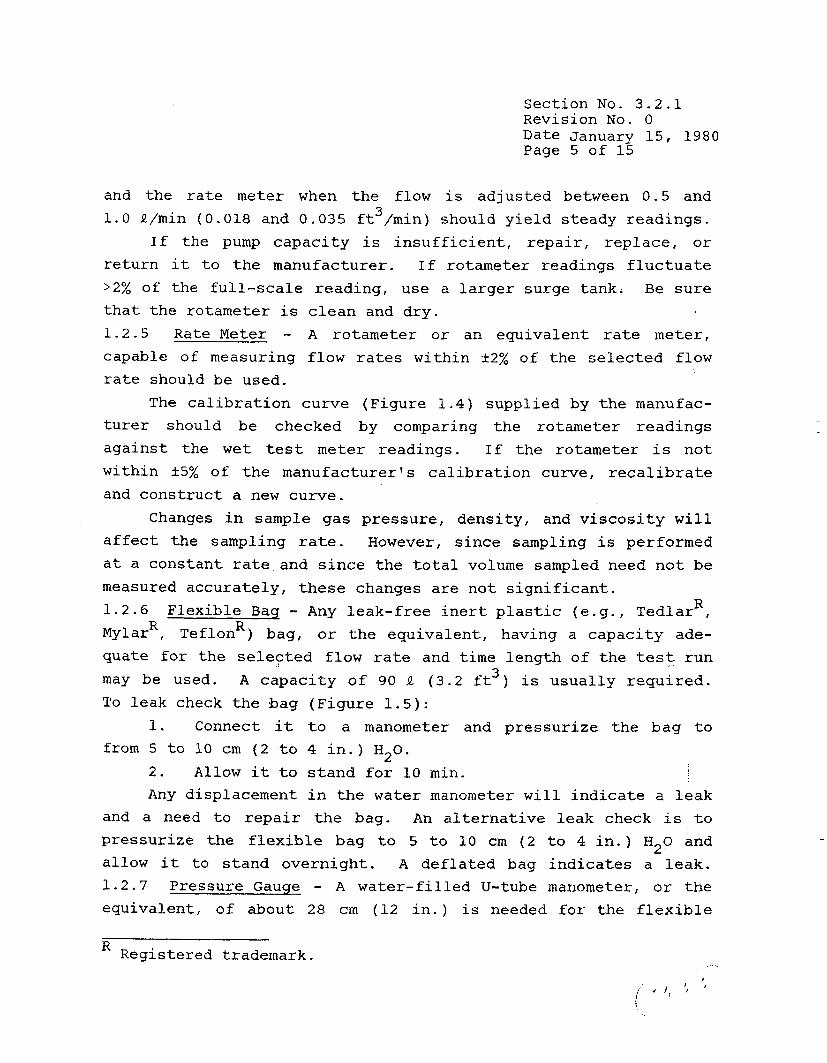
measured accurately, t h e s e changes a re not s i g n i f i c a n t . 1.2.6 F l e x i b l e Baq - Any leak- f ree i n e r t p l a s t i c ( e . g . , Tedlar , Mylar , Teflon ) bag, o r t h e equivalent , having a capac i ty ade- quate fo r t he selected flow r a t e and t i m e length o f the t e s t run may be used. A capac i ty of 90 2 ( 3 . 2 f t ) is usua l ly requi red . To leak check t h e bag ( F i g u r e 1-5):
1. Connect it t o a manometer and pressur ize t h e bag t o from 5 t o 10 c m ( 2 t o 4 i n . ) H20.
2 . Allow it t o s t and f o r 10 min. Any displacement i n t h e water manometer w i l l i nd ica t e a l eak
and a need t o r e p a i r t h e bag. An a l t e r n a t i v e leak check i s t o pressurize the f l e x i b l e bag t o 5 t o 1 0 c m ( 2 t o 4 i n . ) H20 and allow it t o s tand overnight . A def la ted bag ind ica t e s a leak. 1 . 2 . 7 P r e s s u r e Gauqe - A water - f i l l ed IJ-tube manometer, o r t h e equivalent, of about 28 c m ( 1 2 i n . 1 i s needed f o r t he f l e x i b l e
3
R R R
3
_.. Registered trademark.

0 0
c
Sectio
n No.
3.2.1 Revision No.
0 D
ate Janu
ary 15,
1980 Page
6 of 15
Ln
0
Ln
3N I ow
31V3S
0
k

MANOMETER pll
TO A I R PRESSURE
SOURCE ---L
VALVE M [ J I N E R T P L A S T I L unu
Figure 1.5 Plastic bag leak-check system.

Section N o . 3 .2 .1 Revision No. 0 Date January 15, 1 9 8 0 Page 8 of 1 5
bag leak check. follows:
The gauge should be leak checked upon r e c e i p t a s
1. 2 . Apply a p o s i t i v e pressure of from 5 t o 1 0 c m ( 2 t o
4 i n . ) H20 on the gauge by blowing on and then pinching of f t h e tube. The pressure reading should remain s t ab le f o r 1 0 min.
3 . I f a de f l ec t ion i s noted, r e p a i r , replace, o r r e tu rn t h e
gauge t o the manufacturer. 1.2.8 Vacuum Gauge - A mercury manometer, o r the equivalent , of a t l e a s t 760 mm ( 3 0 i n . ) Hg i s needed f o r t h e sampling t r a i n l eak check. I f a mercury manometer i s used, leak check the system by pu l l ing a 380 mm (15 i n . ) Hg vacuum on the gauge and then pinch- ing o f f t h e tube. N o de f l ec t ion should be noted i n the reading over a 10-min period. I f another type of gauge i s used, compare the gauge reading with a mercury manometer reading a t about 380 mm (15 i n . ) Hg. The gauge reading should be within f25 mm (1 i n . ) Hg of t h e mercury manometer reading. I f the gauge f a i l s the leak check o r t h e comparison with the mercury manometer, r e p a i r , replace, o r r e t u r n t h e manometer t o the manufacturer. 1 .3 Analyzer
An Orsat o r a s i m i l a r absorption type analyzer i s requi red fo r measuring cons t i t uen t s of combustion gases. The l a t t e r i s used only f o r molecular weight determinations, s ince it i s less
Place a f l e x i b l e tube on the gauge opening.
Check each s i d e of the gauge separa te ly .
1 .3 .1 Orsat Gas Analyzer - The Orsat analyzer 6 , 7 is used t o determine the C02, 02, and CO s t ack gas concentrations. A sample i s analyzed by successively passing it through absorbents t h a t remove s p e c i f i c gaseous components. The difference i n gas volume before and a f t e r t h e absorption represents t h e amount o f t he con- s t i t u e n t gas in t he sample. Constant pressure and temperature must be maintained throughout t h e ana lys i s . R e s u l t s a r e repor ted as dry volume percentages.
The Orsat analyzer i l l u s t r a t e d i n Figure 1 . 6 includes a g lass bu re t t e t o accura te ly measure the gas volume, a water
" 1 .

SAMPLE cl INLET
SIDE VIEW OF TYPICAL PIPETTE ABSORBER
Section No. 3.2.1 Revision No. 0 Date January 15, 1980 Page 9 of 15
THREE-WAY INLET VALVE TO MNIFOLD
INLET VALVE TO CO PIPE?TE
INLET VALVE TO O2 PIPETTE
co IPETTI
70 ml VOLUME
VOLUME
NARK K E F E R E N C E
/ATER JACKET
FLEXIBLE
Figure 1.6 Orsat apparatus.
Section No. 3 . 2 . 1 Revision N o . 0 Date January 15, 1 9 8 0 Page 1 0 of 15
jacke t t o maintain cons tan t temperature, a manifold t o con t ro l the gas flow, th ree absorpt ion p i p e t t e s (CO, 02, and C O z ) , rubber expansion bags, and a l i q u i d - f i l l e d leve l ing b o t t l e t o move t h e gases. The apparatus i s usua l ly assembled ins ide a case t h a t has f r o n t and r e a r doors and a car ry ing handle.
For expected C02 readings >4.0%, a standard Orsat analyzer containing a b u r e t t e w i t h 0.2-ml div is ions and spacings between divis ions of about 1 mm (0 .04 i n . ) i s s a t i s f a c t o r y . For lower C 0 2 values o r f o r O2 values >15%, an analyzer equipped wi th a bu re t t e having 0 . 1 - m l d iv i s ions w i t h spacings o f - >1 mm (0.04 i n . ) should be used.
Upon r e c e i p t of t h e analyzer, wash and dry a l l components and assemble t h e apparatus according t o the manufacturer's i n - s t ruc t ions . Then properly l u b r i c a t e a l l g lass valves w i t h s i l i - cone stopcock lub r i can t . I f t he apparatus i s t o be used prompt- l y , add the l i q u i d reagents and check f o r leaks as follows:
1. Allow t h e apparatus t o reach ambient temperature wi th the manifold valve open and t h e three p i p e t t e valves closed.
2 . Bring the l i q u i d i n each absorption p i p e t t e up t o t h e reference mark by opening t h e p i p e t t e valves one a t a t i m e and by slowly lowering t h e l e v e l i n g b o t t l e . Pinch o f f t h e rubber tube t o t h e leve l ing b o t t l e with t h e heel of t he hand t o quickly stop l i q u i d flow.
3 . Displace the ind ica t ing f l u i d u n t i l a reading is ob- ta ined i n t h e narrow p a r t of t h e bu re t t e , and quickly close t h e manifold i n l e t valve.
Place the l eve l ing b o t t l e on top o f t he Orsat case, and read the meniscus i n t h e b u r e t t e .
Close t h e p i p e t t e valves.
4.
5 . Wait change of - >0.2
which must be c a p i l l a r y tube p ipe t t e .
a t l e a s t 4 min; then read the meniscus again. A
ml i n the reading ind ica tes a leak i n the system repaired. A drop i n reagent l eve l t o below t h e
over a 4-min per iod ind ica tes a l eak i n t h a t
. . ' I - ,
Section N o . 3 . 2 . 1 Revision N o . 0 Date January 15 , 1980 Page 11 of 15
I f leaks a r e detected, c o r r e c t them so t h a t t h e above cr i - t e r i a w i l l be m e t .
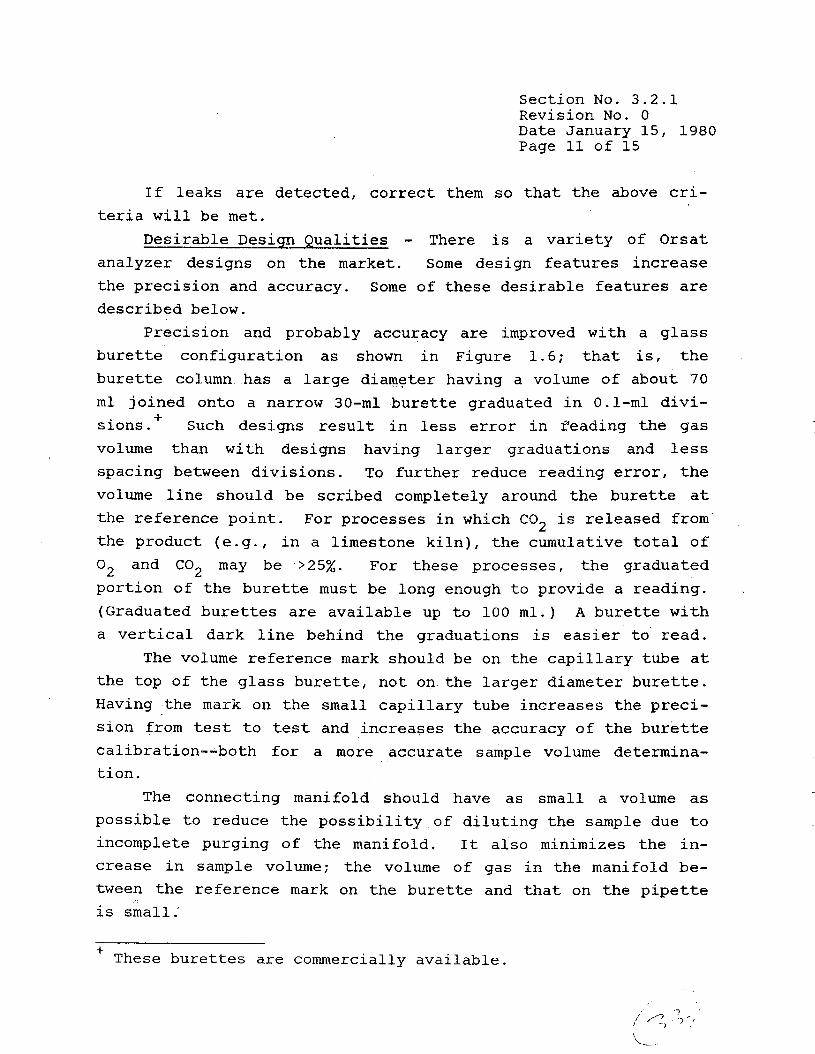
Desirable Design Qua l i t i e s - There i s a v a r i e t y of Orsa t analyzer designs on t h e market. Some design f ea tu res inc rease t h e p rec i s ion and accuracy. Some of these des i r ab le f ea tu res are described below.
Prec is ion and probably accuracy a r e improved w i t h a g l a s s b u r e t t e configurat ion a s shown i n Figure 1 .6 ; t h a t i s , t he
b u r e t t e column has a l a rge diameter having a volume of about 70
m l jo ined onto a narrow 3 0 - m l b u r e t t e graduated i n 0 . 1 - m l d iv i -
s ions . Such designs r e s u l t i n less e r r o r i n feading the gas volume than w i t h designs having l a r g e r graduations and less spacing between d iv i s ions . To f u r t h e r reduce reading e r r o r , the volume l i n e should be scribed completely around t h e b u r e t t e a t t h e reference po in t . For processes i n which C 0 2 i s re leased from t h e product ( e - g . , i n a limestone k i l n ) , the cumulative t o t a l of O2 and C02 may be >25%. For these processes, t h e graduated por t ion of the b u r e t t e must be long enough t o provide a reading. (Graduated b u r e t t e s a r e ava i l ab le up t o 100 m l . ) A b u r e t t e w i t h a v e r t i c a l dark l i n e behind t h e graduations i s e a s i e r t o read .
The volume reference mark should be on t h e c a p i l l a r y tube a t the top of t h e g l a s s b u r e t t e , no t on t h e l a r g e r diameter b u r e t t e . Having t h e mark on the small c a p i l l a r y t u b e increases the p r e c i - s ion from t e s t t o tes t and increases t h e accuracy of the b u r e t t e ca l ibra t ion- -both f o r a more accurate sample volume determina- t i o n .
The connecting manifold should have as small a volume as poss ib l e t o reduce t h e p o s s i b i l i t y o f d i l u t i n g t h e sample due t o incomplete purging of t he manifold. I t a l s o minimizes the i n - crease i n sample volume; t h e volume of gas i n t h e manifold be- tween the reference mark on the b u r e t t e and t h a t on t h e p i p e t t e
+
i s small.'
~~ + These b u r e t t e s are commercially ava i l ab le .

Section No. 3.2.1 Revision No. 0 Date January 15, 1980 Page 12 of 15
The Orsat apparatus and case should be designed so that a e leveling bottle and the glass burette can be viewed side by side when leveling the liquid. The liquid levels in both the burette and the bottle must be at the same height when reading t h e
volumes; otherwise, the sample gas will not be at atmospheric pressure.
The inlet manifold valve should be three-way to allow purg- ing of the manifold without causing the sample bag or the inlet gas to be diluted by ambient air.
Reagents - Four reagents are required by a standard Orsat apparatus for analyzing flue gas. These are the gas-confining solution, the C02 absorbent, the O2 absorbent, and t h e CO absorb- ent. Due to the solubility of C02 in water, a colored aqueous acidic salt solution is used as the confining solution; it con- tains sodium sulfate, sulfuric acid, and methyl orange. The C02 absorbent is a solution of potassium or sodium hydroxide, and the O2 absorbent is a solution of alkaline pyrogallic acid or chromous chloride. The CO absorbent is usually a cuprous
6 chloride or sulfate solution, but other solutions may be used. All of these solutions can be purchased from most chemical sup- pliers. Note the shelf-life requirements, since some reagents deteriorate with time. 1.3.2 Other Absorption Type Analyzers - Absorption type analyzers which determine Co2 or O2 concentrations are a l s o available. These devices are simpler and easier to use than an Orsat, and they are more rugged. However, they provide less precision and can thus be used only for molecular weight determi- nations of the gases. These devices operate similarly to the Orsat by absorbing the gas in a colored solution; then the volume absorbed is read directly on a scale as percentage by volume. A commonly used O2 analyzer is shown in Figure 1.7. The use of continuous monitors for determining O2 content must be approved by the administrator.

Section No. 3.2.1 Revision No. 0 Date January 15, 1980 Page 13 of 15
ONE-WAY SQUEEZE BULB
GAS ABSORBER
PROBE
Figure 1.7 Absorption type analyzer.

Section No. 3 . 2 . 1 Revision No. 0 Date January 15, 1980 Page 14 of 15
Table 1.1 ACTIVITY MATRIX FOR PROCUREMENT OF APPARATUS AND SUPPLIES
~ ~~
C h a r a c t e r i s t i c s
Ac t ion i f r equ i r emen t s a r e n o t met
Frequency and method of measurement Acceptance l imi t s
Grab Sampling T r a i n
Probe S t a i n l e s s s t e e l , boro- s i l i c a t e g l - a s s , o r e q u i v a l e n t ; n o t damaged o r c o r r o d e d ; no l e a k a g e
V i s u a l o b s e r v a t i o n upon r e c e i p t
D i sca rd o r r e t u r n d e f e c - t i v e equipment t o s u p p l i e r , a s a p p r o p r i a t e
Pump One-way squeeze bu lb o r e q u i v a l e n t ; n o t damaged o r co r roded
A s above , p l u s manual o p e r a t i n g check
A s above
I n t e g r a t e d Gas Sampling T r a i n
Probe S t a i n l e s s s t e e l , bo ro - s i l i c a t e g l a s s , o r e q u i v a l e n t ; no l e a k a g e
A s above As above
A i r - coo led condenser
A s above A s above No l e a k a g e ; keep t h e condenser volume t o a minimum n e c e s s a r y t o coo l t h e sample w i t h a i r
Needle v a l v e - -
A s above Valve A s above
Diaphragm t y p e , l e a k f r e , and 1 Q/min (0.03: f t /rnin) capacity 5
Check f o r l e a k s and c a p a c i t y upon r e c e i p t
A s above
R a t e meter ( r o t a m e t e r )
Check f low range from 0 t o 1 Q4min ( 0 t o 0.035 f t /min) must be a c c u r a t e t o w i t h i n t2% of s e l e c t e d f low r a t e
Check upon r e c e i p t f o r damage; c a l i b r a t e a g a i n s t WTM
R e c a l i b r a t e and c o n s t r u c t new c a l i b r a t i o n cu rve
F l e x i b l e bag C a p a c i t y of 55 t o 90 Q ( 1 . 9 t o 3 .2 f t ) ; 1.eak t e s t n o t mandaotry
3 Check f o r l e a k s and capacity
Retu rn t o supp l i e r
( con t inued)

C h a r a c t e r i s t i c s
Section No. 3.2.1 Revision N o . 0 Date January 1 5 , 1980 Page 15 of 15
Acceptance l i m i t s of measurement a r e n o t met
V i s u a l l y check f o r damage and l e a k s
P r e s s u r e gauge
A s above
Vacuum gauge
O r s a t Analyzer
Glass b u r e t t e
28-cm ( 1 2 - i n . ) wa te r - f i l l e d U-tube o r equ iv - a l e n t f o r f l e x i b l e bag l e a k check
A t l e a s t 760-mm ( 3 0 - i n . ) Hg gauge f o r t h e sam- sampl ing t r a i n l e a k check
0.1-ml d i v i s i o n s w i t h s p a c i n g s of a b o u t l m m
V i s u a l l y obse rve
Check a g a i n s t a cury U-tube manometer and l e a k check
l e a k check upon r e c e i p t
V i s u a l l y i n s p e c t upon r e c e i p t
R e t u r n t o s u p p l i e r
P i p e t t e s , mani- f o l d s , e t c .
Lev e 1 i. ng b o t t 1 e
Othe r Ana lvze r s
A i r t i g h t
~
Can be viewed s i d e - b y s i d e w i t h g l a s s b u r e t t e
(0.5% d i v i s i o n s -
I n i t i a l l y and b e f o r e R e p a i r o r
V i s u a l l y check t f o r A s above
t e s t s
damages
d i s c a r d
I 1 1


Section No. 3 . 2 . 2 Revision N o . 0 Date January 1 5 , 1980 Page 1 of 4
2 . 0 CALIBRATION OF APPARATUS Cal ibra t ion of sampling apparatus is one of the most
important functions i n maintaining da ta qua l i t y . Only l imi t ed i n i t i a l c a l i b r a t i o n i s required f o r gas absorption using an analyzer such as an Orsat . Continued maintenance, reagent checks, and most importantly, the ope ra to r ' s technique and d i l i - gence a re required f o r good q u a l i t y da t a . Table 2 . 1 a t t he end of t h i s s ec t ion summarizes t h e q u a l i t y assurance a c t i v i t i e s f o r c a l i b r a t i o n . 2 . 1 Analyzers
Cal ibra t ion i s recommended upon r e c e i p t , before every t h i r d f i e l d t e s t , and before any f i e l d t e s t i n which the Orsa t o r o t h e r absorption type analyzer has no t been checked during t h e previous 3 mo.
To check t h e 02-absorbing reagent and t h e o p e r a t o r ' s techni- que, t he percentage of O2 i n a i r should be determined. The average of t h r e e r e p l i c a t e s should be 20 .8 f0.7% when using t h e standard Orsat. A measured average value >21.5% genera l ly ind ica t e s poor operator technique, while a value (20.1% gene ra l ly i n d i c a t e s leaking valves , spent absorbing reagent (for O2 o n l y ) , and/or poor operator technique. (See Sect ion 4 . 1 of Reference 1 fo r t he der iva t ion of t h e above l i m i t s . ) The t h r e e r e p l i c a t e s and t h e i r averages should be reported on an and R c h a r t , as i l l u s t r a t e d by Figure 2 . 1 ; a blank copy o f t h i s form is in Sec- t i o n 3.2.12.
A more thorough check, i f required equipment i s ava i l ab le , would be t o take a sample from a manifold containing a known mixture of C 0 2 and 02. This is appl icable t o grab samples o r t o t h e in t eg ra t ed samples. In both cases , t h e sample i s analyzed f o r C 0 2 and O2 using t h e Orsat . The average of three r e p l i c a t e s should be 50.5% ( abso lu te ) of t h e known concentrat ion of each gas. Again, high measured values ind ica t e poor operator techni- que, while low values i n d i c a t e leaking valves , spent absorbing reagent , and/or poor operator technique.

i
I I 1 I I I I I I I I I I I 1 1 I 1 I 1 1
Y

Section N o . 3 . 2 . 2 Revision N o . 0 Date Janua ry 15 , 1 9 8 0 Page 3 of 4
I f the above l i m i t s a r e exceeded, cor rec t ive ac t ion should be equipment maintenance and/or operator t r a in ing . 2 . 2 Rate Meter
Clean and c a l i b r a t e t h e r a t e meter i n the in t eg ra t ed gas sampling t r a i n every 6 mo and a t any s i g n o f errat ic behavior . Cal ibrate using e i ther a w e t t e s t meter o r a volume meter which has been r ecen t ly c a l i b r a t e d aga ins t a primary standard.
series w i t h the r a t e meter. 1. Place t h e c a l i b r a t e d volume meter o r w e t t e s t meter i n
3 2 . Adjust t h e flow r a t e t o 1 .E/min ( 0 . 0 3 5 f t /min) on t h e
r a t e meter. 3 . Take readings with the wet t es t meter and stopwatch.
I f the f low r a t e i s no t near the desired 1 2/min (0 .035 ft”/min) on t h e r a t e meter, a d j u s t t h e valve and repeat t he reading w i t h t h e w e t t e s t meter and stopwatch; repeat u n t i l the desired f l o w r a t e is obtained f o r the r a t e meter s e t t i n g .
4 . Take readings a t 0 . 5 , 0 . 7 5 , and 1 . 0 R/min (0.18, 0 . 0 2 7 ,
and 0.035 f t /min) on the rate meter. Record the readings from the ca l ib ra t ed meter and the r a t e meter i n t he c a l i b r a t i o n log .
5 . Construct a c a l i b r a t i o n curve of r a t e meter reading versus f low r a t e f o r t h e meter u s i n g corrected w e t t e s t m e t e r stopwatch readings.
6 . Number each r a t e meter and include the number and t h e date o f c a l i b r a t i o n on t h e c a l i b r a t i o n curve.
3

Section No. 3.2.2 Revision No. 0 Date January 15, 1980 Page 4 o f 4
Frequency and method of measurement
Upon r e c e i p t and b e f o r e any t e s t i n which t h e a n a l y z e r has n o t been checked dur ing t h e prev ious 3 mo; determine % O2 i n ambient a i r , o r use a c a l i b r a t i o n gas with known C O , C 0 2 , 0 concent ra t ions
Check w i t h wet t e s t meter o r volume meter a t 6-mo i n t e r - v a l s o r a t ind ica- t i o n of e r r a t i c behavior
2
Table 2.1 ACTIVITY MATRIX FOR THE CALIBRATION OF APPARATUS
Action i f requirements a r e n o t met
Check O r s a t ana lyzer f o r leak ing v a l v e s , spent absorb ing r e a g e n t , and/or o p e r a t o r tech- niques; t a k e c o r r e c t i v e a c t i o n
Repeat C a l i - b r a t i o n s t e p s u n t i l l imits a r e a t t a i n e d
C h a r a c t e r i s t i c s
O r s a t a n a l y z e r
Rotameter o r r a t e meter
~~ ~
Acceptance l imits ~~~~ ~~
Average o f t h r e e r e p l i - c a t e s should be 20.8 ?0.5% ( a b s o l u t e ) o r known c o n c e n t r a t i o n 20.5 ( a b s o l u t e )
~
Smooth curve of rotame- t e r a c t u a l f l o w r a t e s w i t h no evidence o f e r r o r
Section N o . 3 . 2 . 3 Revision No. 0 Date January 15 , 1 9 8 0 Page 1 of 6
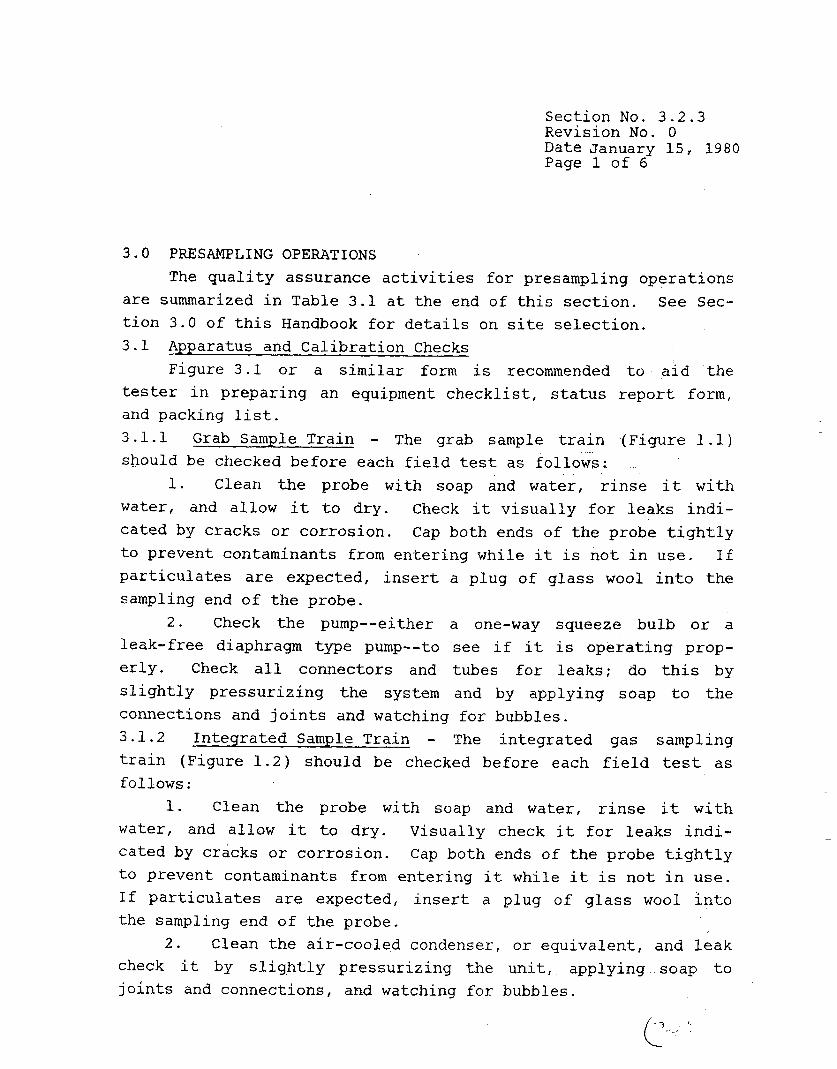
3.0 PRESAMPLING OPERATIONS The q u a l i t y assurance a c t i v i t i e s f o r presampling opera t ions
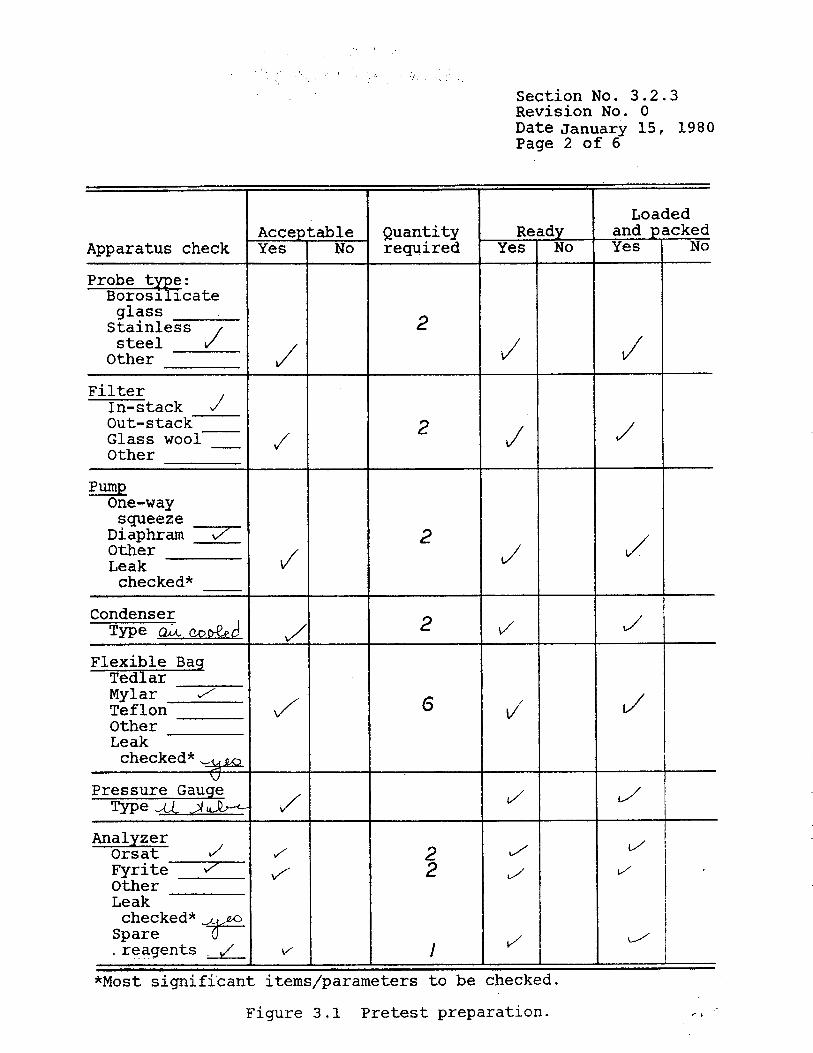
a r e summarized i n Table 3 . 1 a t the end of t h i s s ec t ion . See Sec- t i o n 3 . 0 of t h i s Handbook for d e t a i l s on s i t e s e l e c t i o n . 3 . 1 Apparatus and Cal ibra t ion Checks
Figure 3 . 1 o r a s i m i l a r form is recommended t o a i d the tester i n preparing an equipment check l i s t , s t a t u s r e p o r t form, and packing l i s t . 3.1.1 Grab Sample Tra in - The grab sample t r a i n (Figure 1.1) should be checked before each f i e l d t e s t as follows:
1. Clean t h e probe with soap and water, r i n s e it with water, and allow it t o dry. Check it v i s u a l l y f o r leaks i n d i - cated by cracks o r corrosion. Cap both ends o f t h e probe t i g h t l y t o prevent contaminants from enter ing while it is n o t i n u s e . I f p a r t i c u l a t e s a r e expected, i n s e r t a plug of g l a s s wool i n t o t h e sampling end of t h e probe.
2 . Check t h e pump--either a one-way squeeze bulb o r a leak-free diaphragm type purnp--to see i f it i s opera t ing prop- e r l y . Check a l l connectors and tubes f o r leaks ; do t h i s by s l i g h t l y p re s su r i z ing t h e system and by applying soap t o t h e connections and j o i n t s and watching f o r bubbles. 3 . 1 . 2 In tegra ted Sample Train - The in t eg ra t ed gas sampling t r a i n ( F i g u r e 1 . 2 ) should be checked before each f i e l d tes t as fo l lows:
1. Clean t h e probe w i t h soap and water, r i n s e it with water, and allow it t o dry. Visually check it f o r leaks i n d i - cated by cracks or corrosion. Cap both ends o f t h e probe t i g h t l y t o prevent contaminants from enter ing it while it i s n o t i n use. I f p a r t i c u l a t e s a r e expected, i n s e r t a plug o f g l a s s wool i n t o the sampling end of t h e probe.
2 . Clean t h e air-cooled condenser, o r equiva len t , and l e a k pressur iz ing the u n i t , applying soap t o and watching f o r bubbles.
check it by s l i g h t l y j o i n t s and connections,
Section No. 3 . 2 . 3 Revision No. 0 Date January 15, 1980 Page 2 of 6
Apparatus check
Probe t e. &;ate
g l a s s S ta in l e s s 1
steel J Other
F i l t e r In-stack J Out-s tack Glass wool- Other
pump One-way
squeeze Diaphram 7 O t h e r Leak
checked*
Fl;~t?~; Bag
Mylar J Teflon Other Leak
checked* W
Pressure Gauge Tmec/CC 2 UR-C
Analyzer
FyriteJ O t h e r
Orsat J
Leak
F checked* Spare - . r eagen t s . J
Accel Y e s
J
J
J
J
J'
J
J
.able N o
Quantity required
2
2
2
I J
*Most s i g n i f i c a n t items/parameters t o be checked.
Figure 3 . 1 Pretest preparat ion.
Loaded

Sect ion N o . 3 .2 .3 Revision No. 0 Date January 1 5 , 1 9 8 0 Page 3 of 6
3 . Disassemble, c lean , and reassemble r a t e meter a t any s ign of fore ign matter e r ra t ic behavior of t h e rotameter.
4. Leak check t h e f l e x i b l e bag by
t h e needle valve and i n t h e rotameter o r
p re s su r i z ing and by observing f o r any lo s s i n pressure a s descr ibed i n Sect ion 3.2.1. 3.1.3 Orsat G a s Analyzer - The Orsat apparatus should be checked and serv iced before each f i e l d t e s t i n t he following manner:
1. Check t h e confining f l u i d l e v e l s i n t h e l eve l ing b o t t l e and t h e b u r e t t e . Be su re the approximately 300 m l of f l u i d i n the l eve l ing b o t t l e i s c l e a r , orange, and s u f f i c i e n t t o f i l l t h e b u r e t t e . B e s u r e t h e s o l u t i o n i n the l eve l ing b o t t l e is d i s t i l - l ed water containing approximately 5% by volume of concentrated s u l f u r i c ac id and 2 t o 3 m l o f methyl orange a c i d i c i n d i c a t o r ; then s a t u r a t e the s o l u t i o n with a s a l t , usua l ly sodium s u l f i t e o r sodium ch lo r ide , a t t h e temperature a t which t h e O r s a t is expected t o opera te . (The s u l f u r i c ac id a c t s as a drying agent t o remove any moisture from t h e sample, and t h e s a t u r a t e d s a l t s o l u t i o n prevents t h e absorpt ion of sample gases by the l e v e l i n g s o l u t i o n . ) This l e v e l i n g b o t t l e so lu t ion should be prepared as a s tock so lu t ion and taken t o the f i e l d i n case it i s needed.
2 . Remove and c lean t h e stopcocks. Carefu l ly apply s top- cock grease t o prevent system leaks , and do it without plugging t h e a i r passages. Stopcocks a r e genera l ly not in te rchangeable , so rep lace each one i n t h e same p o r t from which it was o r i g i n a l l y taken.
3 . Change t h e absorbing so lu t ions i f > 1 0 passes a r e needed t o o b t a i n a cons tan t reading f o r any gas component. I f i n doubt , change the s o l u t i o n (fol lowing the manufacturer 's i n s t r u c t i o n s ) by emptying t h e absorber and adding f r e s h absorbing r eagen t s . Add new reagents when requi red , 6 t o 8 h p r i o r t o f i e l d use . P r i o r t o adding t h e O2 reagent , f l u sh the absorbing p i p e t t e and t h e expansion bag w i t h N 2 , and pass N2 over t h e reagent while adding it t o t h e p i p e t t e .

Sect ion No. 3.2.3 Revision N o . 0 Date January 15, 1 9 8 0 Page 4 of 6
4. Leak check the Orsa t analyzer thoroughly on s i t e b e f o r e using i t , since moving an Orsa t t o t h e s i t e may have caused it’ t o leak . ( U s e t h e procedure i n Section 3.2.1) I f t h e r e a r e l e a k s , check a l l connect ions and stopcocks u n t i l t he cause of t h e l e a k i s i d e n t i f i e d . Leaking stopcocks must be disassembled, cleaned, and regreased; l eak ing rubber connections must be r ep laced . After t h e ana lyzer i s reassembled, t he leak-check procedure must be repeated. 3 .1 .4 F y r i t e G a s Analyzer - Check t h e absorpt ion ana lyze r v i s u a l l y f o r l e a k i n g of reagents p r i o r t o each tes t . 3 . 2 Equipment Packaging
Log i s t i c s o f t h e method, t i m e of sampling, and q u a l i t y of da t a a r e dependent on t h e packing of t h e sampling and a n a l y t i c a l equipment f o r (1) a c c e s s i b i l i t y i n t h e f i e l d , ( 2 ) ease of move- ment on s i te , and ( 3 ) optimum funct ioning i n t h e f i e l d . E q u i p - ment should be packed t o withstand severe t reatment dur ing s h i p - ment and f i e l d o p e r a t i o n s .
1. Pack probes, pumps, and condenser i n cases o r wooden boxes f i l l e d wi th packing mater ia l o r l i n e d w i t h Styrofoam. The cases should have handles o r hooks t h a t can withstand h o i s t i n g and should be r i g i d enough t o prevent bending o r t w i s t i n g du r ing shipping and handl ing.
2 . Pack r a t e meters, needle va lves , and a l l small glass- ware i n d i v i d u a l l y i n sh ipping conta iners .
3 . U s e the r i g i d conta iner with the i n t e g r a t e d sampling bag f o r i t s sh ipp ing con ta ine r .
4 . Disassemble t h e Orsa t and pack each i t e m i n d i v i c u a l l y i n s u i t a b l e packing m a t e r i a l and r i g i d conta iners f o r long t r i p s o r f o r sh ipping a s f r e i g h t . Ship the spare p a r t s and t h e absorb- e n t s o l u t i o n s i n s e p a r a t e con ta ine r s .
.-

S e c t i o n N o . 3 . 2 . 3 Revision No. 0 Date January 15, 1980 Page 5 o f 6
As above
As above
Table 3 . 1 ACTIVITY MATRIX FOR PRESAMPLING OPERATIONS
A s above
A s above
C h a r a c t e r i s t i c s
~~
No f o r e i g n m a t t e r o r e r r a t i c behavior
Grab Sample T r a i n
A s above
Probe
No v i s u a l i n d i c a t i o n o f leakage
According t o rnanufac- t u r e r ' s c r i t e r i a
D i s t i l l e d water con- t a i n i n g approximately 5% by volume of concen- t r a t e d H SO4 and s a t u - r a t e d wigh a s a l t
(10 p a s s e s needed f o r c o n s t a n t readings wi th any component gas
I n t e g r a t e d Gas Sampling Tra in
A s above
Before each f i e l d t e s t , use manufac- t u r e r ' s d i r e c t i o n s
Performance check us ing any component gas
Probe
Air-cooled con- denser
. ..
Needle va lve and rotam- e ter
F l e x i b l e bag
Gas Analyzer O r s a t
Level ing so lu- t i o n
Absorbing so lu- t i o n
Frequency and method
No v i s u a l s i g n of breakage
Visua l observa t ion b e f o r e each f i e l d t e s t
As above I A s above
A s above I As above
Act ion i f requirements a r e n o t met
Replace a s n e c e s s a r y
As above
As above
As above
Clean and re- p l a c e a s n e c e s s a r y
Clean and reas- semble a s n e c e s s a r y
Replace a s n e c e s s a r y
Serv ice o r re- t u r n t o sup- p l i e r a s n e c e s s a r y
Prepare f r e s h s o l u t i o n
Use f r e s h r e a g e n t
(cont inued)
Section No. 312-3 Revision No. 0 Date January 15, 1980 Page 6 of 6
Frequency and method Charac te r i s t i c s Acceptance limits of measurement
Action i f requirements a r e not m e t
Stopcocks Visual observat ion No leakage Remove, c l ean , regrease a s ne c e s s a r y
Visual observat ion
See packing in s t ruc - t i o n s
Assembly
Add f r e s h reagent ; re- p a i r a s neces- s a ry
Not app l i cab le
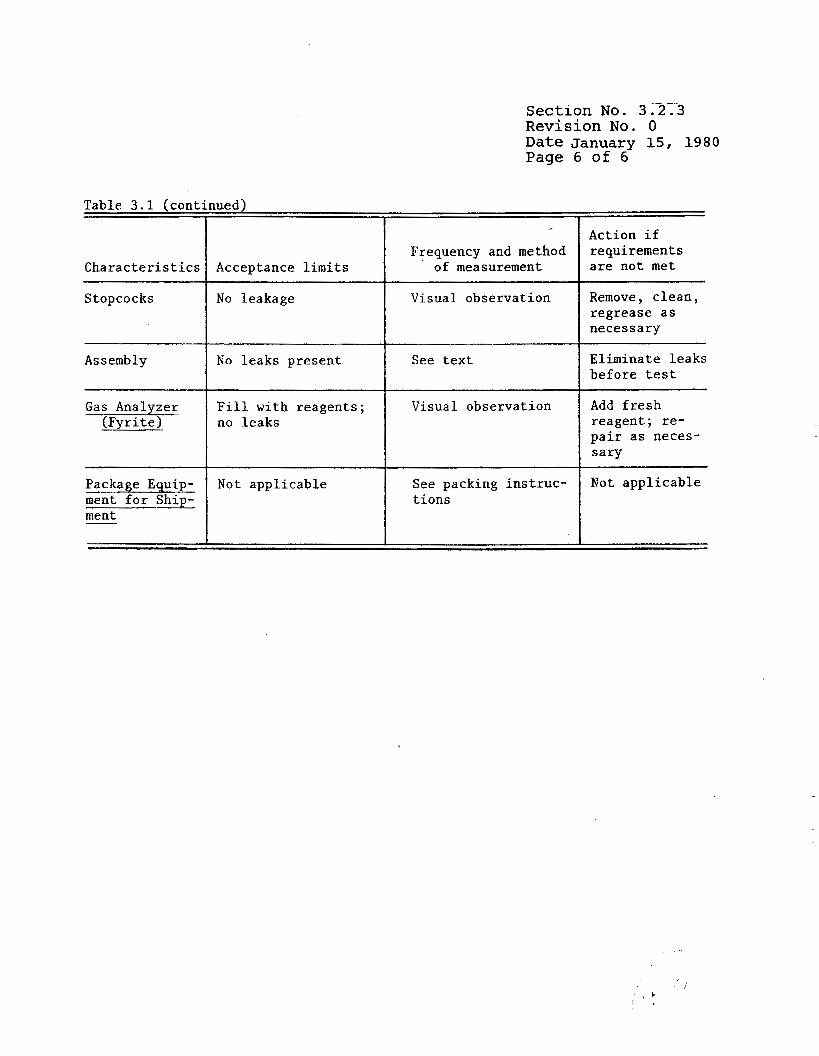
No leaks present See t e x t El iminate leaks before t e s t I
Gas Analyzer F i l l with reagents ; (Fy r i t e ) no leaks
Package Equip- Not appl icable ment f o r Ship- ment -1

Section No. 3 . 2 . 4 Revision No. 0 Date January 15, 1980 Page 1 of 12
4.0 ON-SITE MEASUREMENTS The choice of procedure to be used at the sampling site
depends on whether an emission rate factor (F-factor), an excess air determination, or a molecular weight determination is re- quired. The applicable measurement is specified in the emission standard, and th.e quality assurance activities are summarized in Table 4.1 in this section. In any case, the equipment is un- packed at the sampling site and visually inspected for damage during shipment from the laboratory; the Orsat analyzer, espe- cially, is carefully checked for reagent levels and leaks as described in Section 3 . 2 . 1 . Figure 4.1 (On-site Measurement Checklist) can be used as a guide for sampling and analysis of molecular weight, excess air, and emission rate determination. 4.1 Determination of C 0 2 and O2 for Dry Molecular Weiqht
Calculations Three methods are described in the Federal Register for
measuring a gas stream's dry molecular weight. These are dis- cussed in order of increasing complexity, and their uses are de- termined by the applicable standards or by expected variations in gas composition. 4.1.1 Single-Point Grab Sampling and Analysis - Set up the grab sampling train as depicted in Figure 1.1. Visually check each connection for leaks.
1. Be sure the sampling point in the duct is either at the centroid of the cross section or at a point 21 m ( 3 . 2 8 ft) from the walls of larger ducts, unless otherwise specified by the administrator.
2. Place the probe securely in the stack at the sampling point.
3 . Seal the sampling port as well as possible wich a sponge or rag to prevent dilution of the stack gas by ambient air if the stack pressure is negative.

Section N o . 3 .2 .4 Revision N o . 0 Date January 15, 1980 Page 2 of 12
- Sampling: Method: s ing le-poin t grab ,/ s ingle-poin t i n t eg ra t ed
Is a f i l t e r used t o remove p a r t i c u l a t e matter? *Sampling t r a i n l eak checked? *Orsat analyzer l e a k checked? A l l connections t i g h t and leak f r e Sampling p o r t properly sea led? Sampling r a t e held constant? Sampling t r a i n purged? L A
Analysis Molecular Weight Determination Analyzer: Orsat / F y r i t e Other F y r i t e :
mult ipoin t i n t eg ra t ed
0
Reagent a t proper level and zeroed?* Leak-free connection between analyzer and sample l ine? Sampling l i n e purged?* Orsat: Reagents a t proper leve l?" %A w
Leak checked?* Sample analyzed within Sample l i n e s purged?* 4 W:
- Analyzer l eve l? --
Excess Air-Emission Rate Correctyon Orsat analyzer l eak checked?* Before A f t e r
Sampling l i n e s purged?* Analysis repeated by drawing a new sample u n t i l the fol lowing
01 f i Reagents a t proper l eve l?* -- -
c r i t e r i a a r e m e t ? CO, - any t h r e e analyses d i f f e r by
a ) (0 .3% when C02 24.0% b) - 70 .2% when C02 - <4.0%
O2 - any t h r e e analyses d i f f e r by a ) (0.3% when O2 (15.0% b ) 70.2% - when O2 215.0%
CO - any t h r e e analyses d i f f e r by - (0.3% -- A l l readings averaged and reported t o nea res t 0.1%
*Most s i g n i f i c a n t items/parameters t o be checked.
Figure 4 . 1 On-site measurement c h e c k l i s t .

SectiGn N o . 3.2 .4 Revision No. 0 Date January 15, 1980 Page 3 of 12
4. Check the Orsat analyzer for leaks as described in Section 3.2.1. (Though this step is not mandatory, it is highly recommended.) If another gas absorption device is used, it must be zeroed before use.
5 . Purge the sampling line several times by squeezing the one-way squeeze bulb and then attaching the gas analyzes (either the Orsat or another gas absorption device).
6. Draw a gas sample into the analyzer and immediately analyze it for C02 and 0 2 . Record the data on data form shown in Figure 4.2 or on a similar form.
7. Calculate the molecular weights as described i n Sec- tion 3.2.6.
8. Repeat steps 5 through 7 until the calculated molecular weights of any three samples differ from their mean by - c0.3 g/mole. 4.1.2 Single-Point Inteqrated Sampling and Analysis - Set up the sampling train as shown in Figure 1.2. Visually check for leaks.
Be sure the sampling point in the duct is either at t h e centroid of the cross section or at a point > 1 m (3.28 ft) from the walls of larger ducts, unless otherwise specified by the administrator.
2. Place the probe securely in the stack at the sampling point.
3. Seal the sampling port as well as possible with a sponge or rag to prevent dilution of the stack gas by ambient air. if the stack pressure is negative.
4. Leak check the flexible bags as described in Section 3-2.1, and then evacuate the selected bag. Leak check the sampling system by attaching a vacuum gauge to the condenser inlet, drawing a vacuum of 250 mm (10 in.) Hg, and plugging the outlet fitting where the bag is usually attached. Turn off the pump and observe the vacuum reading for 30 s; it should remain stable. If the vacuum drops, check the system for leaks, then repair if necessary, and finally recheck. (These leak checks are optional, but highly recommended.)
1.
-
OPERATOR
AVERAGE
NET VOLUME
3 2 1 NET MULTIPLIER ACTUAL ACTUAL
NET READING ACTUAL READING NET READING
8 . 0 8 . 0 44/100 COP 8.0 8-0 8.0 8.0 8 . 0
READING MINUS ACTUAL 19. jz, /b& /4. A /LA C02 READING) / 9 . L /.a A
CO(NET IS ACTUAL co 0 28/100
0 /9. J- 0 ' 9 - 2-
2 0 . g 80.8 8 0 . 8 8o.g 8u.8 28/100
0 2 ( N E T IS ACTUAL 0 2 32/100
0 READING MINUS ACTUAL 02 READING) /9. 2-
go - 8 N 2 (NET IS 100 MINUS
Figure 4.2 Gas analysis data form.
MOLECULAR WEIGHT OF STACK GAS (DRY BASIS)
'd 9
3.525
3. 5 8
0
22.62-

Section No. 3.2.4 Revision No. 0 Date Janua ry 15, 1980 Page 5 of 12
5 . Connect the probe, open the quick disconnect at the bas connection, and purge the sampling system with stack gas by running the pump for about 1 min at a high rate. Make sure that the condenser drain valve is closed tightly.
6. Connect the evacuated flexible bag, arid begin the sampling. Record the time, flow rate, and other appropriate data on a form like the one shown in Figure 4.3.
7. Sample at a constant rate so that about 3 0 to 90 Q (1 3 to 3 ft ) of gas are collected simultaneously with the pollutant
emission rate test. 8. Disconnect, seal, and remove the flexible sampling bag
to a suitable area for performing the analysis. Allow the col- lected sample to sit for about 30 min to ensure thorough mixing and temperature equilibrium. It is recommended that the analysis be performed as soon as practical after the 30-min waiting period, but not more than 8 h after sampling. If an Orsat analyzer is used, leak check it as described in Section 3.2.1. (Though not mandatory, this step is highly recommended.) If a gas absorption device is used, zero it before use.
9. Calculate the molecular weights as described in Sec- tion 3.2.6. A data form similar to the one shown in Figure 4.2 can be used for recording the results of the calculations.
10. Repeat steps 8 and 9 until the calculated molecular weights of any three analyses differ from their mean by - (0.3 g/mole.
dure is similar to the single-point integrated sampling proce- dure, but it is used when the stack cross section i s traversed.
1. Locate the sampling points according to the procedures described in Method 1. Determine the minimum number of traverse points, as follows:
a. 8 points for a round stack with ( 0 . 6 1 m (24 in.) diameter ,
b. 9 points for a rectangular stack with an equiva- lent diameter of ( 0 . 6 1 m (24 in.), or
4.1.3 Multipoint - Inteqrated Sampling and Analysis - This proce-

Sect ion No. 3.2.4 Revision No. 0 Date January 15, 1 9 8 0 Page 6 of 1 2
Run number 0- /
Barometric pressure 2 9 - 5 7 \AM.
Operator c c.zJ/n J
- Ambient temp. OC ,?c. 7 Stack temp. OC
U
a % Dev. = ( - Qavq) 100; must be 510%.
Qavg
Figure 4 .3 In tegra ted bag sampling f i e l d d a t a . I. /" -
Section No. 3.2.4 Revision No. 0 Date January 15, 1980 Page 7 of 12
c. 12 points for a larger stack. 2. Leak check and purge the bag and the sampling train'as
described in Subsection 4.1.2. 3 . Sample each point at the same rate and for the same
time increment. Record the sampling data as shown in Figure 4.3. Collect from 30 to 90 2 (1 to 3 ft3) of gas simultaneously with the pollutant emission rate test.
4. Disconnect, seal, and remove the bag to a suitable area for performing the analysis within 8 h, as described in Subsec- tion 4.1.2.
5. Calculate the molecular weight, and repeat the analysis until the results from any three analyses differ from their mean by - ( 0 . 3 g/mole. 4.2 Determination of Gas Composition for Emission Rate
Factor o r Excess Air Calculations The same three sampling procedures may be used as previously
described (Subsections 4.1.1, 4.1.2, and 4.1.3), but in all cases the Orsat analyzer must be used for analysis, and it must be leak checked before - and after analysis. In addition, the integrated sampling train (when used) and the flexible bags must be leak checked prior to sampling. Care in using the Orsat and in assur- ing the accuracy of the results is also required, as described in this section. 4.2.1 Sinqle-Point Grab Sampling and Analysis - Set up, check, and purge the system as described in Subsection 4.1.1. Perform the Orsat analysis immediately according to the manufacturer's instructions and as follows:
1. Draw sample gas into the Orsat and flush (i-e., allow to bubble through the burette) at least three times to saturate the liquid in the burette with the gas being analyzed and to ensure that the air remaining in the manifold is of the same composition as the sample to be analyzed. Caution: Once the flushing has begun, ambient air must not be allowed to enter the manifold.

Section No. 3.2.4 Revision No. 0 Date January 15, 1980 Page 8 of 12
2. Draw in a fixed volume (usually 100 ml) of the sample gas, following the manufacturer's instructions. Allow a minimum of 5 min for the sample gas to come to temperature equilibrium with the water jacket around the burette (unless the sample and the analyzer have both been at the same temperature for at least 5 min).
3. Proceed with the sequential determinations of C02, 0 2 ,
and CO as directed by the instructions supplied by the manufac- turer of the gas analyzer. Make repeated analyses of each compo- nent until two consecutive readings are identical. Always make two or three passes through the absorbing solution between read- ings. Note: If more than three readings of two or three passes are required to reach a constant reading for any component gas, replace the absorbing reagent' and repeat the entire sampling sequence.
4. Record the readings on the data form (Figure 4.1), and determine the average value for each component of interest.
5. Leak check the Orsat after analysis. If it does not pass the leak test, repair it and repeat the analysis. 4.2.2 Inteqrated Single-Point and Multipoint Sampling and Analysis - The sampling procedures are identical to those de- scribed in Subsections 4.1.2 and 4.1.3. The flexible bag and the sampling train must be checked for leaks prior to sampling, and the Orsat must - be leak checked before - and after analysis.
After taking the sample, remove the flexible bag to the analysis area and let it remain there for at least 30 min before analyzing with the Orsat. Analysis must be completed within 4 h of sampling. Perform the analysis according to the manufac- turer's instructions and as outlined in Subsection 4.2.1. Repeat the analyses by drawing in new samples of C 0 2 , 02, or CO from the bag until t he following criteria are met:
For C 0 2 - Repeat until any three analyses differ by - (0.3% (absolute) when C02 is >4.0%, or by - ( 0 . 2 % (absolute) when C 0 2 is - (4.0%. Average the three acceptable readings, and report to t h e nearest 0.1%.

Sect ion N o . 3 . 2 . 4 Revision N o . 0 Date January 15 , 1980 Page 9 of 1 2
For O2 - Repeat u n t i l any t h r e e analyses d i f f e r by <0.3% when t h e O2 is 115.0%, o r by 50.2% when t h e O2 i s >15.0%. Average t h e t h r e e acceptab le readings and r epea t t o t h e n e a r e s t 0.1%.
-
For CO, if required - Repeat u n t i l any three r e s u l t s d i f f e r by - (0.3%. 4.3 Spec ia l Precaut ions
The Orsa t ana lyzer i s a simple instrument, b u t t h e v a l i d i t y of r e s u l t s depends on ope ra to r technique, ca re , and p a t i e n c e . Special p recaut ions f o r us ing an Orsa t analyzer inc lude :
1. Do n o t a l low ambient a i r t o e n t e r t h e Orsa t ana lyzer during t e s t i n g .
2 . Always perform t h e a n a l y s i s i n t h e following sequence: absorber No . 1 - C 0 2 , absorber N o . 2 - 02, and absorber N o . 3 - CO. This sequence is necessary because absorber N o . 2 w i l l a l s o absorb C02, and absorber N o . 3 w i l l absorb O2 and p o s s i b l y C02;
double absorpt ion w i l l y i e l d erroneous da t a . 3 . B e s u r e t o s a t u r a t e t h e i n d i c a t i n g s o l u t i o n i n t h e
b u r e t t e with s a l t a t t h e ope ra t ing temperature t o prevent absorp- t i o n o f sample gases p r i o r t o a n a l y s i s . Be su re t h e s o l u t i o n i s a c i d i c ( a s i n d i c a t e d by methyl orange) t o enable it t o absorb any moisture i n the sample gas .
4 . Keep the absorber s o l u t i o n from e n t e r i n g t h e c a p i l l a r y column manifold. Void t h e t es t i f any absorber s o l u t i o n e n t e r s the manifold, and clean the sample manifold w i t h acetone.
5. A l l o w a minimum of 5 min f o r gas samples t o come t o temperature equ i l ib r ium w i t h t h e water j a c k e t be fo re t h e ana lys i s .
6 . Operate t h e Orsa t analyzer under cons t an t temperature and pressure , B e s u r e t h a t the l e v e l s of s o l u t i o n s i n t h e b u r e t t e and the l e v e l i n g b o t t l e a r e t h e same t o ensure equa l pressures be fo re t a k i n g a reading from t h e Orsa t . T h e water j a c k e t a c t s a s a b u f f e r f o r temperature changes.
Measure SO2 concent ra t ions q u a n t i t a t i v e l y (Method 6 ) if t he source be ing tested i s known t o have o r i s suspected of
7 ,

Section No. 3.2.4 Revision No. 0 Date January 15, 1980 Page 10 of 12
having high SO2 concentrations, and subtract the value from that of the C02 determination. Measure and correct the values when the SO2 concentration is suspected to be - >3% (relative) of the
C02 concentration and when the data are to be used to correct emission rates or to calculate gas flows. If the data are to be used for calculating just the molecular weight (Md), then SO2 in- terferences as high as 0.5% (absolute) or 5000 ppm are accept- able; this level of interference will result in an error of only about 0.1 g/g-mole (0.1 lb/lb-mole) in Md.

Section No. 3.2.4 Revision No. 0 Date January 15, 1980 Page 11 of 12
C h a r a c t e r i s t i c s
Grab Sampling
Sampling t r a i n
Table 4.1 ACTIVITY MATRIX FOR ON-SITE MEASUREMENTS
Acceptance l imi t s
No l e a k s
I
Sampling p o i n t s
I n t e g r a t e d Sampling .
Locate sampling p o i n t s
F l e x i b l e bag
A t t h e c e n t r o i d of t h e c r o s s s e c t i o n o r a t a p o i n t >1 m (3 .28 f t ) from the w a l l s
8-12 p o i n t s ; see Sub- set 4 . 1 . 3
No l e a k s
Train
~ ~~~
Sampling r a t e
No l e a k s ; vacuum s t a b l e f o r - >30 s
Constant r a t e
Orsa t Analyzer
Leak check 1 No l e a k s f o r 4 min
Frequency and method of measurement
V i s u a l l y check b e f o r e each f i e l d t e s t
Not 'a pp 1 i cab 1 e
Not a p p l i c a b l e
____ - Check before each f i e l d t e s t ; see Sec 3.2.1
P u l l vacuum of a t l e a s t 250 mm (10 i n . ) Hg
Check using F i g 4 . 2
Varies with t e s t method; mandatory f o r emission r a t e f a c t o r and excess a i r calculations; Sec 3.2.1
Act ion i f requi rements a r e n o t met
E l i m i n a t e l e a k s b e f o r e proceeding with t e s t
Not a p p l i c a b l e
Not app 1 i cab 1 e
Replace a s Iieces s a r y
Check a l l c o n n e c t i o n s , r e p l a c e items a s n e c e s s a r y
Repeat sampling t o meet 10% d e v i a t i o n l i m i t
Check rubber c o n n e c t i o n s and s t o p c o c k s u n t i l cause o f l e a k i s i d e n t i f i e d ; leak check a f t e r re- p a i r and reassembly
(cont inued)

Sect ion No. 3.2.4 Revision No. 0 Date January 15, 1980 Page 12 of 12
Frequency and method of measurement
For each f i e l d t e s t , compare c a l c u l a t e d El ' s t o t h e i r means d
Table 4 . 1 (cont inued)
Action i f requirements a r e n o t met
Repeat a n a l y s i s , perhaps by another o p e r a t o r
C h a r a c t e r i s t i c s
1. Compare readings
2 . Compare ana lyses of component gases
Tes t R e s u l t s
For Md
1. Replace ab- sorb ing s o l u t i o n
2 . Repeat analy- ses by a n o t h e r o p e r a t o r ; check t h e a p p a r a t u s and technique
For emission r a t e f a c t o r o r excess a i r ca lcu- t i o n s
Acceptance l i m i t s
Md from each of t h r e e grab samples and a n a l - y s e s d i f f e r from t h e i r mean by ( 0 . 3 g/g mole ( 0 . 3 l b / i b mole)
1. Make repea ted passe5 t h r u t h e absorb ing s o l u - t i o n u n t i l two consecu- t ive readings a r e t h e same; compare t h r e e readings
2. Make repea ted ana- l y s e s ; see Subsec 4 . 2 . 2 f o r c r i t e r i a
Section No. 3.2.5 Revision N o . 0 Date January 15, 1980 Page 1 of 2
5.0 POSTSAMPLING OPERATIONS Table 5.1 at the end of this section summarizes the quality
assurance activities for the postsampling operations. 5.1 Compare Measured Values Against Theoretical Values
After the analyses have been performed and before the appa- ratus is disassembled, the measured and the theoretical results (if available) should be compared as a quick check f o r gross measurement errors.
Combustion nomographs are available f o r centages by volumes of C02 and O2 when the known. 8 ' 9 Also the nomograph can be used to cular weight of the stack gas.
Perform the calculations on the measured
estimating the per- fuel composition is calculate the mole-
data as directed in Section 3.2.6 and perform the following comparison:
D = %C02(m) - %C02(e) co2
where = difference in measured and estimated values, %,
= measured C 0 2 (average of r replicates), %, and = estimated or theoretical C02, %.
Accept the measured value if D is ' 2 % (absolute) ; otherwise,
check the apparatus, the technique, and the estimating procedures before collecting and analyzing more samples.
Record the estimated or theoretical values on a form similar to Figure 4.1. (Theoretical values may have been calculated and recorded before the field test if sufficient knowledge of the process was available.)
A second method to help eliminate gross ezrois i.s the use of the Fyrite sampler at several points during the test. This will indicate whether a problem does exist, but will not reveal which value is indeed correct. -
DC02
XC02(m) ZC02 (e
c02
/
- 7 I -

Sect ion No. 3 . 2 . 5 Revision No. 0 Date January 15 , 1 9 8 0 Page 2 of 2
5 . 2 Disassemble and I n s i e c t - Apparatus When d isassembl ing t h e apparatus , v i s u a l l y i n s p e c t t h e
sampling t r a i n components and t h e Orsa t ana lyzer f o r damages t h a t could have adve r se ly a f f e c t e d t h e measured va lues . Any i d e n t i - f i e d damage t h a t was n o t de t ec t ed during t h e t e s t shou ld be documented on t h e f i e l d d a t a form and thoroughly eva lua ted by t h e appropr ia te appa ra tus check i n t h e l a b o r a t c r y . Af t e r checking if it i s concluded t h a t t h e damage could have biased the measure- ments, a d e s c r i p t i o n of p o t e n t i a l b i a s i n t h e d a t a shou ld be included i n t h e f i e l d t e s t r e p o r t , I f p o s s i b l e , r e p e a t t h e field t e s t . 5 .3 Pack Apparatus -- f o r Shipment t o Laboratory
Pack t h e appa ra tus f o r shipment t o t h e l a b o r a t o r y a s de- s c r ibed i n S e c t i o n 3 . 2 . 3 . Return t h e d a t a forms, p repa red i n d u p l i c a t e , t o t h e laboratory--one copy should be s e n t by ma i l , and one copy handca r r i ed .
Table 5 . 1 A C T I V I T Y MATRIX FOR POSTSAMPLING OPERATIONS
7 --=-=--r__I_----
C h a r a c t e r i s t i c s Acceptance l imi t s Frequency and method
of measurement
Act ion i f r equ i r emen t s a r e n o t met
Compare mea sured v s . e s t ima ted va lues of
Disassemble and i n s p e c t ap- p a r a t u s
%‘O, (m) - %C02(e)
- (2% ( a b s o l u t e ) sug- g e s t e d
No damage t h a t could have a d v e r s e l y a f f e c t e d t h e measurement
A s suggested by ad- m i n i s t r a t o r ; e . g . , f o r each i n c i n e r a t o r t e s t when a n e s t i m a t e o i y/,C02 i s t o be used t o c o r r e c t p a r t i - c u l a t e emission l e v e l s
Visua 1 i n s p e c t i o n ---I_-_
Repeat t h e a n a l y s i s f o r a d d i t i o n a l s amp 1 e s
Report damage and i t s pos - s i b l e b i a s on measurements t o t h e d d m i n i s t r a - t o r ; u s e F i g 4 . 1
Not a p p l i c a b l e
-I_--

Section No. 3 . 2 . 6 Revision No. 0 Date January 15, 1980 Page 1 of 3
6.0 CALCULATIONS Table 6.1 at the end of this section summarizes the quality
assurance checks pertaining to calculations. 6.1 Excess Air
Use Equation 6-1 to calculate the percentage of excess air. Use the average value for each of the component gases, as fol- lows :
) 100 Equation 6-1 %02 - 0 . 5 %CO
0.264 %"$r (%02 - 0 . 5 %CO) %EA =
where
%EA = percent excess air, %, %O = percent O2 by volume (dry basis), average of three
%CO = percent CO by volume (dry basis), average of three
%N2 = percent N2 by volume (dry basis), average of three
2 O2 values, %,
CO values, %,
N2 values, %, and 0.264 = ratio of O2 to N2 in air, v/v.
The average value for each of t.he gases is computed from the Orsat analyses satisfying the criteria in Section 3.2.4. Round each average to the nearest 0.1%. In many cases, %CO will be close to zero and can be dropped to simplify Equation 6-1. Equa- tion 6-1 is applicable whenever most of the N2 in the f l u e gas comes from N2 in the combustion air, as is the case with most fuel and refuse combustion processes. If the fuel contains appreciable amounts of N2 or if O2 enrichment is used, Equation 6-1 cannot be used; alternate methods, subject to the approval by the administrator, are required.
Section No. 3.2.6 Revision N o . 0 Date January 15, 1980 Page 2 of 3
6 . 2 D r y Molecular Weight U s e Equation 6-2 t o ca l cu la t e the dry molecular weight from
data i n Figure 4 .1- - i . e . , t h e average values of t he component gases reported t o t h e nea res t 0.1%.
Equation 6-2
where Md = dry molecular weight, g/g-mole (lb/lb-mole),
%C02 = percent C02 by volume (dry b a s i s ) , average of th ree analyses, and
%O,, %N2, and %CO a re previously defined. Round Md t o the neares t 0 . 1 , and record t h e value Figure 4.1. 6 . 3 Data Reporting
A copy of Figure 4.1 o r an equivalent form should be f i l e d i n t h e laboratory log, and the o r ig ina l should be forwarded e i t h e r t o t h e home laboratory f o r fu r the r i n t e r n a l review o r t o t h e user . An independent check of t h e ca lcu la t ions should be performed, and the corrected values should be ind ica ted on the form i f t he d i f fe rences a re more than the acceptable roundoff e r r o r . The checking ana lys t should i n i t i a l t h e da ta form.
. l

Charac te r i s t i c .
Calcu la t ions
Data r epor t ing
Sec t ion N o . 3 . 2 . 6 Revision No. 0 Date January 1 5 , 1980 Page 3 of 3
Table 6.1 ACTIVITY MATRIX FOR CALCULATIONS
Acceptance l i m i t s
1. Data form F i g 4 . 1 con ta ins a l l d a t a r equ i r ed f o r c a l c u l a - t i o n s of Y a A , M and emiss ion r a t e f a c t o r d '
2 . Average concentra- t i o n s c a l c u l a t e d t o the n e a r e s t 0.1%; f i n a l c a l c u l a t i o n s rounded t o n e a r e s t 0.1%
3 . Independent ca lcu- l a t i o n ag rees t o t h e n e a r e s t 0.1%
Data r e p o r t complete w i th i n d i c a t i o n of c a l c u l a t i o n check
Frequency and method o f measurement
1. Visual observa- t i o n a t each f i e l d t e s t
2 . For each f i e l d t e s t , compute t 3 e average concent ra t ion o f t h r e e ana lyses t h a t meet t e s t re - qu i rement s
3 . For each f i e l d t e s t , repea t ca lcu- l a t i o n s s t a r t i n g with raw da ta
4 . Visual check
Visual observa t ion o f each f i e l d t e s t
Act ion i f requirements a r e n o t met
1. Obtain neces- s a r y da t a t o com- p l e t e t h e form
2 . Reca lcu la te a l l r e s u l t s f o r which computa- t i o n s no t con- s i s t e n t with pro- cedure
3. Report cor- r e c t e d values o f t h e c a l c u l a t i o n s i n F i g 4 . 1
4 . Cor rec t c a l c u l a t i o n s
Pe r f o r m necessa ry ca l - c u l a t i o n checks


Sect ion N o . 3 . 2 . 7 Revision No. 0 Date January 1 5 , 1 5 5 0 Page 1 o f 1
C h a r a c t e r i s t i c s
Glassware, con- n e c t i n g tub- i n g , expan- s ion bu lbs
F l e a i h l P bags
Pump and ro tame t e r
7 . 0 MAINTENANCE L i t t l e pe r iod ic maintenance i s required f o r t h e Orsa:
apparatus--other than v isua l checks o f the glassware, t ubes , a%
expansion bulbs . Keep the valves closed during s to rage , ar-2
avoid f reez ing temperatures. I f t he Orsat i s t o be s t o r e d OVEZ an extended per iod, it i s general ly b e t t e r t o remove a l l o f ti--t absorbing reagents . The f l e x i b l e bags a re genera l ly subjec ted :: extensive wear, and requi re r epa i r o r replacement when 1ea:k occur. The pump and rotameter should be kept c l ean and should LE
maintained i n accordance with manufacturers' i n s t r u c t i o n s .
Act ion i f Frequency and method r equ i r emen t s
Acceptance l imi t s o f measurement a r e n o t m e t
No damage V i s u a l l y check b e f o r e Replace i f each use damaged
As rhnirp A s above Repa i r o r re- p l a c e as re- quired
Clean and maintained According t o manu- Adjust / r e p a i r i n accordance wi th f a c t u r e r ' s i n s t r u c - o r r e q u e s t
a s s i s t a n c e o f m a n u f a c t u r e r ' s i n - t i o n s s t r u c t i o n s s u p p l i e r

Sect ion No. 3 . 2 . 8 Revision No. 0 Date Janua ry 15 , 1 9 8 0 Page 1 .of 5
8.0 AUDITING PROCEDURE
An a u d i t i s an independent assessment of d a t a q u a l i t y . I t i s independent because it i s conducted by personnel o ther than the f i e l d c r e w and by using apparatus and measurement s tandards t h a t a r e d i f f e r e n t from those used by t h e r egu la r f i e l d crew. In the f i e l d , rou t ine q u a l i t y assurance checks a r e necessary f o r ob ta in ing good q u a l i t y da t a from a series of t e s t runs a t one source, bu t they a r e no t p a r t of t h e aud i t ing procedure. Table 8 . 1 a t t h e end of t h i s s ec t ion summarizes the q u a l i t y assurance a c t i v i t i e s f o r audi t ing . Based on t h e r e s u l t s of Col- l abo ra t ive t e s t s , t h r e e performance a u d i t s and a systems a u d i t a r e recommended i n Subsections 8.1 and 8 .2 . Both types are t o be conducted by aud i to r s . 8 . 1 Performance Audits
Performance a u d i t s a r e q u a n t i t a t i v e eva lua t ions of t h e q u a l i t y of t h e da t a produced and recorded by the t o t a l measure- ment system (sample c o l l e c t i o n , sample a n a l y s i s , and da ta proces- s i n g ) . These a u d i t s should be conducted by the respons ib le con- t r o l agency once during every enforcement source t e s t , r ega rd le s s of whether t h e t e s t i s conducted by a con t ro l agency o r by a p r i v a t e company personnel . A source t e s t for enforcement com- p r i s e s a series of runs a t one source. 8 .1 .1 Audit o f Md - Because t h e maximum r e l a t i v e e r r o r i n Mi i s approximately 4%, it i s no t p r a c t i c a l t o a u d i t Md un less d i r e c t e d by t h e adminis t ra tor . 8 . 1 . 2 Audit o f Analy t ica l Phase Using C e r t i f i e d Gas Mixtures f o r
Analyzer opera t ion and opera tor technique can be checked by pro- viding a u d i t samples of c e r t i f i e d gas mixtures t o be analyzed p r i o r t o o r along with f i e l d samples. One sample should c o n t a i n concentrat ions of 2-4% O2 and 14-18% C 0 2 , and another sample should contain concent ra t ions o f 2-4% C 0 2 and about 15% 02.
Emission Rate Correct ion Factor and Excess A i r Determination -

Section N o . 3.2.8 Revision N o . 0 Date January 1 5 , 1980 Page 2 of 5
These gas samples can be t r ans fe r r ed from t h e i r p ressur ized s torage containers t o f l e x i b l e bags and del ivered t o t h e test team on s i t e by the aud i to r . Replicate samples of the a u d i t gas containing O2 and C02 concentrations s i m i l i a r t o the concentra- t i o n s expected during the t e s t and one sample of t he o ther a u d i t gas should be s u f f i c i e n t f o r aud i t of t h e ana ly t i ca l phase.
The e r r o r of the a n a l y t i c a l phase can be ca lcu la ted using Equation 8-1, and should be - <1.0% for C 0 2 and 02.
- D = ma - %VC Equation 8-1
where D = di f fe rence i n t h e f i e l d tes t r e s u l t s and the certi-
f i e d a u d i t va lue , %,
- Ofla = f i e l d team's value a s t he average of r r e p l i c a t e s ,
%Vc = c e r t i f i e d value of aud i t gas, %. %, and
The emission rate co r rec t ion f ac to r i s n o t d i r e c t l y propor t iona l t o the Orsat analyzer e r r o r . Therefore, the standard c a l c u l a t i o n of 73 is not appl icable . The r e s u l t s of t he ca lcu la ted %D should be included i n the enforcement source t e s t r epor t as an assess- ment of accuracy of the ana ly t i ca l phase of Method 3 dur ing the ac tua l enforcement source test . 8.1.3 Audit of Data Processing - Data processing errors :?3 br detected by aud i t ing t h e da ta recorded on t h e f i e l d and t he laboratory forms. The o r i g i n a l and the f i e l d check ca l cu la t ions should agree; i f no t , a l l of the remaining data should be re- checked by t h e aud i to r , and any e r ro r s should be c l e a r l y explained t o t h e team t o prevent o r minimize reoccurrence. The da ta processing e r r o r s may a l so be detected i n copies of data sets compiled and f i l e d i n t h e f i e l d and i n copies of manual data reductions ( o r computer p r in tou t s , if used) forwarded t o the evaluator f o r aud i t . Calculation errors a r e prevalent among users of Method 3 .
L .
.
Section N o . 3.2.8 Revision No. 0 Date January 15, 1 9 8 0 Page 3 of 5
8 . 2 Systems Audit A systems aud i t i s an on-s i te q u a l i t a t i v e inspect ion and
review of the q u a l i t y assurance checks used by t h e team f o r t h e t o t a l measurement system (sample co l l ec t ion , sample ana lys i s , data processing, e t c . ) . I n i t i a l l y , a systems aud i t spec i f i ed by a ,qua l i ty assurance coordinator should be conducted f o r each enforcement source tes t , which by d e f i n i t i o n comprises t h r e e runs a t one source. After t h e team gains experience with t h e procedure, the frequency of a u d i t may be reduced, f o r example, t o once f o r every four tests. The audi tor should have ex tens ive experience i n source sampling--more s p e c i f i c a l l y , with t h e charac te r iza t ion technique being audi ted.
The functions of t he audi tor a r e summarized a s follows: 1. Observe procedures and techniques of t h e f i e l d team
during sample co l l ec t ion . 2 . Check/verify t h e records of apparatus c a l i b r a t i o n and
t h e q u a l i t y cont ro l c h a r t s used i n the laboratory ana lys i s . 3 . Record the r e s u l t s of t h e a u d i t and forward them with
comments on source team management t o t h e q u a l i t y assurance coordinator so t h a t any needed co r rec t ive ac t ions may be imple- mented. 8 . 2 . 1 Collectinq On-Site Information - While on - s i t e , the audi tor should observe t h e f i e l d team’s ove ra l l performance of the source t e s t . Spec i f ic operat ions t o observe should inc lude , bu t no t be l imi ted t o :
1. 2 . Purging the sampling t r a i n with s tack gas p r i o r t o
3 . Proportional sampling. 4 . Transferr ing of t he sample from t h e co l l aps ib l e bag t o
Se t t i ng up and leak t e s t i n g t h e sampl.ing t r a i n .
co l l ec t ing the sample.
the Orsat analyzer. Table 8.1 i s a suggested form f o r use by t h e audi tor . 8.2.2 Collect ing Laboratory Information - When v i s i t i n g t h e f i e l d team‘s home laboratory, the audi tor s h o u l d check the re- cords t o v e r i f y t h a t t he performance c r i t e r i a i n Table 4 .3 (Sec-
t i o n 3 . 2 . 4 ) have been met s i n c e the l a s t aud i t was performed. ,” , J

Sect ion No. 3 .2 .8 Revision No. 0 Date J a n u a r y 15, 1 9 8 0 Page 4 of 5
No
~
OPERATION
_I___
Presampling Operation
1. Ava i l ab i l i t y o f t h e o r e t i c a l value 2 . U s e of modified Orsat analyzer ( 0 . 1 - m l
d i v i s i o n s )
-- On-Site Measurements
3 .
4.
5 . 6.
7 .
8 . 9.
S e t t i n g up and leak t e s t i n g t h e samp- l i n g t r a i n Purging the sampling t r a i n with s t a c k gas p r i o r t o c o l l e c t i n g t h e sample Constant r a t e sampling Transfer of sample from c o l l a p s i b l e bag t o t h e Orsat analyzer Maintaining cons tan t pressure throughout t he t e s t Exposing the sample t o ambient a i r Spent absorbing reagent
Postsampling Measurements
1 0 . Perform independent c a l c u l a t i o n s u s i n g da ta from a u d i t
11. Compare the a u d i t value wi th t h e f i e l d team's t e s t value
1 2 . Make s u f f i c i e n t passes f o r complete absorption of a component gas
13. Minimize volumetric reading e r r o r 14. Check/verify appl icable records of
apparatus c a l i b r a t i o n checks and q u a l i t y cont ro l cha r t s i n the f i e l d team's home labora tory
General Comnents -
- Figure 8 . 1 Checkl is t f o r Method 3 f o r use by t h e a u d i t o r .
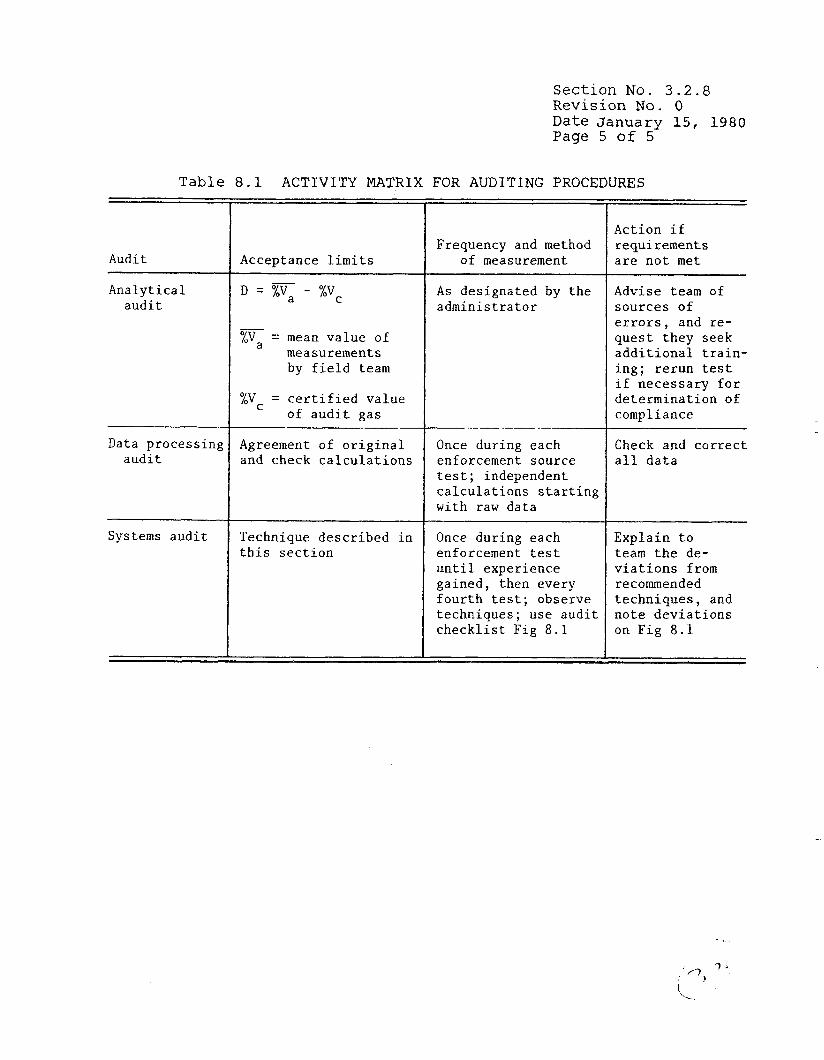
Sec t ion N o . 3 .2 .8 Revision No. 0 Date J a n u a r y 15, 1980 Page 5 of 5
Table 8.1 ACTIVITY MATRIX FOR AUDITING PROCEDURES
A u d i t
Analy t ica l a u d i t
Data process ing a u d i t
~
Systems a u d i t
Acceptance l i m i t s
D = q - %Vc
-- %V = mean v a l u e of
measurements by f i e l d team
a
%V = c e r t i f i e d va lue C of a u d i t gas
Agreement of o r i g i n a l and check c a l c u l a t i o n s
Technique d e s c r i b e d i n t h i s s e c t i o n
Frequency and method of measurement
A s designated by t h e a d m i n i s t r a t o r
~~
Once during each enforcement source t e s t ; independent c a l c u l a t i o n s s t a r t i n g with raw d a t a
Once during each enforcement t e s t u n t i l experience ga ined , then every f o u r t h t e s t ; observe techniques ; use a u d i t c h e c k l i s t F i g 8 .1
Action i f re qui r ement s a r e n o t met
Advise team of s o u r c e s of e r r o r s , and re- q u e s t t h e y seek a d d i t i o n a l t r a i n - i n g ; r e r u n t e s t i f necessary f o r d e t e r m i n a t i o n of compliance
Check and c o r r e c t a l l d a t a
Expla in t o team t h e de- v i a t i o n s from recommended t e c h n i q u e s , and n o t e d e v i a t i o n s on F i g 8 . 1


Sect ion No. 3 . 2 . 9 Revision No. 0 Date January 1 5 , 1 9 8 0 Page 1 of 1
9.0 RECOMMENDED STANDARDS FOR ESTABLISHING TRACEABILITY To acquire d a t a o f good q u a l i t y , two cons idera t ions a r e
e s s e n t i a l : (1) t h e measurement process m u s t be i n a s t a t e of s t a t i s t i c a l c o n t r o l a t t h e time of t he measurement, and ( 2 ) t he systematic e r r o r s combined with the random v a r i a t i o n s ( e r r o r s of measurement) m u s t r e s u l t i n an acceptable l e v e l o f unce r t a in ty . A s evidence of good q u a l i t y , it i s necessary t o perform q u a l i t y cont ro l checks and independent aud i t s of t he measurement p rocess , t o use ma te r i a l s and measurement procedures which can be t r a c e d t o an appropr ia te r e fe rence standard, and t o document d a t a from the checks and a u d i t s ( e . g . , by means of a q u a l i t y c o n t r o l c h a r t ) .
Data m u s t be r o u t i n e l y obtained by repea t measurements of standard re ference samples, primary, secondary, and/or working s tandards. The working c a l i b r a t i o n s tandards should be t r a c e a b l e t o e i t h e r primary o r h igher order s tandards.
In the case of absorpt ion type gas analyzers , o p e r a t o r techniques and analyzer operat ions can be checked by samplinq two c e r t i f i e d mix tu res of b o t t l e d gas containing 2-4% O2 and 14-18% C 0 2 , o r 2-4% C02 and about 15% 02 . Bott led gases used f o r a u d i t purposes should be t r a c e a b l e t o NBS s tandards.


1 0 . 0 REFERENCE METHOD a
1 .\lmtlon of tradc nameS or spoclfic produch does not eonstltuto cndorsoment by Uie Environmental P r o w Uo? Agency.
S e c t i o n N o . 3.2.10 Revision N o . 0 D a t e January 15, 1980 Page 1 of 3
2.2.2 Cooden=. An dr-wnled a ra(crzooied mn- dcnwr a olhar wndnnser that r l l l not m o v e QL (!Or, dO.and N ~ r n a p b ~ b m m o v s e r , x n m o b t b r s which would l n h r h s aftb Lbe operatloo 01 the pump 8Ild flow mctnr.
2.2.i Valve: A nardlo valve Ls usod ?o adjust rmnla F!W n o r rate.
2.2.4 Pump. A Imk-he. dinphraCm-type pump. OT rwlvabnt. Is usrd lo transport saml)lc cas to thr. flexible $on. I ~ t s l l n small surge lank bolwwri the pump and nitJ meter b elimlnak the pulsation cUwt 01 &be d l b Iihraum ump on the rolnmetcr.
2.2.6 kate Mch-r. The rolmictcr. or cqiiivalent rala meter used should be rar~ablr of inensurlng flow rnb b d h l n f 2 wrcsnl 01 the srlrcted flow rald. A flow rala nnge of 500 lo loo0 c m h i n is suscrslcd.
2.2.6 Flexlble nac. Any Iak-rrPc plvtic (c.g. Tdlw hlylw, Toilon) or plasliccoalod elunihrim (r.u:, aluini: nlwd bfylar) b x . or cqiiiv.aloiii. Irasinc a CB ronslstcnt with LIie sdccted flow rate and time gi:E fir the test run. may be iiscd. A capacity in the range of 66 Lo Qo Ilbrs is sugcrstcd.
Tolak-check the bnc,connwt ir toawntcrrnanomntcr and prwurire Lhc bn: to 6 to !Ocm rJ?O (2 to .I In. HIO). Allow b stand lor 10 mlnulrs. Any displnccnicn6 In lhe Wnler manometpr Indicoks n Icak. A n nltornellvt leak- check method is la prcs~irirc rhc bnx b 6 to 10 em 1110 t2 to 4 In. Ha) and allow (0 simd overnight. A dellatcd ber lndlaks a lrnk. 22.7 Prossure Gsiige. A waLer-filled C-Liib manom-
rlrw. or eqdvdent. of ahout 28 c u (12 in.) L ussd br tho f l d b e bag 1eakhoc.t.
2q.8 VWltUm GniiEe. A merciiry manometer Q m i w d e n t 01 at l e s t 7 ~ 3 mrn IIP (30 ID. Dg) ir used for thn sampUbg train Ieakshect. 2.3 Analysis. For Ormt and Fyrlto analymr mbin-
bnancaand operation p r d i i r r s . bUow the instnictiorir r s o m m e n d d . by the manufaclurer. Unla olhornim aprrlfled herein.
2.3.1 Dry hfolrrolar Wright Determination. An Orsat hnalyuy 01 Fyrlte typo cohbusllon gan annlyw M Y k a 1 . d . 2.3.2 E m h i o n Rate Corraction Factor or Excess Alr
Datmnination. An Orsst analyzer must be used. For low COI Oass than 4.0 prrcerit) or high 0, krmtar than IS.O$mnt) mnrontraliorls, tlie r n w l r i n g biirptts of Lhe at must have a t lr*L 0.1 percent suhdirisiona.
1. zki M&eular A'cigN Delcrminalion Any of the tbrre snmplinr: and annlytiral procrdurrs
dssrlbed below may Lo used lor doiermininq the dry molrmlar weight. 3.1 Blngle-Point, Orab Sampling and Analytical
Procedure. . 3.1.1 The campling pnlnt in the diict slmll elther bo at the eentmld of the mom sectlon or at a point no c h . r ( O t h e r d k t l i a n 1.C8Im (3.3It).unlassothorw1seopeellied bi the Admlnktralor.
I
TO ANALYZER F l L T t R (GLASS WOOL)
SQUEEZE BULB
Figure 3-1. Grabsampling train.
a- Federa l Register, Vol. 4 2 , No. 1 6 0 - T h u r s d a y , A u g u s t 18, 1 9 7 7 , I
f "7; ,;-

Sect ion No. 3.2.10 Revision No. 0 Date January 15, 1980
RATE METER \ , VALVE
.PRO
DUCK DISCONNECT
I -1 -,VALVE I I & I .A
RIGID CONTAINER
Figure 3-2. Integrated gas-sampling train,
AVERAGE I I - (MUST BE <lo#)
a a = a avg % D E V = (- Q avg ) 100
Figure 3-3. Sampling rate data.

Sect ion N o . 3.2.10 Revision N o . 0 Date January 15, 1980 Page 3 of 3
lrorn KO pcmnt. Cd&b tbe molecular rdght .I indlcabd In W o n b d 1.96 Remt the anslysls and'alciilatlon pmcaduna
untll the lndlrlduel dry molecular rdg l i t a lor M Y threa bmlyscd dlllsr from thclr mean by no more lhan 0.3 yg-mole (0.3 Ibfib-mole). Averwn t b w lh rm molecular wclehls and report tho rtsults ta the nearest 0.1 g/g-rnols (0.1 Ihflb-rnolo).
3.3 Multl-Point, Inagratod Sampling and A n a l y t l d Procedure.
8.3.1 Unlcss othorxisn specified b y 1h0 Adrnlnls- tratar. a rninlmiiiii olvighl traverse poinls shall ba used lor circular stacks baviiig dinmrters lcss then 0.61 m (24 in.). a minimum 01 riiii: slinll he usrd for rcctnnaulnr ctncka hnving e uivalrnt dinmckrs 1153 thaii 0.81 m (2.4 in.). and a ni%lruuin 01 twelve t r a v c m :nir1Cs slrnU be uwd for all ollior rasps. T h e trnvr.rsI? poiiiu shall be located according lo Mrtliod 1. The us0 of fowcr pointa Is n u l h 3 to nlJprovai of the Administrator.
3.3.2 Follow the procedures outllncd in Scolions 3.2.2 through 3.2.5, excrpt for llie bllowlng: travcrsc 611 Sam- pling I)oints end saniple a1 each point for 811 equal length of Limo. Record sampling dala as shown In Figure 3-3.
4. Emlrsion Rdr Corredkm Fador OT & u c c Air Dcla- mindion
tiimin oll tlir pun:^^. 'Xlio v x d u i i sliJ1 r r w d .. hhle lor n l k s t 0 5 niiiaile. EVWBWJ t he ILniible bag. &n- nml tho pmbn and p l w k i n thea(srk r l lh the t ipo l the probep!t ioned at Uia snmp~~iw poiiie piuge h a mm- piing im Next. co!inml the bug and' make Bum (hat nll conncctions nro tight and h k free. 1.2.3 Snmplo a1 n coiatnnt rnlo. or 89 specified by the
Aclniinislrnlor. Tho sninplinR run niiisL bo aiiiiiiltnnrous with and lor llir s i n r . '.ooW longth 01 tirnc 0s tho pollut- nnl biniwion rut0 dctcrminollon. Collccr A1 :cut a0 liton (1.00 ti>) of smnple gns. Smnllw vo\unios may be cvllrcted. subjccl to npproval of I t admiiiislrntor.
Obtain ono intrgrn1.d flue ra sninpln d i i r i q e x l i polliltant cinission rate tlotcrminntion. For emisslon ratr corrrction factor dolcrniinaiion. annlyu: Lhc samplo n.ithin 4 hoiirs aricr it is taken ror wreon t COaor w r m n t 01 ( ~ 9 oullinrd in Sections 4.2.5 through 4.2.7). The
.Orsi t nnalyzcr niusl ba Irak$ l i ckd (scc Bwlion 5) IwropP. Ihb ai~iilvsis. If dscrss air is dwired procred w lullowa: (1) wil'liin 4 hours nfler the sninlhe is t b e n . nnnlyzr it (W i i i Smiions 1.2.5 ihroiqzli 4.2.7) for permiit COY. 01: and C O : C) rlt;irrinine 1Iio prrcci i tqo of tha e:s Lhat IS N I by siiBIrncitng etlic suni of (lie perrrill COI. prrcanl 01. n:!d Iwrcciit CO lroiu JpO rcrnl; (3) -1- C U I R I C prrcciil c x r w air ns oiitlinrri in &tion 6.2.
4 2 . 5 To ciisiiro coi.ii~lrlc obsorplloo of tho C o t . 0,. or i f aplilicnblr. CO. iiian'n rclxatcd ~)asscs Lliroiigh (gCh slvsnrbiiig siilri~lon i i i i 1 1 1 tu.6 consrciilivorradiiigs or@ lhe s;;inr. Suvrrnl pasws itl!r:o or Liurj sliould I w made bo- i w r m riwlinps. ( I f coiwxit rraiUnfi~ :aiiiint b~ o\>thlnrd nrtrr tlirvc cons~~cut ivo rcadines. rerilnco ~ h o absorblnr
1.2.4
4. Miirlirll. W. J. and X I . R. >lid.qett. Fcie:l? Rcl;.iL>;t.:r of Lh0 Orsst Annlyzrr. Journal of Air Pdlution C o n m l Assoclaiion P6:491-4'35. May 1978. S Ehigehara R. T. R. XI. Neullcht a?d W. S. Sniit!i.
Vaiidsliiig Orsit Anhys i s Dnta from'Fm11 hel-Firr;R Unils. Stack Snlnpliiig Sews . 4CZ):?i-'z -4ulyst. I?;%


Section No. 3 . 2 . 1 1 Revision No. 0 Date January 15, 1980 Page 1 of 1
11.0 REFERENCES
1.
2 .
3 .
4.
5.
6.
7.
a.
9.
10 ..
Smith, Franklin, and D. E. Wagoner. Guidelines for Development of a Quality Assurance Program: Volume I1 - Gas Analysis for Carbon Dioxide, Excess Air, and Dry Molecular Weight. EPA-650/4-74-005-6, February 1974.
Mitchell, William J. On-Site Collaborative Test of Method 3 of the New Source Performance Standards Using Modified Orsat Apparatus. Environmental Protection Agency, Research Triangle Park, N.C., November 1973.
Mitchell, William J. On-Site Collaborative Test of Method 3 of the New Source Performance Standards at a Municipal Incinerator. Environmental Protection Agency, Research Triangle Park, N.C., August 1973.
Hamil, H. F. and R . E. Thomas, Collaborative Study of Method for Stack Gas Analysis and Determination of Moisture Fraction with Use of Method 5. Southwest Research Institute. EPA-650/4-74-026, June 1974.
Hamil, H. F. and R. E. Thomas, Collaborative Study of Particulate Emissions Measurements by EPA Methods 2, 3, and 5 Using Paired Particulate Sampling Trains. South- west Research Institute. EPA-600/4-76-014, March 1976.
Flue and Exhaust Gas Analyses. PTC 19.10-1968. American Society of Mechanical Engineers, New York, N.Y., 1968.
Burrell Manual for Gas Analysts. 7th Ed. Burrell Corp. Pittsburgh, Penn., 1951.
Shigehara, R. T., et al. Validating Orsat Analysis Data from Fossil Fuel-Fired Units. Stack Sampling News
Steam Its Generation and Use. 37th Ed. Babcock & Wilcox C o . , N.Y. 1963. pp. 4-11 and 4-12.
Quality Assurance Handbook f o r Air Pollution Measure- ment Systems, Volume I, Principles. EPA-600/9-76-005, Environmental Protection Agency, Research Triangle Park, N. C. March 1976.
4(2) :21-26, August 1976.


Section No. 3.2.12 Revision No. 0 Date January 15, 1980 Page 1 of 6
12.0 DATA FORMS
Blank data forms are provided on the following pages f o r the convenience of the Handbook user. Each blank form has the cus- tomary descriptive title centered at the t o p of the page. How- ever, the section-page documentation in the top right-hand corner of each page of other sections has been replaced with a number in the lower right-hand corner that will enable the user to identify and refer to a similar filled-in form in a text section. For example, Form M3-1.3 indicates that the form is Figure 1.3 in Section 3.2.1 of the Method 3 Handbook. Future revisions of these forms, if any, can be documented by 1 . 3 A , 1.3B, etc. Five of the blank forms listed below are included in this section. Two are in the Methods Highlights Section as shown by the MH following the form number.
Form 1.3 2.1 3.1 (MH) 4 . 1 ( M H ) 4.2 4.3 8.1
Title Procurement Log and R Chart
Pretest Preparations On-Site Measurements Checklist Gas Analysis Data Form Integrated Bag Sampling Data Form Checklist for Method 3 for U s e by the Auditor


x


INTEGRATED BAG SAMPLING DATA FORM
Run number
Date Plant
sampling location
Barometric pressure
Ambient temp. O C Stack temp. OC
Operator
Rate meter flow,
Avg =
Quality Assurance Handbook M3-4.3

CHECKLIST FOR METHOD 3 FOR USE BY THE AUDITOR
Yes No
OPERATION
Presampling Operation
1. Availability of theoretical value 2. Use of modified Orsat analyzer (0.1-ml
divisions)
3 .
4.
5. 6.
7.
8. 9.
10.
11.
12.
1 3 . 14.
On-Site Measurements
Setting up and leak testing the samp- ling train Purging the sampling train with stack gas prior to collecting the sample Constant rate sampling Transfer of sample from collapsible bag to the Orsat analyzer Maintaining constant pressure throughout the test Exposuring the sample to ambient air Spent absorbing reagent
Postsampling Measurements
Perform independent calculations using data from audit Compare the audit value with the field team's test value Make sufficient passes for complete absorption of a component gas Minimize volumetric reading error Check/verify applicable records of apparatus calibration checks and quality control charts in the field team's home laboratory
General Comments
Quality Assurance Handbook M3-8.1