and effective stress - arxiv.org · rheometric measurements on assemblies of wet polystyrene bead...
TRANSCRIPT

arX
iv:1
802.
0817
2v1
[co
nd-m
at.s
oft]
22
Feb
2018
EPJ manuscript No.(will be inserted by the editor)
Shear strength of wet granular materials: macroscopic cohesionand effective stress
Discrete numerical simulations, confronted to experimental measurements
Michel Badetti1, Abdoulaye Fall1, Francois Chevoir1, and Jean-Noel Roux1
Universite Paris-Est, Laboratoire Navier,IFSTTAR, ENPC, CNRS (UMR8205)2 Allee Kepler, Cite Descartes, F-77420 Champs-sur-Marne
Received: date / Revised version: date
Abstract. Rheometric measurements on assemblies of wet polystyrene bead assemblies, in steady uniformquasistatic shear flow, for varying liquid content within the small saturation (pendular) range of isolatedliquid bridges, are supplemented with a systematic study by discrete numerical simulations. The numericalresults agree quantitatively with the experimental ones provided that the intergranular friction coefficientis set to the value µ ≃ 0.09, identified from the behaviour of the dry material. Shear resistance andsolid fraction ΦS are recorded as functions of the reduced pressure P ∗, which, defined as P ∗ = a2σ22/F0,compares stress σ22, applied in the velocity gradient direction, to the tensile strength F0 of the capillarybridges between grains of diameter a, and characterizes cohesion effects. The simplest Mohr-Coulombrelation with P ∗-independent cohesion c applies in good approximation for large enough P ∗ (typicallyP ∗ ≥ 2). Numerical simulations extend to different values of µ and, compared to experiments, to a widerrange of P ∗. The assumption that capillary stresses act similarly to externally applied ones onto the drygranular contact network (effective stresses) leads to very good (although not exact) predictions of theshear strength, throughout the numerically investigated range P ∗ ≥ 0.5 and 0.05 ≤ µ ≤ 0.25. Thus, theinternal friction coefficient µ∗
0 of the dry material still relates the contact force contribution to stresses,σcont12 = µ∗
0σcont22 , while the capillary force contribution to stresses, σcap, defines a generalized Mohr-Coulomb
cohesion c, depending on P ∗ in general. c relates to µ∗
0 , coordination numbers and capillary force networkanisotropy. c increases with liquid content through the pendular regime interval, to a larger extent thesmaller the friction coefficient. The simple approximation ignoring capillary shear stress σcap
12 (referred toas the Rumpf formula) leads to correct approximations for the larger saturation range within the pendularregime, but fails to capture the decrease of cohesion for smaller liquid contents.
PACS. 83.80.Fg Granular materials, rheology – 45.70.-n Granular systems – 62.20.fq Plasticity, rheology
1 Introduction
Wet granular materials [1], in which grains are large enoughfor colloidal forces to be negligible, differ from dry ones bytheir cohesion. On the grain scale, this cohesion is due tothe pressure in the wetting liquid being lower than in thesurrounding atmosphere, and thereby effectively attract-ing the wet grains to one another. For low liquid contents,the wetting liquid, in the so-called pendular regime, formsisolated bridges joining pairs of grains in contact or sep-arated by a short distance. Those liquid bridges transmitan attractive capillary force, depending on grain geome-try, bridge volume and interfacial tension. The value F0 ofthis attractive force for contacting grains sets a force scale,which micromechanical models of dry granular materialsare usually devoid of. Similarly, at the macroscopic scale,a characteristic stress value c is introduced into the plastic
flow criterion, often assumed, for shear flow in direction 1,with velocity gradient in direction 2 (see Fig. 1), to takethe celebrated Mohr-Coulomb form relating shear stressσ12 to normal stress σ22 in the gradient direction as
|σ12| = µ∗
MCσ22 + c, (1)
in which µ∗
MCis the internal friction coefficient and c,
which vanishes for cohesionless materials such as dry sands,is referred to the macroscopic material cohesion. [The ab-solute value written in (1) is due to our sign conventionfor the stress tensor: compressive stresses are positive, andone has σ12 < 0 in a simple shear flow with velocity fieldv1 in direction 1, with gradient ∂v1/∂x2 > 0 (Fig. 1)].Over the past decades, some experimental studies [2,3,4,5] and a larger number of numerical ones [3,5,6,7,8,9,10] have been carried out on wet spherical beads, as amodel material, to investigate macroscopic cohesion val-

2 Badetti et al.: Shear strength of wet granular materials
H
Fig. 1. Sketch of a shear test, in which the material flows alongcoordinate axis x1, with controlled normal stress σ22 along thevelocity gradient direction, coordinate axis x2.
ues and explore, in particular, the relation between F0 andc. Visualizations of liquid bridge networks in such materi-als have been rendered possible in the lab by cleverly de-signed techniques [11,12]. Numerical simulations investi-gate grain-level origins of macroscopic mechanics throughthe “discrete-element method” (DEM), the granular ma-terial analog of molecular dynamics [13]. DEM is directlyapplicable to wet grains in the pendular regime, for whichpairwise additive capillary forces have been suitably mod-eled [14,15,16,12].
The idea that capillary forces, by pressing neighbour-ing grains onto one another, act similarly to an externalisotropic pressure applied to the pack of grains leads tothe following simple relation, between F0 and c, involvingsolid fraction ΦS , grain diameter a and coordination num-ber Z of liquid bridges, and the Mohr-Coulomb internalfriction coefficient:
c = µ∗
MC
ZΦSF0
πa2. (2)
This relation, to which we refer as the Rumpf formula (asit is often attributed to Ref. [17]), was discussed, reestab-lished or reformulated in many publications [4,3,5,9], whichoften found it to provide rather good estimates of themacroscopic cohesion [9].
The assumption that capillary forces have an effectequivalent to an additional isotropic pressure on the co-hesionless grains has nevertheless been criticized, on theground that the capillary stress on the granular networkis not isotropic in conditions of macroscopic yield undershear [7,8,18,10,19]. Those references pointed out that, ifthe yield condition of the wet material is to be likened tothe yield condition of the dry one under some modified,effective stress tensor σeff, then the capillary tensor, σcap
which defines it at σeff = σ−σcap, is not isotropic and has
a non-negligible shear component σcap12 .
These issues are revisited in the present paper, whichdeals, experimentally and numerically, with wet sphericalbead assemblies. We investigate whether wet bead assem-blies satisfy the Mohr-Coulomb relation (1). We use bothexperiments and DEM simulations, for which the system
choice and experimental or numerical setups are describedin Sec. 2. Laboratory experiments are used to quantita-tively validate the numerical simulations, provided the ba-sic material characteristics are correctly identified. Suchidentification is carried out in Sec. 3, based on the proper-ties of dry grains in shear flow. In Sec. 4, the applicabilityof the Mohr-Coulomb criterion is discussed and macro-scopic cohesion c is measured for the laboratory system, aswell as its numerical counterpart. DEM computations arethen used, in Sec. 5, to study the influence of material pa-rameters (intergranular friction coefficient, interfacial ten-sion of the wetting liquid, liquid content) onto macroscopicproperties µ∗
MCand c. Over the explored range of state pa-
rameters, we investigate the possible relation, through thedefinition of some effective stress, of the yield condition ofthe wet material in quasistatic shear to the one of thedry grains, and relate the macroscopic shear resistance tomicromechanical and microstructural variables. Sec. 6 isdevoted to the micromechanical origins of the contributionof capillary forces to shear stress, σcap
12 . In the final part,Sec. 7, the results are summarized and put in perspective.
2 Methods and parameters
2.1 Experimental
We consider assemblies of spherical polystyrene beads,with some narrow diameter distribution about the meanvalue a = 500µm, wet by a non-volatile liquid, a siliconeoil (47V50 provided by Chem+), with interfacial tensionΓ = 20.6mNm−1, and small wetting angle 2 ≤ θ ≤ 5.A fixed (small) amount of liquid is first mixed with thebeads. We denote as ΦL and ΦS the volume fractions ofthe liquid and of the solid beads in the system. Since thesample is allowed to dilate, both volume fractions vary.We refer to their fixed ratio, ΦL/ΦS as the liquid content.The saturation, S, is given by
S =ΦL
1− ΦS.
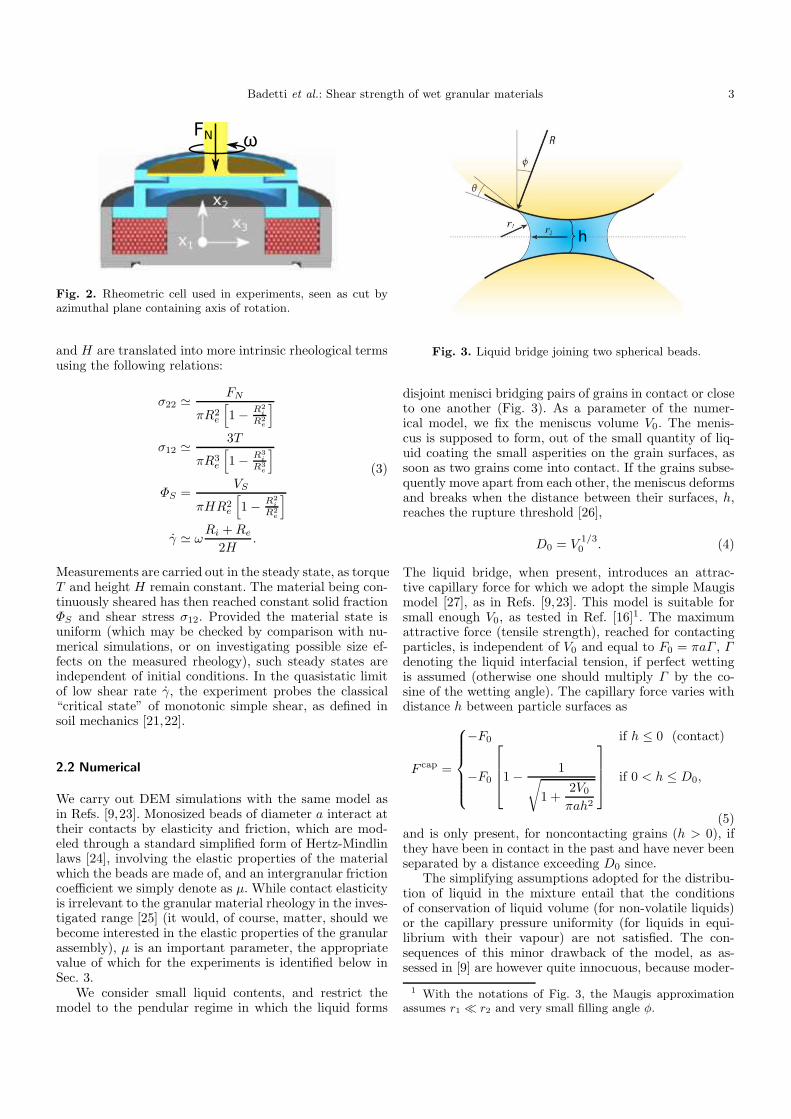
The wet system is then placed inside a rotative annularrheometer as represented in Fig. 2. This apparatus is thesame as the one used in Ref. [20], which can be consultedfor more details. The annulus-shaped cell containing thegrains is limited by smooth cylindrical walls in the radialdirection, and by a rough bottom surface underneath. Itis closed on top by the inferior rough surface of a mobilelid, which moves in rotation about the axis at a prescribedangular velocity ω, while its vertical position (the coordi-nate x2 of the cell “ceiling” in Fig. 2, or the cell height H)is free to adjust in order to exert a controlled vertical forceFN onto the granular sample. We measure the torque, T ,that is necessary to maintain a fixed, prescribed value ofω, in the steady state, as well as the sample height H .Denoting as Ri and Re the inner and the outer radius ofthe annular cell, and as VS the total volume of the beads,control parameters ω and FN , and measured quantities T
Badetti et al.: Shear strength of wet granular materials 3
FNω
Fig. 2. Rheometric cell used in experiments, seen as cut byazimuthal plane containing axis of rotation.
and H are translated into more intrinsic rheological termsusing the following relations:
σ22 ≃FN
πR2e
[
1−R2
i
R2e
]
σ12 ≃3T
πR3e
[
1−R3
i
R3e
]
ΦS =VS
πHR2e
[
1−R2
i
R2e
]
γ ≃ ωRi +Re
2H.
(3)
Measurements are carried out in the steady state, as torqueT and height H remain constant. The material being con-tinuously sheared has then reached constant solid fractionΦS and shear stress σ12. Provided the material state isuniform (which may be checked by comparison with nu-merical simulations, or on investigating possible size ef-fects on the measured rheology), such steady states areindependent of initial conditions. In the quasistatic limitof low shear rate γ, the experiment probes the classical“critical state” of monotonic simple shear, as defined insoil mechanics [21,22].
2.2 Numerical
We carry out DEM simulations with the same model asin Refs. [9,23]. Monosized beads of diameter a interact attheir contacts by elasticity and friction, which are mod-eled through a standard simplified form of Hertz-Mindlinlaws [24], involving the elastic properties of the materialwhich the beads are made of, and an intergranular frictioncoefficient we simply denote as µ. While contact elasticityis irrelevant to the granular material rheology in the inves-tigated range [25] (it would, of course, matter, should webecome interested in the elastic properties of the granularassembly), µ is an important parameter, the appropriatevalue of which for the experiments is identified below inSec. 3.
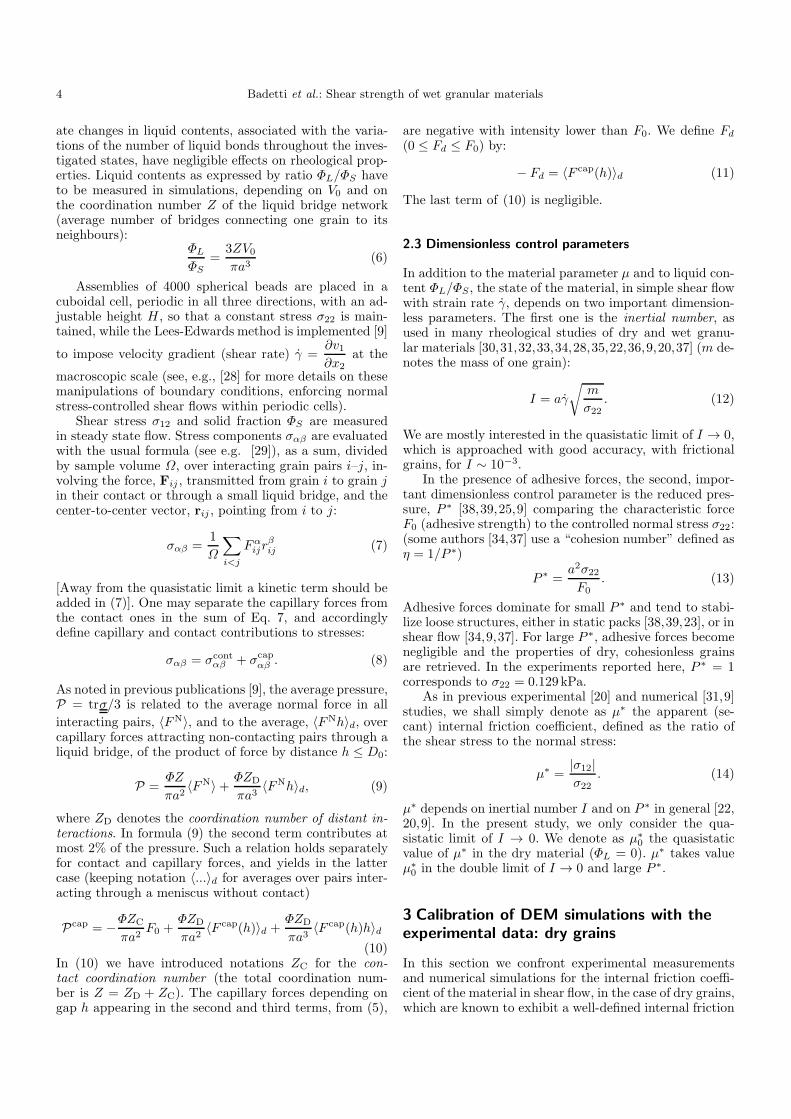
We consider small liquid contents, and restrict themodel to the pendular regime in which the liquid forms
h
Fig. 3. Liquid bridge joining two spherical beads.
disjoint menisci bridging pairs of grains in contact or closeto one another (Fig. 3). As a parameter of the numer-ical model, we fix the meniscus volume V0. The menis-cus is supposed to form, out of the small quantity of liq-uid coating the small asperities on the grain surfaces, assoon as two grains come into contact. If the grains subse-quently move apart from each other, the meniscus deformsand breaks when the distance between their surfaces, h,reaches the rupture threshold [26],
D0 = V1/30 . (4)
The liquid bridge, when present, introduces an attrac-tive capillary force for which we adopt the simple Maugismodel [27], as in Refs. [9,23]. This model is suitable forsmall enough V0, as tested in Ref. [16]1. The maximumattractive force (tensile strength), reached for contactingparticles, is independent of V0 and equal to F0 = πaΓ , Γdenoting the liquid interfacial tension, if perfect wettingis assumed (otherwise one should multiply Γ by the co-sine of the wetting angle). The capillary force varies withdistance h between particle surfaces as
F cap =
−F0 if h ≤ 0 (contact)
−F0
1−1
√
1 +2V0
πah2
if 0 < h ≤ D0,
(5)and is only present, for noncontacting grains (h > 0), ifthey have been in contact in the past and have never beenseparated by a distance exceeding D0 since.
The simplifying assumptions adopted for the distribu-tion of liquid in the mixture entail that the conditionsof conservation of liquid volume (for non-volatile liquids)or the capillary pressure uniformity (for liquids in equi-librium with their vapour) are not satisfied. The con-sequences of this minor drawback of the model, as as-sessed in [9] are however quite innocuous, because moder-
1 With the notations of Fig. 3, the Maugis approximationassumes r1 ≪ r2 and very small filling angle φ.
4 Badetti et al.: Shear strength of wet granular materials
ate changes in liquid contents, associated with the varia-tions of the number of liquid bonds throughout the inves-tigated states, have negligible effects on rheological prop-erties. Liquid contents as expressed by ratio ΦL/ΦS haveto be measured in simulations, depending on V0 and onthe coordination number Z of the liquid bridge network(average number of bridges connecting one grain to itsneighbours):
ΦL
ΦS=
3ZV0
πa3(6)
Assemblies of 4000 spherical beads are placed in acuboidal cell, periodic in all three directions, with an ad-justable height H , so that a constant stress σ22 is main-tained, while the Lees-Edwards method is implemented [9]
to impose velocity gradient (shear rate) γ =∂v1∂x2
at the
macroscopic scale (see, e.g., [28] for more details on thesemanipulations of boundary conditions, enforcing normalstress-controlled shear flows within periodic cells).
Shear stress σ12 and solid fraction ΦS are measuredin steady state flow. Stress components σαβ are evaluatedwith the usual formula (see e.g. [29]), as a sum, dividedby sample volume Ω, over interacting grain pairs i–j, in-volving the force, Fij , transmitted from grain i to grain jin their contact or through a small liquid bridge, and thecenter-to-center vector, rij , pointing from i to j:
σαβ =1
Ω
∑
i<j
Fαijr
βij (7)
[Away from the quasistatic limit a kinetic term should beadded in (7)]. One may separate the capillary forces fromthe contact ones in the sum of Eq. 7, and accordinglydefine capillary and contact contributions to stresses:
σαβ = σcontαβ + σcap
αβ . (8)
As noted in previous publications [9], the average pressure,P = trσ/3 is related to the average normal force in all
interacting pairs, 〈FN〉, and to the average, 〈FNh〉d, overcapillary forces attracting non-contacting pairs through aliquid bridge, of the product of force by distance h ≤ D0:
P =ΦZ
πa2〈FN〉+
ΦZD
πa3〈FNh〉d, (9)
where ZD denotes the coordination number of distant in-teractions. In formula (9) the second term contributes atmost 2% of the pressure. Such a relation holds separatelyfor contact and capillary forces, and yields in the lattercase (keeping notation 〈...〉d for averages over pairs inter-acting through a meniscus without contact)
Pcap = −ΦZC
πa2F0 +
ΦZD
πa2〈F cap(h)〉d +
ΦZD
πa3〈F cap(h)h〉d
(10)In (10) we have introduced notations ZC for the con-tact coordination number (the total coordination num-ber is Z = ZD + ZC). The capillary forces depending ongap h appearing in the second and third terms, from (5),
are negative with intensity lower than F0. We define Fd
(0 ≤ Fd ≤ F0) by:
− Fd = 〈F cap(h)〉d (11)
The last term of (10) is negligible.
2.3 Dimensionless control parameters
In addition to the material parameter µ and to liquid con-tent ΦL/ΦS , the state of the material, in simple shear flowwith strain rate γ, depends on two important dimension-less parameters. The first one is the inertial number, asused in many rheological studies of dry and wet granu-lar materials [30,31,32,33,34,28,35,22,36,9,20,37] (m de-notes the mass of one grain):
I = aγ
√
m
σ22
. (12)
We are mostly interested in the quasistatic limit of I → 0,which is approached with good accuracy, with frictionalgrains, for I ∼ 10−3.
In the presence of adhesive forces, the second, impor-tant dimensionless control parameter is the reduced pres-sure, P ∗ [38,39,25,9] comparing the characteristic forceF0 (adhesive strength) to the controlled normal stress σ22:(some authors [34,37] use a “cohesion number” defined asη = 1/P ∗)
P ∗ =a2σ22
F0
. (13)
Adhesive forces dominate for small P ∗ and tend to stabi-lize loose structures, either in static packs [38,39,23], or inshear flow [34,9,37]. For large P ∗, adhesive forces becomenegligible and the properties of dry, cohesionless grainsare retrieved. In the experiments reported here, P ∗ = 1corresponds to σ22 = 0.129kPa.
As in previous experimental [20] and numerical [31,9]studies, we shall simply denote as µ∗ the apparent (se-cant) internal friction coefficient, defined as the ratio ofthe shear stress to the normal stress:
µ∗ =|σ12|
σ22
. (14)
µ∗ depends on inertial number I and on P ∗ in general [22,20,9]. In the present study, we only consider the qua-sistatic limit of I → 0. We denote as µ∗
0 the quasistaticvalue of µ∗ in the dry material (ΦL = 0). µ∗ takes valueµ∗
0 in the double limit of I → 0 and large P ∗.
3 Calibration of DEM simulations with the
experimental data: dry grains
In this section we confront experimental measurementsand numerical simulations for the internal friction coeffi-cient of the material in shear flow, in the case of dry grains,which are known to exhibit a well-defined internal friction

Badetti et al.: Shear strength of wet granular materials 5
coefficient, but no macroscopic cohesion: relation (1) iswell satisfied with a finite µ∗
MC= µ∗
0 and c = 0 [µ∗
MCis the
σ22-independent value of µ∗ in (14)]. Experiments, carried
out for 0.3 kPa ≤ σ22 ≤ 3 kPa, yield µ∗
0 = 0.25 ± 0.02 inslow, steady shear flow, while the system solid fractionstabilizes at ΦS = 0.615± 0.002.
In the numerical simulations, both µ∗
0 = |σ12|/σ22 andΦS , as observed in quasistatic flow, depend on intergran-ular friction coefficient µ, as shown in Fig. 4. As previ-
Fig. 4. Internal friction coefficient µ∗ and solid fraction ΦS
measured in numerically simulated steady quasistatic shearflow of dry grains, versus intergranular friction coefficient µ.Values obtained for µ = 0.09 are shown with red lines.
ously reported [40], ΦS is a decreasing function of µ, whileµ∗ increases, both starting at the well-defined values forµ = 0 [28], i.e., the “random close packing” solid fractionnear 0.64, and the internal friction coefficient of assembliesof frictionless beads, µ∗ ≃ 0.1.
Remarkably, both quantities nearly simultaneously re-produce the experimental results for µ = 0.09: numericalvalues are then µ∗
0 = 0.257 ± 0.002 and ΦS = 0.6150 ±3× 10⁻⁴. This value µ = 0.09 of the intergranular fric-tion coefficient is thus adopted in the following in order tosimulate the material tested in the laboratory.
Furthermore, the quantitative agreement between nu-merical and experimental results is observed to extend toflows with inertial effets: the I dependence of both quan-tities µ∗ and ΦS , as observed in the laboratory, is wellreproduced by the numerical simulations, as apparent inFig. 5. We are thus in a good position to confront numer-ical results to experimental ones in the case of wet grains,and to discuss the definition of cohesion c and the influ-ence of P ∗ and ΦL/ΦS on the material behaviour.
4 Mohr-Coulomb cohesion: experimental and
numerical results
Once the intergranular friction coefficient is identified fromthe rheology of dry bead assemblies, assuming the value ofµ does not change in the presence of the wetting liquid, we
(a)
10-3 10-2 10-10.24
0.26
0.28
0.30
0.32
0.34
0.36
0.38
I
(b)
10-3 10-2 10-1
0.595
0.600
0.605
0.610
0.615
S
I
Fig. 5. I-dependent internal friction coefficient µ∗ (a) and solidfraction ΦS (b), for both laboratory (round dots) and numericalresults (data points joined by continuous line), computed withµ = 0.09.
turn to the identification of µ∗ and c, the parameters of aMohr-Coulomb relation applying to the chosen material.
Classically, these parameters are measured on fitting astraight line through the values of σ12 plotted versus σ22.Alternatively, it might prove convenient to search for anormalized, dimensionless cohesion, defined as
c∗ =a2c
F0
, (15)
and to study the variations, at small enough I, of stressratio µ∗ (see Eq. 14) versus P ∗, thereby reformulating theMohr-Coulomb relation as
|σ12|
σ22
= µ∗
MC+
c∗
P ∗. (16)
One may thus seek a linear variation of stress ratio µ∗
with 1/P ∗.For large P ∗, adhesive capillary forces become negligi-
ble, and the material behaviour should be the same as inthe absence of the wetting fluid. If a Mohr-Coulomb cri-terion applies, then parameter µ∗
MCnecessarily coincides
with the internal friction coefficient of the dry material,µ∗
0 (equal to 0.25± 0.02 in the present case).

6 Badetti et al.: Shear strength of wet granular materials
4.1 Parameter range
In experiments, practical limitations apply to the values ofP ∗. First, stresses within the sample should remain rea-sonably homogeneous. Vertical stress σ22 varies throughthe thickness of the sample, due to the weight of the grains,and the results are given as functions of the average value,at mid-height. In practice we do not often record rheologi-cal characteristics for P ∗ below 2.3 (σ22 = 0.3 kPa), whichcorrespond to relative stress variations (∆σ22)/σ22 above5% within the sample. Furthermore, it proves difficult inpractice to control low levels of stress. Thus states withP ∗ = 1.55 and P ∗ = 0.773 are only satisfactorily obtainedfor the largest liquid content, ΦL/ΦS = 0.075 (with, how-ever, (∆σ22)/σ22 reaching 0.2). Simulation results extenddown to P ∗ = 0.5, but smaller confining stresses makeit difficult to observe uniform flows, due to strong strainlocalization tendencies, as reported in Ref. [9]. This ear-lier work introduced localization indicator ∆, computedfrom velocity profiles v1(x2) across the cell in the gradientdirection (for −H/2 ≤ x2 ≤ H/2) as
∆ =12
H3γ2
∫ H/2
−H/2
[v1(x2)− γx2]2dx2. (17)
Shear flow and boundary conditions are enforced such that∆ vanishes if the shear rate is uniform, and ∆ is equal to1 if the case of an infinitely thin shear band between twosolid blocks sliding on each other. We checked that its timeaverage did not exceed 0.05 for all P ∗ ≥ 0.5, in agreementwith [9] (with fluctuations of order 0.1 for P ∗ = 0.5, thecase with the larger departures from the average linearvelocity profile).
Liquid content ΦL/ΦS , as noted in Sec. 2.2, is notrigourously constant if V0 is kept fixed while normal stressvaries, but, as shown in Fig. 6, its variations are not re-ally significant. The correspondence between liquid con-
0.0 0.5 1.0 1.5 2.00.00
0.01
0.02
0.03
0.04
0.05
0.06
0.07
L/S
1/P
Fig. 6. Liquid content ΦL/ΦS versus P ∗ for the 5 differentvalues of V0/a
3 used in the simulations (see Table 1).
tent and meniscus volume is given by Table 1. The menis-cus volume associated with the upper limit of the pendu-lar range, reached as the menisci joining three beads, each
Table 1. Approximate correspondence (see Fig. 6 – we use thevalue of the liquid content corresponding to P ∗ = 3) betweenprescribed meniscus volume and liquid content.
V0/a3 5.10−4 10−3 2.10−3 4.10−3 8.10−3
ΦL/ΦS 0.003 0.007 0.014 0.030 0.063
one in contact with the other two, start to merge, is about8.10−3a3 [9], from which we set the maximum value in Ta-ble 1. Laboratory measurements cover roughly the samerange of liquid contents.
4.2 Measurement of a macroscopic cohesion
Fig. 7 shows how linear relation (16) may be used to iden-tify values of cohesion c (or c∗, see Eq. 15), for both ex-perimental and numerical results. Eq. 16 is a successful
0.00 0.25 0.50 0.75 1.000.20
0.25
0.30
0.35
0.40
0.45
0.50
0.55
0.60
1/P
Fig. 7. Experimental (+ symbols) and numerical (crossedhollow triangles) results for stress ratio |σ12|/σ22 versus 1/P ∗
for ΦL/ΦS = 0.03. Data fitted with Eq. 16 (dotted lines) forP ∗ ≥ 2.3.
fit to the data for P ∗ ≥ 2.3. The straight lines interceptthe vertical axis at nearly the same values for experimen-tal and numerical data, both confirming µ∗
MC= µ∗
0 (thedata appear to indicate a very slightly smaller frictioncoefficient in the experiment). The figure also illustratesthe good agreement between simulations and experimentsfor reduced cohesions c∗: both straight lines are parallel.For smaller P ∗, the shear resistance is overestimated bythe Mohr-Coulomb criterion fitted to larger P ∗ values.For P ∗ ≥ 1 the discrepancy is apparently larger with ex-perimental results, but we already pointed out (Sec. 4.1)that laboratory measurements are more problematic inthat range. On identifying (dimensionless) cohesion c∗ forvarying liquid contents by the same fitting procedure, oneobtains the cohesion values shown in Fig. 8. This figure
Badetti et al.: Shear strength of wet granular materials 7
0.00 0.02 0.04 0.06 0.080.00
0.04
0.08
0.12
0.16
0.20
0.24
0.28
0.32
0.36
0.40
C
L/ S
Experimental Numerical Theory (Rumpf) Theory (generalized)
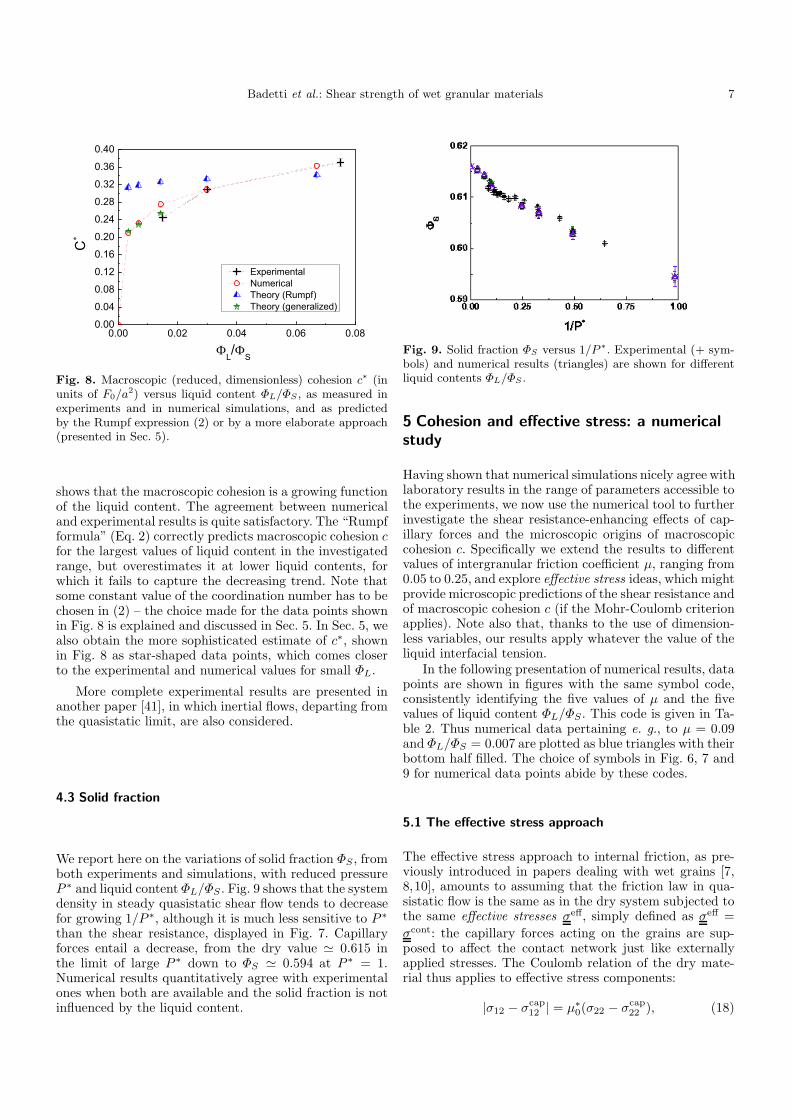
Fig. 8. Macroscopic (reduced, dimensionless) cohesion c∗ (inunits of F0/a
2) versus liquid content ΦL/ΦS , as measured inexperiments and in numerical simulations, and as predictedby the Rumpf expression (2) or by a more elaborate approach(presented in Sec. 5).
shows that the macroscopic cohesion is a growing functionof the liquid content. The agreement between numericaland experimental results is quite satisfactory. The “Rumpfformula” (Eq. 2) correctly predicts macroscopic cohesion cfor the largest values of liquid content in the investigatedrange, but overestimates it at lower liquid contents, forwhich it fails to capture the decreasing trend. Note thatsome constant value of the coordination number has to bechosen in (2) – the choice made for the data points shownin Fig. 8 is explained and discussed in Sec. 5. In Sec. 5, wealso obtain the more sophisticated estimate of c∗, shownin Fig. 8 as star-shaped data points, which comes closerto the experimental and numerical values for small ΦL.
More complete experimental results are presented inanother paper [41], in which inertial flows, departing fromthe quasistatic limit, are also considered.
4.3 Solid fraction
We report here on the variations of solid fraction ΦS , fromboth experiments and simulations, with reduced pressureP ∗ and liquid content ΦL/ΦS . Fig. 9 shows that the systemdensity in steady quasistatic shear flow tends to decreasefor growing 1/P ∗, although it is much less sensitive to P ∗
than the shear resistance, displayed in Fig. 7. Capillaryforces entail a decrease, from the dry value ≃ 0.615 inthe limit of large P ∗ down to ΦS ≃ 0.594 at P ∗ = 1.Numerical results quantitatively agree with experimentalones when both are available and the solid fraction is notinfluenced by the liquid content.
Fig. 9. Solid fraction ΦS versus 1/P ∗. Experimental (+ sym-bols) and numerical results (triangles) are shown for differentliquid contents ΦL/ΦS .
5 Cohesion and effective stress: a numerical
study
Having shown that numerical simulations nicely agree withlaboratory results in the range of parameters accessible tothe experiments, we now use the numerical tool to furtherinvestigate the shear resistance-enhancing effects of cap-illary forces and the microscopic origins of macroscopiccohesion c. Specifically we extend the results to differentvalues of intergranular friction coefficient µ, ranging from0.05 to 0.25, and explore effective stress ideas, which mightprovide microscopic predictions of the shear resistance andof macroscopic cohesion c (if the Mohr-Coulomb criterionapplies). Note also that, thanks to the use of dimension-less variables, our results apply whatever the value of theliquid interfacial tension.
In the following presentation of numerical results, datapoints are shown in figures with the same symbol code,consistently identifying the five values of µ and the fivevalues of liquid content ΦL/ΦS . This code is given in Ta-ble 2. Thus numerical data pertaining e. g., to µ = 0.09and ΦL/ΦS = 0.007 are plotted as blue triangles with theirbottom half filled. The choice of symbols in Fig. 6, 7 and9 for numerical data points abide by these codes.
5.1 The effective stress approach
The effective stress approach to internal friction, as pre-viously introduced in papers dealing with wet grains [7,8,10], amounts to assuming that the friction law in qua-sistatic flow is the same as in the dry system subjected tothe same effective stresses σeff, simply defined as σeff =
σcont: the capillary forces acting on the grains are sup-posed to affect the contact network just like externallyapplied stresses. The Coulomb relation of the dry mate-rial thus applies to effective stress components:
|σ12 − σcap12 | = µ∗
0(σ22 − σcap22 ), (18)

8 Badetti et al.: Shear strength of wet granular materials
Table 2. Choice of symbols used to identify intergranular friction coefficient µ and liquid content ΦL/ΦS in subsequent figuresshowing numerical simulation results. Colour codes for liquid contents are doubled by filling pattern.
µ 0.05 0.09 0.15 0.20 0.25Shape squares triangles circles stars downward triangles
ΦL/ΦS 0.003 0.007 0.014 0.030 0.063Colour red blue green black purpleFilling filled half (bottom) hollow crossed half (top)
This prediction is directly tested on measuring contactstresses σcont = σ − σcap and plotting, in Fig. 10, ratios
|σcont12 |/σcont
22 versus P ∗ for different intergranular frictioncoefficients µ and liquid contents ΦL/ΦS . The Coulomb
0 4 8 12 16
0.22
0.24
0.26
0.28
0.30
0.32
0.34
cont
12/
cont
22
P
Fig. 10. |σcont12 |/σcont
22 versus P ∗ for all available values of fric-tion coefficient µ and meniscus volume V0. Horizontal linesshow µ-dependent values of µ∗
0. Symbols listed in Table 2.
relation for effective stresses, as written in Eq. 18, involv-ing the µ-dependent internal friction coefficient µ∗
0 of thedry material (as shown in Fig. 4), provides a very good ap-proximation of the material shear resistance in all studiedcases. Larger discrepancies (between 5 and 10%) tend tobe observed for the smallest P ∗ values, for small µ (as µ∗
0
decreases and the relative importance of capillary effectsincreases), and for the largest meniscus volumes.
A possible clue to the remarkable success of the ef-fective stress approach is that the changes in the contactnetwork of the sheared material remain moderate betweenP ∗ = 0.5 and the cohesionless limit of P ∗ = ∞. Thus,Fig. 11a shows that contact coordination numbers hardlyvary with P ∗ and with liquid content, and are significantlyinfluenced by friction coefficient µ (data points cluster bysymbol shape, see Table 2). This contrasts with the be-havior of ZD (Fig. 11b), which varies between 1 and 3.2for the investigated parameter range and is essentially de-termined by ΦL/ΦS (encoded as colour and filling, seeTable 2). ZD also increases moderately with P ∗.
As to the solid fraction, ΦS , Fig. 12 shows its variationwith P ∗ in quasistatic shear flow for the different valuesof friction coefficient µ, and liquid content ΦL/ΦS . A de-creasing function of µ, ΦS varies moderately with reducednormal stress P ∗, with a difference of 0.03 or 0.04 between
(a)
0.0 0.5 1.0 1.5 2.04.75
5.00
5.25
5.50
5.75
6.00
z C
1/P
(b)
0.0 0.5 1.0 1.5 2.00.8
1.2
1.6
2.0
2.4
2.8
3.2
z D
1/P
Fig. 11. Variations with P ∗ of (a) contact coordination num-ber ZC and (b) coordination number ZD of distant interactionsthrough liquid bridges, for different values of µ and ΦL/ΦS , en-coded as in Table 2.
the cohesionless limit of large P ∗ and the lowest studiedvalue P ∗ = 0.5. It is very nearly independent of liquidcontent (as signaled by the clustering of points by symbolshape in Fig. 12).
To probe situations when the effective stress approachis more likely to fail by large amounts, one would needto study smaller P ∗ values, for which cohesion-dominatedsystems strongly depart from cohesionless ones in their mi-crostructure [9,23]. As already mentioned, it then provesdifficult to observe steady uniform shear flows, due tostrain localization in shear bands.

Badetti et al.: Shear strength of wet granular materials 9
Fig. 12. Variations of solid fraction ΦS with P ∗, for differentvalues of µ and ΦL/ΦS (symbols as in Table 2).
5.2 Shear strength.
The Coulomb condition for effective stresses, Eq. 18, isequivalent to this expression of apparent friction coeffi-cient µ∗ = |σ12|/σ22:
µ∗ = µ∗
0(1−σcap22
σ22
)−σcap12
σ22
, (19)
which is satisfied in very good approximation. As a con-sequence of the sign of capillary forces, ratio σcap
22 /σ22 isnegative and is the cause of the considerable increase ofshear resistance of the wet material compared to the dryone. The wet material is similar to the dry one, to whicha larger normal stress σcont
22 = σ22 − σcap22 > σ22 is ap-
plied [9]. On the other hand, as σcap12 is positive while the
total shear stress σ12 is negative, the capillary force con-tributions to shear stress tends to decrease the materialshear resistance.
We now discuss possible estimation schemes to predictthe different capillary stress terms appearing in Eq. 19,so that the shear resistance of the wet material could bededuced from the internal friction coefficient µ∗
0 as identi-fied in the dry case, supplemented with the values of a fewinternal variables such as coordination numbers or fabricparameters.
Capillary stress component σcap22 , first, in view of the
relatively small differences between normal stresses [9], isclose to the capillary contribution to the average stress,Pcap: we explicitly checked that the relative differencenever exceeds 3% throughout our data set, remaining be-tween 1 and 2% in most cases.
Exploiting relation (10), Pcap may be written as
Pcap = −Z∗ΦSF0
πa2, (20)
Z∗ denoting some effective coordination number, largerthan the contact coordination number ZC, and smallerthan the total coordination number Z = ZC + ZD, suchthat the average capillary force for distant pairs, −Fd,satisfies
ZDFd + ZCF0 = Z∗F0. (21)
Replacing σcap22 by Pcap evaluated by (20) in relation 19,
one obtains:
µ∗ = µ∗
0(1 +ΦSZ
∗
πP ∗)−
σcap12
σ22
. (22)
Finally, a third level of approximation is obtained ondiscarding σcap
12 in (22):
µ∗ = µ∗
0(1 +ΦSZ
∗
πP ∗). (23)
We checked that relation (22), involving the estimation ofσcap22 with approximate relation (20) still provides a very
good prediction of stress ratio µ∗. Neglecting the capillaryforce contribution to the shear stress as in (23), as notedin [19], leads to somewhat poorer predictions of the shearstrength, overestimated by 20–30% in some cases. This is
0.2 0.4 0.6 0.8 1.0 1.20.2
0.4
0.6
0.8
1.0
1.2
measured
pred
icte
d
Fig. 13. Predicted values of stress ratio µ∗ using Eq. 23, versusmeasured ones, for all values of µ and ΦL/ΦS . Symbol codesas in Tab. 2.
illustrated in Fig. 13. It might be noted, too, that the errortends to grow as the liquid content decreases (from top-half filled, purple symbols, to red, filled ones, see Table 2).The importance and the origins of shear capillary stressesare further discussed in Sec. 6 below. We note, however,that expression 23 might still provide an acceptable esti-mate of shear resistance in a smaller P ∗ interval.
Fig. 14 shows that a better prediction is obtained ingeneral on including the capillary shear stress, as in Eq. 22.From the dry value µ∗
0 ≃ 0.2 obtained with µ = 0.05 andlarge P ∗ up to the value of µ∗, approaching one, corre-sponding to the system with µ = 0.25, ΦL/ΦS ≃ 0.063under P ∗ = 0.5, all observed values of apparent frictioncoefficient are satisfactorily predicted from the effectivestress assumption.
In Sec. 5.3 below, we discuss predictions of the Mohr-Coulomb cohesion, as defined and measured in Sec. 4.2(see Fig. 8), corresponding to both estimates (22) and (23)of the shear resistance.

10 Badetti et al.: Shear strength of wet granular materials
0.2 0.4 0.6 0.8 1.0 1.20.2
0.4
0.6
0.8
1.0
1.2
pred
icte
d
measured
Fig. 14. Predicted values of stress ratio µ∗ using Eq. 22, versusmeasured ones, for all values of µ and ΦL/ΦS . Symbol codesas in Tab. 2.
5.3 Macroscopic cohesion
On identifying the macroscopic cohesion by fitting a lineardependence to the variations of µ∗ = |σ12|/σ22 with 1/P ∗
(see Eq. 16 and Fig. 7), the resulting values, for differentintergranular friction coefficients, are shown in Fig. 15.Reduced cohesion c∗ increases with µ and with the liquid
0.00 0.05 0.10 0.15 0.20 0.25 0.300.0
0.1
0.2
0.3
0.4
0.5
C
Fig. 15. Reduced cohesion c∗ for different liquid contentsΦL/ΦS (values encoded as in Table 2), versus intergranularfriction coefficient µ, as measured using Eq. 16.
content, typically by 30 to 50% over the explored intervalof each variable. A similar moderate increase of macro-scopic cohesion with liquid content or saturation throughthe interval corresponding to the pendular regime is re-ported in a number of DEM studies and experimentalmeasurements on wet bead assemblies [42,5,7].
Relation 23 is equivalent to the Mohr-Coulomb crite-rion (16) and thus provides an expression of c∗:
c∗ =ΦSZ
∗µ∗
0
π. (24)
One recognizes of course the classical Rumpf formula, aswritten in (2) (with a slightly modified definition of the
appropriate coordination number, see Eq. 21). A constant,P ∗-independent value of c∗ might be obtained, as a goodapproximation in view of the limited variations of coordi-nation numbers and solid fraction (see Figs. 11 and 12),on averaging expression 24 over some range of P ∗. Fig. 8compares this “Rumpf formula” estimate of the cohesion,averaged for P ∗ ≥ 2.3, to its value obtained by fittingthe Mohr-Coulomb relation (16) to the data in the samerange.
We find that Fd, as defined in (11), depends on liq-uid content, more than on µ. It hardly varies with P ∗,and remains between 0.48 × F0 and 0.6 × F0 for P ∗ ≥ 2,with maxima near 0.7× F0 for the lowest P ∗ values. Theapproximation Z∗ = ZC + 0.5 × ZD [see Eq. 21] may beused in Eq. 24. Fig. 16 compares the resulted estimatedc∗ values (equal to the “Rumpf formula” data of Fig. 8)to the measured ones, shown in Fig. 15. (As a check onan estimate of macroscopic cohesion, the values shown inFig. 16 should only matter for 1/P ∗ < 0.5, for which theMohr-Coulomb criterion applies. For smaller P ∗, the datapoints on the figure merely show the variations of capillarynormal stress σcap
22 ).
0.0 0.5 1.0 1.5 2.00.8
0.9
1.0
1.1
1.2
1.3
1.4
1.5
0zS/
C
1/P
Fig. 16. Ratio of reduced cohesion c∗ as predicted by Eq. 24to its directly identified value, through a fit of data to Eq. 16,versus 1/P ∗, for different friction coefficients and liquid con-tents. Symbol codes as in Table 2.
Despite the satisfactory agreement already recordedin Fig. 8 for µ = 0.09 and ΦL/ΦS ≥ 0.03, Fig. 16 showsthat the accuracy of the prediction of Eq. 16 may sig-nificantly deteriorate for lower liquid contents, especiallyfor small friction coefficients (i.e., from Table 2, for datapoints shown as squares and triangles).
In Ref. [9], it was pointed out that estimate (24) ap-plied satisfactorily to the experimental results of Pierratet al. [4] and Richefeu et al. [5]2. One advantage of pre-diction (24) is its simplicity [43]. In practice coordination
2 In Ref. [5] a theoretical estimate of cohesion c is used, dif-fering from Eq. 24 by a factor of 3/2, but it may be arguedthat the uncertainty in measured values of c in [5] is such thatour prediction is acceptable as well. The estimate of [5] is re-produced in [7,22].

Badetti et al.: Shear strength of wet granular materials 11
numbers could be obtained from accurate X-ray tomog-raphy observations [11], or perhaps inferred from elasticmoduli [44].
Beyond the simple estimation of (24), the success ofthe effective stress approach justifies the definition of a co-hesion in a generalized sense, as the contribution of capil-lary forces to shear resistance, in addition to the effects ofthe dry material internal friction coefficient µ∗
0, which stillrelates elastic-frictional components of the contact stresstensor, σcont. This leads to a possibly P ∗-dependent re-duced macroscopic cohesion c∗ given by:
c∗g(P∗) =
µ∗
0ΦSZ∗
π−
a2σcap12
F0
, (25)
in which the Rumpf estimate (24) gets corrected by thesecond term. Fig. 17, analagously to Fig. 16, compares
0.0 0.5 1.0 1.5 2.00.8
0.9
1.0
1.1
Cg/C
1/P
Fig. 17. Ratio of generalized cohesion c∗g as predicted byEq. 25 to its value identified by a Mohr-Coulomb fit of thedata, versus 1/P ∗, for different friction coefficients and smallliquid contents. Symbol codes as in Table 2.
this generalized cohesion to the value obtained by a Mohr-Coulomb fit to the data. Prediction (25) achieves satisfac-tory accuracy in the range of parameters for which (24)fails. For larger liquid contents, as the simpler predictionof (24) is fairly accurate, we observe no improvement onusing Eq. (25) instead. Expression (25) is compared to ex-perimental data at low liquid content (and to numericalones with the experimentally relevant value µ = 0.09 ofthe intergranular friction coefficient) in Fig. 8.
Interestingly, Shen et al., in a DEM study of triaxialcompression of wet bead assemblies [10], also showed thatthe deviator part of the capillary stress tensor contributesnegatively to the macroscopic cohesion.
In order to relate c∗g, as defined by Eq. 25, or the shearstrength, as written in Eq. 19, to characteristic state vari-ables, Sec. 6 below investigates the micromechanical ori-gins of capillary shear stress σcap
12 .
6 Capillary shear stresses.
As the direct contribution of capillary forces to shear stress,σcap12 , should not be neglected in general, we now investi-
gate its dependence on control parameters (Sec. 6.1), andits microscopic origins (Sec. 6.2), highlighting the differ-ent roles of capillary forces in contacting and distant pairs.The specific contribution of the latter, which, to a largeextent, explains the dependence of shear strength and co-hesion on liquid content ΦL/ΦS , is related in Sec. 6.3 togeometric and mechanical anisotropy parameters of theliquid bridge network. Finally, the complete relation ofσcap12 to internal variables such as coordination numbers
and anisotropy parameters is briefly discussed in Sec. 6.4.
6.1 Dependence on P ∗, µ and ΦL/ΦS
As previously noted, due to the attractive nature of cap-illary forces, the sign of σcap
12 is opposite to that of σcont12 ,
or of σ12: one has σcap12 > 0. Fig. 18 shows the variations
of σcap12 through the explored parameter range. a2σcap
12 /F0
0.0 0.5 1.0 1.5 2.00.00
0.02
0.04
0.06
0.08
0.10
0.12
a2ca
p12/F
0
1/P
Fig. 18. σcap12 , in units of F0/a
2, versus 1/P ∗ for differentliquid contents and intergranular friction coefficients (symbolsas in Table 2).
– the correction, according to Eq. 25, to the reduced co-hesion c∗ estimated with Eq. 24 – depends on ΦL/ΦS andon P ∗, and hardly varies with µ (data points, with thecode of Table 2, order by colour and filling, but not bysymbol shape). It strongly decreases for growing ΦL andvery notably increases with P ∗.
a2σcap12 /F0 values range from nearly 0 (for large ΦL/ΦS
and small P ∗) to about 0.1 (for small ΦL/ΦS and largeP ∗), while reduced cohesion c∗, as shown in Figs. 8 and 15,grows with ΦL/ΦS and with µ, varying in range 0.2 ≤ c∗ ≤0.4. The correction introduced by the capillary shear stressin the evaluation of the shear strength, or on estimatinga macroscopic cohesion, is thus particularly important forsmall liquid content and for small intergranular frictioncoefficient, as could be observed in Figs. 13 and 16.
12 Badetti et al.: Shear strength of wet granular materials
6.2 Role of contacts and distant interactions
Capillary stresses can be split into the contribution of liq-uid bridges joining grains in contact, and another one dueto bridges joining noncontacting pairs. We respectively de-note those terms with superscripts “cap,c”, and “cap,d”:
σcap12 = σcap,c
12 + σcap,d12 . (26)
Those two terms, in the sum of Eq. 26, are of opposite
signs, with σcap,c12 > 0 and σcap,d
12 < 0. Thus, on writing
σ12 = σcont12 + σcap,c
12 + σcap,d12 , the three terms of the right-
hand side alternate in sign.
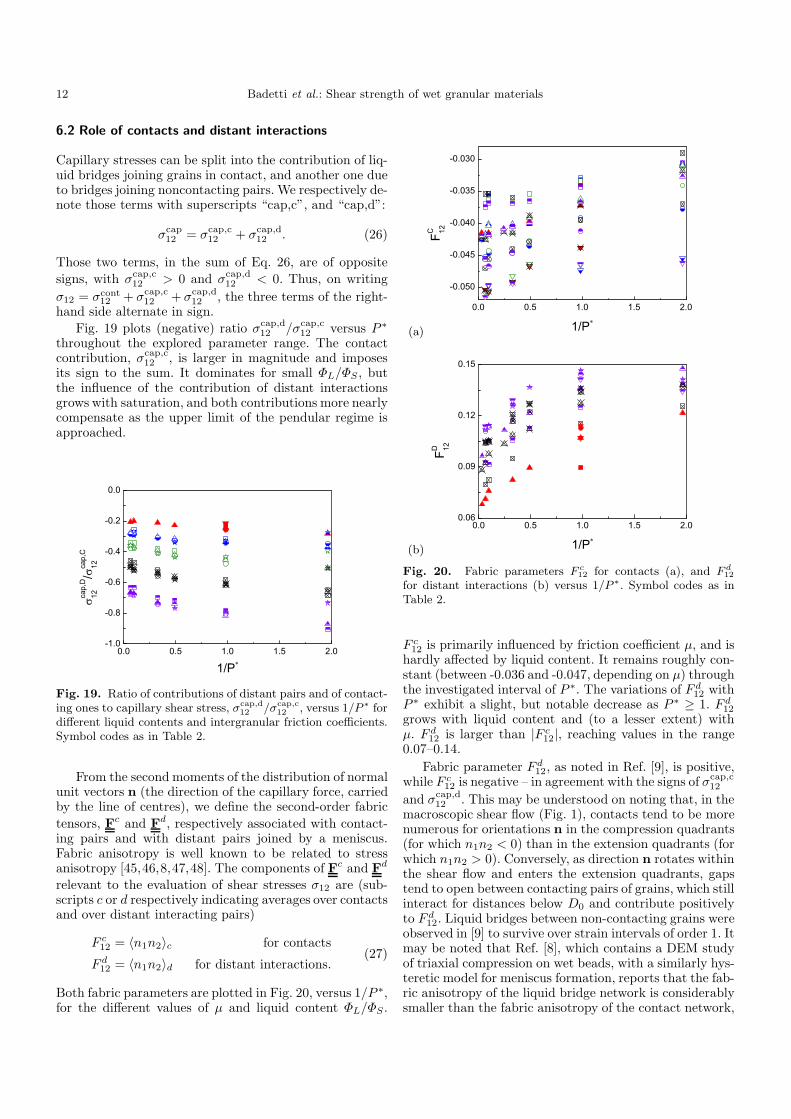
Fig. 19 plots (negative) ratio σcap,d12 /σcap,c
12 versus P ∗
throughout the explored parameter range. The contactcontribution, σcap,c
12 , is larger in magnitude and imposesits sign to the sum. It dominates for small ΦL/ΦS , butthe influence of the contribution of distant interactionsgrows with saturation, and both contributions more nearlycompensate as the upper limit of the pendular regime isapproached.
0.0 0.5 1.0 1.5 2.0-1.0
-0.8
-0.6
-0.4
-0.2
0.0
cap
12,D/
cap
12,C
1/P
Fig. 19. Ratio of contributions of distant pairs and of contact-ing ones to capillary shear stress, σcap,d
12 /σcap,c12 , versus 1/P ∗ for
different liquid contents and intergranular friction coefficients.Symbol codes as in Table 2.
From the second moments of the distribution of normalunit vectors n (the direction of the capillary force, carriedby the line of centres), we define the second-order fabric
tensors, Fc and Fd, respectively associated with contact-ing pairs and with distant pairs joined by a meniscus.Fabric anisotropy is well known to be related to stressanisotropy [45,46,8,47,48]. The components of Fc and Fd
relevant to the evaluation of shear stresses σ12 are (sub-scripts c or d respectively indicating averages over contactsand over distant interacting pairs)
F c12 = 〈n1n2〉c for contacts
F d12 = 〈n1n2〉d for distant interactions.
(27)
Both fabric parameters are plotted in Fig. 20, versus 1/P ∗,for the different values of µ and liquid content ΦL/ΦS .
(a)
0.0 0.5 1.0 1.5 2.0
-0.050
-0.045
-0.040
-0.035
-0.030
FC 12
1/P
(b)
0.0 0.5 1.0 1.5 2.00.06
0.09
0.12
0.15
FD 12
1/P
Fig. 20. Fabric parameters F c12 for contacts (a), and F d
12
for distant interactions (b) versus 1/P ∗. Symbol codes as inTable 2.
F c12 is primarily influenced by friction coefficient µ, and is
hardly affected by liquid content. It remains roughly con-stant (between -0.036 and -0.047, depending on µ) throughthe investigated interval of P ∗. The variations of F d
12 withP ∗ exhibit a slight, but notable decrease as P ∗ ≥ 1. F d
12
grows with liquid content and (to a lesser extent) withµ. F d
12 is larger than |F c12|, reaching values in the range
0.07–0.14.
Fabric parameter F d12, as noted in Ref. [9], is positive,
while F c12 is negative – in agreement with the signs of σcap,c
12
and σcap,d12 . This may be understood on noting that, in the
macroscopic shear flow (Fig. 1), contacts tend to be morenumerous for orientations n in the compression quadrants(for which n1n2 < 0) than in the extension quadrants (forwhich n1n2 > 0). Conversely, as direction n rotates withinthe shear flow and enters the extension quadrants, gapstend to open between contacting pairs of grains, which stillinteract for distances below D0 and contribute positivelyto F d
12. Liquid bridges between non-contacting grains wereobserved in [9] to survive over strain intervals of order 1. Itmay be noted that Ref. [8], which contains a DEM studyof triaxial compression on wet beads, with a similarly hys-teretic model for meniscus formation, reports that the fab-ric anisotropy of the liquid bridge network is considerablysmaller than the fabric anisotropy of the contact network,

Badetti et al.: Shear strength of wet granular materials 13
implying that the liquid bridges joining non-contactinggrains contribute with opposite sign. Capillary forces incontacting pairs are all equal to −F0 in our model, andtheir centers, neglecting elastic deflections, are separatedby distance a. Consequently, from expression (7) of shearstress, one has:
a2σcap,c12
F0
= −3ZCΦS
πF c12, (28)
6.3 Shear stress due to distant interactions
For distant interactions, one may also define the n depen-dent average force (the average capillary force betweendistant pairs sharing the same intercentre line orientationn), as F(n), as well as the n-dependent average intercentredistance L(n). The average intercentre distance for non-contacting bead pairs interacting through a liquid bridgeis denoted as l0 (with a ≤ l0 ≤ a + D0). l0 varies verylittle with P ∗ and µ, it is essentially dependent on liquidcontent (or V0), and grows from 1.025 to nearly 1.06 overthe explored range of ΦL.
Standard relations [45,46,36], based on the first non-trivial term in the expansion of even anisotropic functionsof n in spherical harmonics, directly relate shear stresscontributions to fabric, force and distance anisotropy pa-rameters. Defining, through integrations on the unit sphereS with the differential solid angle dΩ, force and distanceanisotropy parameters as
Fd12 =
−1
4πFd
∫
S
F(n)n1n2dΩ
Ld12 =
1
4πl0
∫
S
L(n)n1n2dΩ,
(29)
one may write
a2σcap,d12
F0
≃ −3ΦSZD
π
Fd
F0
l0a
[
F d12 + Fd
12 + Ld12
]
, (30)
as an approximation. As shown in Fig. 21 relation (30) isquite accurate. The term involving Ld
12 proves negligible(of relative order 10−2).
Comparing relations 28 and 30, the reason for which
|σcap,d12 | < σcap,c
12 (see Fig. 19), despite the opposite inequal-ity for fabric parameters (|F c
12| > F d12, see Fig. 20) is that
product l0ZDFd is significantly smaller than aZCF0. Fur-thermore, the force anisotropy parameter Fd
12 is negative
in (30), reducing the magnitude of σcap,d12 (one observes
Fd12 < 0 and |Fd
12| < F d12).
To explain the sign of Fd12, it should be noted that
non-contacting grains in interaction tend to be closer toone another, whence a larger attractive force, for forceorientations n in the compression quadrants (n1n2 < 0).One thus have Ld
12 > 0 and Fd12 < 0 [it should be recalled
that Fd12, as defined in (29), is the moment of n-dependent
average force distribution F(n) normalized by the globalaverage −Fd]. F
d12 does not vary much with P ∗, µ and
liquid content, with typical values between -0.02 and -0.04.
0.02 0.04 0.06 0.08 0.10 0.120.02
0.04
0.06
0.08
0.10
0.12
pred
icte
d -a
2ca
p12
,D/F
0
measured -a2 cap12
,D/F0
Fig. 21. Predicted values of −a2σcap,d12 /F0, using (30), ver-
sus measured ones, for the complete numerical data set. Openred diamonds: prediction with the first term of (30) (fabricanisotropy). Full blue ones: prediction with the first two termsof (30) (fabric and force anisotropies).
6.4 Estimating capillary shear stress
We thus obtain a very good estimate of σcap12 on summing
Eqs. 28 and 30 (neglecting the last term):
a2σcap12
F0
≃ −3ΦS
π
[
ZCFc12 +
l0aZD
Fd
F0
(
F d12 + Fd
12
)
]
. (31)
This is checked in Fig. 22. The capillary force contribution
0.00 0.02 0.04 0.06 0.08 0.10 0.120.00
0.02
0.04
0.06
0.08
0.10
0.12
pred
icte
d a2
cap
12/F
0
measured a2 cap12 /F0
Fig. 22. σcap12 , in non-dimensional form, as predicted with
Eq. 31, versus its measured value, for the complete numericaldata set.
to the shear stress, σcap12 , is thus related to a small number
of internal variables characterizing the networks formed bythe intergranular contacts and network and the additionalliquid bonds connecting non-contacting grains.
Another relation of macroscopic cohesion to fabric andforce anisotropy parameters was proposed by Radjai andRichefeu [18], based on a somewhat different approach:these authors did not exploit the effective stress idea, butrelated the macroscopic friction coefficients of both the

14 Badetti et al.: Shear strength of wet granular materials
wet material and the dry one to their structural and forceanisotropy parameters, such that the cohesion is expressedin terms of the differences of those variables induced bythe capillary forces.
In (31), the three terms of the right-hand-side are ofalternating signs and decreasing magnitudes. In general,none of them is negligible: distant interactions, by reduc-ing the contribution of capillary forces in contacts, notablyinfluence the capillary shear stress; and the effect of the
rather large fabric anisotropy onto σcap,d12 gets reduced by
the one of force anisotropy. The dependence of the macro-scopic cohesion and shear strength on the liquid content
are largely due to the effect of σcap,d12 , the distant inter-
action contribution to σcap12 . Cohesion c increases with ΦL
because |σcap,d12 | increases, thereby decreasing σcap
12 , whichis the term reducing the macroscopic cohesion (Eq. 25).
7 Summary and discussion
We now recall the salient results of the paper.First, experimental measurements for shear strength
and solid fraction in steady uniform quasistatic shear flowof a model material, made of polystyrene beads wet by sil-icone oil, are reported. A Mohr-Coulomb criterion applieswell for values of reduced normal stress P ∗ larger than afew units, but tends to overestimate the shear strength forlower P ∗. It involves the static macroscopic friction coef-ficient µ∗
0 of the dry material, and a macroscopic cohesionc, which grows with liquid content ΦL/ΦS in the pendu-lar regime. In non-dimensional form, c∗ = a2c/F0 variesbetween 0.2 and 0.4.
Then, results of DEM simulations are shown to agreequantitatively with experimental ones, provided the ap-propriate value µ ≃ 0.09 is given to the intergranular fric-tion coefficient, as identified from the macroscopic proper-ties (internal friction coefficient µ∗
0 and solid fraction ΦS)of the dry material.
Further use of numerical simulations, for different val-ues of µ, enabled investigations of the microscopic originsof macroscopic shear resistance and cohesion, and assess-ments of the performance of existing approaches and pre-diction schemes. The effective stress approach, assumingthat the capillary part of the stress tensor acts onto thecontact network like an externally applied stress, as ex-pressed by relation (18) and checked in Fig. 10, provesremarkably efficient (although not exact). In general, thecontribution of capillary forces to shear stress should notbe ignored, as it significantly improves the prediction ofthe shear resistance (as apparent on comparing Figs. 13and 14). Capillary stress components σcap
22 (see Eq. 20) andσcap12 (see Eq. 31) are both related to coordination num-
bers and to characteristics of the force network (involvinganisotropy parameters for shear stress), so that it is pos-sible to express shear strength and cohesion with simplepredictive formula involving the macroscopic friction coef-ficient of the dry material. The “Rumpf formula”, Eq. 24,for macroscopic cohesion c, is based on the effective stressapproach in which σcap
12 is neglected. It is approximately
correct for large enough liquid content within the pendu-lar range (ΦL/ΦS ≥ 0.03), but despite the dependenceof the wet coordination number on ΦL, proves unable (asshown in Figs. 8 and 16) to capture the liquid contentdependence of the cohesion for smaller saturations. Thecontribution of σcap
12 to shear strength is the largest, in rel-ative terms, for small liquid contents, especially for smallvalues of friction coefficient µ, as the Rumpf term is pro-portional to macroscopic friction coefficient µ∗
0 (a growingfunction of µ, see Fig. 4). The cohesion increase with ΦL
originates in the decrease of capillary stress componentσcap12 , which contributes negatively to cohesion. This effect
is due to the opposite fabric orientations between contactsand liquid bridges joining noncontacting particles.
The success of the effective stress approach is likelyrelated to the relative insensitivity of the contact networkstructure on capillary effects: solid fraction ΦS (Fig. 12),contact coordination number ZC (Fig. 11a), and contactfabric parameter F c
12 (Fig. 20) are essentially determinedby µ, hardly depend on ΦL/ΦS , and exhibit little (or mod-erate) variations with P ∗. On the other hand, ZD, the
coordination number of distant interactions, and σcap,d12 ,
their contribution to shear stress (which explains the de-pendence of σcap
12 on liquid content), are nearly indepen-dent of µ, and vary considerably with ΦL/ΦS and withP ∗.
The investigations of the influence of the liquid contentare one original aspect of the paper. Although the resultsshown in Fig. 8 are quite encouraging, one may wish toexplore to what extent they are sensitive to the spatial dis-tribution of the liquid phase, which is admittedly rathercrudely modeled in the present numerical study. An obvi-ous, but technically challenging, extension of the presentwork would be to investigate the capillary effects at sat-urations beyond the pendular regime. This requires somecontinuum mechanics modeling of the liquid phase config-uration, which requires technically challenging numericalmodels well beyond the reach of simple DEM. Some inter-esting attempts involve a Lattice-Boltzmann treatment ofthe interstitial fluid phases [49,50]. On the experimentalside, rheological measurements could be usefully supple-mented by investigations of liquid morphologies throughmicrotomography [11,12,51,52]. Although accurate deter-minations of contacts in a grain pack are very difficult(see [53,54] for measurements and [24] for a discussionwith comparisons to simulations), liquid bridges, due tothe larger scales involved, are easier to observe, and, know-ing the distance-dependent capillary force, some of thecharacteristic state variables of the capillary force network(coordination and fabric parameters as involved, e.g., inEq. 31) used in Sec. 6 might be experimentally accessible.
The properties of the loose structures stabilized by co-hesion observed under small P ∗ [38,39,23] are also worthstudying, as regards their gradual deformation and col-lapse under varying loads. Such aspects (as does, already,the small P ∗ dependence of density and contact networkobserved in this paper) escape the effective stress approach,and their study would enable a more global assessment ofits range of applicability. Such an exploration could not

Badetti et al.: Shear strength of wet granular materials 15
be pursued here in the range P ∗ ∼ 0.1, as localizationphenomena preclude observations of homogeneous criti-cal states in steady quasistatic shear flow. The conditionsof occurrence of such strain localization (which may entailfluid distribution inhomogeneities [51]), is an issue of greatpractical consequences, and would also deserve systematicinvestigations.
Acknowledgements
We are grateful to David Hautemayou and Cedric Mezierefor technical helps with the measurements. This researchwas partially funded by Agence Nationale de la Recherche(Grant No. ANR-16-CE08-0005-01).
References
1. N. Mitarai and F. Nori. Wet granular materials. Advancesin Physics, 55:1, 1–45, 2006.
2. P. Pierrat and H. S. Caram. Tensile strength of wet gran-ular materials. Powder Technol., 91:83–93, 1997.
3. T. Groger, U. Tuzun, and D. Heyes. Modelling and mea-suring of cohesion in wet granular materials. Powder Tech-nol., 133:203–215, 2003.
4. P. Pierrat, D. K. Agrawal, and H. S. Caram. Effect ofmoisture on the yield locus of granular materials: theoryof shift. Powder Tech., 99:220–227, 1998.
5. V. Richefeu, M.S. El Youssoufi, and F. Radjaı. Shearstrength properties of wet granular materials. Phys. Rev.
E, 73:051304, 2006.6. F. Soulie, M. S. El Youssoufi, F. Cherblanc, and C. Saix.
Capillary cohesion and mechanical strength of polydis-perse granular materials. Euro. Phys. J. E, 21:349–357,2006.
7. L. Scholtes, B. Chareyre, F. Nicot, and F. Darve. Microme-chanics of granular materials with capillary effects. Inter-national Journal of Engineering Science, 47:64–75, 2009.
8. L. Scholtes, P.-Y. Hicher, F. Nicot, B. Chareyre, andF. Darve. On the capillary stress tensor in wet granu-lar materials. Int. Journal for Numerical and Analytical
Methods in Geomechanics, 33:1289–1313, 2009.9. S. Khamseh, J.-N. Roux, and F. Chevoir. Flow of wet gran-
ular materials: a numerical study. Phys. Rev. E, 92:022201,2015.
10. Z. Shen, M. Jiang, and C.. Thornton. Shear strength ofunsaturated granular soils: three-dimensional discrete ele-ment analyses. Granular Matter, 18(3):37, 2016.
11. M. M. Kohonen, D. Geromichalos, M. Scheel, C. Schier,and S. Herminghaus. On capillary bridges in wet granularmaterials. Physica A, 339:7–15, 2004.
12. S. Herminghaus. Dynamics of wet granular matter. Ad-
vances in Physics, 54:3, 221–261, 2005.13. F. Radjaı and F. Dubois, editors. Discrete-element model-
ing of granular materials. Wiley, 2011.14. G.P. Lian, C. Thornton, and M.J. Adams. A theoretical-
study of the liquid bridge forces between 2 rigid sphericalbodies. J. Coll. Inter. Sci., 161:138–147, 1993.
15. C.D. Willett, M.J. Adams, S.A. Johnson, and J.P.K.Seville. Capillary bridges between two spherical bodies.Langmuir, 16 (24):9396–9405, 2000.
16. O. Pitois, P. Moucheront, and X. Chateau. Liquid bridgebetween two moving spheres: An experimental study ofviscosity effects. J. Coll. Interf. Sci., 231:26–31, 2000.
17. H. Rumpf. Zur Theorie der Zugfestigkeit von Agglom-eraten bei der Kraftubertragung an Kontaktpunkten.Chem.-Ing.-Tech, 42(8):538–546, 1970.
18. F. Radjaı and V. Richefeu. Bond anisotropy and cohe-sion of wet granular materials. Phil. Trans. R. Soc. A,367:5123–5138, 2009.
19. B. Chareyre. Comment on “Flow of wet granular materi-als: a numerical study”. Phys. Rev. E, 96:016901, 2017.
20. A. Fall, G. Ovarlez, D. Hautemayou, C. Meziere, J.-N.Roux, and F. Chevoir. Dry granular flows: Rheologicalmeasurements of the mu(I) rheology. Journal of Rheology,59:1065–1080, 2015.
21. D. M. Wood. Soil Behaviour and Critical State Soil Me-
chanics. Cambridge University Press, 1990.22. B. Andreotti, Y. Forterre, and O. Pouliquen. Granular
Media: Between Fluid and Solid. Cambridge UniversityPress, Cambridge, UK, 2013.
23. V.-D. Than, S. Khamseh, A.-M. Tang, J.-M. Pereira,F. Chevoir, and J.-N. Roux. Basic Mechanical Propertiesof Wet Granular Materials: A DEM Study. ASCE Journal
of Engineering Mechanics, 143(SI1):C4016001, 2017.24. I. Agnolin and J.-N Roux. Internal states of model
isotropic granular packings. I. Assembling process, geom-etry, and contact networks. Phys. Rev. E, 76(6):061302,2007.
25. J.-N. Roux and F. Chevoir. Dimensional Analysis andControl Parameters. In Radjaı and Dubois [13], chapter 8,pages 199–232.
26. G. Lian, C. Thornton, and M. J. Adams. A Theo-retical Study of the Liquid Bridge Forces between TwoRigid Spherical Bodies. J. of Colloid and Interface Sci.,161(1):138–147, 1993.
27. D. Maugis. Adherence of elastomers: Fracture mechan-ics aspects. Journal of Adhesion Science and Technology,1:105–134, 1987.
28. P.-E. Peyneau and J.-N. Roux. Frictionless bead packshave macroscopic friction, but no dilatancy. Phys. Rev. E,78:011307, 2008.
29. J. Christoffersen, M. M. Mehrabadi, and S. Nemat-Nasser.A micromechanical description of granular material behav-ior. Journal of Applied Mechanics, 48:339–344, 1981.
30. GDR MiDi. On dense granular flows. European Physical
Journal E, 14:341–365, 2004.31. F. da Cruz, S. Emam, M. Prochnow, J.-N. Roux, and
F. Chevoir. Rheophysics of dense granular materials:discrete simulation of plane shear flows. Phys. Rev. E,72:021309, 2005.
32. P. Jop, Y. Forterre, and O. Pouliquen. A constitutive lawfor dense granular flow. Nature, 441:727–730, 2006.
33. T. Hatano. Power-law friction in closely packed granularmaterials. Phys. Rev. E, 75:060301(R), 2007.
34. P. Rognon, J.-N. Roux, D. Wolf, M. Naaım, andF. Chevoir. Rheophysics of cohesive granular materials.Europhysics Letters, 74:644–650, 2006.
35. F. Boyer, E. Guazzelli, and O. Pouliquen. Unifying suspen-sion and granular rheology. Phys. Rev. Lett., 107:188301:1–5, 2011.
36. E. Azema and F. Radjaı. Internal struture of inertial gran-ular flows. Phys. Rev. Lett., 112:078001, 2014.

16 Badetti et al.: Shear strength of wet granular materials
37. N. Berger, E. Azema, J.-F. Douce, and F. Radjaı. Scalingbehaviour of cohesive granular flows. Europhysics Letters,112:64004, 2015.
38. D. Kadau, G. Bartels, L. Brendel, and D. E. Wolf. Con-tact dynamics simulations of compacting cohesive granularsystems. Phase Trans., 76:315–331, 2003.
39. F. A. Gilabert, J.-N. Roux, and A. Castellanos. Computersimulation of model cohesive powders: Plastic consolida-tion, structural changes, and elasticity under isotropicloads. Phys. Rev. E, 78(1):031305, 2008.
40. A. Lemaıtre, J.-N. Roux, and F. Chevoir. What do drygranular flows tell us about dense non-brownian suspensionrheology? Rheologica Acta, 48:925–942, 2009.
41. M. Badetti, J.-N. Roux, P. Aimedieu, S. Rodts, F. Chevoir,and A. Fall. Rheology and microstructure of unsaturatedgranular materials: Experiments and simulations. To besubmitted to Journal of Rheology, 2017.
42. F. Soulie, M. S. El Youssoufi, F. Cherblanc, and C. Saix.Capillary cohesion and mechanical strength of polydis-perse granular materials. European Physical Journal E,21:349–357, 2006.
43. S. Khamseh, J.-N. Roux, and F. Chevoir. Reply to ”com-ment on ’flow of wet granular materials: A numericalstudy’ ”. Phys. Rev. E, 96:016902, 2017.
44. I. Agnolin and J.-N. Roux. Internal states of modelisotropic granular packings. III. Elastic properties. Phys.
Rev. E, 76(6):061304, 2007.45. L. Rothenburg and R.J. Bathurst. Analytical study
of induced anisotropy in idealized granular materials.Geotechnique, 39:601–614, 1989.
46. P.-E. Peyneau and J.-N. Roux. Solidlike behavior andanisotropy in rigid frictionless bead assemblies. Phys. Rev.E, 78:041307, 2008.
47. E. Azema and F. Radjaı. Force chains and contact networktopology in sheared packings of elongated particles. Phys.Rev. E, 85:031303, 2012.
48. F. Radjaı, J.-Y. Delenne, E. Azema, and S. Roux. Fab-ric evolution and accessible geometrical states in granularmaterials. Granular Matter, 14:259–264, 2012.
49. J.-Y. Delenne, V. Richefeu, and F. Radjaı. Liquid clus-tering and capillary pressure in granular media. J. Fluid
Mech., 762:R5, 2015.50. V. Richefeu, F. Radjai, and J.-Y. Delenne. Lattice Boltz-
mann modelling of liquid distribution in unsaturated gran-ular media. Computers and Geotechnics, 80:353–359, 2016.
51. R. Mani, D. Kadau, D. Or, and H. J. Herrmann. Fluiddepletion in shear bands. Phys. Rev. Lett., 109:248001:1–5, 2012.
52. J.-F. Bruchon, J.-M. Pereira, M. Vandamme, N. Lenoir,P. Delage, and M. Bornert. Full 3D Investigation andCharacterisation of Capillary Collapse of a Loose Unsatu-rated Sand using X-Ray CT. Granular Matter, 15(6):783–800, 2013.
53. T. Aste, M. Saadatfar, A. Sakellariou, and T. J. Senden.Investigating the geometrical structure of disorderedsphere packings. Physica A, 339:16–23, 2004.
54. T. Aste, M. Saadatfar, and T. J. Senden. Geometricalstructure of disordered sphere packings. Phys. Rev. E, 71,2005.