anchored fish aggregating devices in hawaiian waters · anchored fish aggregating devices in...
TRANSCRIPT

Anchored Fish Aggregating Devices in Hawaiian Waters
WALTER M. MATSUMOTO, THOMAS K. KAZAMA, and DONALD C. AASTED
Introduction
Tunas have long been known to aggregate around floating objects such aslogs, masses of drifting seaweed, debris,and other flotsam. Both Japanese andAmerican fishermen have utilized thisknowledge and routinely seek such objects while fishing for skipjack tuna,Kalsuwonus pelamis, and yellowflntuna, Thunnus albacares, in the eastern and western Pacific (Uda, 1933;Kimura, 1954; McNeely, 1961; InoueetaI., 1963, 1968).
In recent years, the Japanese beganseining for skipjack and small yellowflntunas in the western equatorial Pacific.The Pacific Tuna Development Foundation (PTDF) also began similar operations in the western Pacific with chartered American seiners (PTDF, J979).In both operations the success of seiningfor tunas depended largely upon schoolsassociated with drifting logs. The ratioof successful sets in the PTDF opera-
ABSTRACT-Fish aggregating devices(FAD's) made oj 55-gallon oil drums andwooden rafts were moored in Hawaiian waters off the islands of Oahu. Lanai, and Hawaii from May 1977 through July 1979. TheFAD's successfully attracted numerous pelagic fishes. including large schools of skipjack and small yellowfin tunas. Commercialtuna pole-and-line boats benefited greatly bytaking large catches oftunas from around theFAD's. Fishing around the FAD's resulted inreduced fuel and baitfish expenses. Trollingboats also benefited as they experienced areduction in the number of zero-catch days.The success of the FAD experiment encouraged the State of Hawaii to implement itsown FAD system involving 26 fish aggregating devices around seven major islands.
September 1981. 43(9)
tions was well over 4: 1 in favor of setsmade around drifting logs as comparedwith sets made on schools independentof logs.
While the value of drifting logs tosuccessful seining has been well demonstrated by these questions, such logs,which abound in the western equatorialPacific, especially in waters north ofPapua ew Guinea, are only seldomfound around islands in the central Pacific. Moreover, whenever an occasionallog is encountered in the latter areas,it is available to the local fishermen onlyfor a short time before it drifts off beyond the range of their boats. Thus, tobenefit from this type of fishing in areaswhere drifting logs are scarce, it may benecessary for man to turn to anchoreddevices.
This has been done in the Philippinesin recent years where purse seining fortunas around large bamboo rafts (7 X 36feet) anchored in very deep waters(2,000 -3,000 fathoms) has developedinto a sizable tuna fishery (Matsumoto').The anchored rafts, numbering in thehundreds and spaced 4-8 miles apart,have successfully attracted large quantities of tunas and enabled the seiners tooperate continuously for 6 months ormore at a time. The success of this fishery has been mainly due to the availability of vast areas of protected waters inthe Philippines where the seas are exceptionally calm.
The Honolulu Laboratory of the a-
'Matsumoto. W. M. Seine fishing around payaos inthe Philippines. Honolulu Laboratory, SouthwestFisheries Center, National Marine Fisheries Service, NOAA, Honolulu, HI 96812. Manuscr. in prep.
tional Marine Fisheries Service (NMFS)Southwest Fisheries Center and thePTDF embarked on a joint project totest anchored fish aggregating devices inHawaiian waters in May J977. The project was funded largely by PTDF withadditional support from NMFS. Thisreport covers the procedures and resultsof the project.
Objectives
The primary objectives of the projectwere to: 1) Develop and test anchoredfi~h aggregating devices (hereafter calledbuoys) in open ocean areas and 2) determine their effect upon the skipjacktuna pole-and-line fishery in Hawaii.Secondary objectives were to determinethe effects of buoy placement relative todistance from land, depth, and bottomtopography.
Procedure
Buoy Construction
Two types of buoys were used in theexperiment. The first type (Fig. I, 2)consisted of a buoy made of two 55gallon steel oil drums filled with pol~
urethane foam and held together in aframe of 3- X 3- inch angle iron. Theframe was extended below to form V'sat the front and rear and wooden slatswere bolted to the V sections to form ahaven for small fish. This also providedadditional stability to the buoy. A pyramid made of angle iron and plywood
Walter M. Matsumoto, Thomas K. Kazama, andDonald C. Aasted are with the Honolulu laboratory, Southwest Fisheries Center. National MarineFisheries Service, OAA, P.O. Box 3830. Honolulu. HI 96812.
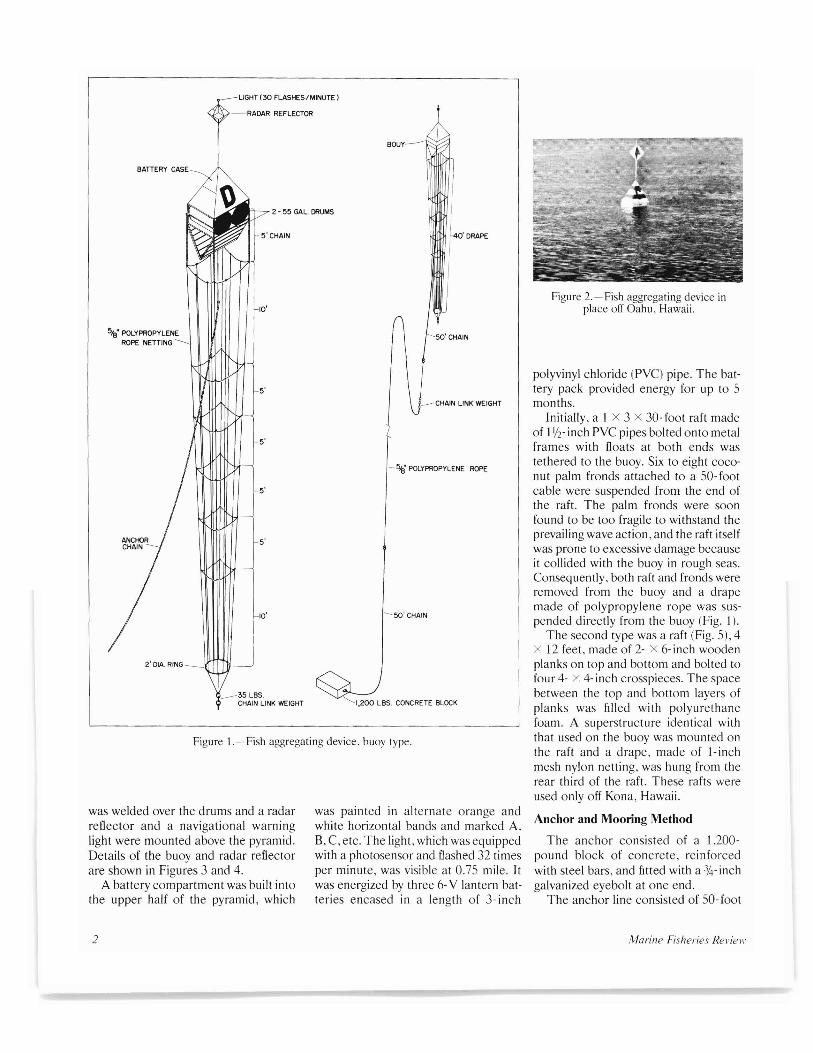
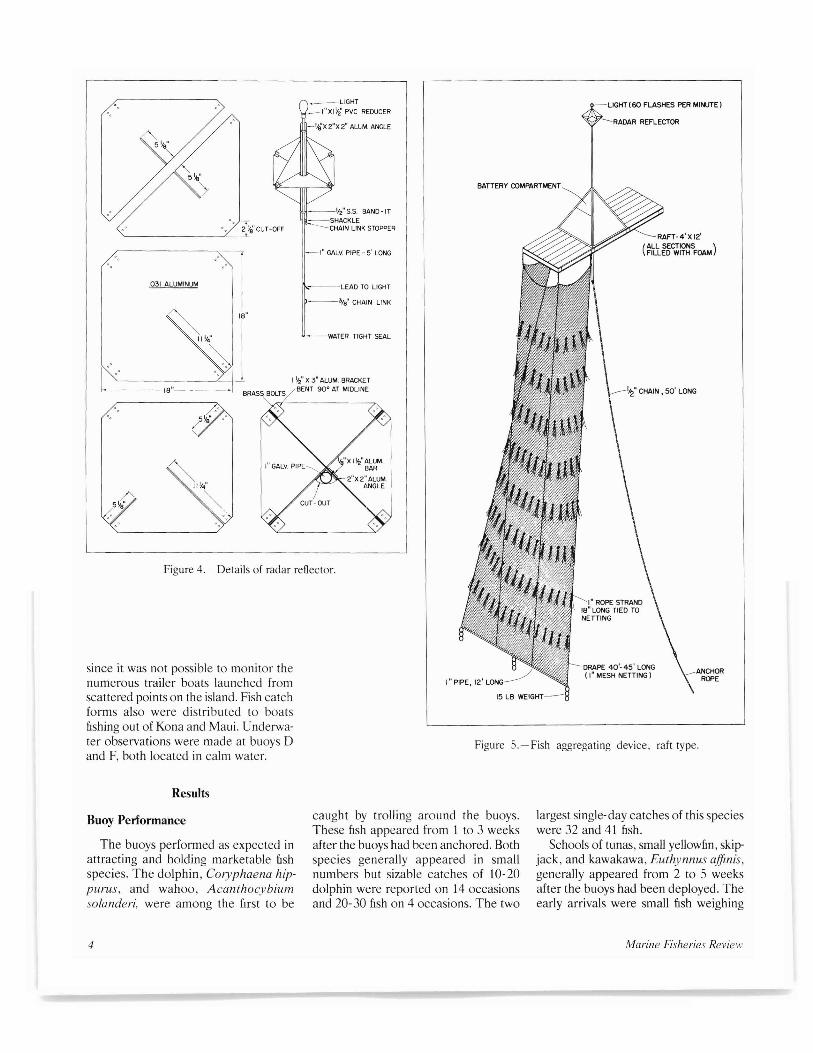
Figure 2. - Fish aggregating device inplace off Oahu. Hawaii.
I~
40' DRAPE
BOUY----
2 - 55 GAL. ORUMS
10'
__LIGHT (30 FLASHES/MINUTE)
-RADAR REFLECTOR
BATTERY CASE
Figure 1. - Fish aggregating device. huoy type.
polyvinyl chloride (PVC) pipe. The battery pack provided energy for up to 5months.
Initially, a I X 3 X 30- foot raft madeof Jill-inch PVC pipes bolted onto metalframes with floats at both ends wastethered to the buoy. Six to eight coconut palm fronds attached to a 50- footcabJe were suspended from the end ofthe raft. The palm fronds were soonfound to be too fragile to withstand theprevailing wave action, and the raft itselfwas prone to excessive damage becauseit collided with the buoy in rough seas.Consequently, both raft and fronds wereremoved from the buoy and a drapemade of polypropylene rope was suspended directly from the buoy (Fig. 1).
The second type was a raft (Fig. 5),4X 12 feet, made of 2- X 6-inch woodenplanks on top and bottom and bolted tofour 4- 'y 4- inch crosspieces. The spacebetween the top and bottom layers ofplanks was filled with polyurethanefoam. A superstructure identical withthat used on the buoy was mounted onthe raft and a drape, made of 1- inchmesh nylon netting. was hung from therear third of the raft. These rafts wereused only off Kana, Hawaii.
Anchor and Mooring Method
The anchor consisted of a 1,200pound block of concrete, reinforcedwith steel bars, and fitted with a 314- inchgalvanized eyebolt at one end.
The anchor line consisted of 50-foot
~50'CHAIN
c---- CHAIN LINK WEIGHT
-5-8' POLYPROPYLENE ROPE
-5C'CHAIN
"'--1.200 LBS. CONCRETE BLOCK
was painted in alternate orange andwhite horizontal bands and marked A.B, C, etc. The light, which was equippedwith a photosensor and flashed 32 timesper minute, was visible at 0.75 mile. Itwas energized by three 6- V lantern batteries encased in a length of 3- inch
5'
5'
5'
5'
10'
J.----35LBS.
CHAIN LINK WEIGHT
5'a" POLYPROPYLENEROPE NETTING
2' DIA. RING---.
was welded over the drums and a radarreflector and a navigational warninglight were mounted above the pyramid.Details of the buoy and radar reflectorare shown in Figures 3 and 4.
A battery compartment was built intothe upper half of the pyramid, which
2 Marine Fisheries Reviell'

3ta" CHAIN LINK
PLYWOOO PANELS BOLTEDTO FRAME FOUR SIDES ANDPAINTED ORANGE AND WHITE
48"
EYE 14 CORNERS)TO SUSPEND DRAPE
~..8-----'T- BRACKETS TO ATTACHPLYWOOD PANELS
STUDS FOR 2"X6"LUMBER
BOLT HOLES FORI"X 4" SLATS
-2" GALV. PIPE 10 FEET LONG
Figure 3. - Details of two-drum buoys.
345 fathoms. Buoys A and 0 were situated within 2 miles of the 500- to 1.000fathom slope, whereas buoys Band Cwere 14 and 6 miles, respectively, fromthe slope.
The first three buoy sites were fullyexposed to the northeast trades, whichpredominated in all seasons, and to occasional south winds, often accompanied by storms. The buoys were thusbuffeted by winds from 15 to 25 knots.often approaching gale force. The seaswere generally from 4 to 12 feet butexceeded 20 feet during storms. Site Dwas relatively calmer, with seas generally ranging from 2 to 4 feet. Duringstormy periods, however. the seas rangedas high as 10 feet.
Subsequently, on 22 March 1978, tworaft- type devices were moored off Kona.Hawaii, in relatively calm waters. Thefirst, F, was placed 4.5 miles west ofKaiwi Point at a depth of 1,250 fathomsand the second. G, was placed 6 milesoffshore and 8 miles north- northwest ofKeahole Point at a depth of 220 fathoms. The latter was situated 3.5 milesshoreward from the 1,000- fathom slope.Both of these sites were in proven fIshingareas for tunas and bill fIshes.
Monitoring Buoys and Catches
lengths of Y2-inch galvanized chain atthe top and bottom and a main sectionof Ya- inch twisted polypropylene rope.The scope or ratio of anchor line todepth was between 1.65: 1 and 1.80: 1.Such a large scope, together with thepositive buoyancy of the polypropylenerope, caused large sections of anchorline to float at the surface periodicallyduring changes in the tidal current andthereby posed a hazard to navigation.To correct this, a chain link weight wasadded to the upper one-fourth to onethird of the anchor line to keep the excess line submerged at all times. Theposition and size of the weight variedfrom one buoy to the next, dependingupon the length of the anchor line andthe depth of the anchoring site. Theweight was linked into the line to prevent it from chafing the anchor line.
The simplest method was used inmooring the buoys. The buoy was first
September /981. 4J(9;
set on the water at the selected site, theanchor line was payed out as the vesselmoved slowly in a circular path aroundthe buoy, and the anchor was released ina free fall to the bottom.
Location of Buoys
Four buoys were initially moored offOahu and Lanai (Fig. 6) on 9 and 10May 1977. Buoy A was placed 16 milessouth-southwest of Kewalo Basin (lat.12°04'N, long. 158°00A'W), Oahu, at adepth of 308 fathoms; buoy B was placed18 miles southeast of Kewalo Basin and1 mile off Penguin Bank (lat. 21 °00.5'N,long. 157°43.7'W) at a depth of 242fathoms; buoy C was moored 27 milessouth-southeast of Kewalo Basin and 1.1miles off the tip of Penguin Bank (lat.200 51'N, long. 157°45'W) at a depth of246 fathoms; and buoy D was moored10.5 miles southwest of Lanai (lat.19°20'N, long. 157° 10'W) at a depth of
Monitoring and maintenance of thebuoys off Oahu and Lanai were scheduled on a monthly basis, with additionalvisits at the height of the skipjack tunafishing season. All visits could not bemade as planned, however, due to prolonged periods of rough sea conditions.
On all monitoring trips, troll fishingwas done at each buoy site and on runsbetween buoys. Sightings of bird flocks.fIsh schools, and scattered birds wererecorded and the areas immediatelyaround the buoys were scanned with adepth recorder to detect subsurface fIshschools.
Fish catch data from commercial tunapole-and-line boats visiting the buoyswere obtained through catch forms supplied to each boat and from interviewswith boat operators. Catch data fromcommercial and recreational trollingboats were obtained from interviewsonce or twice each week and were limited to boats based at Kewalo Basin,
3
....-ANCHORROPE
RAFT-4' X 12'
(~ilf5C~i~SFOAM )
..-1'2" CHAIN. 50' LONG
LIGHT( 60 FLASHES PER MINUTE)
--RADAR REFLECTOR
15 LB. WEIGHT-
BATTERY COMPARTMENT
Figure 5. - Fish aggregating device. raft type.
_~_1/2"S.S. BAND-IT
--SHACKLECHAIN LINK STOPPER
---LEAD TO LIGHT
-~3/B" CHAIN LINK
--WATER TIGHT SEAL
-I" GALV. PIPE - 5' LONG
I'''.!'' X 3" ALUM. BRACKETBENT 90° AT MIDLINE
..
..
..~
.031 ALUMINUM
o·•• T
• 2ili'cuT-OFF'-------~~-
..
..
·.
Figure 4. - Details of radar reflector.
..
..
..
..
~ IB"
II ~4', II
f---~=-=-=-=--=--=---'-B-"~---------~_· ~BRASS BOLTS
since it was not possible to monitor thenumerous trailer boats launched fromscattered points on the island. Fish catchforms also were distributed to boatsfIshing out of Kona and Maui. Underwater observations were made at buoys Dand F, both located in calm water.
Results
Buoy Performance
The buoys performed as expected inattracting and holding marketable fIshspecies. The dolphin, Coryphaena hippums, and wahoo, Acanthocybiumso/anderi, were among the first to be
caught by trolling around the buoys.These fish appeared from 1 to 3 weeksafter the buoys had been anchored. Bothspecies generally appeared in smallnumbers but sizable catches of 10-20dolphin were reported on 14 occasionsand 20-30 fIsh on 4 occasions. The two
largest single-day catches of this specieswere 32 and 41 fish.
Schools of tunas, small yellowfJn, skipjack, and kawakawa, Euthynnus affinis,generally appeared from 2 to 5 weeksafter the buoys had been deployed. Theearly arrivals were small fish weighing
4 Marine Fisheries Review

sea conditions or loss of buoys (Table 1).Sixteen visits were made to A, 13 to B,13 to C, and 10 to D. The catch bytrolling on these trips was generally lowat all the buoys. The total catch consisted of 29 nsh at A (l.8 nsh per visit).11 at B (0.8 fIsh per visit). 3 at C (0.2 nshper visit), and 7 at D (0.7 fish per visit).The low catch was largely due to nshingby trollers prior to the arrival of themonitoring vessel. Consequently. determination of the presence of nsharound the buoys were made from nshand bird flock sightings and nsh- finderobservations. Fish were present at A and13 of 16 visits (81.2 percent), at B on 8 of13 visits (61.5 percent), at C on 6 of 13visits (46.2 percent), and at D on 9 of 10visits (90.0 percent). Thus, buoys A andD, because of their locations (see Discussion). were more effective in attracting nsh than Band C.
To determine the effectiveness of thebuoys statistically, controlled nshing bytrolling was done within 0.5 mile and atdistances of ::\ to 5 miles from the buoys
I 7°
Figure 6.-Fish aggregating devices off Oahu. Lanai, and Hawaii.
158-W
20°'----j------t------+------+-----i.,-------:'<---(-+----J--,
Monitoring Trips
Visits to the buoys were interrupted atvarious times. either because of rough
current forced the buoy to submergeand caused the anchor to be draggedalong the relatively flat, mud and siltbottom.
The buoys off Kona (F and G) werenot part of the original buoy project.Consequently, wooden rafts that wereavailable from a prior experiment wereused instead of the steel-drum buoys.These rafts remained operative for 10months before breaking apart during thesame series of storms that caused thelosses of A and D buoys. The winds offKona exceeded 40 knots during thisstorm.
The drapes of nne-mesh netting usedon F and G buoys were very effective inattracting nsh; however, they also gillednumerous mackerel scad, Decapteruspunctatus (Fig. 7), and were torn toshreds from sharks feeding on the gillednsh.
from I to 4 pounds. These were joinedlater by larger fish as the tuna aggregations increased around the buoys. Othernsh of the familiesCarangidae, Balistidae,and Kyphosidae often appeared wellbefore the tunas.
As the aggregations of nsh built uparound the buoys, so did the number offishing boats. These included commercial bait boats, chartered (sport fishing)and commercial trollers, and trailerboats of assorted sizes. Buoy A attractedas many as 30 boats on a given day, allnshing simultaneously around the buoyand up to a distance of 3 miles. In thecalmer waters off Kona, F and G buoysattracted 50 or more boats on a givenday.
Buoy losses were experienced at allsites. The four buoys (A- D), initiallydeployed on 9 and 10 May 1977, brokefree in July after 7-10 weeks because ofincompatible fittings used in the anchorline. Subsequently, two more buoys werelost at sites A and B and one more eachat sites C and D from other causes. Atsite A, the second buoy was lost after16.5 months as a result of a storm andthe third buoy was lost after 4.5 months,due to cable grip slippage. On this buoy.100 feet of Jjg-inch cable, secured bythree safety cable grips at each end, wasused at the top of the anchor line, instead of the usual length of chain. At siteB, the second buoy was lost after 3months as a result of line chafing. Thebuoy was inadvertently anchored tooclose to Penguin Bank, and the anchorrope failed to clear the top of the ledgeas the buoy swung over the bank duringtidal changes. The third buoy was lostafter 16.75 months when a shackle pinwas lost. At site C, the second buoy waslost after 19.75 months due to undetermined causes, and at site D, the secondbuoy was lost after 16.5 months after ithad been dragged by currents to a shallow ledge where the anchor rope eventually chafed on the bottom. Despitethese losses, the buoys at all sites remained in position long enough to demonstrate their effectiveness in attractingand holding fish schools.
The buoy design was adequate at allsites, except D, where unforeseen strongcurrents occurred twice during thetesting period. On both occasions the
September 198/, 4J(9)

Figure 7. - Mackerel scad gilled on netting hung from f:Jsh aggregating device.Torn sections caused by shark attacks on gilled !ish.
by a commercial trolling boat and vessels used in monitoring the buoys. Because of differences in fishing durationand in number of lines fished by different vessels. catch- per-line- hour wasused in comparing the effect of the buoysin the two areas. Sixteen pairs of observations were obtained in March, April,and August J978. Of these, fish werecaught within 0.5 mile of the buoy onnine occasions, between 3 and 5 mileson one occasion, and in both areas onone occasion. No Ilsh was caught in bothareas on five occasions. There were 10positive differences in the catch rates infavor of the buoy area, I negative difference, and 5 with no difference.
The randomized test for matchedpairs (Siegel, 1956) indicated that catchrates within 0.5 mile of the buoys weresignifIcantly greater (P = 0.00097,one-tailed) than in areas 3 to 5 milesaway. The test, thus, indicated that thebuoys were successful in aggregatingfish.
Pole-and·Line Fishing
The buoys were first deployed in May,at the beginning of the skipjack tunafishing season. The anticipated visits tothe buoys by pole-and-line boats duringthe fIshing season did not occur becauseof the unexpected loss of all four buoys
in July and because the buoys could notbe reinstalled before the end of thefIshing season. All four buoys were reinstalled between August and October,and visits by pole-and-line boats beganin December. Initially, the few boats thatfIshed around the buoys were reluctantto report their visits and catches becausethey did not want other boats to visit thebuoys also. The reporting of visits andcatches improved with time, however. asthe effectiveness of the buoys becamecommon knowledge throughout thefishing fleet.
Several of the smaller bait boatsvisited the buoys more often than theothers. These boats usually left port wellbefore daybreak in order to be at thebuoy site by sunrise. They began fishingat the buoys at daybreak and pursuedthe schools as the latter departed fromthe immediate area of the buoys. Asfishing slacked off, the boats departedthe area to seek schools of larger fish.Depending on the day's catch, theseboats visited the buoys again in late afternoon before returning to port. Occasionally when fIshing around the buoyswas exceptionally good, these boats returned to port well before noon withcatches of 10,000 pounds, or more.
During 1978, the number of knownvisits increased from a low of 9 in Janu-
ary to 80 in May (Table 2), representing5.6 and 46.8 percent. respectively, of thetotal monthly fishing trips made by thefleet of 12 pole- and-line boats. The ratio of visits to total trips peaked in April,decreased sharply in June, and remainedlow throughout the remainder of theyear. This was reflected in the totalmonthly catches around the buoys. Thesharp increase in catch at the buoys inApril corresponded with the start of thefishing season when season (lsh (medium and large skipjack tuna) entered thefishery. The significant drop in themonthly catches around the buoys inJune, July, and August was due to reduced visits to the buoys as a result ofthe presence of these season fish in areasaway from the buoys. Because these fishcommanded two and three times moreper unit price of small fish which predominated in the catch around thebuoys, they drew the boats away fromthe buoy sites.
The high catches of 424,897 poundsin April and 43 I .J 29 pounds in Mayrepresented 5SA and 43.3 percent of therespective total cannery landings. During this period, there were 23 catches ofover 10,000 pounds, 2 catches of over20,000 pounds, and 2 catches of over30,000 pounds. (One boat reportedcatches of nearly 60,000 pounds in a3-day period.) The average catch pervisit was 7,326 pounds in April and 5,389pounds in May.
Fish species taken by pole- and-lineboats at the buoys (Table 3) includedskipjack tuna (89.7 percent), yeliowfIntuna (9.3 percent), kawakawa (0.6 percent), and dolphin (0.3 percent). Theskipjack tuna ranged in size from 2 to 12pounds, with occasional catches of largeIlsh above 20 pounds. Small yellowfll1tuna and kawakawa ranged in size from2 to 12 pounds and dolphin from to to30 pounds. Skipjack tuna were taken atall four sites, but mostly at A and D. Thesingle recorded visit to B consisted of acatch from one skipjack tuna school.Yellowfin tuna were taken mostly at D.with a fair amount at A, and a smallamount at C. Kawakawa were taken atthese three sites also, but the bulk of thecatches were made at C.
The pattern of visits and catches inJ979 did not follow that of the previous
Marine Fisheries Review

Table 1. - Visits and observations at monitored buoys.
A B
Line Catch Bird Line Catch Birdhours per line Fish flock Fish hours per line Fish flock Fish
Date Time trolled Catch hour seen 1 (No. birds) finder 2 Time trolled Catch hour seen l (No. birds) finder'
1977May 26 1600 050 0 0.00 1 0 0845 0.33 1 303 0 20June 14-15 0828 1.42 0 000 3 0 F-15 1103 1.42 1 0.72 3 0 0July 2-3 Buoy lost 1 July 1130 1.50 1 0.67 0 0 F-20July 17 1025 225 0 000 1 0 0Aug. Replaced 8 Aug. Buoy lost 20 JulySept. 12 1015 0.67 0 000 1 250 S-15.25 Replaced 27 Sept.Oct. 19 1026 0.60 0 000 0 0 F-16 1256 0.27 0 000 0 0Nov. 19-20 1235 1.50 0 000 1 15 0 1535 0.95 0 0.00 0 0 0Dec. 15-16 1325 1.15 0 000 0 0 0 Buoy lost 2 Dec.
1978Jan. 23 0926 1.00 0 000 0 0 0Feb. No visie Buoy lost 2 Dec.Mar. 21-23 0738 1.15 1 0.87 0 0 Replaced 20 MarchApr. 13-14 0700 4.00 6 150 TS 1,000 0835 1.67 0 0.00 0 15 0May 30-31 No visit 0925 067 0 0.00 2 0June 1 0735 1.33 0 0.00 150 No visitJuly No visit3 No visit3
Aug. 17-18 1030 2.50 0 0.00 0 0 1010 4.58 7 153 0 25Sept 20-21 0825 075 0 0.00 TS 10 0950 075 0 000 1 0Oct. No visie No visit'Nov No visie No visieDec. Buoy lost 26 Dec. No visit3
1979Jan. Buoy lost No visieFeb. Buoy lost No visitJ
Mar. 6 Replaced 31 Mar 1005 0.67 0 0.00 0 0Apr 11 No visit 0752 0.50 0 000 0 0May No visit NovisitJune 1 0750 2.33 2 086 TS 300 S-15 No visitJune 29 0700 3.50 6 1.71 TS 200 0 No visitJuly 10 0615 267 13 4.87 0 0 0 No visitJuly 10 No visit 0805 5.33 0.19 0 0 0July 31 1700 8.00 1 0.13 0 20 No visitAug. Buoy lost 8 Aug (terminated) Buoy lost 8 Aug. (terminated)
C D
Line Catch Bird Line Catch Birdhours per line Fish flock Fish hours per line Fish flock Fish
Date Time trolled Catch hour seen' (No birds) finder' Time trolled Catch hour seen l (No. birds) finder'
1977May 26 1100 050 0 000 4 50 No visitJune 14-15 1304 133 0 0.00 1 60 0630 125 0 0.00 3 0 0July 2-3 0700 1.40 0 000 2 40 0 0815 450 6 1.33 18 45 0July 17 1200 125 0 0.00 7 0 0 No visitAug. Buoy lost 20 July Buoy lost 20 JulySept 12Oct. 19 Replaced 19 Oct. Replaced 19 OctNov. 19-20 0700 085 0 0.00 0 0 0 1330 1.10 0 0.00 6 0 S-10Dec. 15-16 1450 100 0 000 0 0 0 0640 170 0 000 TS 100
1978Jan. 23 1230 0.93 0 0.00 0 0 0 1750 0.67 0 0.00 0 0 0Feb. Novisit
3No visie
Mar. 21-23 0612 1.40 1 0.71 0 0 1537 0.65 0 000 10 75Apr. 13-14 1810 1.25 0 0.00 0 0 0 1341 2.00 0 0.00 TS 25May 30-31 1043 0.80 0 0.00 0 0 1445 2.33 0 000 TS 50June 1 No visit No viSitJuly Novisit3 No visieAug. 17-18 0735 250 1 0.40 0 0 1715 625 1 016 0 100Sept. 20-21 1210 125 0 000 0 0 1652 150 0 000 TS 30Oct. No visit3 No visit3
Nov No visie No visieDec. NavisitJ No visit3
1979Jan. No visie No visieFeb. No visie Buoy lost 26 Feb. (terminated)Mar. 6 1145 075 0 000 0 0Apr 11 0938 0.33 1 303 0 0May No visitJune 1 Buoy lost 10 June (terminated)June 29
'TS=tuna school.'Scattered fish IF) or school (S) at stated depth in fathoms.'No visits to buoys due to rough seas.
September /981. 43(9) 7
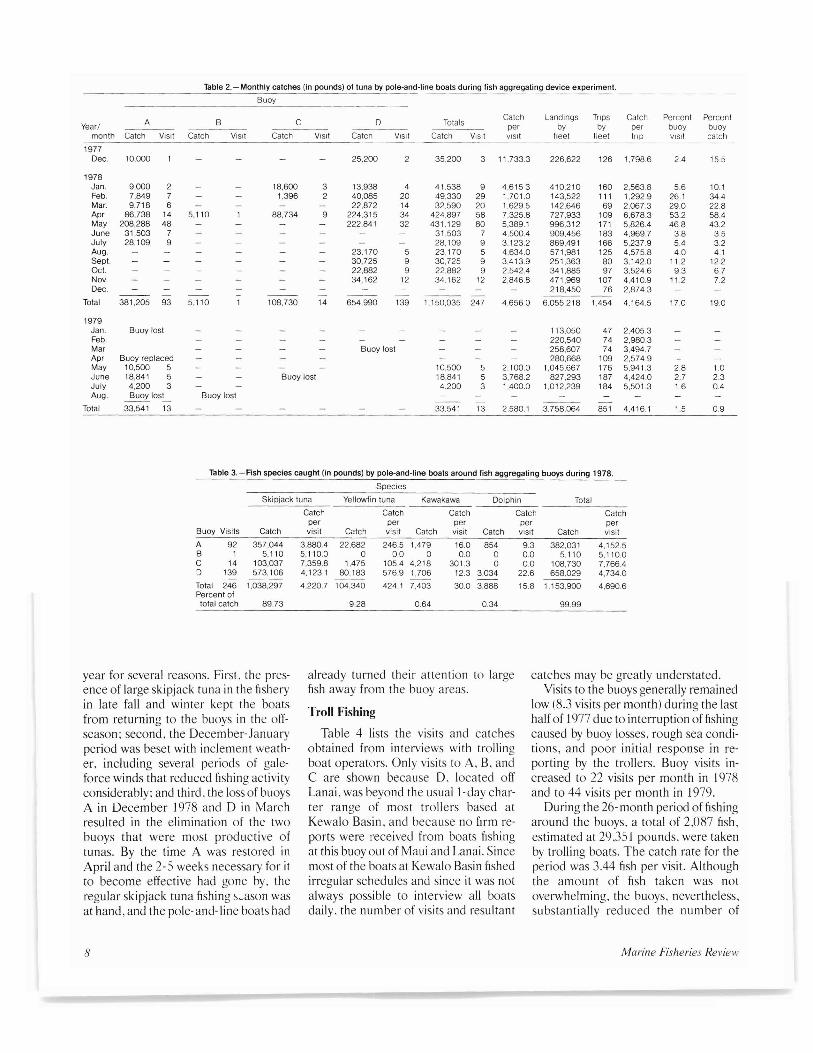
Table 2. - Monthly catches (in pounds) of tuna by pole-and-line boats during fish aggregating device experiment.
Buoy
A B C D TotalsCatch Landings Trips Catch Percent Percent
Year/ per by by per buoy buoymonth Catch Visit Catch Visit Catch VISit Catch V,S,t Catch VISit VISit fleet fleet triP vlSl1 catch
1977Dec. 10.000 25,200 2 35,200 3 11,7333 226,622 126 1.7986 2.4 15.5
1978Jan. 9,000 2 18,600 3 13,938 4 41.538 9 4,6153 410.210 160 2,5638 56 10.1Feb. 7,849 7 1,396 2 40,085 20 49,330 29 1,701.0 143,522 111 1.292.9 26.1 34.4Mar. 9,718 6 22,872 14 32,590 20 1,629.5 142,646 69 2,067.3 290 228Apr 86,738 14 5,110 88,734 9 224.315 34 424,897 58 7,325.8 727,933 109 6,6783 53.2 58.4May 208,288 48 222,841 32 431.129 80 5,3891 996,312 171 5,826.4 468 43.2June 31,503 7 31,503 7 4,500.4 909.456 183 4,969.7 38 3.5July 28,109 9 28,109 9 3.123.2 869,491 166 5,2379 5.4 3.2Aug. 23.170 5 23,170 5 4,634.0 571,981 125 4,575.8 40 4.1Sept. 30,725 9 30,725 9 3,413.9 251,363 80 3.1420 11.2 12.2Oct. 22,882 9 22,882 9 2,542.4 341,885 97 3,5246 9.3 6.7Nov. 34,162 12 34.162 12 2,8468 471,969 107 4,410.9 11.2 7.2Dec. 218,450 76 2,874.3
Total 381,205 93 5,110 108,730 14 654,990 139 1.150,035 247 4,656.0 6.055,218 1,454 4.164.5 170 190
1979Jan. Buoy lost 113.050 47 2,4053Feb. 220,540 74 2,9803Mar Buoy lost 258,607 74 3,494.7Apr Buoy replaced 280,668 109 2,5749May 10,500 5 10.500 5 2.1000 1,045,667 176 5,9413 28 1.0June 18,841 5 Buoy lost 18,841 5 3,768.2 827,293 187 4,424.0 2.7 2.3July 4,200 3 4.200 3 1,4000 1,012,239 184 5,501.3 1.6 0.4Aug. Buoy lost Buoy lost-- -
Total 33,541 13 33.541 13 2,580.1 3,758,064 851 4,416.1 1.5 0.9
Table 3,-Rsh species caught (in pounds) by pole-and-line boats around fish aggregating bUoys during 1978.
Species
Skipjack tuna Yellow!in tuna Kawakawa Dolphin Total-------Catch Catch Catch Catch Catch
per per per per perBuoy Visits Catch visit Catch visit Catch visit Catch visit Catch visit
A 92 357,044 3,880.4 22,682 2465 1,479 16.0 854 93 382,031 4,152.5B 1 5,110 5,110.0 0 00 0 0.0 0 00 5,110 5,1100C 14 103,037 7,359.8 1,475 105.4 4,218 3013 0 00 108,730 7.766.4D 139 573,106 4,123.1 80,183 576.9 1,706 123 3,034 22.6 658,029 4,7340
- ---Total 246 1,038,297 4,220.7 104,340 424.1 7,403 30.0 3,888 158 1.153,900 4,6906Percent oftotal catch 89.73 928 0.64 0.34 99.99
year for several reasons, First, the presence of large skipjack tuna in the fisheryin late fall and winter kept the boatsfrom returning to the buoys in the offseason; second, the December-Januaryperiod was beset with inclement weather, including several periods of galeforce winds that reduced fishing activityconsiderably: and third, the loss of buoysA in December 1978 and D in Marchresulted in the elimination of the twobuoys that were most productive oftunas, By the time A was restored inApril and the 2- 5 weeks necessary for itto become effective had gone by, theregular skipjack tuna fishing ~~ason wasat hand, and the pole- and-line boats had
8
already turned their attention to largefish away from the buoy areas,
Troll Fishing
Table 4 lists the VISits and catchesobtained from interviews with trollingboat operators, Only visits to A, B, andC are shown because D, located offLanai, was beyond the usuall-day charter range of most trollers based atKewalo Basin, and because nO firm reports were received from boats nshingat this buoy out of Maui and Lanai, Sincemost of the boats at Kewalo Basin fishedirregular schedules and since it was notalways possible to interview all boatsdaily, the number of visits and resultant
catches may be greatly understated,Visits to the buoys generally remained
low (8,3 visits per month) during the lasthalf of 1977 due to interruption of fishingcaused by buoy losses, rough sea conditions, and poor initial response in reporting by the trollers, Buoy visits increased to 22 visits per month in 1978and to 44 visits per month in 1979.
During the 26-month period of fishingaround the buoys. a total of 2.087 fish,estimated at 29.351 pounds, were takenby trolling boats. The catch rate for theperiod was 3.44 fish per visit. Althoughthe amounl of ush taken was notoverwhelming, the buoys. nevertheless.substantially reduced the number of
Marine Fisheries Review

zero-catch days (interviews with boat nearly 72 percent were from sites Band Kawakawa represented 9.0 percent ofoperators). From April through July C in roughly equal amounts; and of the total catch, with roughly 41 percent1978. the period of greatest flsh concen- the 481 skipjack tuna and 540 yellow- taken from A, 36 percent from B, and 23tration around the buoys. trollers caught fin tuna taken, nearly 88 and 90 per- percent from C. Marlins, Ma kaira~76 hsh (estimated weight 11.288 cent, respectively, were from site A. nigricans and Tetrapturus audax, andpounds) at a catch rate of 10.55 fish pervisit. The concpotrations of fish aroundthe buoys were not as great during thesame period in 1979. Only 546 fish (es-
Table 4.-Fish caught by trolling boats based at Kewalo Basin.timated weight 10.156 pounds) were A B C All buoyscaught at a cat:h rate of 2.92 fish per No. No. No. No. Catch
visit. Both catch and catch r'lle were Year/ of WI. of Wt. of Wt. of WI. per
affected greatly by reduced fishing at A.month Visit fish (Ib) Visit fish lib) Visit fish lib) Visit fish (Ib) visit
1977the most productive buoy. which was June 8 18 475 3 0 0 4 1 5 15 19 480 1.26
lost in December 1978 and was not July 5 57 335 1 11 55 6 68 390 1133Aug. 2 0 0 2 0 0 0.00
replaced until March 1979. Sept. 2 4 25 2 4 25 2.00
Fishing effort varied at the different Oct. 12 89 187 7 22 170 0 0 20 110 357 5.55Nov. 2 1 10 2 3 40 0 0 5 4 50 080
buoy sites. Buoy A was visited most of- Dec.
ten (51.0 percent of all buoy visits) and Total 26 112 697 17 82 545 12 60 50 206 1,302 4.12
yielded the most catch (61.5 percent of 1978
total buoy catch). Buoy B received 26.4 Jan. 9 52 327 7 61 439 16 113 766 706Feb. 9 29 216 7 3 26 16 32 242 2.00
percent of all visits and yielded 17.7 per- March 6 6 272 5 3 50 11 9 322 082
cent of the total buoy catch, and buoy C April 14 236 2,499 3 5 84 6 38 395 23 279 2,978 12.13May 19 294 4.083 8 23 363 9 129 992 36 446 5,438 12.39
recorded 22.6 percent of all visits and June 6 35 431 4 32 452 4 33 591 14 100 1,474 7.14
yielded 20.X percent of the catch. AI-July 7 45 1,340 1 2 16 2 4 42 10 51 1.398 5.10Aug. 11 14 327 1 7 42 5 17 148 17 38 517 224
though buoys Band C were not pro- Sept. 5 17 1,001 1 2 38 6 19 1.039 317Oct. 31 26 953 8 9 152 12 6 105 51 41 1.210 0.80
ductive of tunas, they were ideally placed Nov. 37 33 210 8 10 135 6 6 165 51 49 510 0.96
to attract dolphin from nearby Penguin Dec. 3 10 250 8 1 6 6 2 15 17 13 271 076- - -- - - -- - - -- ------
Bank. Several boats that preferred troI- Total 157 797 11.933 42 91 1,288 69 302 2,944 2681,19016.165 4,44
ling for dolphin made regular visits to 1979
these sites. The catch rate of dolphin atJan. 11 18 189 10 21 205 21 39 394 185Feb. 37 69 1,705 15 18 322 52 87 2,027 167
these two sites averaged 1.87 fish per March 10 4 51 16 15 180 12 4 48 28 19 228 068April 10 4 51 7 11 144 8 14 171 25 29 366 116
visit, as compared with 0.70 fish per May 59 189 2,582 15 36 594 15 61 2.076 89 286 5.252 321
visit to A. June 27 136 1,551 6 22 434 1 3 60 34 161 2.045 474July 30 45 1.315 9 25 257 39 70 1.572 1.79
Twelve species of fish were taken by - - - - -- - ---Total 126 374 5,499 101 196 3.503 61 121 2.882 288 691 11,884 240
trollers around the buoys (Table 5). 001-Total for
phin comprised the largest group (37.0 period 309 1.283 18,129 160 369 5,336 137 435 5,886 6062.08729.351 344
percent), followed by yellowfln tunaPercent of
(25.9 percent), and skipjack tuna (23.0 all FAD
percent). Of the 772 dolphin taken, totals 51.0 615 61.8 264 177 182 22.6 20.8 20.0
Table 5.-Species and number of fish caught by trolling boats around fish aggregating buoys. May 1977-July 1979.
Buoy
A B C Total
Catch/ Catch/ Catch/ Catch/ PercentSpecies Visit Catch visit Visit Catch visit Visit Catch visit ViSit Catch visit of total
Skipjack tuna 309 423 1.37 160 3 002 137 55 040 606 481 079 230Yellowfin tuna 484 1.57 12 0.08 44 0.32 540 089 259Bigeye tuna 11 0.04 0 000 10 007 21 0.04 1.0Kawakawa 77 025 68 042 43 0.31 188 031 9.0Dolphin 217 070 275 1.72 280 2.04 772 127 37.0Wahoo 30 010 8 0.05 2 002 40 007 19Blue marlin 15 0.05 3 0.02 1 0.01 19 003 0.9Striped marlin 2 0.01 0 000 0 0.00 2 <0.01 0.1Spearfish 3 001 0 000 0 000 3 <001 01Rainbow runner 16 0.05 0 000 0 0.00 16 0.03 0.8Greater amberjack 3 0.01 0 0.00 0 000 3 <0.01 01Barracuda 2 001 0 0.00 0 000 2 <0.01 01-- - - - - --Total 309 1.283 4.15 160 369 2.31 137 435 3.18 606 2.087 344
September 1981, 4](9) 9

Tab'e 6. - Underwater observalions of fish al fish aggregaling buoys off Lanai and Kana, Hawaii.
Estimated Est. fish DepthDate Buoy Locality Fish observed number size (Ib) range 1m)
197715 Dec, D Lanai Dolphin 14-16 15-20 0-35,
Sea chub, Kyphosus eineraseens 50-100 N.s.Scrawled filefish. A/uterus scriptus 2 N.s.
197830 May D Lanai Yellowfin tuna 800-1.000 6-8 0->50
Dolphin 10-12 10-15 0->35Rainbow runner 15-20 <1 0->35Rough triggerlish, Canthidermis maculatus 80 N,s,Porpoises 12
27 July F Kana Skipjack tuna 200-300 2-10 0->70Yellow!in tuna 6 >50Bigeye tuna 1Wahoo 3 15-20 15Rainbow runner 6 0-35Mackerel scad >5,000 0->70Freckled driftfish, Psenes cyanophrys 50 N.s,Rough triggerfish 4 N.s,Pilotfish, Nauerates duetor 2 N,s,
12 Aug. F Kana Skipjack tuna Many 1,000's 2-10 0->70Bigeye tuna 3 20-30 >35Rainbow runner 12 0-70Mackerel scad Many l,OOO's 0-70Freckled driftfish 200-300 N.s.Rough lriggerfish 12 0-35
197910Aug, F Kana Wahoo 2 10-15 0-35
Rainbow runner 4 0-35Mackerel scad 1,000 0-35Greater amberjack 5 Juvenile N.s.Rough triggerfish 60 N.s,
IN .5. = near SL: rface
shortbill spearfish, T angustirostris,represented 1.2 percent of the totalcatch. Nearly all (83.3 percent) were taken at site A. All other fish, includingbigeye tuna, Thunnus obesus; wahoo;rainbow runner, Elagatis bipinnulata;amberjack, Seriola dumerili; and barracuda, Sphyraena argentea, comprised3.9 percent of the total catch. All bigeyetuna, except 10, were taken at A. Thebillfishes were generally taken about 0.5to 1.5 miles away from the buoy, whereas the skipjack and yellowfin tunas werecaught all the way from the buoy up to3-5 miles away. Most of the other species were taken within 200-300 yards ofthe buoy.
Occasional reports from Maui indicated heavy fishing activity around buoyD, where individual boat catches of300-700 pounds of skipjack (8-10 poundsize) and yellowfin (30-50 pound size)tunas, and 100 pounds of dolphin perweekend were commonly made in April1978.
Reports from Kona indicated the success of the buoys placed there. Buoy F,in particular, which had been placed atthe edge of an outstanding fishing area,was teeming with skipjack and yellowfintunas within 5 weeks after deployment.Trollers were able to catch small skipjack tuna for marlin bait in 10-15 minutes, compared with half a day or morebefore the buoy was in place. During theheight of the summer marlin run, manytrollers who took advantage of the accessibility of bait-size skipjack tuna atbuoy F reported catches of three andfour marlin a day. One boat reportedcatching 11 marlin in a period of 10consecutive days of fJshing, while another caught 20 marlin in 20 days.
Other Types of Fishing
The buoys off Kona also attractedmany commercial skiff fishermen usingthe "drop- stone" method to fish for 50200 pound yellowfin tuna usually accompanying porpoise schools. The gearis essentially a handline using 10- to12- inch mackerel scad as bait. Thehooked bait is laid on a smooth stoneweighing about 2 pounds together witha package of mackerel scad chopped upand wrapped in a chum bag. Both baitand chum bag are bound to the stone by
lU
a few turns of the mainline and securedwith a slipknot. The stone is lowered30-60 fathoms and is jerked free to expose the bait and chum. Fishing wasdone by positioning the skiff in the pathof a porpoise school and dropping theline as the school approached the skiff.The buoys enabled fishing during periods when porpoise schools were absentfrom the area.
One report in June 1978 indicatedthat up to 50 trolling and handline boatsfishing at G brought in 35,000 pounds ofyellowfin tuna and marlins on one weekend and that the drop-stone skiffs averaged from three to four yellowfin tunaper day.
Underwater Observation
Observations by divers were made onfive occasions, twice at D and threetimes at F (Table 6). Dives were madegenerally to depths of 100 or 150 feet.Tuna schools were seen on one dive at Dand two dives at F.
A yellowfin tuna school observed at 0(Fig. 8), composed of 6-8 pound fish,
roamed from beneath the buoy to distances of 0.5 mile or more repeatedly.Its roaming behavior may have beeninduced by the presence of porpoises_The school became more compact andmoved about more rapidly each time aporpoise approached it.
The skipjack tuna schools observedat F behaved differently. On the firstdive, 27 July 1978, groups of severalhundred skipjack tuna rose to within100 feet of the surface from below. Themajor skipjack tuna school was situatedat depths beyond 250 feet beneath thebuoy, beyond the visibility of the divers.On the second dive, 12 August 1978,many thousands of skipjack tuna wereconstantly in view of the divers and onseveral occasions, part of the school wasseen to pursue baitfish (mackerel scad)to the surface within 30 feet of the buoy.
Discussion
The study provided information concerning buoy design, tuna schools attracted to fish aggregating devices, andthe influence these devices had in modi-
Marine Fisheries Reviell'

Figure 8.- Yellowfin tuna school accompanied by porpoise beneath fish aggregating device.
fying the established fishing routine inHawaiian waters.
Buoy Design
For the most part, the buoys, as designed, performed adequately. However, the intermittent submerging andshifting of buoy D during periods ofunusually strong tidal current indicatedthat the design was inadequate for thatparticular site. To prevent similar mishaps, the buoy should be enlarged to
three steel drums and the anchor weightshould be increased to 2,000-3,000pounds. Other modifications include therelocation of the anchor line attachmentto the apex of the forward V section andthe addition of a 40- 50 pound weight tothe ballast pipe to prevent the buoy fromleaning over.
The importance of the drape cannotbe overemphasized. Although small fishof 2- 5 inches tended to remain as closeto the buoy as possible, and often strayedinside of the V section, it was mainlybecause of the drape that large fishremained at the buoy site over prolongedperiods. The reduction of fish aggregations and catches at buoys that had lostthe drapes were quickly noticed by thefishermen, who clamored for immediaterestoration.
The drape should be made of material that can withstand the stresses of currents and heavy wave action. The drape
September 1981, 4J(9;
made of Y8- inch polypropylene rope waseffective in attracting fish, as well asbeing long lasting: however, the drapeneed not encircle the buoy, as in ourexperiment. Five to seven lengths of ropehung vertically and seized onto horizontal bamboo crosspieces, spaced 3- 5 feetapart, and short pieces of loosened ropestrands attached at intervals of 24 inchesto each length of rope, should make anadequate drape.
The buoy, as designed, was adequatefor trolling and pole- and-line fishing. Forpurse seine fishing, however, the drapeshould be lengthened to about 100 feet,the chain at the top of the mooring lineshould be 120 feet long, and the positionof the weight on the mooring line shouldbe adjusted so that the upper loop of thebuoyant rope will remain at a depth of100 fathoms or more at all times.
Tuna Aggregations Around Buoys
Distribution by Size
The fish aggregating devices attractedall sizes of tunas ranging from below 2 toover 20 pounds. Small fish below 3- 4pounds (skipjack tuna, yellowfin funa,kawakawa, and a few bigeye tuna) generally remained in the immediate vicinity of the buoys and ranged in depth fromthe surface to over 250 feet. Larger fish,mainly skipjack and yellowfin tunas,roamed over wider areas from 0.25 to 3
miles or more from the buoys during theday. These fish apparently returned to
the buoys at night since the day's firstcatches by bait boats were invariablymade at the buoys at daybreak. The baitboats moved away from the buoys aftersunrise as they continued to fish theschools.
Medium-sized yellowfin tuna, 30-50pounds or more, and often exceeding100 pounds. were caught on baited linesby either deep trolling at reduced speedor by handlining while drifting. Thesefish were caught anywhere within 1 mileof the buoys.
Other fish such as marlin and spearfishwere usually taken by trollers at distances of up to 1.5 miles from the buoys,whereas dolphin were usually taken wellwithin 100 feet of the buoys and up to0.5 mile away.
Multiple Schools at Buoys
It was evident from the daily catchreports by bait boats that more than onetuna school was present around a buoyat the same time. During the height offishing activity around the buoys (Apriland May 1978), from two to six baitboats reported catches from the samebuoy on 30 separate days. It is likely thatsome of the catches were made at different times of the day, but because thebest fishing usually occurred at sunrise,it was not uncommon for more than oneboat to be at a buoy site well beforedaybreak and for all of them to commence fishing at sunrise. This was corroborated by trolling boat operators whorepeatedly witnessed two or more baitboats fishing simultaneously, each onseparate schools spaced up to 3 milesapart.
Length of Time at Buoys
In the absence of tagging effort, it wasnot possible to determine how long atuna school or individual tuna remainedat a buoy site. Catches made on consecutive days at the same buoy, however,indicate roughly the length of time fishschool(s) remained around a buoy andwere thus available to the fishermen.
Catches on consecutive days in 1978,the year visits to the buoys were mostprevalent, are shown in Table 7. Nearlyall of the 2 and 3 consecutive-day
11
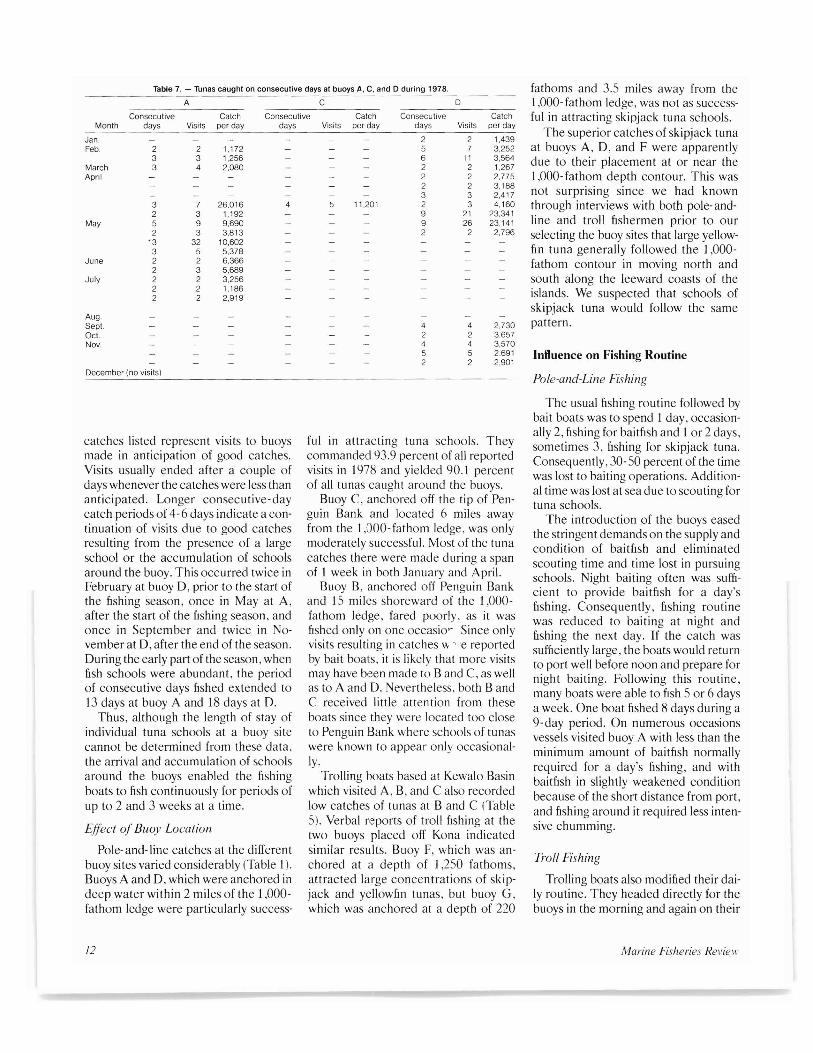
Table 7. - Tunas caught on consecutive days at buoys A, C, and D during 1978.
A C D
Consecutive Catch Consecutive Catch Consecutive CatchMonth days Visits per day days Visits per day days Visits per day
Jan. 2 2 1,439Feb. 2 2 1.172 5 7 3.252
3 3 1.256 6 11 3,564March 3 4 2.080 2 2 1.267April 2 2 2.775
2 2 3.1883 3 2,417
3 7 26.016 4 5 11.201 2 3 4.1602 3 1.192 9 21 23.341
May 5 9 9.690 9 26 23.1412 3 3.813 2 2 2.796
13 32 10.6023 5 5.378
June 2 2 6.3662 3 5.689
July 2 2 3.2562 2 1.1862 2 2.919
Aug.4 4 2.730Sept.2 2 3.657Oct.4 4 3.570Nov.5 5 2.6912 2 2.901
December (no visits)
catches listed represent visits to buoysmade in anticipation of good catches.Visits usually ended after a couple ofdays whenever the catches were less thananticipated. Longer consecutive-daycatch periods of 4- 6 days indicate a continuation of visits due to good catchesresulting from the presence of a largeschool or the accumulation of schoolsaround the buoy. This occurred twice inFebruary at buoy D, prior to the start ofthe fishing season, once in May at A,after the start of the fishing season, andonce in September and twice in 0
vember at D, after the end of the season.During the early part of the season, whenfish schools were abundant, the periodof consecutive days fished extended to13 days at buoy A and 18 days at D.
Thus, although the length of stay ofindividual tuna schools at a buoy sitecannot be determined from these data,the arrival and accumulation of schoolsaround the buoys enabled the fishingboats to fish continuously for periods ofup to 2 and 3 weeks at a time.
Effect of Buoy Location
Pole-and-line catches at the differentbuoy sites varied considerably (Table 1).Buoys A and D, which were anchored indeep water within 2 miles of the 1,000fathom ledge were particularly success-
/2
ful in attracting tuna schools. Theycommanded 93.9 percent of all reportedvisits in 1978 and yielded 90.1 percentof all tunas caught around the buoys,
Buoy C, anchored off the tip of Penguin Bank and located 6 miles awayfrom the 1,000- fathom ledge, was onlymoderately successful. Most of the tunacatches there were made during a spanof 1 week in both January and April.
Buoy B, anchored off Penguin Bankand 15 miles shoreward of the 1,000fathom ledge, fared poorly, as it wasDshed only on one occasio r Since onlyvisits resulting in catches v,. "e reportedby bait boats, it is likely that more visitsmay have been made to Band C, as wellas to A and D. Nevertheless, both BandC received little attention from theseboats since they were located too closeto Penguin Bank where schools of tunaswere known to appear only occasionally.
Trolling boats based at Kewalo Basinwhich visited A, B, and C also recordedlow catches of tunas at Band C (Table5). Verbal reports of troll Dshing at thetwo buoys placed off Kona indicatedsimilar results. Buoy F, which was anchored at a depth of 1,250 fathoms,attracted large concentrations of skipjack and yellowfIn tunas, but buoy G,which was anchored at a depth of 220
fathoms and 3.5 miles away from theI ,OOO-fathom ledge, was not as successful in attracting skipjack tuna schools.
The superior catches of skipjack tunaat buoys A, D, and F were apparentlydue to their placement at or near the1,000- fathom depth contour. This wasnot surprising since we had knownthrough interviews with both pole-andline and troll fishermen prior to ourselecting the buoy sites that large yellowfin tuna generally followed the 1,000fathom contour in moving north andsouth along the leeward coasts of theislands. We suspected that schools ofskipjack tuna would follow the samepattern.
Influence on Fishing Routine
Pole-and-Line Fishing
The usual fishing routine followed bybait boats was to spend 1 day, occasionally 2, fishing for baitfIsh and I or 2 days,sometimes 3, Dshing for skipjack tuna.Consequently, 30-50 percent of the timewas lost to baiting operations. Additional time was lost at sea due to scouting fortuna schools.
The introduction of the buoys easedthe stringent demands on the supply andcondition of baitfIsh and eliminatedscouting time and time lost in pursuingschools. Night baiting often was sufficient to provide baitnsh for a day'snshing. Consequently, Dshing routinewas reduced to baiting at night andnshing the next day. If the catch wassufficiently large, the boats would returnto port well before noon and prepare fornight baiting. Following this routine,many boats were able to fish 5 or 6 daysa week. One boat nshed 8 days during a9-day period. On numerous occasionsvessels visited buoy A with less than theminimum amount of baitfIsh normallyrequired for a day's nshing, and withbaitnsh in slightly weakened conditionbecause of the short distance from port,and nshing around it required less intensive chumming.
Troll Fishing
Trolling boats also modined their daily routine. They headed directly for thebuoys in the morning and again on their
Marine Fisheries Review

way into port. Some trollers even changedtheir fishing method by either trollingdeep with live bait at very low speed ordrifting and fishing with light tackle orhandlines.
Handline Fishing
In Kona, Hawaii, where hand lining(drop-stone fishing) for medium to largeyellowfIn tuna has been going on for anumber of years, the introduction of thebuoys provided an additional dimensionto fishing. In the past, daylight fishingfor large yellowfIn tuna accompanyingporpoises was done by dropping lines inthe midst of a school of porpoises. Theporpoise schools usually passed throughthe area within a day or so. With theinstallation of the buoys, however, theporpoise schools remained in the areafor many days at a time, circling thebuoys at distances of 4-6 miles all daylong.
A similar type of fishing called ikashibi fishing, is done off Hilo, Hawaii,where squid is used as bait. supplemented by mackerel scad (Yuen. 1979). Because live squid is used as the principalbait, fishing is done usually at night. Thefishery, which began in 1973, showspromise of becoming an important segment of Hawaiian fisheries. The catch.consisting of bigeye and yellowfIn tunasand, occasionally, albacore, increasedfrom 89.0 t in 1973 to 154.6 t in 1975.This tlshery could benetlt from fish aggregating devices.
September /981. 4](9)
Buoy Benelits
It is not possible to determine precisely what the total pole-and-line catchmight have been without the buoys in1978. nor to what extent the buoys hadincreased the off-season catches because both monthly and year-to-yearcatches of the fishery fluctuate widely.There is no question. however, that thebuoys were a boon to the pole-and-linefishermen, particularly with respect tomore economical use of baitfIsh, to areduction of time lost to baiting andsearching for tuna schools, and to reduced fuel costs.
The buoy test, which was aimed primarily to aid the skipjack tuna fishery.resulted in two important side benefits.One was the heavy use of the buoys bytrolling boats. the other was the utilization of the buoys by drop-stone commercial fishermen, who were able to extend the fishing of porpoise-associatedtunas from one to several days and enabled fishing in the absence of porpoiseschools.
Acknowledgements
We wish to thank the captain and crewof the MY Easy Rider and officers andcrew of the NOAA ship TownsendCromwell for their excellent cooperation in mooring the buoys and monitoring the fish catch data, and ShojiTeramoto. Honolulu Laboratory. for
assistance in contacting tuna boat captains for information of fishing aroundthe buoys. Special thanks go to GeorgeParker. Kona charter boat owner, forthe use of his boat to monitor and repairthe buoys off Kona, Hawaii, and toCharles Spinney. Kona charter boatowner, for recovering and towing to safety a buoy that had been cut loose fromits mooring.
Literature Cited
Inoue. Moo R. Amano.and Ylwasaki. 1963. Studieson environments alluring skipjack and othertunas. I. On the oceanographical condition ofJapan adjacent waters and the drifting substances accompanied by skipjack and othertunas. IIn Jpn .. Engl. summ.1 Rep. Fish. Res.Lab.. Tokai Univ. J( I ): 12- 23.
___ . . . and M. Yama-uti. 1968. Studies on environments alluring skipjack and other tunas. - II. On the driftwoodsaccompanied by skipjack and tunas. Bull. Jpn.Soc. Sci. Fish. 34:283-287.
Kimura. K. 1954. Analysis of skipjack (Katsllll"OnliSpelamisl shoals in the water of oOTohoku Kaiku"hy its association with other animals and ohjectsbased on the records by fishing boats. lIn JpnooEngl. synop.j Tohoku Reg. Fish. Res. Lab. Bull.3.87 p.
McNeely. R. L. 1961. Purse seine revolution in tunafishing. Pac Fish. 59(7):27-58.
PTDF. 1979. Pacific Tuna Development Foundation. 1978 annual report. 22 p. Pac. Tuna Dev.Found .. Honolulu.
Siegel. S. 1956. Nonparametric statistics for the behavioral sciences. McGraw-Hill. N.Y.. 312 p.
Uda. M. 1933. Types of skipjack schools and theirfishing qualities. lIn Jpn.1 Bull. Jpn. Soc. Sci.Fish. 2:107-111. (Engl. transl. In w.G. VanCampen. 1952. Five Japanese papers on skipjack. U.S. Fish Wildl. Servoo Spec. Sci. Rep. Fish.S3:61\-71\.1
Yuen. H.S. H. 1979. A night handline fIshery fortunas in Hawaii. Mar. Fish. Rev. 4I1SI:7·14.