analyzing performance of qtquick applications - … · analyzing performance of qtquick...
TRANSCRIPT

Analyzing Performance of QtQuick Applications
Thomas McGuireKDAB

Performance: Multiple Aspects
• Startup Duration• Smooth Rendering / Frames per Second• Responsiveness• Boot Duration• Power Usage• Memory Usage

Startup Time
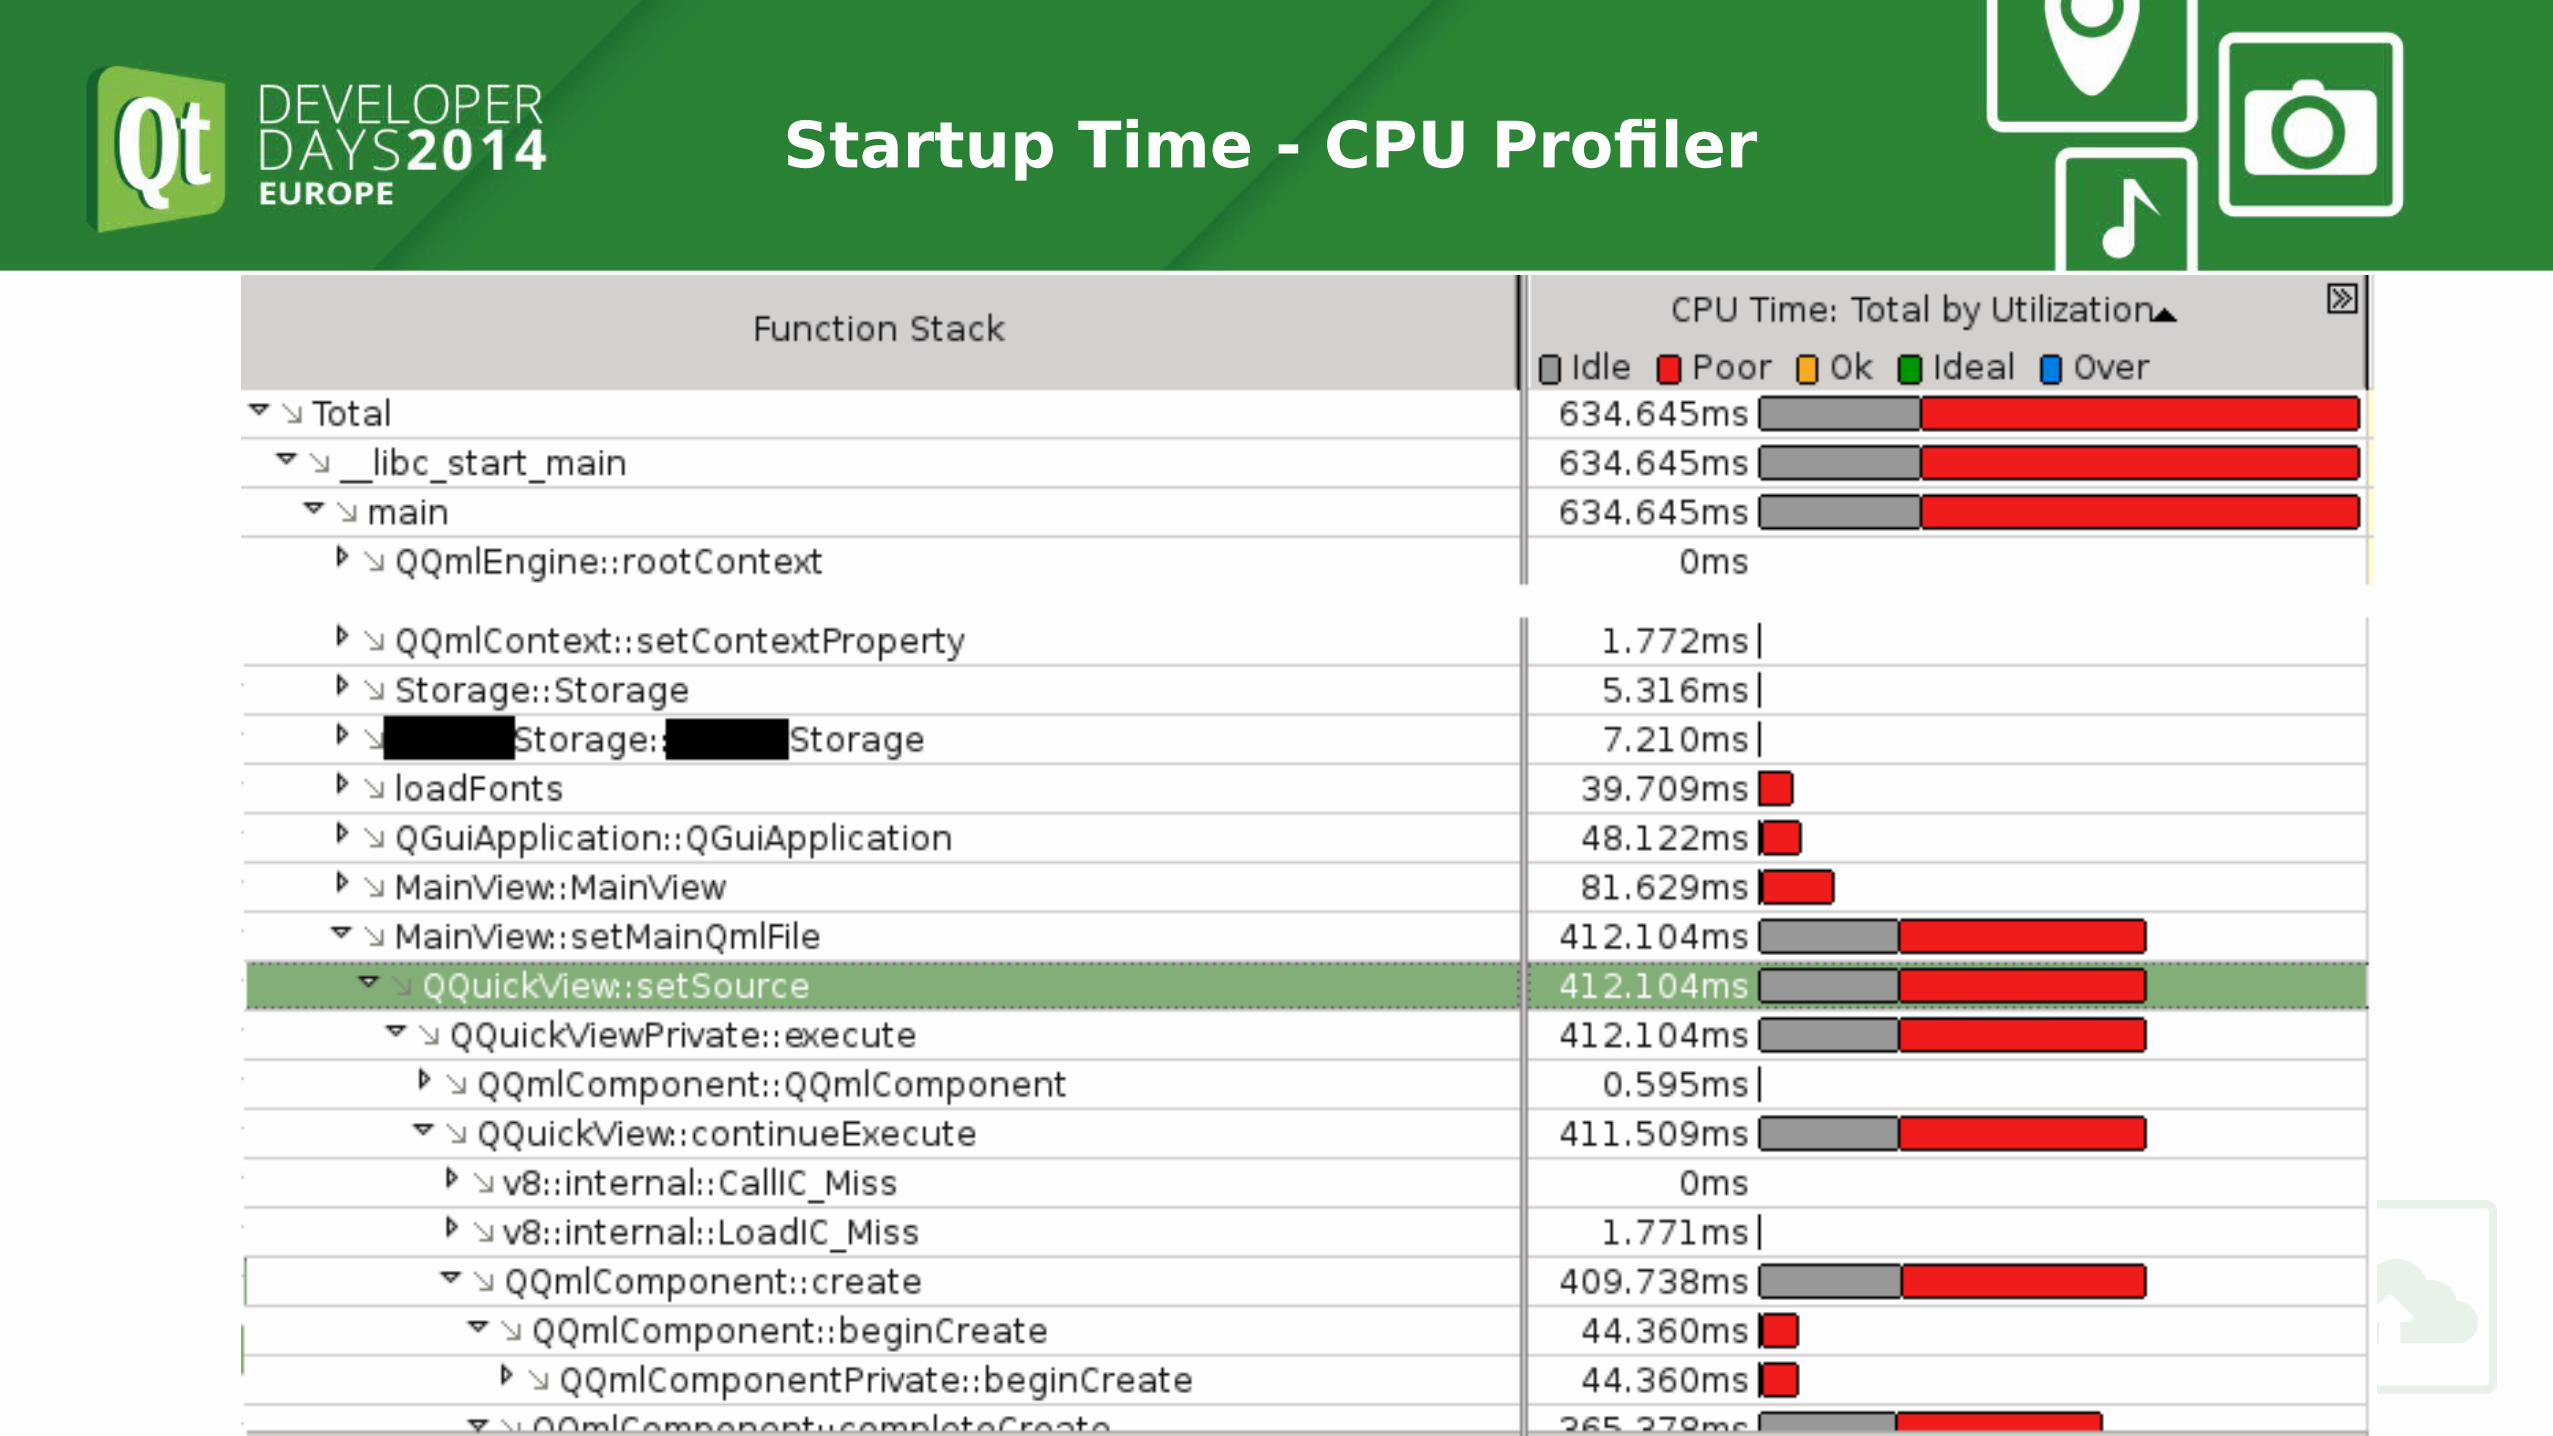
Startup Time - CPU Profiler

Startup Time - CPU Profiler
• Pay attention to what you measure
– Cycle count does not include time blocked!
– Compile in release mode
– Profile on target device
– Profile with cold cache
• User code and QML engine code
– QML engine part opaque
– high level tooling required

Startup Time - Meet the QML Profiler

Startup Time - Meet the QML Profiler
• Use Qt 5.4 and QtCreator 3.2• Enable profiler in settings
– QMake CONFIG flag
– run argument
• Record only what you need

Startup Time - Example

Startup Time - 4 phases
1.Compiling
2.Creating
3.Bindings
4.Completion
– JS: Component.onCompleted
– C++: QQuickItem::componentComplete()
– Text layouting, image loading, creation of Repeater/ListView delegates, ...
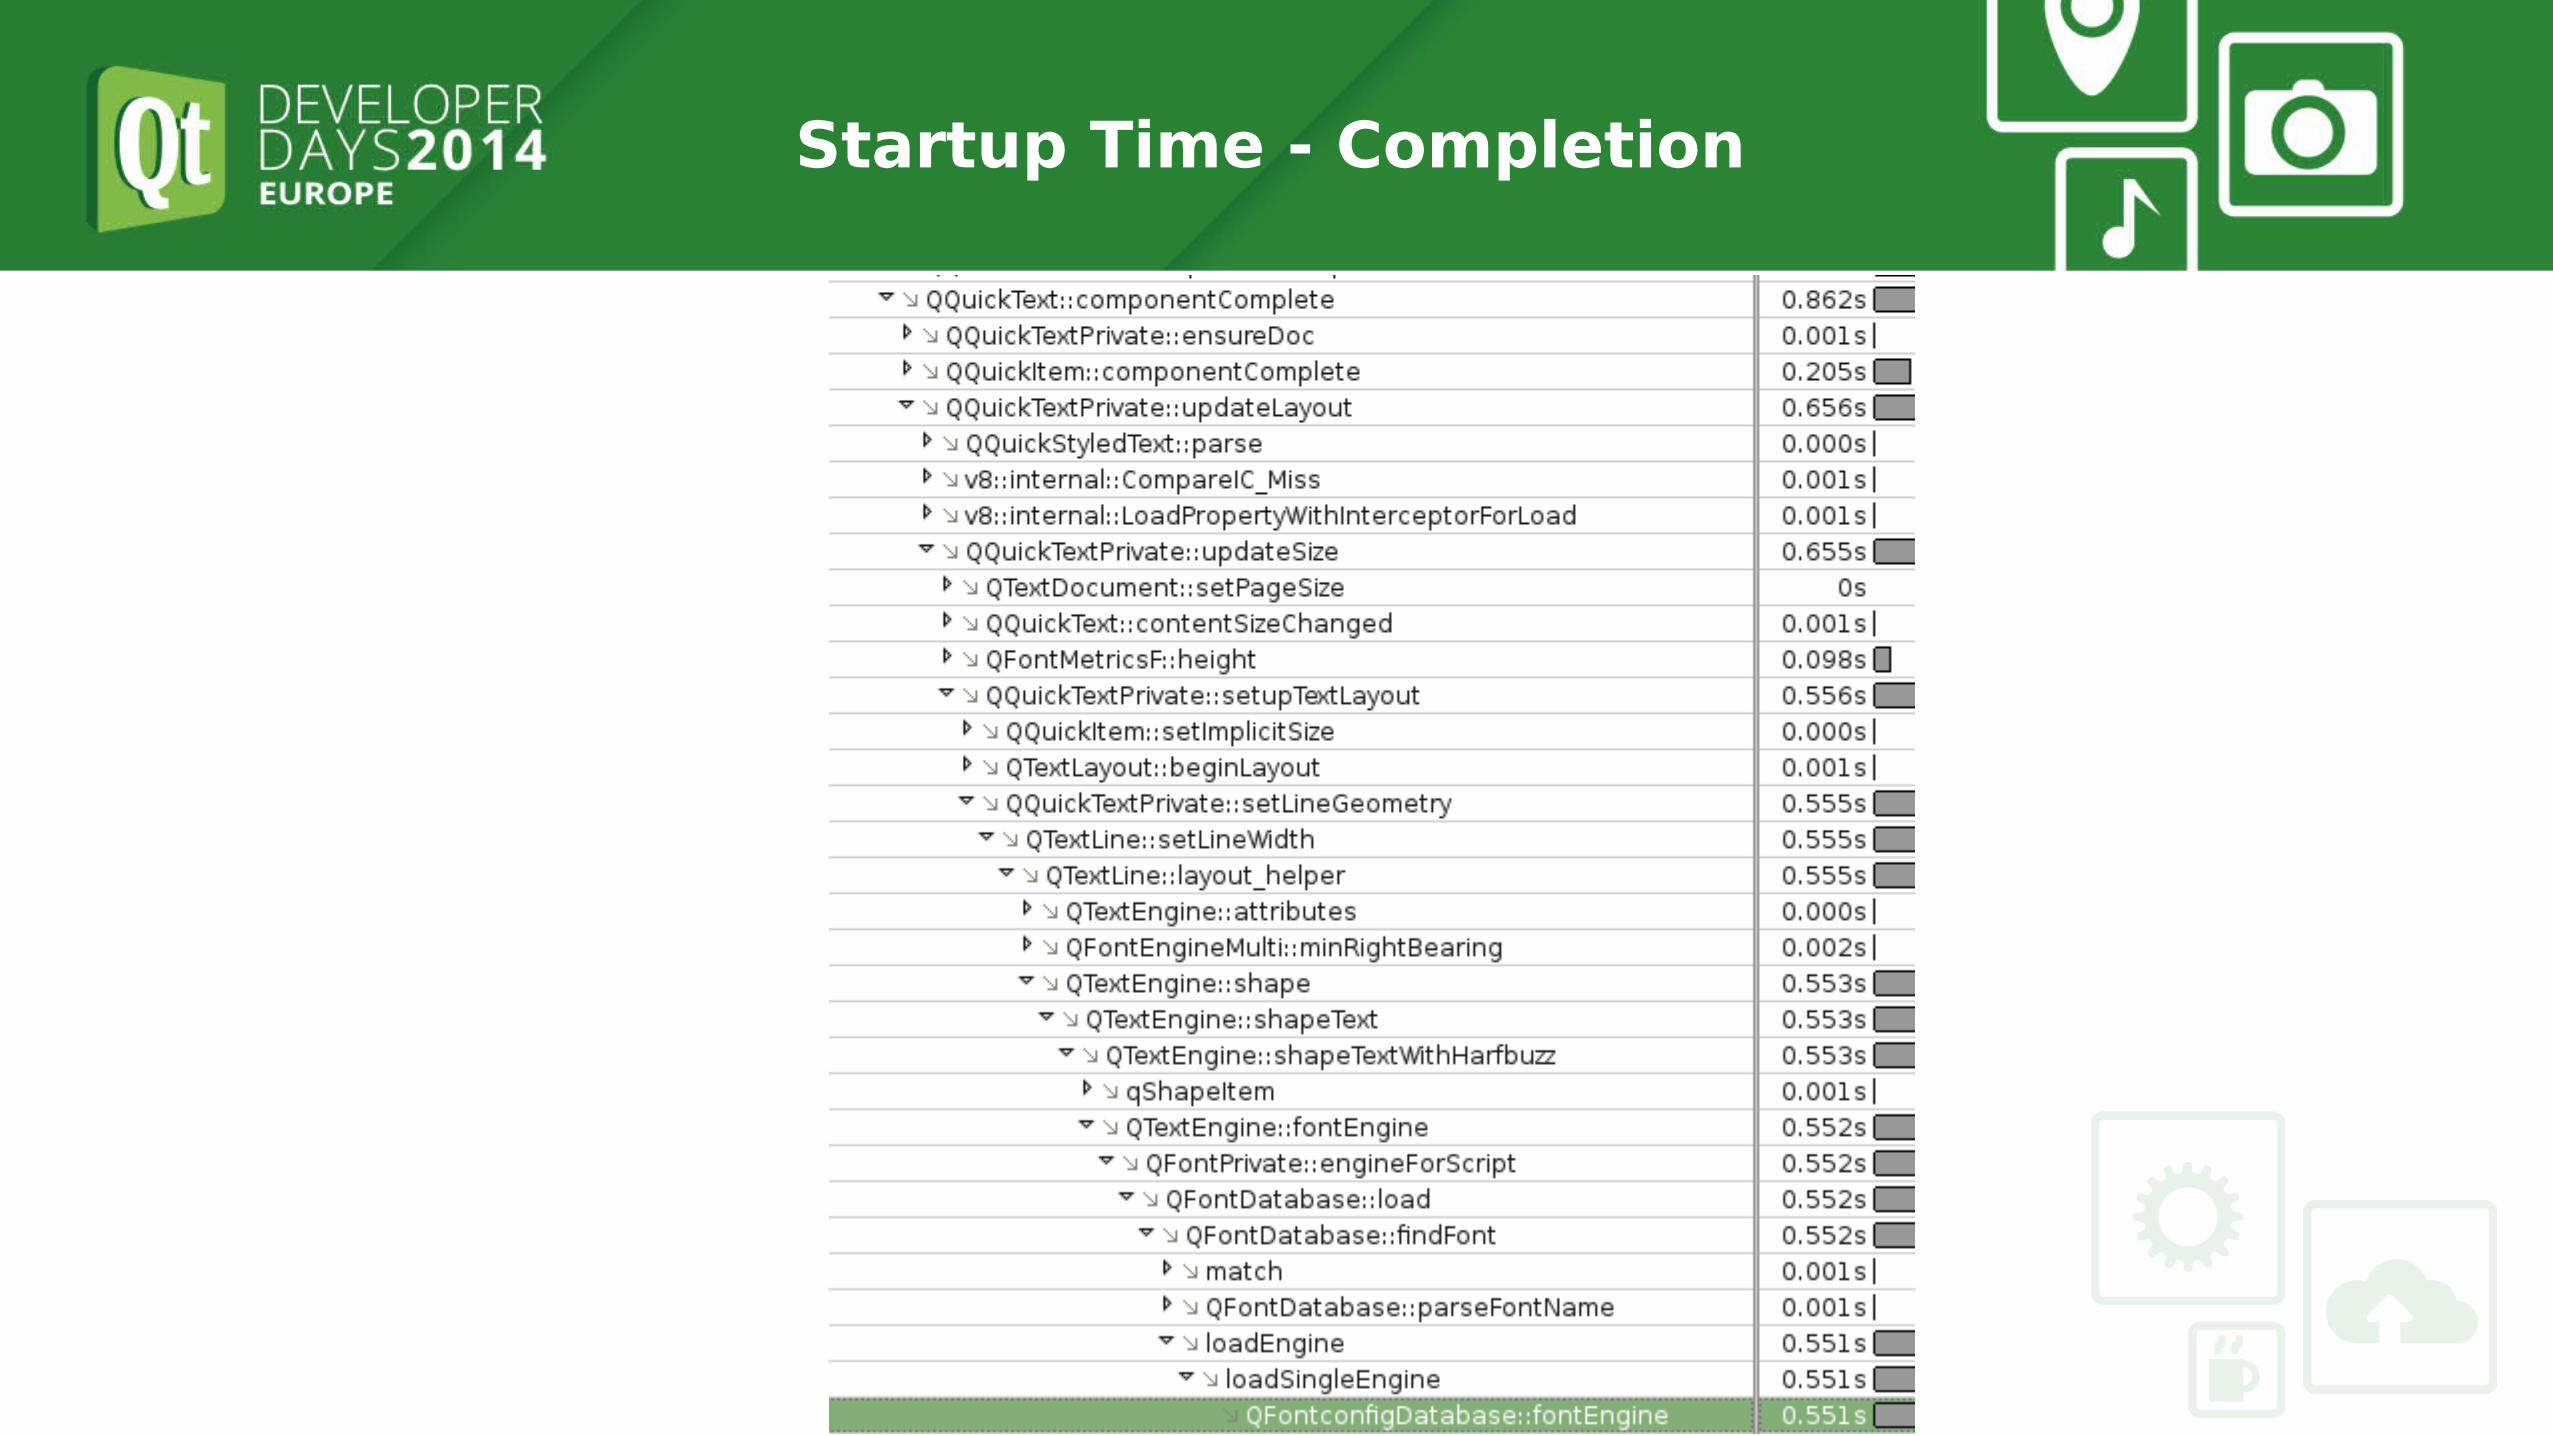
Startup Time - Completion

Startup Time - Completion
●Removing fonts improved startup from 900ms to 200ms●Completion phase shrunk considerably

Startup Time - Compilation
• Compilation phase fast, small amount of total• Runs in a separate thread• QtQuick Compiler pre-compiles files
– Phase reduced by ~50%
– Available since Qt 5.3 Enterprise

Startup Time - Bindings/JS
• Keep bindings simple• Move complex code to C++• Use QtQuick compiler if available
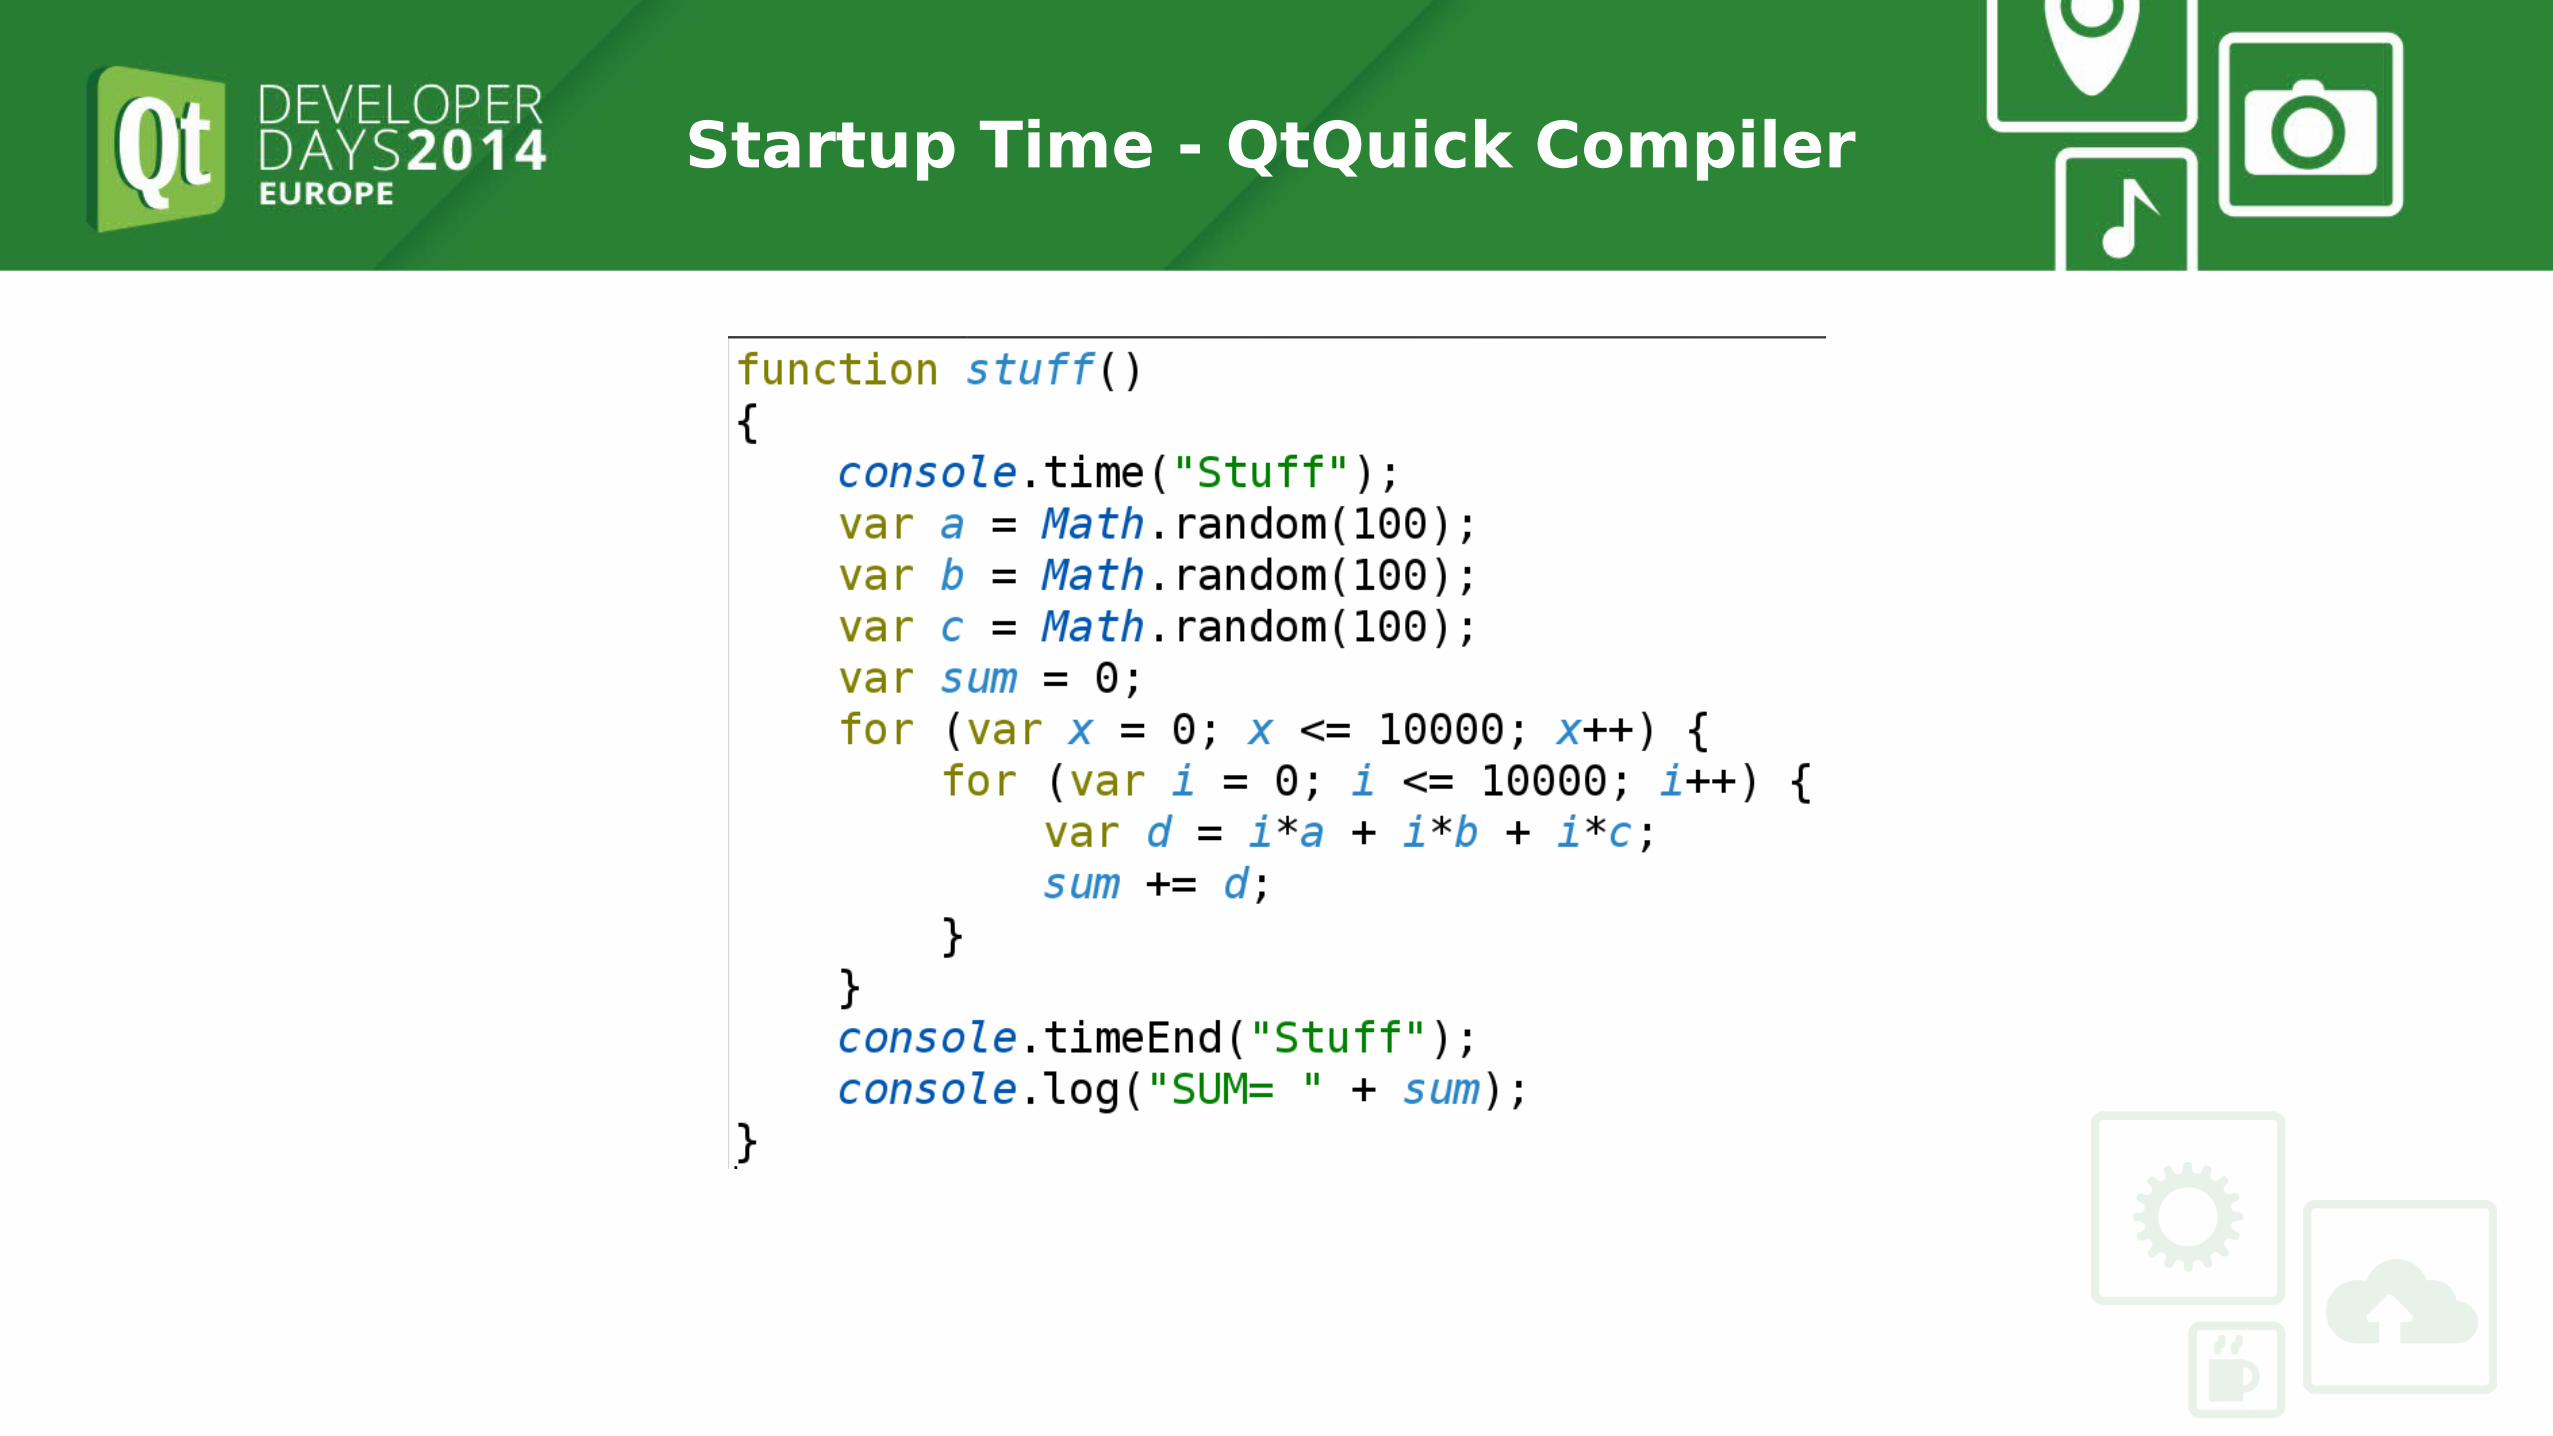
Startup Time - QtQuick Compiler

Startup Time - QtQuick Compiler
• Results
– Without QtQuick Compiler, Release: 1000ms
– With QtQuick Compiler, Release: 500ms, 398 instructions (w/o calls)
– With QtQuick Compiler, Debug: 5000ms, 818 instructions (w/o calls)
– C++ version, Release: 50 ms, 78 instructions (w/o calls)
• Use QtQuick Compiler if available• Improvements in simpler code (bindings) ~15% (*)• Move complex code to C++

Startup - Creating
• Not much one can do• Use fewer elements in QML files• Make sure custom items are constructed quickly
Startup - All phases
Use Loader to load views later

Startup - Summary
• Profile both C++ and QML• Know your tools, understand their output• Move complex JS code to C++• Use Loaders• Use QtQuick Compiler when available

Smooth Rendering /Frames per Second

Rendering - Intro
• Rendering itself is rarely the culprit!
– High CPU/GPU usage from other processes or threads
– ListView scrollling instantiates new delegates
– Timers in C++ or JS, event handling in C++
– Use a CPU profiler and the QML profiler first to verify!
Rendering - Analyzing Frame Time
• See http://qt-project.org/doc/qt-5/qtquick-visualcanvas-scenegraph-renderer.html#performancefor general tips to improve render performance
• Useful visualizations with QSG_VISUALIZE
– batches
– clip
– overdraw
– changes
Rendering - Visualizations
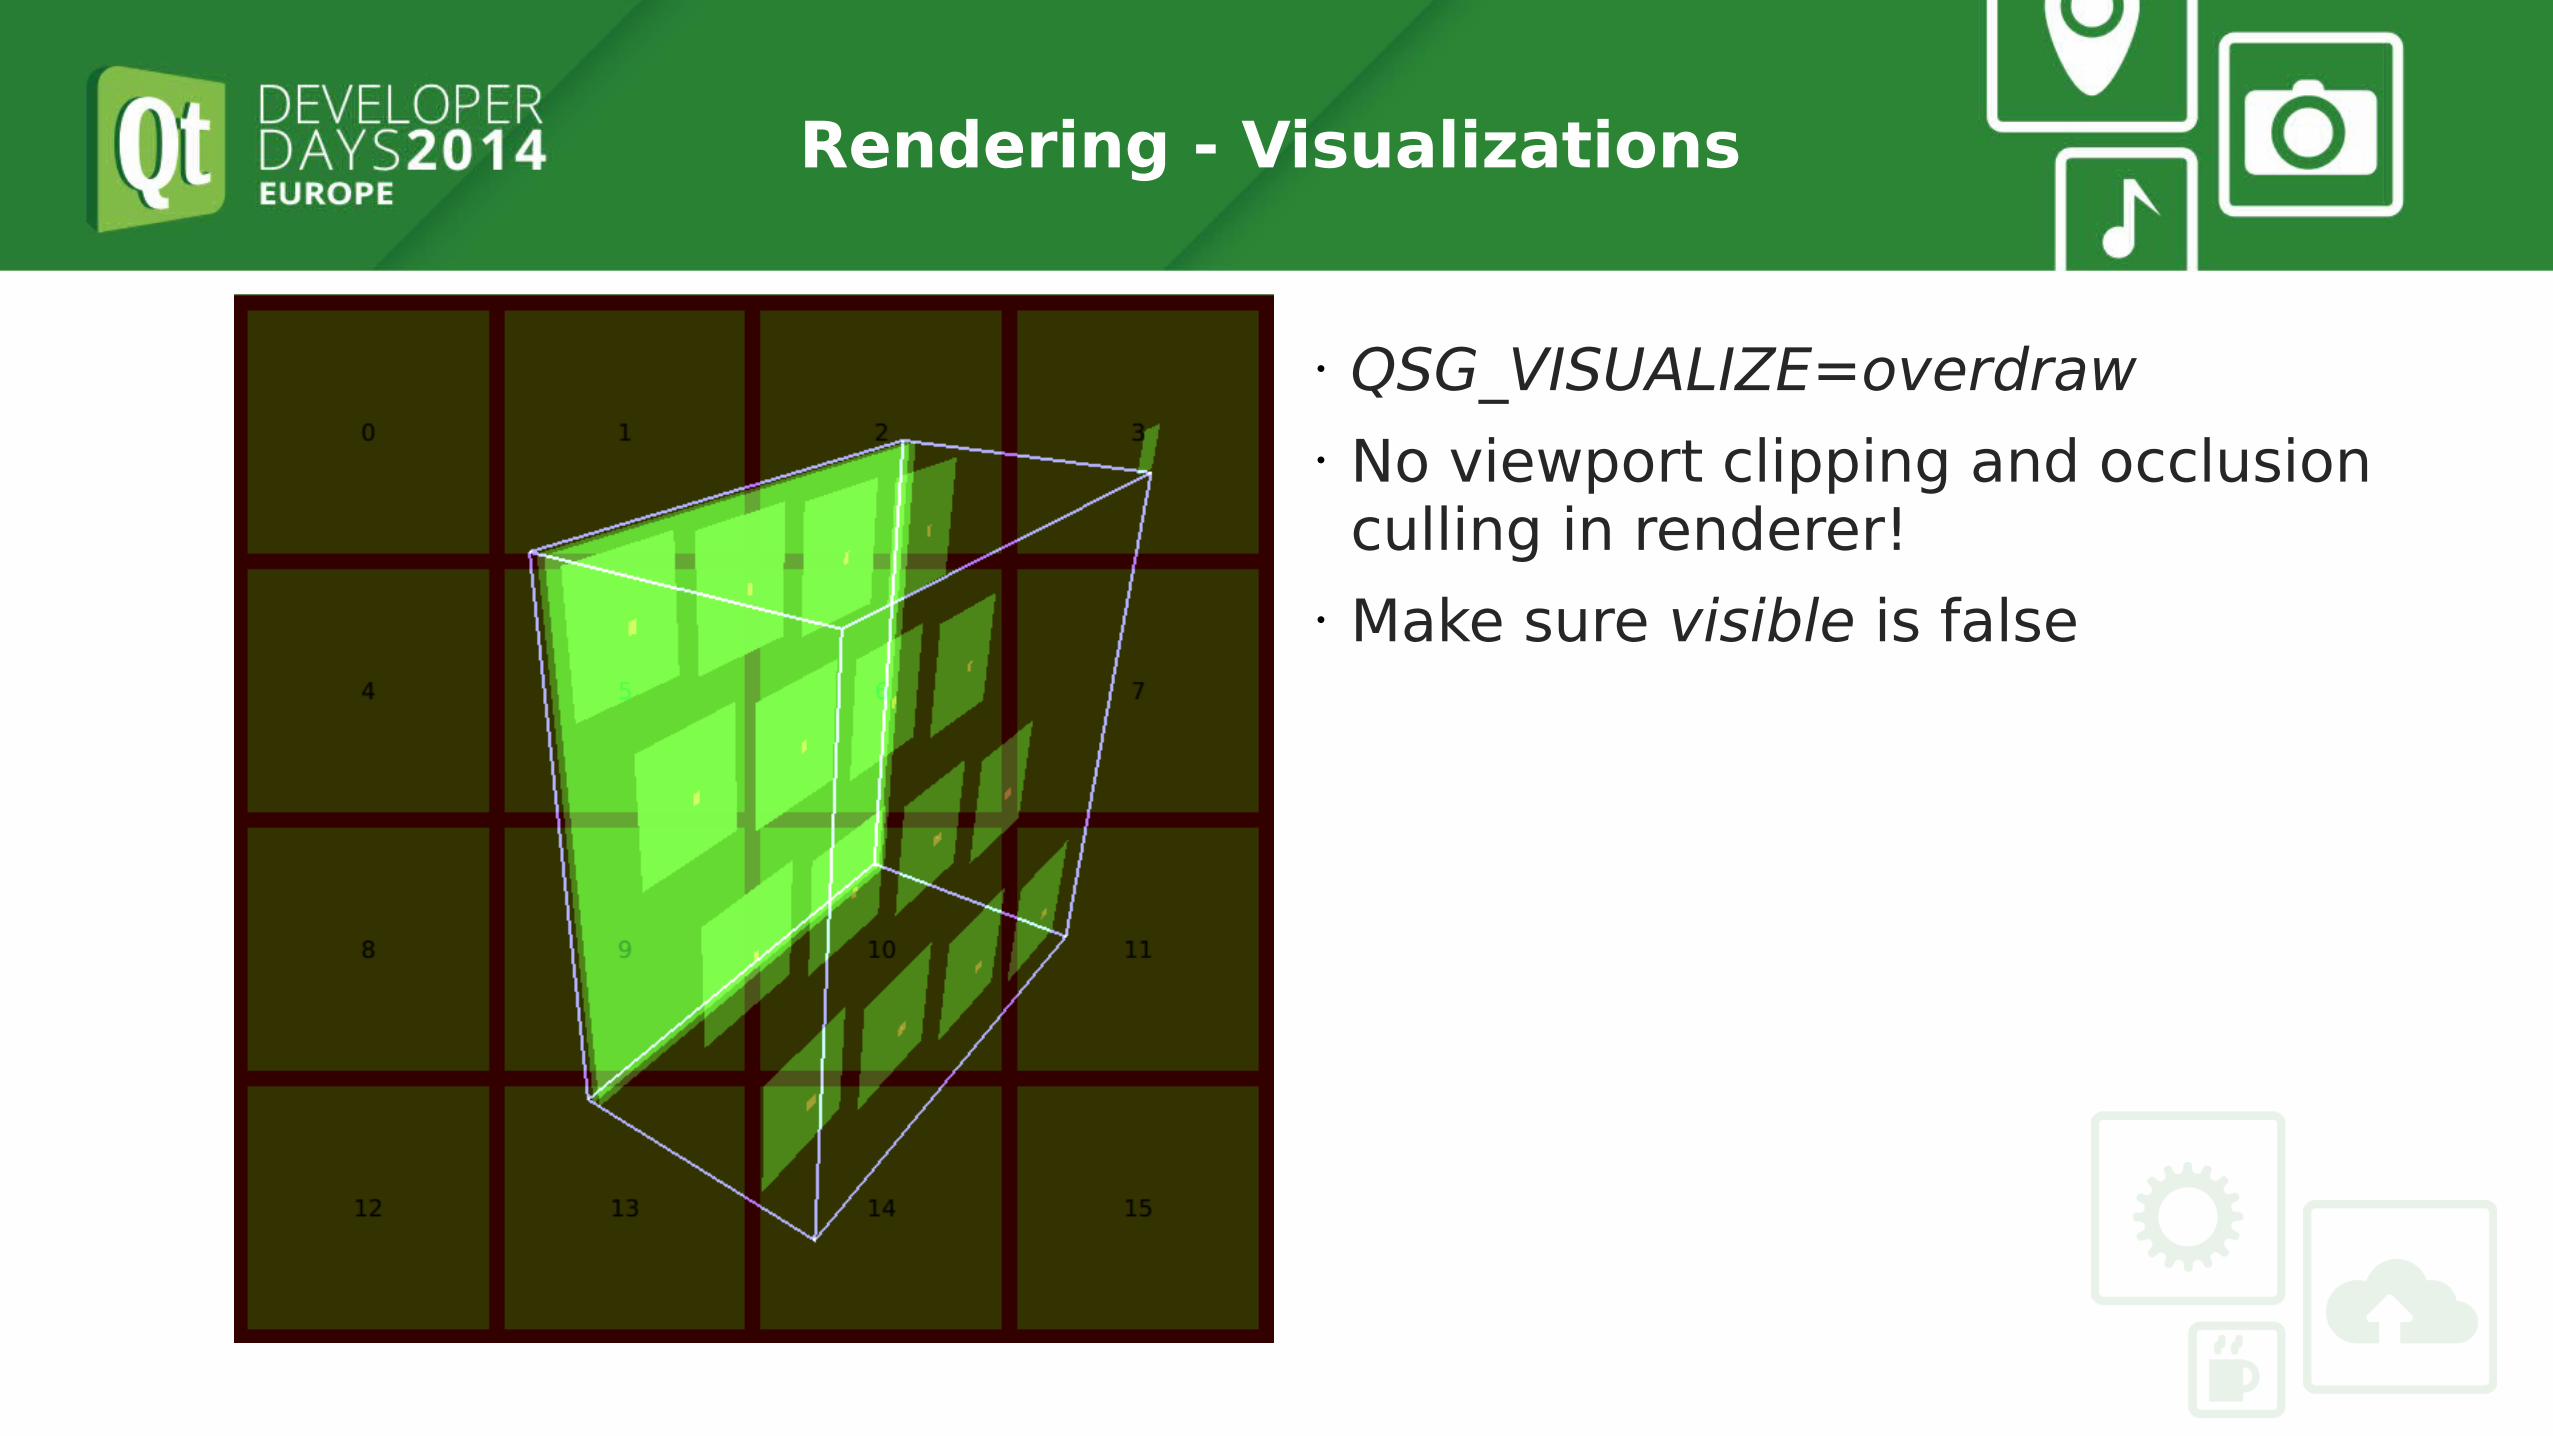
• QSG_VISUALIZE=overdraw• No viewport clipping and occlusion culling in renderer!
• Make sure visible is false
Rendering - Measuring Frame Time
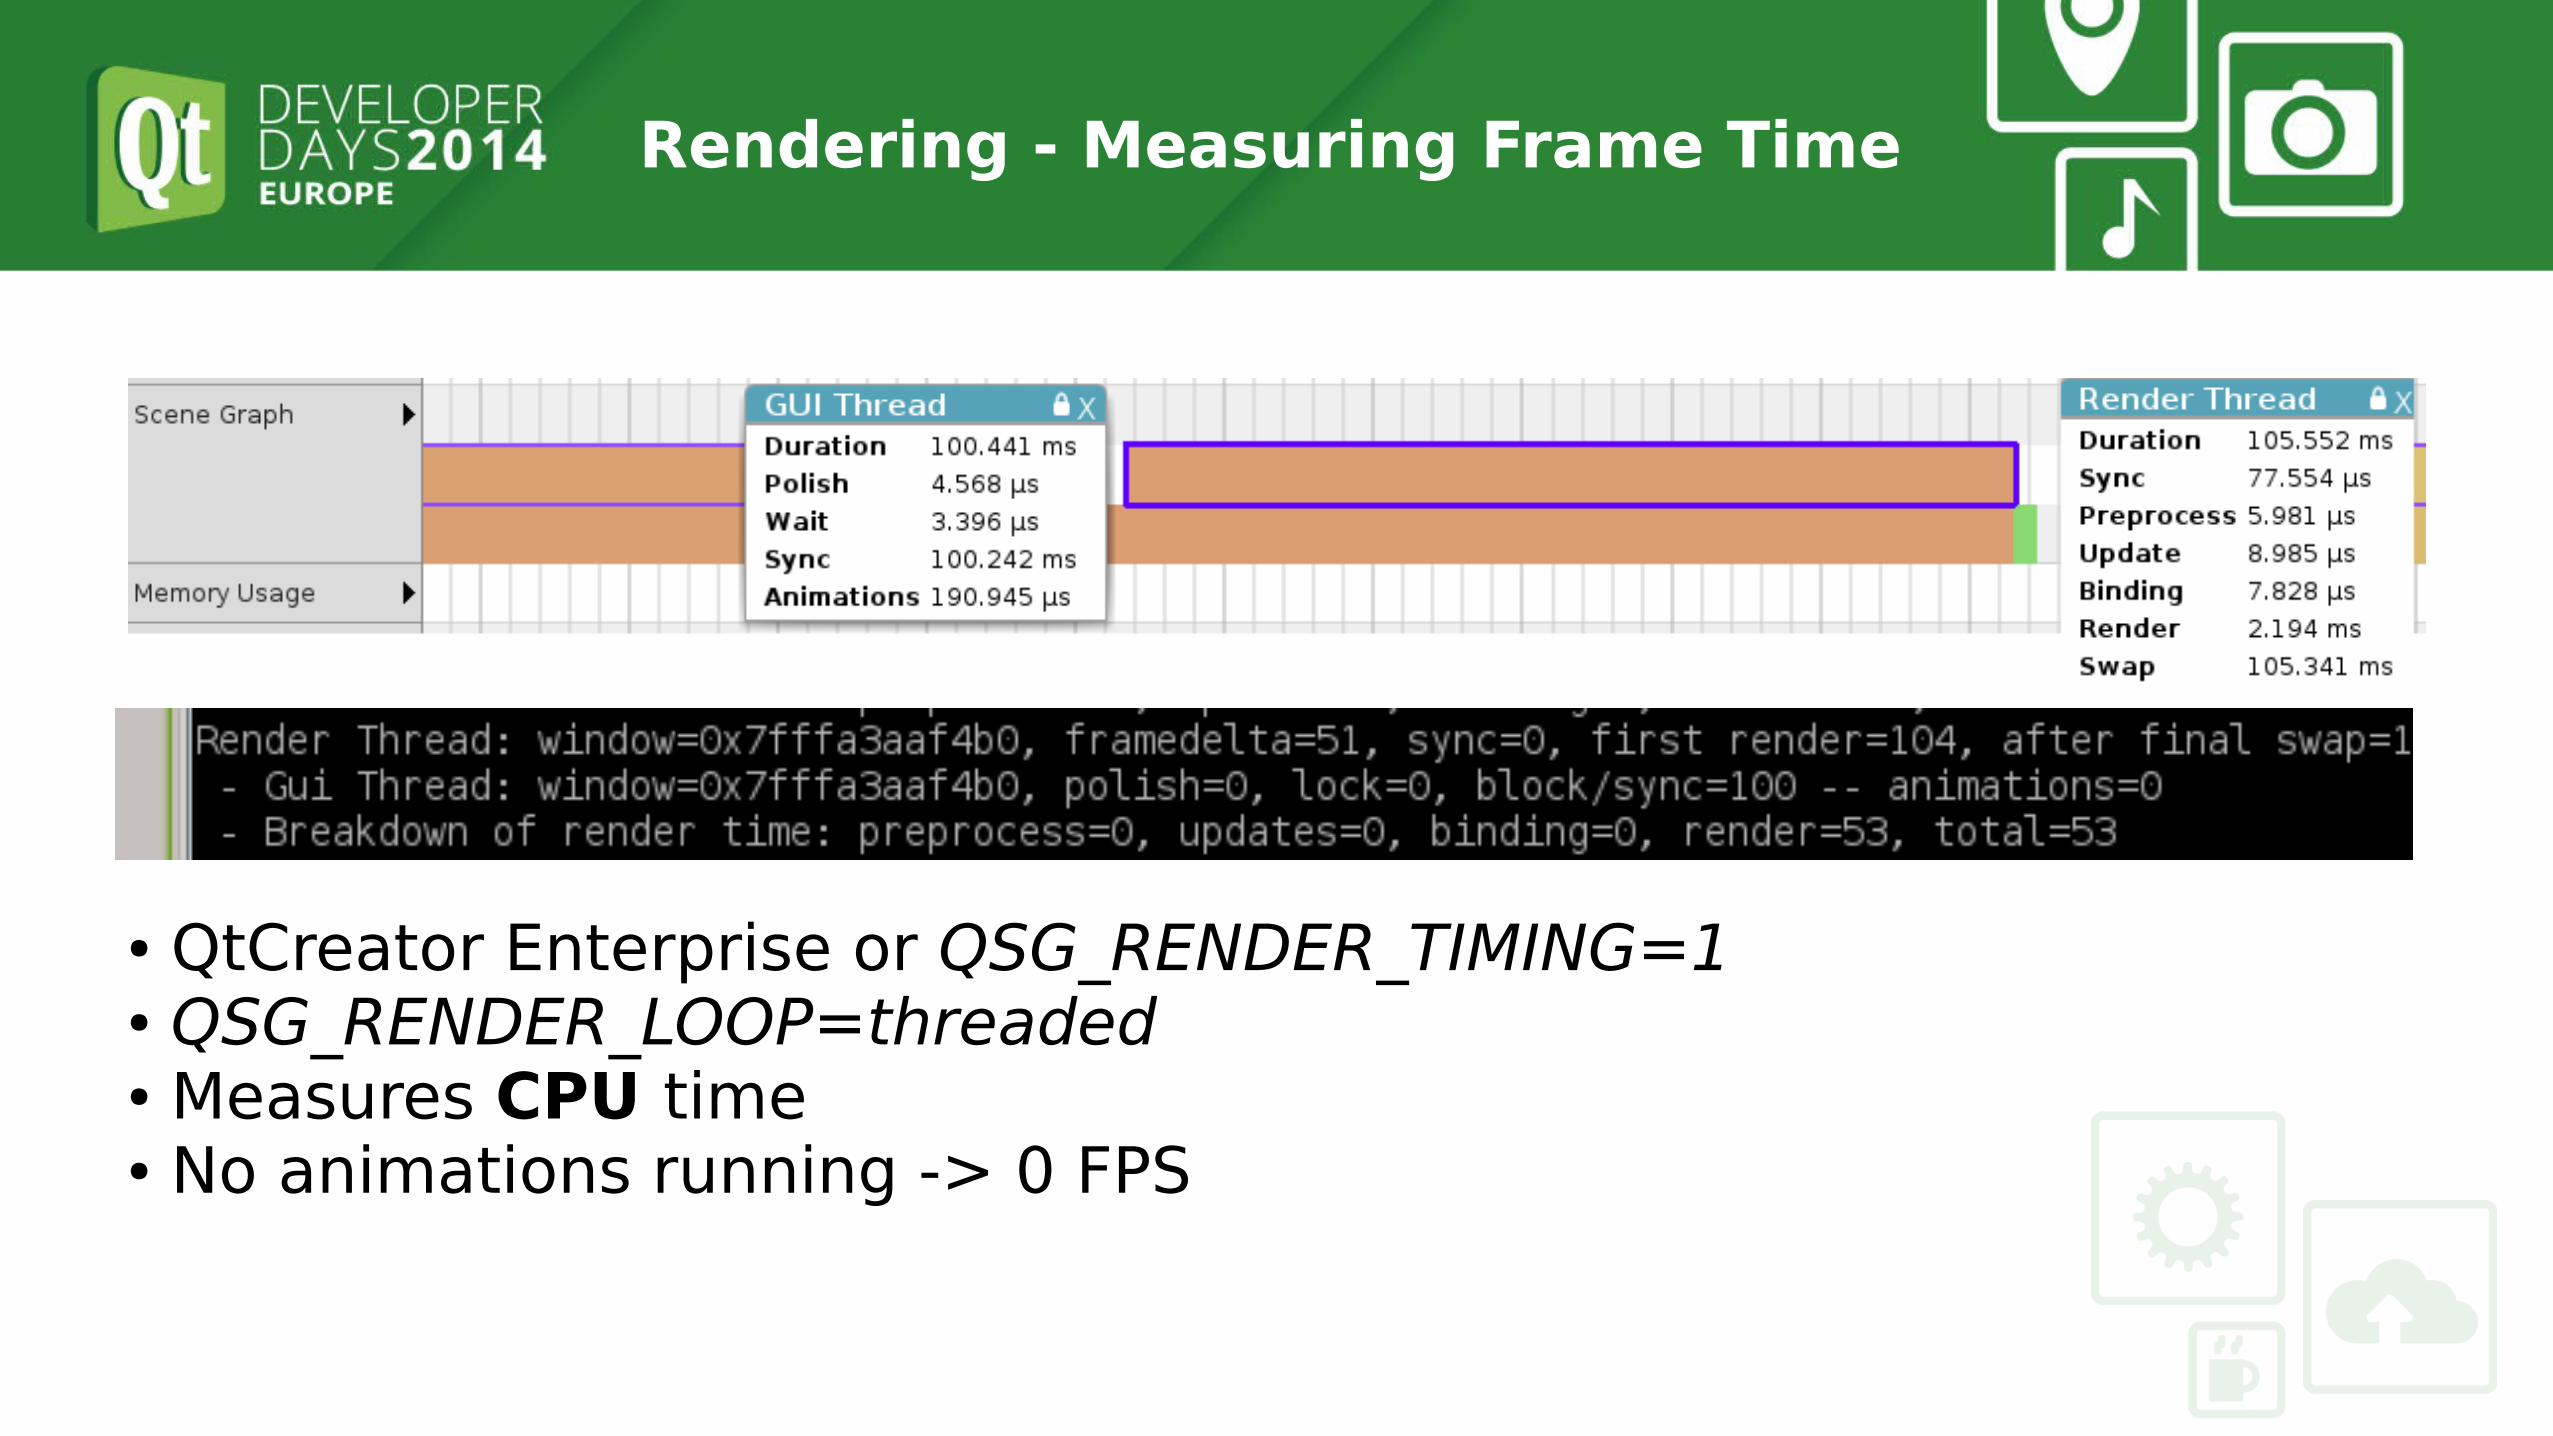
● QtCreator Enterprise or QSG_RENDER_TIMING=1 ● QSG_RENDER_LOOP=threaded● Measures CPU time● No animations running -> 0 FPS

Rendering - Measuring Frame Time
• GUI Thread
– polish: QQuickItem::updatePolish()
● anchor and text layouting, canvas drawing, ...
– animations: Advancing all animations (binding updates!)
– lock: Posting sync request to render thread
– block/sync: Wait for render thread to call QQuickItem::updatePaintNode()
● Main/GUI thread will block while render thread busy!

Rendering - Measuring Frame Time
• Render Thread
– framedelta: 1000 / FPS
– sync: Actual QQuickItem::updatePaintNode() call
– first render: CPU render time
– final swap: Swap time
• Caveat: swap time + render time >= 16ms with 60 Hz vsync• Caveat: Some drivers wait in first GL call of next frame, not in glSwapBuffers()!
Rendering - apitrace

Rendering - apitrace
Rendering - apitrace
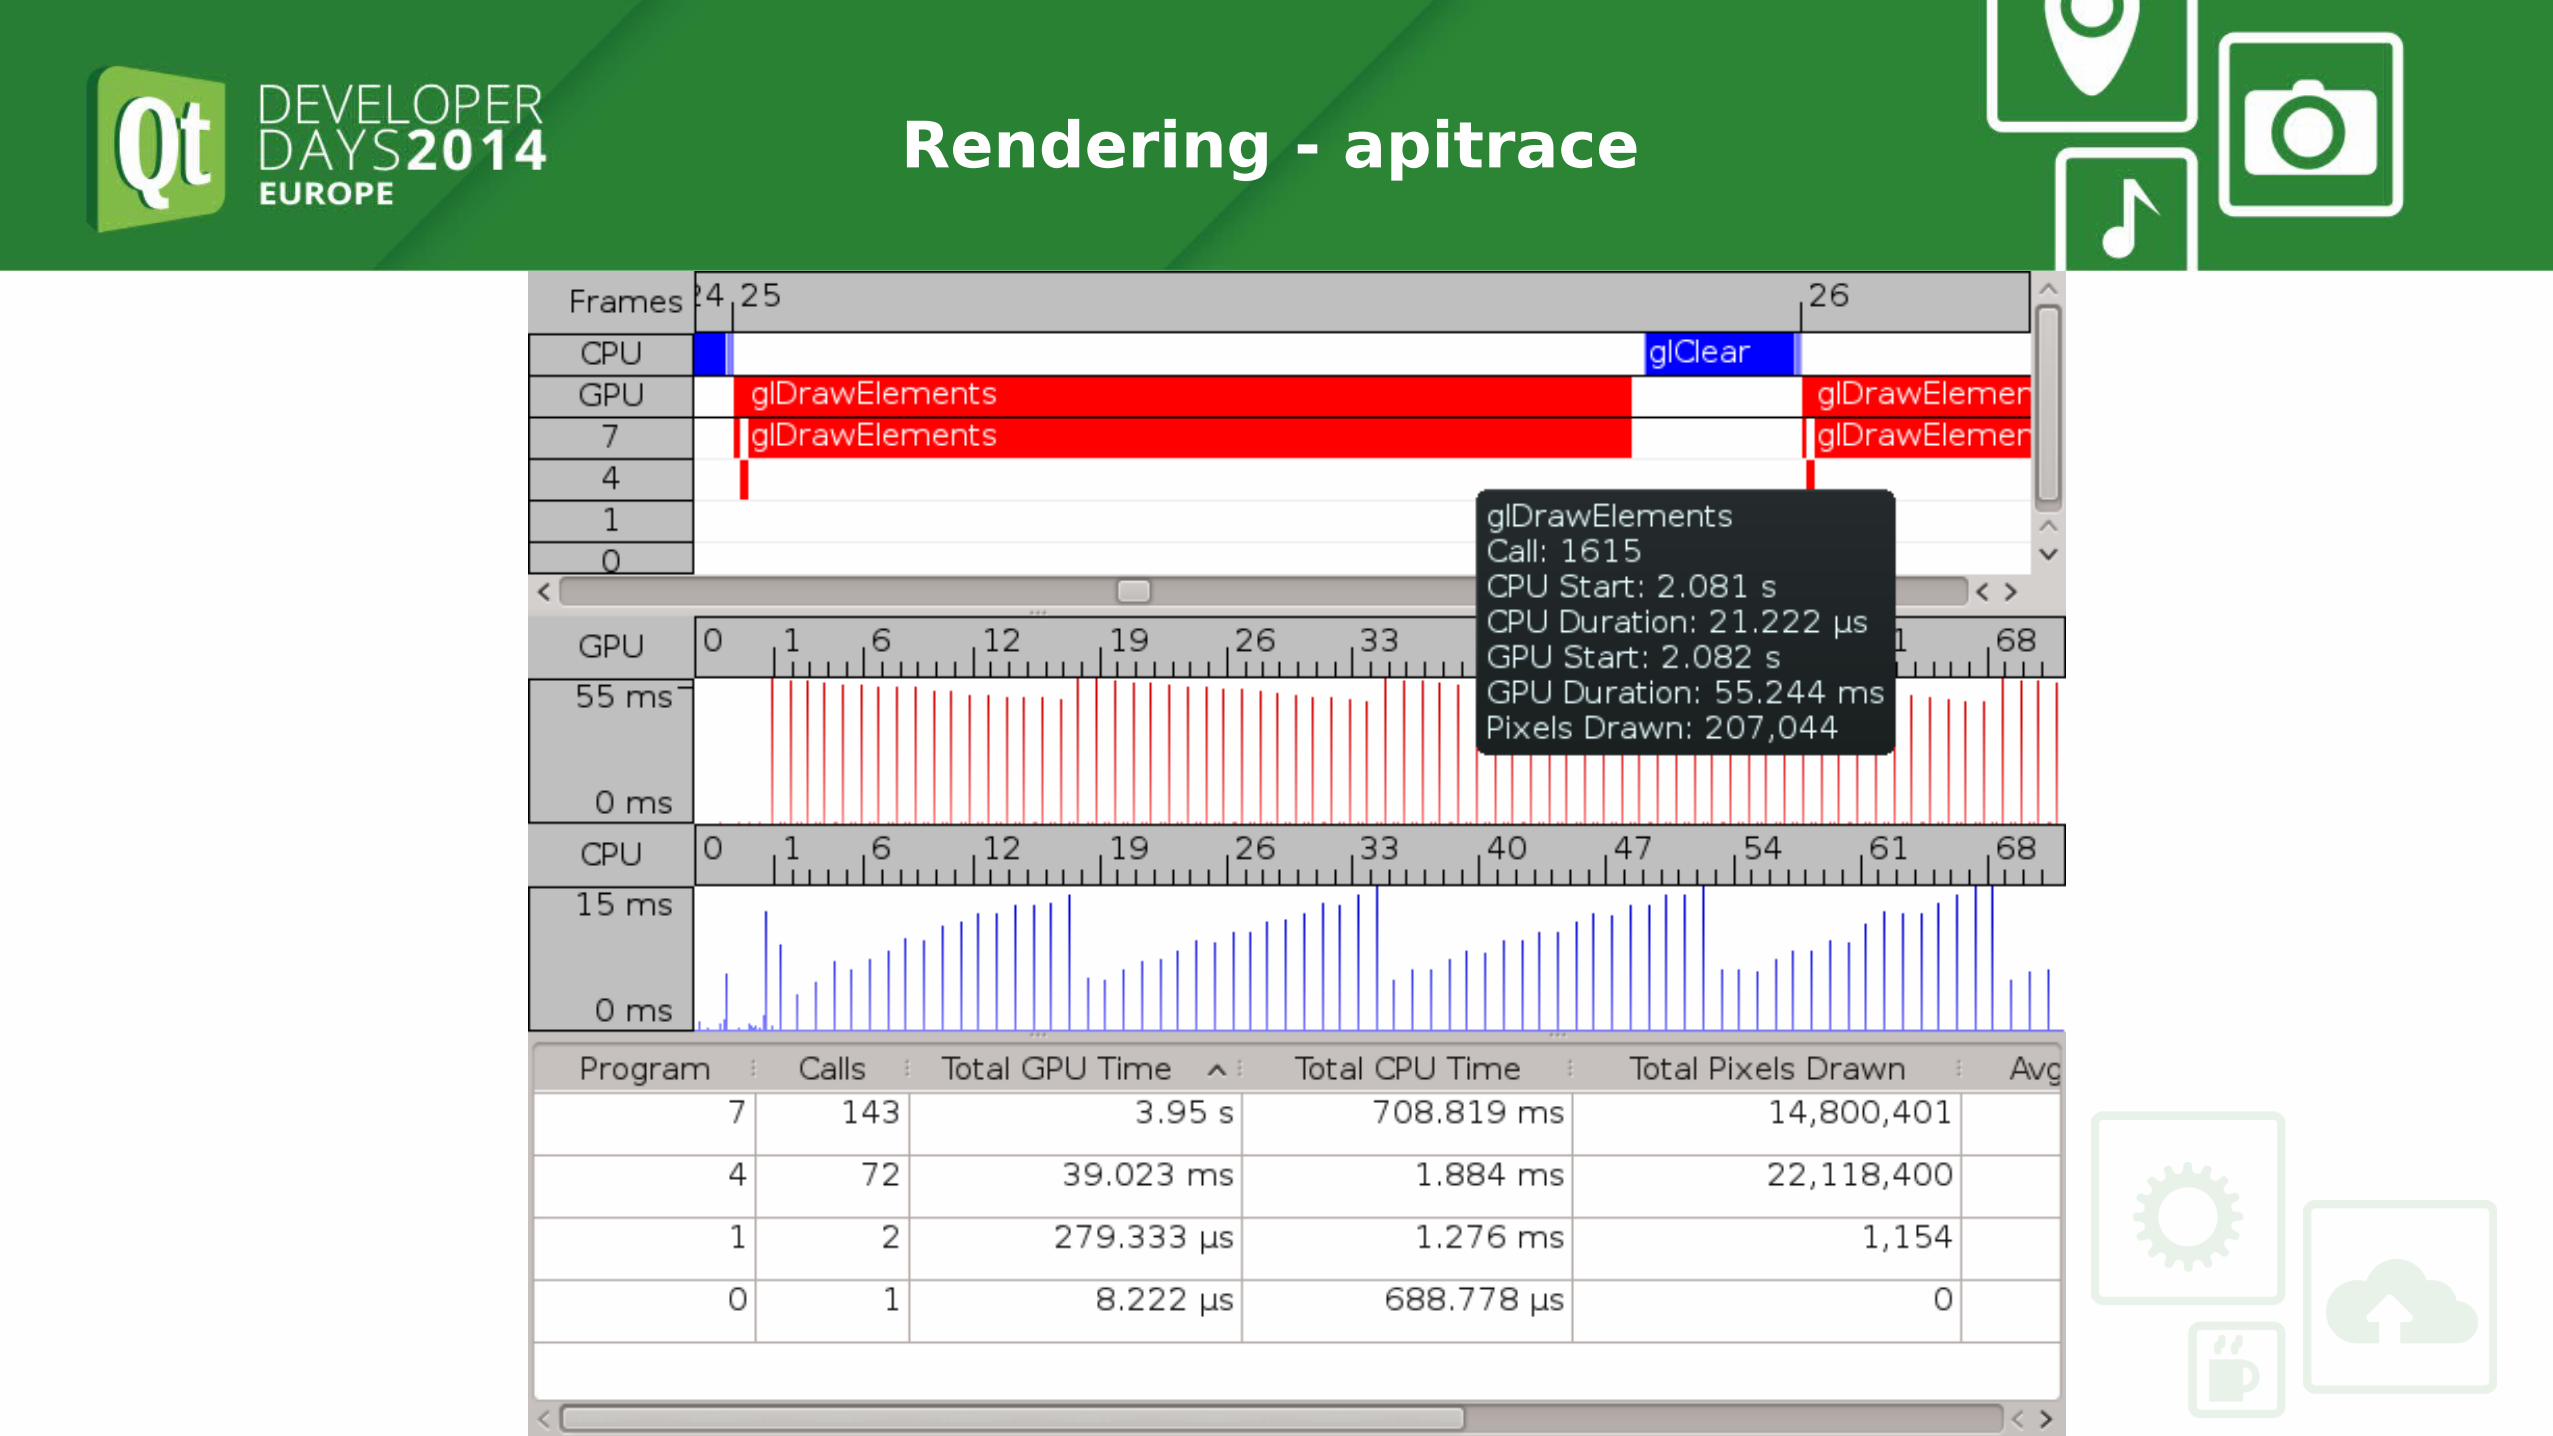
• Traces and times OpenGL calls on CPU and GPU• Shows complete GL state, including buffers and shaders• Useful when integrating custom items into QtQuick• Useful when working on the scenegraph renderer itself• Usage:
– apitrace trace to record
– qapitrace to visualize and play back

Responsiveness
Responsiveness
• Usually starts in QtQuick signal handlers like onClicked or onPressed• Mix of JS code, property/binding updates and calls into C++• Measure only relevant time period• Start with QML Profiler, descent into CPU profiler if needed• May load new view
– Similar analysis as startup time
– Loader: startup time vs reaction time

Boot Duration
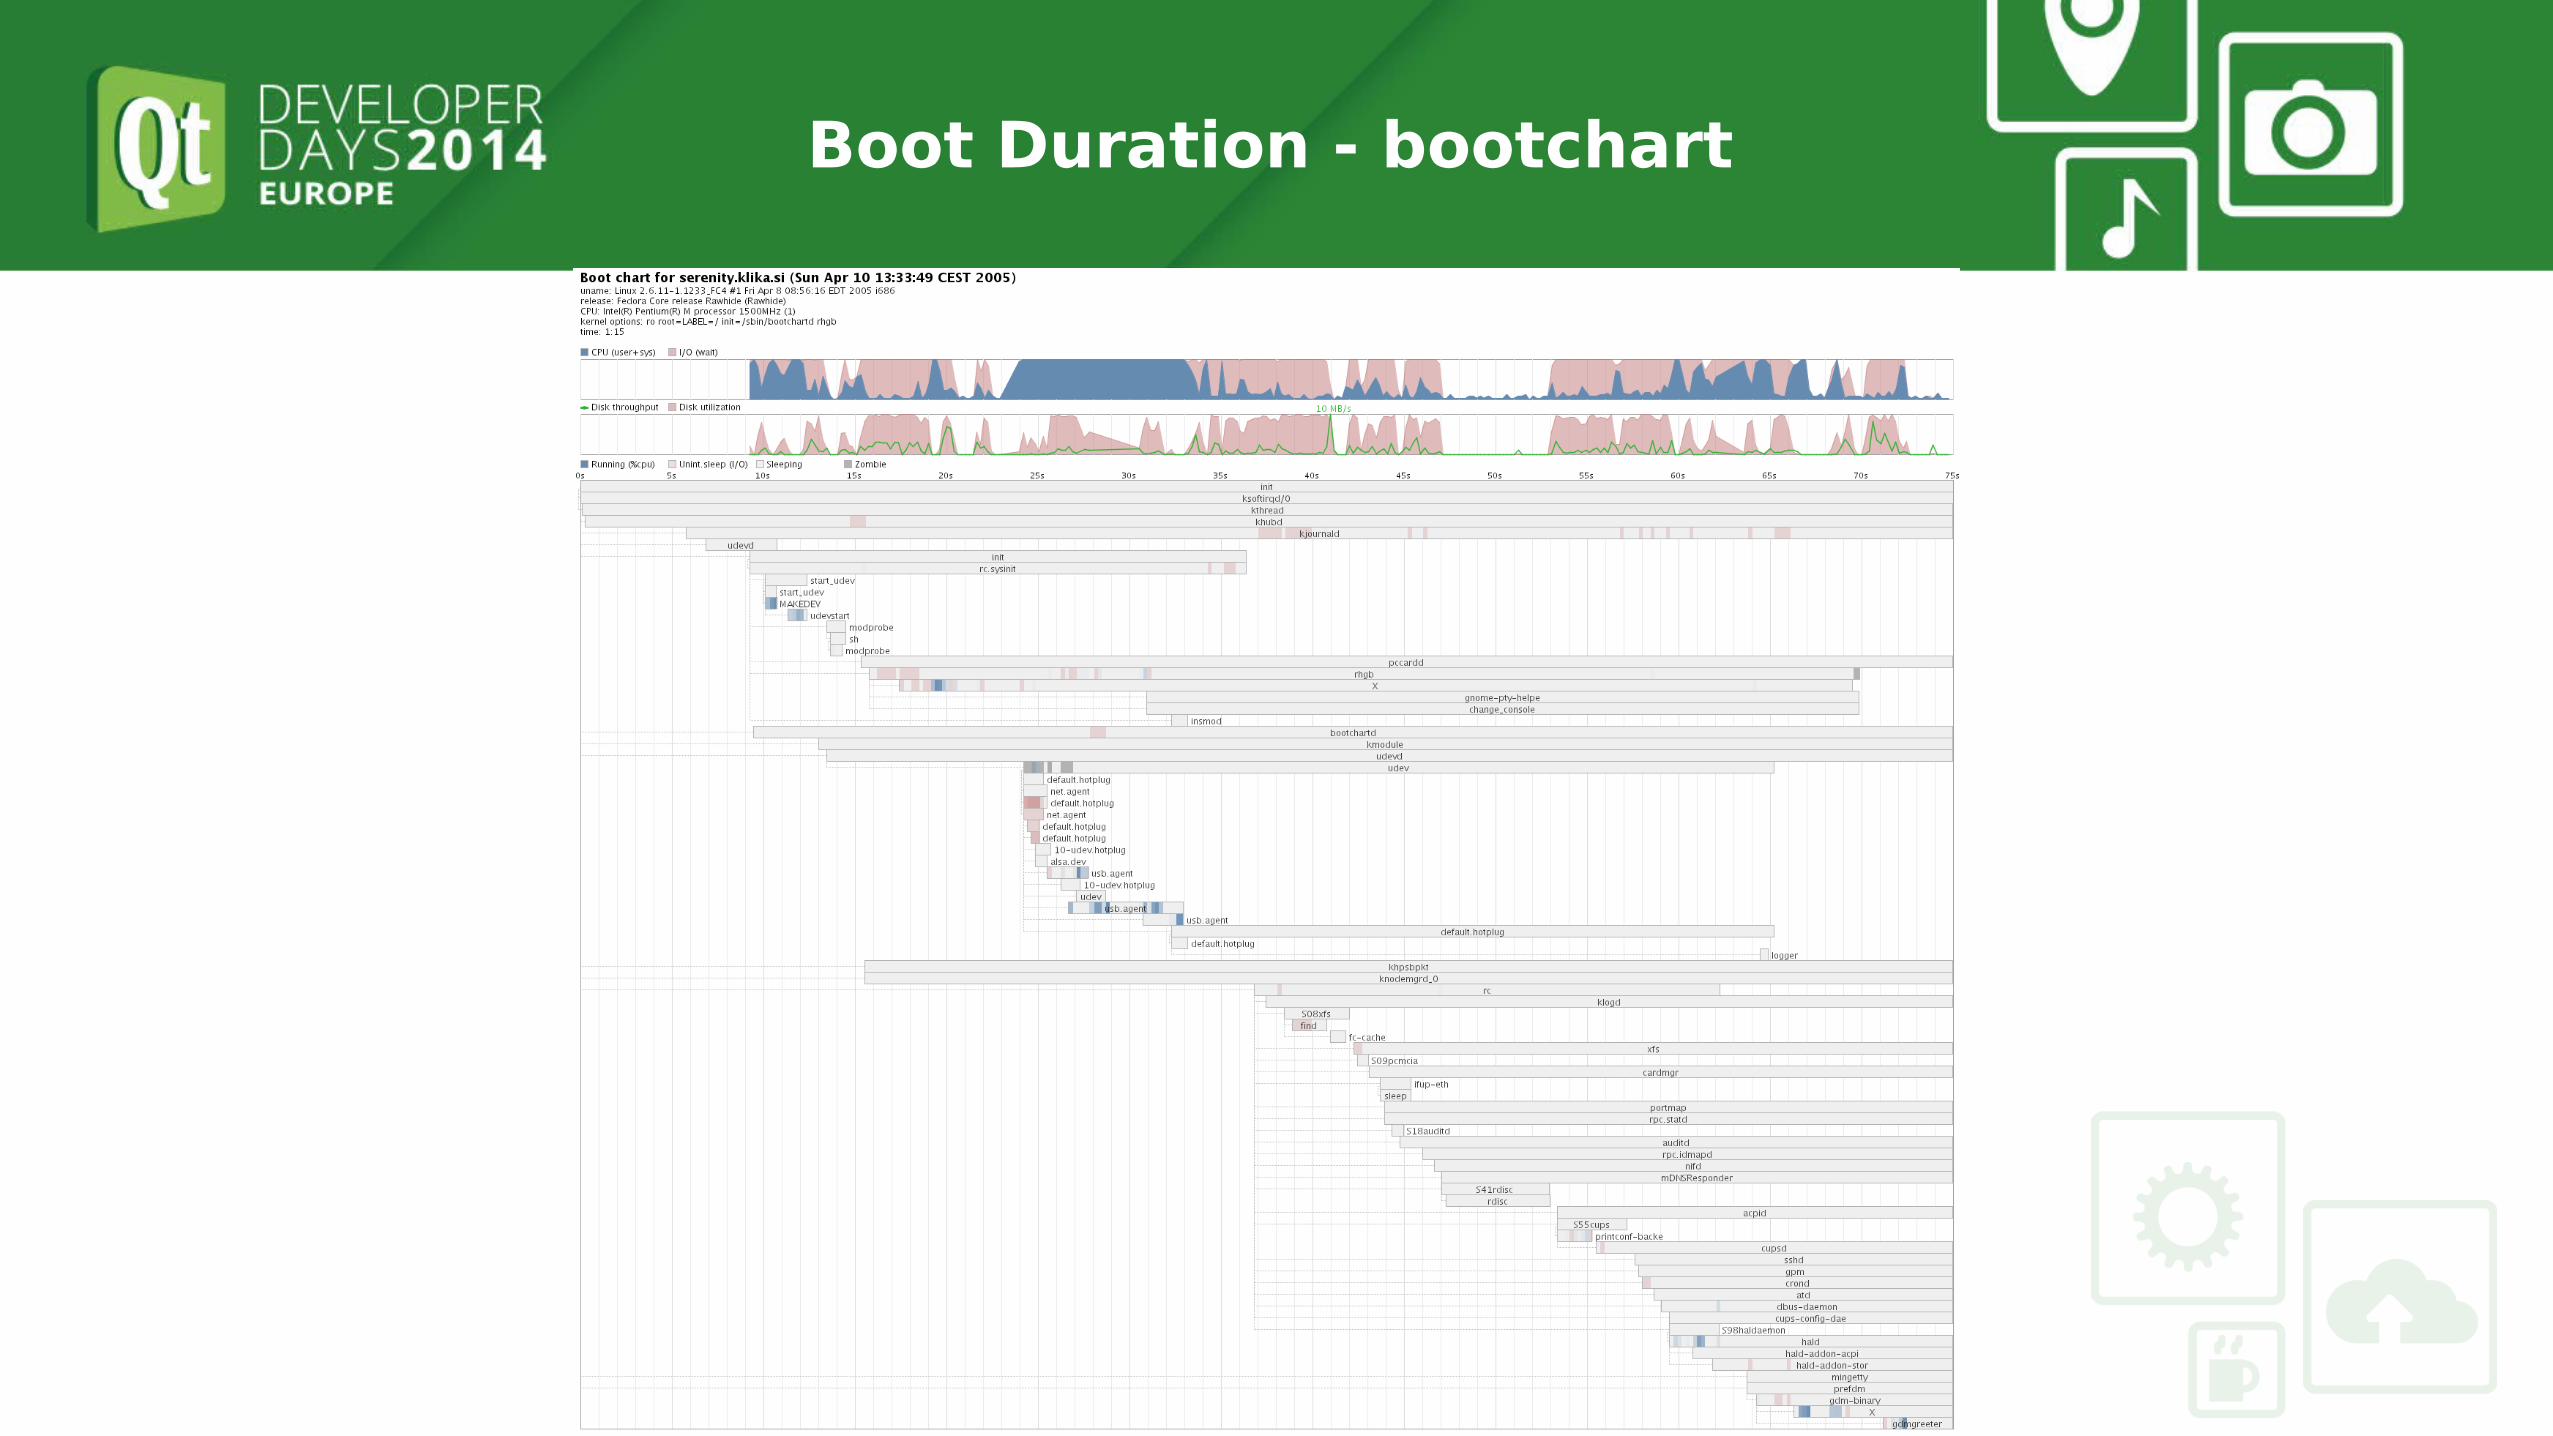
Boot Duration - bootchart

Power Usage

Power Usage - powertop

Power Usage - Others
• powertop to check for process wakeups and HW power usage• QML profiler to check for unnecessary animations• Gammaray timer top to check for unnecessary timers

Memory Usage

Memory Usage - massif
Memory Usage - Others
• massif to track C++ heap allocations• QML Profiler (enterprise) to track JS memory usage• QML engine: ?
