analyzing and interpreting performance...
TRANSCRIPT

Analyzing and Interpreting Performance Metrics
How to earn CPE credit:
• Scan in and out of the session, attend for the full 50 minutes
• Be logged in to the app and take the CPE survey» Click into the Schedule icon
» Click into the session you’re attending
» Scroll down to the CPE survey and complete
• Don’t have the app? Paper surveys are available as well.

Analyzing and Interpreting Performance Metrics
Ryan GilkeyClient Services Team Lead, Investment Management
Learning Objectives
• Learn best practices for analyzing the performance of asset managers and internal portfolios
• Utilize the most effective tools to analyze performance metrics
• Understand how performance measurement can help evaluate the effectiveness of investment strategies

Our ChallengeComparing Portfolio Managers
• Historically subjective» Returns: on cost/market
» Cash Flows: control or not?
» Risk appetite consideration
• “This is an art, not a science”» There are many approaches and concepts
to performance measurement

Framework for Performance Comparisons
• Appropriate» What is the compared goal?
» How are we going to measure?
• Transparent» Easily reverse engineered and/or
conceptually understood
• Objective» Impartial and standardized
Objective
Transparent
Appropriate
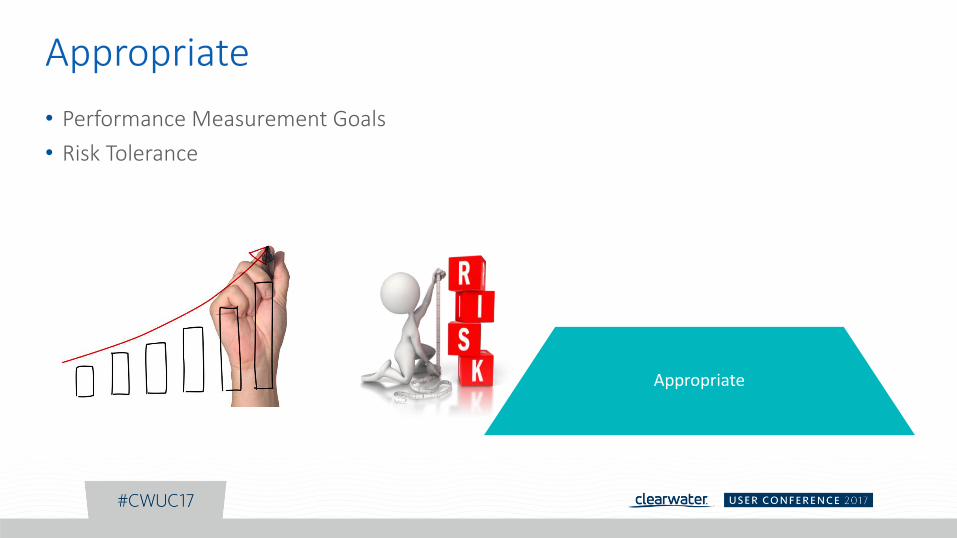
Appropriate
• Performance Measurement Goals
• Risk Tolerance
Appropriate

110,000 − 100,000
100,000= .10 = 10%
Transparent
• Understood by all parties» What are we measuring? Why?
• Simple to reverse engineer» How are we measuring?
MTD Return = 10%Transparent
Appropriate
𝐸𝑀𝑉 − 𝐵𝑀𝑉
𝐵𝑀𝑉

Objective
• Standardized methods
• Consistent application
• Evaluation based upon the appropriate goals, not preference
Objective
Transparent
Appropriate
Investment Performance Comparison
• Time-weighted vs. Money-weighted (IRR)
• Benchmark Comparison
• Attribution Analysis» Equity
» Fixed Income
• Risk-adjusted Returns
• Portfolio Measurement Presentation

Time-Weighted vs. Money-Weighted (IRR)
• TWR = periodic returns linked over time geometrically» Goal: measure portfolio performance without consideration of cash movements
• MWR = discount rate equating the present value of all cash flows to zero» Goal: measure the actual dollar amount earned in the portfolio

Time-Weighted vs. Money-Weighted (IRR)
Cash Flow Beginning MV Ending MV Period Return TWR MWRCash Flow Beginning MV Ending MV
$5,000 $5,000 $4,750
$10,000 $14,750 $12,508
$15,000 $27,508 $28,360
$20,000 $48,360 $63,231
$25,000 $88,231 $103,804
Period Return
-5.00%
-15.20%
3.10%
30.75%
17.65%
TWR
27.76%
MWR
94.64%

Time-Weighted vs. Money-Weighted (IRR)
Cash Flow Beginning MV Ending MV Period Return TWR MWRCash Flow Beginning MV Ending MV
$25,000 $25,000 $23,750
$20,000 $43,750 $37,100
$15,000 $52,100 $53,715
$10,000 $63,715 $83,307
$5,000 $88,307 $103,893
Period Return
-5.00%
-15.20%
3.10%
30.75%
17.65%
TWR
27.76%
MWR
54.73%

Benchmark Comparison
• How is my portfolio performing relative to investment goals?» Benchmarks provide perspective
• Rates of return alone offer little context

Benchmark Comparison
• Benchmark Types» Market Indices
» Peer Groups
» Absolute
» Custom
Benchmark Comparison – Evaluation Criteria
• Appropriate» Benchmark is consistent with manager’s style or expertise
• Specified in advance» No moving targets
• Measurable» Benchmark return readily calculable
• Investable» Possible to hold the benchmark directly
• Unambiguous» Security identities and weights clearly defined
Attribution Analysis
• Decompose excess return to explain the impact of portfolio management decisions» What is causing my excess returns?
• Focus on primary risk factors within portfolio mandate
• Highlight value and tell the story of portfolio returns

Risk-Adjusted Returns
• What’s my risk tolerance?
• How do we define risk?» Exposure? Volatility? High turnover?
• What risk was taken to produce portfolio returns?
• What measurements are most appropriate?

Risk-Adjusted Returns
• Portfolio» Exposure & Allocation
» Standard Deviation
» Value at Risk
• Relative Risk» Beta
» Sharpe Ratio
» Information Ratio
Investment Performance Presentation
• Maintain historical context
• Standardized
• Removal of guesswork
Closing Thought: Historical Performance Indication“Past performance may not be an indication of future results.”
• Measure the right things
• Establish correct priorities
• Adhere to mandates

Reminders
• Take the post-session survey in the Clearwater Events app
• Take the Clearwater Client Benchmark Survey in room 440 and earn Clearwater swag.
• Don’t miss the Monday networking reception from 4:30 to 6:30 p.m.
• Session presentations are available in the app