analyzing kriging and cokriging methods by using … reza jafarinia.pdf · issn no. (print):...
TRANSCRIPT

ISSN No. (Print): 0975-1130ISSN No. (Online): 2249-3239
Analyzing Kriging and CoKriging Methods by using ArcGIS Softwarein Preparing SP map of Farahan Plain Soil
Kazem Mobarak Abadi*, Reza Jafarinia** and Javad Varvani****Department of Civil Engineering, Islamic Azad University, Arak Branch, Arak, IRAN.
**Department of Agriculture and Natural Resources, Islamic Azad University, Arak Bramch, Arak, IRAN.**Department of Civil Engineering, Islamic Azad University, Ramhormoz Branch, Ramhormoz, IRAN.
(Corresponding author: Reza Jafarinia)(Received 07 January, 2015, Accepted 15 February, 2015)
(Published by Research Trend, Website: www.researchtrend.net)
ABSTRACT: Soil and water conservation is one of the most fundamental bases of sustainable development.Knowing the distribution manner of soil physical and chemical properties is one of the most importantfactors in recognition, management and exploitation of water and soil resources. Estimating the soil moisturecurve plays an important role in modeling water and solutes movement through soils. Soil saturated moistureis among the most significant parameters in soil studies that is used for estimating the soil moisture curve andsoil unsaturated hydraulic conductivity. This investigation was done with the purpose of investigating spatialvariation of soil sp parameter by geostatistical methods and then selecting the most suitable method inestimating the above-mentioned parameter in Farahan area. For this purpose, at first, 54 soil samples weretaken from the given area. Then, the soil samples were transferred to the lab for determining the soilsaturated moisture (sp). After determining the sp values, data were inserted to GIS software. Afterward, theinterpolation map of soil saturated moisture was prepared by interpolation and ordinary kriging. The resultsobtained from interpolation method showed that among the various models, Spherical model with nearestRSS value to number 1 was chosen as the best map. According to the map prepared by this method, thespatial variation of soil saturated moisture in the direction of westnorth-eastsouth of the area was more.While in the direction of eastnorth-southwest there were gradual changes.
Keywords: Soil saturation moisture, GIS, Interpolation, Kriging, Farahan.
INTRODUCTION
Investigating the structures by considering interactioneffects of soil and structures can help us in correctunderstanding of structure`s behavior. However, theissues associated with soil and structure interaction areusually handled by considering the foundation which isfixed to soil.The force which caused water to be absorbed by the soilis called soil moisture suction force and the more waterin the soil, the less suction force. If a soil is saturatedwith water, this force will reach to zero, and byincreasing the dryness of soil, this force will increase.Under the same suction force, clayey soil can holdmuch more water than sandy soils. Also, under thesame moisture percentage, sandy soil can hold water bymuch less suction force than clayey soil. Engineeringproperties of soil depends on complicated and mutualeffect of several factors. These factors can be classified
into two groups as composition and environment. Thefirst group shows the potential soil properties like thetype and amount of minerals, the kind of adsorbedcations, the shape and size of soil particles. The secondgroup includes real and actual soil properties like soilwater, density, structure and temperature. Forecastingsoil behavior in different conditions according to theenvironmental and soil factors is difficult. However, themail factors which affect soil behavior are clay activity(the ratio of plasticity index to the amount of clay), pH,exchange cations, leaching, and diffusion factors.The significance of forecasting soil behavior inestablishing soil structures in places like Waterspreading stations in which soil embankment, torkinstsfor obtaining and distributing water are used inconditions that used soils are diverged or sensitive todivergence, the stability of these structures will bequestionable.
Biological Forum – An International Journal 7(1): 836-846(2015)

Abadi, Jafarinia and Varvani 837
Among the chemical properties of diverged soils andtheir sensitivity to demolition and slackening, we canmention the amount of sodium, calcium andmagnesium, lime, gypsum, exchange cations, textureand the kind of clay minerals. One of the most obviouscases of cation effects is sodium and/or its saltcompounds like sodium carbonate which cause pasty,diffusion and divergence of soil, and in the oppositeside there is neutralizing factors of sodium like calciumand magnesium that have the role of balancer andconverging in soil.Irrational use of land by human is applicable in twoaspects of management and exploitation manner.Therefore, in order to use soil and water in an optimumway and making the least environmental consequences,evaluating the environmental power can be used as asolution (Zarei and Mirsepas 2007). Soil is one of thevaluable capitals the plays a principle role inagricultural production, natural resources andenvironment. Soil is a suitable place for growth anddevelopment of plants and creating vegetation, and ifthis valuable capital is not protected, the shortage offood, soil erosion and destruction of natural resourceswill happen (Nosratpour et al., 2010).The first experiences for using statistical methods basedon geostatistics in soil science was started by analyzingpH and sand in soil by using a variugram function byCampbell (1978) (Mohammadi1998). In the previoustwo decades, several studies were conducted aboutspatial investigation of soil salinity and its interpolationby using geostatistical methods (Kaydani and Delbari2012). Accordingly, in this part a summary ofinvestigation results about preparing soil salinity map isprovided.The theory of geostatistics in Iran, in the fist time wasused by Hajrasuliha et al. (1980) for analyzing spatialvariations of soil salinity in which a comparison wasdone between classic statistical methods andgeostatistics for salinity studies in sugarcane fields ofHaft tappe, Khoozestan province, Iran. According to theresults, spatial dependency of soil salinity data thatnaturally occurs in some fields, provides a betterestimation of salinity by using geostatistical methods.Darvishsefat and Damavandi (2000) investigated thepossibility of using satellite data in recognition andclassification of saline land by numerical method in asmall part ofHoz-Soltanlake in Ghom province, Iran.The results showed that if in time data is available, thenthis data can be used for classification of saline land tovarious categories.Abdi and Abdi (2001) investigated the variation trendand development of saline land in Ghazvin plain in Iranby using RS-GIS. The results showed that fertile plains
such as Ghazvin plain are exposed to the risk of beingsaline.Pishkar (2004) prepared a soil salinity map by usinggeostatistical method. In this method, after samplingand by using geostatistical method, interpolation andpreparing the map of soil pH and EC were done. Thismethod was performed by fitting a mathematical modelto the model obtained from variance variation relationas a function of points distance from each other(variography) and then by performing the krigingpractice (that is actually a kind of interpolation) thesalinity map was prepared.Pashazadeh and Zeynali (2011) prepared the map ofsoil pH and salinity by using GIS and geostatistics inthe east of Khoy in Azarbayjan-gharbi province, Iran.The results of this investigation showed that the leastmean absolute error (MAE) for pH is related todiscontinuous kriging with exponential model and forEC is related to simple kriging with spherical model.Shahriyari et al. (2013) investigated the spatialvariations of soil salinity in different depths by usinggeostatistical methods in Gharve in Kordestan province,Iran. For estimating salinity, kriging methods, IDW andGIS and GS+ were used. Results showed that in thedepth of 0-30 cm and 60-90 cm, the best model forvariogram analysis is gossy model, and in the depth of30-60, the best model is spherical model, and in thedepths 0-30 and 60-90 cm, the IDW method has moreaccuracy in comparison to kriging method, and in thedepth of 30-60 cm, the kriging method has moreaccuracy than IDW method in estimating points withknown coordinate and preparing soil salinity map of thegiven study area.Hosseini et al. (1993) used the methods of the nearestneighbor, kriging, mobile mean, reverse distance andTPSS for preparing maps of iso-salinity. The resultsshowed that the accuracy of all the models is lowbecause of high ratio of piece effect to threshold.Nevertheless, TPSS and common kriging methods arethe most accurate methods, while the nearest neighbormethod has the lowest accuracy.Tarr et al. (2005) prepared a salinity map by cokrigingmethod. They examined various helping variablesincluding clay, soluble calcium, soluble magnesium,Argilic horizon depth and bed rock depth, and finally,introduced the amount of clay as the appropriatehelping variable for forecasting salinity in Cokrigingmethod.Eldeiry and Garcia (2009) compared the capability ofcokriging and regression kriging methods in preparingsoil salinity map. The results showed that the method ofregression kriginghas higher efficiency than cokrigingmethod, and the former method could anticipate smalllocal variations in soil salinity properly.

Abadi, Jafarinia and Varvani 838
Khaksaran et al. (2013) investigated the temporal andspatial variations in soil salinity in Orumiye, Iran byusing geostatistical methods including kriging,cokriging and weighted mobile mean. The resultsshowed that the method of kriging and semi-variogramgossy with correlation coefficient of 1 for1967, and 0.97 for 2007 were the best anticipatingmodels.Akramkhanov et al. (2014) investigated the soil salinityby geostatistical monitoring by using electromagneticinduction and linear regression model in a region ofUzbikistan. Results showed that in 2008 to 2010 most
parts of this region was not saline, and there is a lowprobability that critical threshold of salinity exceeds8dSm-1.
MATERIALS AND METHODS
A. The study areaFarahan plain has the surface area of 35297.87 hectareand geographical coordinate of 49° 35` 9`` to 49° 47`27`` east and 33° 08` 24`` to 34° 24` 19`` north thatoccupies a relatively large part of the Mighan basin.Fig.1 shows the location of the study area.
Fig. 1. Location of study area.
B. The method of investigation(i) Geostatistical methods: One of the methods ofinvestigating spatial variations in qualitative variables isusing geostatistical method. The main difference of thismethod with classic statistic is that in classic statistic,the samples taken from a statistical community areindependent from each other, and the presence of onesample does not show any information about the nextsample. But geostatistical methods investigate thepresence of spatial correlation among the amounts of avariable in a region. Totally, it can be said thatgeostatistics investigate those group of variables thathas spatial structure, or in other words, there is a spatialrelation among different amounts of them, distance andthe direction of arrangement (HasaniPak 1998).Therefore, geostatistics is a combination of technics and
accidental models that analyses the properties of spatialdata. This technic has the capacity and power ofestimation, and also can express the estimation error.Developing new technics like geostatistics solves theproblem of collecting data in precision agriculture, andmakes it possible to prepare maps of logic accuracy bycollecting less data (Burgess and Webster 1980).Geostatistical methods like kriging has a lot of usagesin soil science studies because of providing the bestlinear non-skewed estimation for determining theunknown values on regions which taking samples is notdone in them (Odeh et al. 1995).(ii) Kriging geostatistical estimator: Estimating thevariable values with spatial structure and distributionand evaluating the error associated with this estimationis called Kriging (Davis 1973).
Abadi, Jafarinia and Varvani 839
Kriging is a geostatistical estimator that Mathron calledit kriging in the honor of D.G. Krige(Bagheribedaghabadi et al. 1384).Kriging method is based on the weighted mobile meanand is the best non-skewed estimator that determinesthe estimated values and also estimation error in eachpoint. In the last decade, kriging was introduced as apowerful technic for interpolation and is used in variousfields of earth science including hydrology, soilscience, and mineralogy (Xu et al., 2006). One of themost important characteristics of kriging is that it paysattention to the spatial structure of points in the processof estimation, and in each estimation, the associatederror can be calculated (Hasanipak1998).This estimator which is also called BLUE (Best LinearUnbiased Estimator) has the following properties(Bagheribedaghabadi et al. 2005):
1. The estimated values for unknown points are linearcombinations of adjoining samples. It means that:
(1)
Where μˆ k is the kriging estimation and λi is the vectorof weights assigned to samples. In other words, anestimated or kriged value is obtained by attributingweights of λi to known values measured in adjoiningpoint.
2. It is non-skewed. It means that its mathematicalexpectation is equal to the real mean (μw) of samples.
(2)
3. Mean square of error has the lowest value possible. Itmeans that:
(3)
The most common kriging method is ordinary kriging,and it is supposed that the mean value is constant, butits value is not known. Therefore, local variable inestimation space is an unknown value.The generalized form of kriging is called cokriging. Insome cases it is possible that sampling from onevariable does not done adequately, and evaluating itsdistribution faces a problem. In this case, it is possibleto correct the evaluation by considering the correlationand spatial relation of this first variable, with a secondvariable that has suitable samples. By using cokriging,evaluation is done in parts that has lack of sample byusing the correlation among given local variables andalso helping variable. From the theoretical point ofview, cokriging is preferred to kriging method and it isa kind of generalizing one-variable kriging method. Ifthe correlation among two variables is more than 0.5,
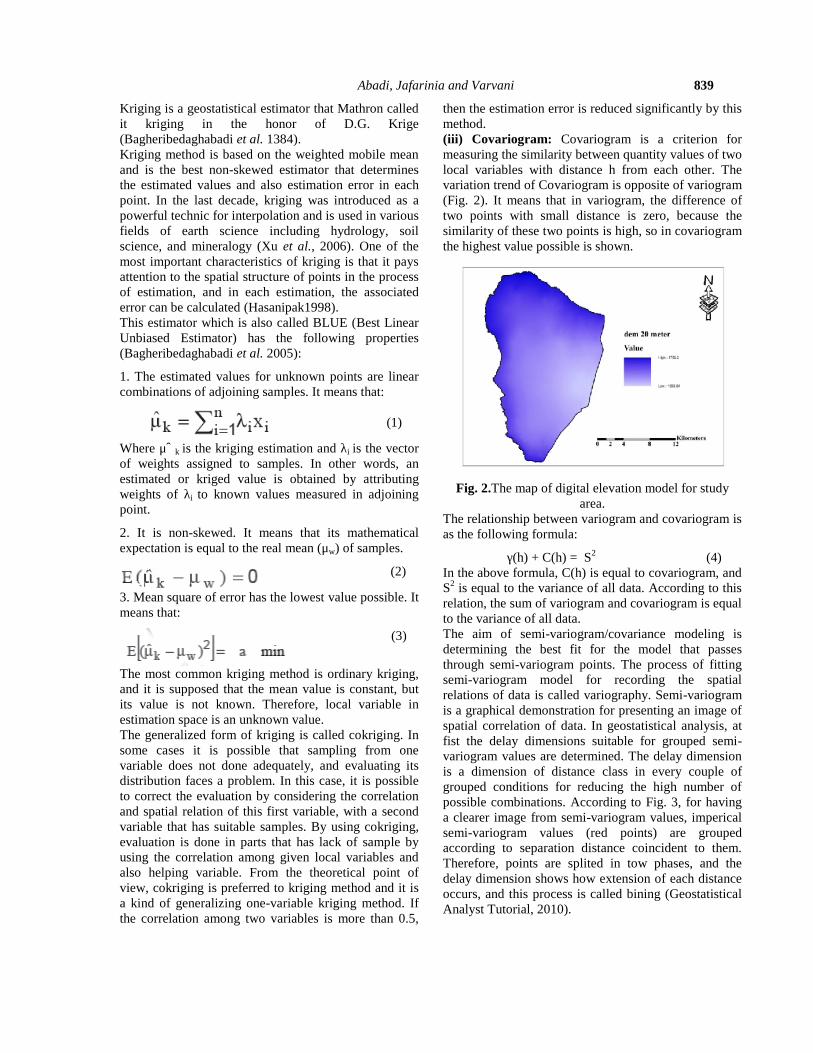
then the estimation error is reduced significantly by thismethod.(iii) Covariogram: Covariogram is a criterion formeasuring the similarity between quantity values of twolocal variables with distance h from each other. Thevariation trend of Covariogram is opposite of variogram(Fig. 2). It means that in variogram, the difference oftwo points with small distance is zero, because thesimilarity of these two points is high, so in covariogramthe highest value possible is shown.
Fig. 2.The map of digital elevation model for studyarea.
The relationship between variogram and covariogram isas the following formula:
γ(h) + C(h) = S2 (4)In the above formula, C(h) is equal to covariogram, andS2 is equal to the variance of all data. According to thisrelation, the sum of variogram and covariogram is equalto the variance of all data.The aim of semi-variogram/covariance modeling isdetermining the best fit for the model that passesthrough semi-variogram points. The process of fittingsemi-variogram model for recording the spatialrelations of data is called variography. Semi-variogramis a graphical demonstration for presenting an image ofspatial correlation of data. In geostatistical analysis, atfist the delay dimensions suitable for grouped semi-variogram values are determined. The delay dimensionis a dimension of distance class in every couple ofgrouped conditions for reducing the high number ofpossible combinations. According to Fig. 3, for havinga clearer image from semi-variogram values, impericalsemi-variogram values (red points) are groupedaccording to separation distance coincident to them.Therefore, points are splited in tow phases, and thedelay dimension shows how extension of each distanceoccurs, and this process is called bining (GeostatisticalAnalyst Tutorial, 2010).
Abadi, Jafarinia and Varvani 840
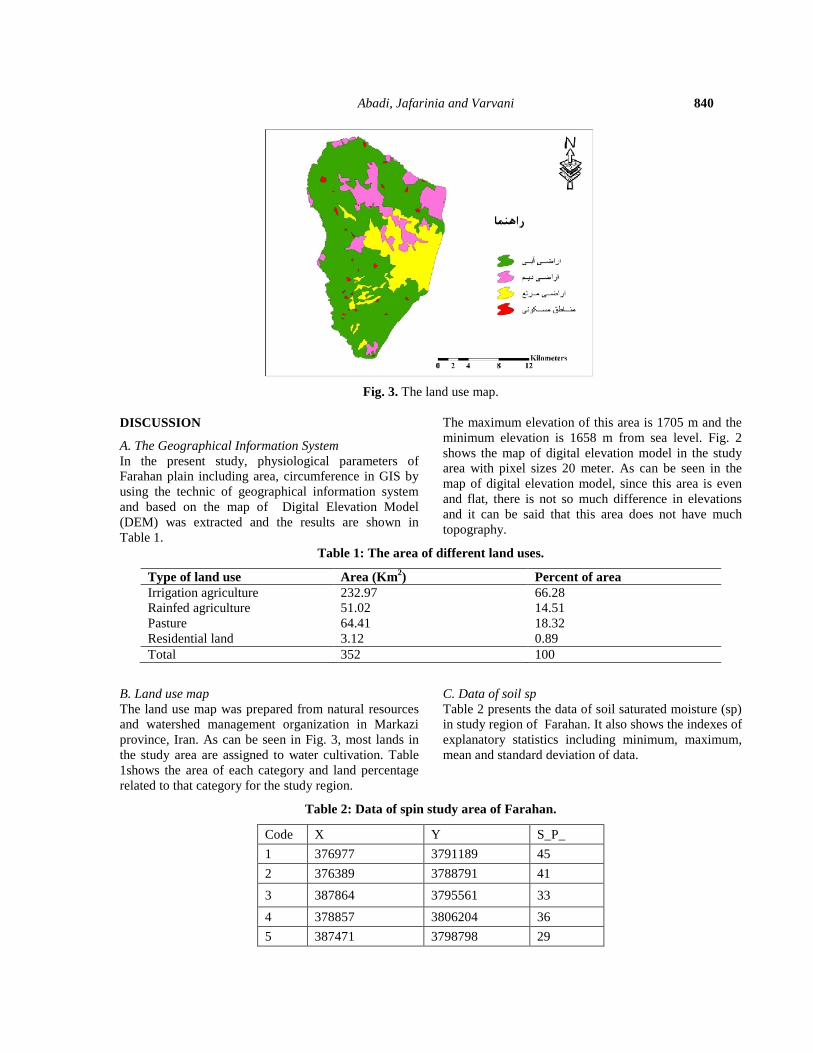
Fig. 3. The land use map.
DISCUSSION
A. The Geographical Information SystemIn the present study, physiological parameters ofFarahan plain including area, circumference in GIS byusing the technic of geographical information systemand based on the map of Digital Elevation Model(DEM) was extracted and the results are shown inTable 1.
The maximum elevation of this area is 1705 m and theminimum elevation is 1658 m from sea level. Fig. 2shows the map of digital elevation model in the studyarea with pixel sizes 20 meter. As can be seen in themap of digital elevation model, since this area is evenand flat, there is not so much difference in elevationsand it can be said that this area does not have muchtopography.
Table 1: The area of different land uses.
Type of land use Area (Km2) Percent of areaIrrigation agriculture 232.97 66.28Rainfed agriculture 51.02 14.51Pasture 64.41 18.32Residential land 3.12 0.89Total 352 100
B. Land use mapThe land use map was prepared from natural resourcesand watershed management organization in Markaziprovince, Iran. As can be seen in Fig. 3, most lands inthe study area are assigned to water cultivation. Table1shows the area of each category and land percentagerelated to that category for the study region.
C. Data of soil spTable 2 presents the data of soil saturated moisture (sp)in study region of Farahan. It also shows the indexes ofexplanatory statistics including minimum, maximum,mean and standard deviation of data.
Table 2: Data of spin study area of Farahan.
Code X Y S_P_
1 376977 3791189 45
2 376389 3788791 41
3 387864 3795561 33
4 378857 3806204 36
5 387471 3798798 29

Abadi, Jafarinia and Varvani 841
Code X Y S_P_
6 371954 3800055 35
7 379531 3790371 41
8 371883 3798440 41
9 371453 3803545 39
10 373589 3798934 41
11 382599 3783916 37
12 379917 3785735 39
13 371639 3800491 37
14 384563 3800726 30
15 381999 3801538 35
16 380561 3803414 38
17 376621 3806791 37
18 374370 3805978 37
19 375183 3804102 37
20 372994 3802539 37
21 377809 3804790 36
22 377246 3802789 37
23 374808 3801351 38
24 379560 3801226 37
25 376684 3799537 39
26 378622 3799662 37
27 381499 3799412 36
28 384625 3797974 33
29 386439 3796161 32
30 383062 3796286 34
31 383625 3794222 36
32 386064 3793034 36
33 385626 3791220 37
34 380623 3796161 37
35 381561 3793284 38
36 382624 3791346 37
37 382874 3789094 37
38 382624 3786468 38
39 380748 3788469 38
40 381436 3783842 36
41 379372 3782403 36
42 378309 3779527 37
43 376496 3781215 37
44 377496 3784092 38
45 375183 3784279 39
Abadi, Jafarinia and Varvani 842
46 376746 3786218 40
47 378685 3787594 41
48 373557 3787906 42
49 373369 3791721 45
50 376246 3793347 45
51 378434 3793284 43
52 374182 3795910 40
53 378372 3796161 40
54 375433 3798099 40
Maximum 29
Maximum 45
Mean 38Standard deviation
3
Table 3: Results of index normality.
N 55
Normal Parametersa Mean 38
Std. Deviation 3
Most Extreme Differences Absolute .242
Positive .132
Negative -.242
Kolmogorov-Smirnov Z 1.798
Asymp. Sig. (2-tailed) 0.1003
a. Test distribution is Normal.
D. The results of normality testAt first, the normality of data was tested in SPSSsoftware. The results showing the normality of data ispresented in Table 3. According to this table, if Sig forall indexes and also for land harvested data is more than5 percent, then the zero hypothesis is failed and data arenormal. As can be seen in Table 3, all parameters are innormal condition.
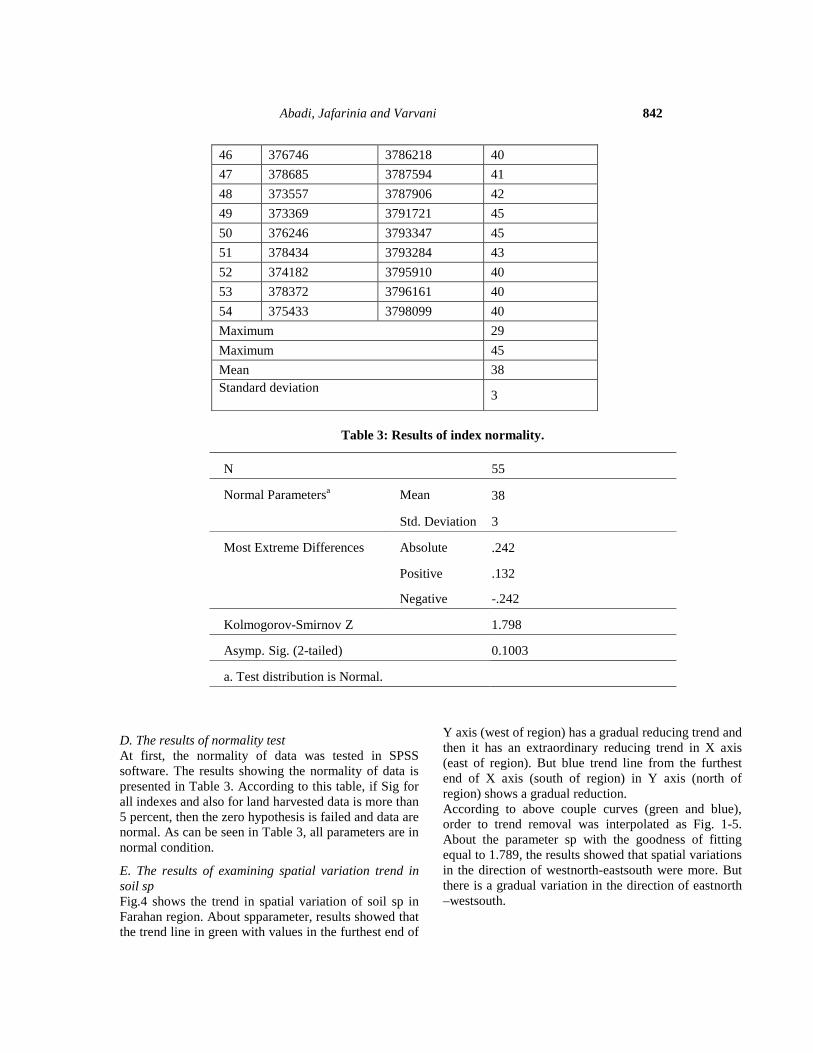
E. The results of examining spatial variation trend insoil spFig.4 shows the trend in spatial variation of soil sp inFarahan region. About spparameter, results showed thatthe trend line in green with values in the furthest end of
Y axis (west of region) has a gradual reducing trend andthen it has an extraordinary reducing trend in X axis(east of region). But blue trend line from the furthestend of X axis (south of region) in Y axis (north ofregion) shows a gradual reduction.According to above couple curves (green and blue),order to trend removal was interpolated as Fig. 1-5.About the parameter sp with the goodness of fittingequal to 1.789, the results showed that spatial variationsin the direction of westnorth-eastsouth were more. Butthere is a gradual variation in the direction of eastnorth–westsouth.
Abadi, Jafarinia and Varvani 843
Fig. 4. The experiment of spatial variation trend in hydraulic conductivity of soil saturated moisture.
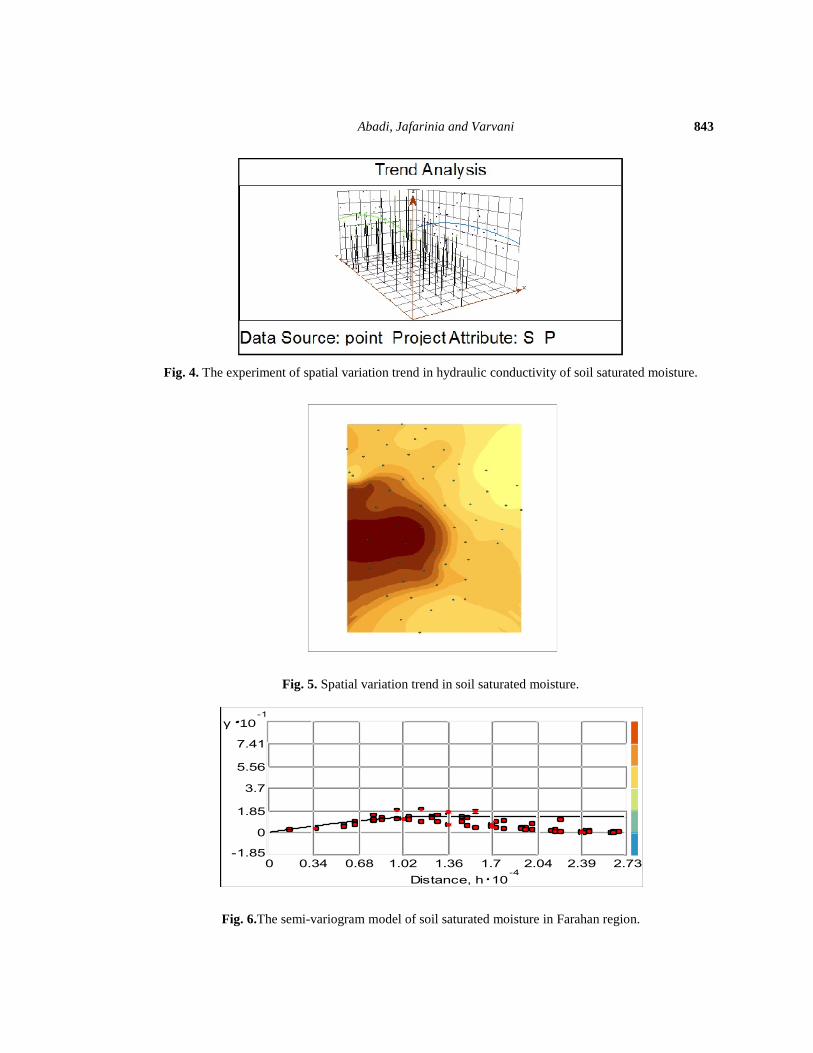
Fig. 5. Spatial variation trend in soil saturated moisture.
Fig. 6.The semi-variogram model of soil saturated moisture in Farahan region.
Distance, h 10-4
g 10-1
0 0.34 0.68 1.02 1.36 1.7 2.04 2.39 2.73-1.85
0
1.85
3.7
5.56
7.41

Abadi, Jafarinia and Varvani 844
Fig. 7. Interpolation map of soil sp in study region by using Spherical model.
F. The model of semi-variogramThe model of semi-variogram for data of soil saturatedmoisture of Farhan region is shown in Fig.1-6.According to the semi-variogram model, the values ofmodel parameter are presented in Table 4. Based onthese results, in the model of sp semi-variogram, thepartial threshold is zero and the line is without slope.
It shows that the phenomenon is relatively regular andthere is not sp monotony in the region. In fact thereason is related to the following factors:(i) The errors arising from sampling, preparation andsample analysis.(ii) The dimensions of harvest network and scale effect.(iii) Weak or lack of spatial structure.
Table 4: The anticipated error values obtained by kriging method.
Type of error Valuemean 0.0128Root mean square error 0.1519Mean standard error 0.1764Standardized mean square 0.017Standardized mean square error 0.9969Number of samples = 52
Table 5: The results of using different interpolation methods.
Method type Model type Sector type Anisotropy RMSS
Ordinary Kriging
Circular Four No 9792/0Spherical Four No 9969/0Tetraspherical Four No 9612/0Pentaspherical Four No 9532/0Exponential Four No 9782/0Gaussian Four No 9552/0Rational Quadratic Four No 9862/0Hole Effect Four No 9679/0k-Bassel Four No 9572/0J-Bassel Four No 9604/0Stable Four No 9271/0

Abadi, Jafarinia and Varvani 845
G. Preparing soil salinity map by using geostatisticsIn order to obtain the interpolation of soil saturatedmoisture, kriging method by using changing pattern ofall direction sight was used. The map of soil sp inFarhan region in GIS space was interpolated by usingkriging approach and ordinary kriging. The results areshown in Fig.7 as aninterpolation map.In this part for selecting the best approach andconsequently for selecting the best model, theRMSScriterion was used. For each model, more closethe parameter to number 1, the better theinterpolationmodel is. Table 4 shows the anticipatederror values obtained by kriging method for data of soilelectrical conductivity.As can be seen in Table 5, Spherical model from theordinary kriging was chosen as the best methodaccording to RMSS which has the most closeness tonumber 1.
CONCLUSION
A. Investigating the indexes of data descriptive statisticsIn this investigation, by sampling from 50 points from a500 hectare area in Farahan region, the soil saturatedmoisture was measured and used for preparinginterpolation maps. But at the beginning of the research,the indexes of data descriptive statistics wereinvestigated. In investigating the normality of data itbecame clear that data has more skewness and pullrelative to sp data. The skewness and pull for data were0.698 and 9.03 respectively and for sp data were 0.3and 1.95 respectively. Therefore, they are in the rangeof +2 to -2, and sp is normal. So they can be used withdefiniteness in other steps of statistical analysis.
B. Investigating the special variation trend in soil spAbout the special variation trend in sp, the resultsshowed that in the direction of west-eats, soil sp in thewest of region is low and by moving to the east, thevalues increase. But in the direction of north-south, soilsp reduces by moving toward the south. About theparameter spatial variation trend, results showed that inthe direction of west-east, soil has gradual increasingtrend and then gradual decreasing trend. Therefore, thehighest soil saturated moisture is found in the middle ofregion. In the direction of north-south, soil spis reducedby moving toward the south.Based on the overlap seen in the sp and soil parametersspatial variation trend it can be concluded that thehighest recorded values are related to the north ofregion, and by moving toward the south of region, the
soil quality will be better. Moreover, the results ofcouple curves showed that spatial variation of soil sp inthe directionof westnorth-eastsouth is more. But spatialvariations show that the direction of eastnorth-westsouthhas more variations than the direction ofwestnorth-eastsouth.
REFERENCES
Abdi, P. & A. Abdi(2001). Assessment anddevelopment trends of saline land in Qazvinusing RS-GIS. National Conference of land -soil erosion and sustainable developmentTehran, Iran: Pp: 5.
Akramkhanov, A., D. Brus, & D. Walvoort (2014).Geostatistical monitoring of soil salinity inUzbekistan by repeated EMI surveys.Geoderma, 213: 600-07.
Bagheribedaghabadi, M., A. Amini Faskhudi, & A.Esfandiarpoor (2005). Mapping soil salinityto use green space environment usinggeostatistical techniques and principles ofAHP (on the Kish island). Research journal ofSocial Science 22: 101-16.
Bouma, J., H. Booltink, & P. Finke (1996). Use of soilsurvey data for modeling solute transport inthe vadose zone.Journal of environmentalquality, 25(3): 519-26.
Burgess, T. & R. Webster (1980). Optimal interpolationand isarithmic mapping of soilproperties.Journal of Soil Science, 31(2): 333-41.
DarvishSefat, A.A. & A.A. Damavandi (2000).Investigate the possibility of saline landclassification using Landsat TM digital data.Desert Journal. 2(5 ): 27-36.
Davis, J. C. & R. J. Sampson (2002). Statistics and dataanalysis in geology: Wiley New York.
Hajrasuliha, S., N. Baniabbassi, J. Metthey, & D.Nielsen (1980). Spatial variability of soilsampling for salinity studies in southwest Iran.Irrigation Science,1(4): 197-208.
Hasani Pak, A. (1998). Geostatistics. Tehran: TehranUniversity Press.
Khaksaran, D., A. Waismoradi, S. Moradi, & H.Rahmati (2013). Spatial and temporal changesin soil salinity with geostatistics: A case studyin Urmia Plain. International Journal ofAgriculture and Crop Sciences, 5(3): 285-91.

Abadi, Jafarinia and Varvani 846
Nosrat Poor, M.S. Ardalan, A. Farajnia, & A. EsmailiOri (2010). Investigate the factors influencingthe spatial distribution of some nutrients andsoil fertility in Maragheh city land using GIS.Journal of Geological Research, 87: 2-11.
Pashazadeh, G.H. & M. Zeinali (2004). pH soil salinitymapping using GIS and geostatistics (CaseStudy: East of the Khoy, Azarbaijan Gharbi).Proceeding for 5th conference onGeonlogyPaiamnoor university Pp:6.
Pishkar, A. (2004). Mapping soil salinity usingGeostatistical method. Proceedings of the FirstNational Conference on watershed managementand soil and water resources. Shahid BahonarUniversity.: Pp: 112.
R., Z. A. & S. M. Mirsiar (2007). Using the capabilitiesof GIS in environmental evaluation: a casestudy of Birjand plain. GeomaticsConferenc.Tehran, Iran: Pp: 7.
RanjbarKhorasani, M., A. Esfandiar Brogeni, & H.Shirvani (2013).Geostatistical modeling ofspatial variability of soil salinity in the area of
pistachio orchard Bayza Second InternationalConference on Modelling plants, water, soiland air.: Pp:5.
Shariari, A., A. Delavari, A. Landi, & M.H. Shariari(2013). Spatial variability of soil salinity atdifferent depths by using geostatisticalmethods (case study: Ghorveh city ofKurdistan). Second National Conference onthe Sustainable Development of Agricultureand healthy environment. Tehran, Iran: Pp: 8.
Tarr, A. B., K.J. Moore, D.G. Bullock, P.M. Dixon, &C.L. Burras(2005). Improving map accuracyof soil variables using soil electricalconductivity as a covariate.PrecisionAgriculture,6(3): 255-70.
Xu, C.Y., L. Gong, T. Jiang, D. Chen, & V. Singh.(2006). Analysis of spatial distribution andtemporal trend of referenceevapotranspiration and pan evaporation inChangjiang (Yangtze River) catchment.Journal of Hydrology, 327(1): 81-93.