analytical electron microscopy study of a zno-nio solid solution
TRANSCRIPT

Analytical Electron Microscopy Study of a ZnO-NiO Solid Solution
Goran Dra�zi�c� and Darja Lisjak
`̀ Jozef Stefan'' Institute, Jamova 39, 1001 Ljubljana, Slovenia
Abstract. Results of an analytical electron micro-
scopy study of a binary ZnO-NiO system are reported
and discussed. Emphasis was placed on the determina-
tion of Ni concentration (solubility) in the ZnO grains
using quantitative TEM-EDXS. The in¯uence on the
results of beam diameter, foil thickness and corrections
used are described and discussed. During the study
small precipitates, presumably NiO, were found in the
ZnO grains of the ZnO-NiO samples with different
ZnO/NiO ratios. In TEM, the precipitates exhibited
image contrast only at certain orientations and were
normally invisible during the EDXS analysis. The
presence of the precipitates too small to be seen using
scanning electron microscopy could explain erroneous
results for the Ni concentration in a ZnO solid-solution
phase obtained previously using SEM-EDXS. Quanti-
tative EDXS analyses were performed on ZnO grains
using different electron beam diameters. In each sam-
ple, the spread of the results was correlated to the beam
diameter (analysed volume). It was found that when
the average number of precipitates was less than one
per analysed volume the measured points that included
precipitates could easily be identi®ed on the basis of
their deviation from the mean value of the Ni content.
Key words: Nickel oxide; zinc oxide; PTCR; analytical electronmicroscopy; energy dispersive X-ray spectroscopy.
A positive temperature coef®cient of electrical
resistivity (PTCR) was recently reported for ZnO-
NiO two phase ceramics [1, 2]. ZnO is an n-type
semiconductor and has a defect crystal structure with
excess Zn2� ions which occupy interstitial sites, while
NiO has a defect structure with vacancies at Ni sites
and is a p-type semiconductor [3]. Both oxides form a
series of solid solutions, the solubility of Ni in ZnO is
much smaller than the solubility of Zn in NiO. In all
cases, solubility increases with increasing temperature
[4]. The PTCR anomaly (ZnO and NiO individually
exhibit a negative temperature coef®cient of resistiv-
ity) has been explained as a consequence of the
different resistivities and a large difference in linear
expansion coef®cients of the phases [2, 5, 6]. A
percolation model was used to correlate the electrical
resistivity with phase composition [1]. ZnO grains
with dissolved Ni ions (ZnOss) are the conductive
phase in the ZnOss-NiOss system (where NiOss
represents NiO phase with dissolved Zn ions). The
concentration of the Ni in the ZnO phase is expected
to have a strong in¯uence on the electrical properties
of the system. The degree of solubility of Ni in ZnO
as a function of ®ring temperature and ZnOss/NiOss
ratio in the two-phase system was measured by SEM-
EDXS, but unexpected results were obtained [7]. The
concentration of Ni in the ZnOss phase was found to
be a function of the ZnOss/NiOss ratio in the mixture,
where all mixtures were ®red at the same temperature.
According to thermodynamics one should expect that
maximum solubility is a function of the temperature
and not of the amount of a secondary phase. In the
present work results of an analytical electron micro-
scopy study of a ZnOss-NiOss system are reported
and discussed. Emphasis was on the determination of
Ni concentration in ZnO using quantitative TEM-
EDXS. The in¯uence on the results of beam diameter,
foil thickness, and the corrections used are described
and discussed.
Experimental
Two sets of solid solutions with compositions Zn0.97Ni0.03O(ZnOss) and Ni0.60Zn0.40O (NiOss) were separately prepared from
Mikrochim. Acta 132, 289±294 (2000)
� To whom correspondence should be addressed

ZnO (Chemetall, Wien, grade Pharma A) and NiO (Inco Ltd.,grade F). ZnO and NiO powders were mixed in proper ratios andcalcined at 1050 �C in the case of ZnOss and 1300 �C in the case ofNiOss for 2 h. After the ®rst calcination the powders were milledand recalcined twice more. Bulk samples, with various ratios ofZnOss/NiOss were prepared from ZnOss and NiOss calcinates bymixing, pressing and ®ring in air. All samples were sintered at1420 �C for 2 h. The phase and chemical composition of thesintered samples were analysed by X-ray powder diffractometry(Philips), scanning electron microscopy combined with energydispersive X-ray spectroscopy (Jeol 840A with Tracor Series II)and transmission electron microscopy (JEOL 2000 FX with a LinkX-ray system).
TEM samples were prepared by mechanical thinning (down to120 mm), dimpling (20 mm) and ion milling using 3.8 keV argonions. The ion milling time was 5 h. Samples were examined with atransmission electron microscope (TEM), operated at 200 kV. Thechemical composition was investigated using a Link AN-10000EDXS system with an Ultra Thin Window Si(Li) detector,mounted perpendicularly to the electron beam. The samples weretilted at an angle of 31� during the EDXS spectrum collection. TheCliff ± Lorimer [8] method and absorption and fluorescencecorrections [9±12] were employed for quantitative analysis. Weused anhydrous NiSO4 and ZnSO4 as standards for k-factordetermination. Sample thickness, needed for absorption andfluorescence corrections, was estimated using the contaminationspot method. The reproducibility of the measurements (relativestandard deviation of zinc and nickel wt%) was better than or equalto 2%. The concentration of oxygen was calculated from thestoichiometry.
Results and Discussion
Microstructure
In Fig. 1, a TEM micrograph (bright ®eld) of a grain
boundary area between ZnOss and NiOss grains in a
sample with 40 wt% ZnOss and 60 wt% NiOss
(0.4ZnOss ± 0.6NiOss) is shown. Dislocations in the
ZnOss grains and the stress ®eld at the grain boundary
are clearly seen. The presence of stress at the grain
boundary is most probably due to a large difference
(a factor of 2) in the linear thermal coef®cients of ZnO
and NiO [3]. There were no visible defects inside the
NiOss grains found even when the grain was tilted to
other orientations. A TEM-EDXS microstructural
study of samples of composition 0.8ZnOss ± 0.2NiOss
and pure ZnOss reveals the presence of very small
precipitates of a Ni rich phase in the ZnOss grains.
The precipitates are visible only in certain orientations
of the ZnOss grains.
In Fig. 2, a TEM micrograph (bright ®eld) of a
grain in the pure ZnOss sample is shown. Small black
dots, more or less uniformly distributed over the
whole micrograph are most probably artifacts due to
the ion milling damage. The features with dark
contrast, around 20 nm in diameter are strain ®elds
around precipitates. The exact dimensions of the
precipitates could not be measured directly from the
micrograph. The strain ®eld around a precipitate is the
consequence of the crystal lattice mismatch between
the matrix lattice of ZnO (hexagonal, wurtzite type
structure) and the precipitate. From the EDXS
analysis which revealed a higher concentration of Ni
in the area with precipitates and from the selected area
electron diffraction patterns it was concluded that the
precipitates were probably NiO (cubic). Incompat-
ibility between the hexagonal, wurtzite type structure
(a� 0.3249 nm, c� 0.5205 nm) and the cubic NaCl
type structure (a� 0.4177) is most likely the reason
for the high strain ®elds around the precipitates which
Fig. 1. TEM micrograph (bright ®eld) of a grain boundary areabetween ZnOss and NiOss grains in a0.4ZnOss ± 0.6NiOss sample.Note dislocations (D) in the ZnOss grain and stress ®elds (S ) at thegrain boundary (GB)
Fig. 2. TEM micrograph (bright ®eld) of a grain in a pure ZnOsssample. (P) ± precipitates with characteristic strain ®eld aroundthem
290 G. Dra�zi�c and D. Lisjak

prevents them from growing. No precipitate larger
than a few nm was found.
The concentration of precipitates varied with the
ZnOss/NiOss ratio in the samples. In the case of
samples composed of pure ZnOss the number of
precipitates was one order of magnitude smaller than
in the 0.8ZnOss ± 0.2NiOss samples. The difference in
the number of precipitates is clearly seen in Figs. 3a
and 3b, where TEM micrographs of ZnOss grains in
pure ZnOss and 0.8ZnOss ± 0.2NiOss are shown.
Small black dots are again ion-beam damage, black
features 10 to 20 nm in diameter are strain ®elds
around the precipitates.
The presence of precipitates too small to be
detected in the scanning electron microscope was
found to be the reason for incorrect measurements of
the solubility of Ni in ZnO using SEM-EDXS. The
error arises because both dissolved Ni in the ZnO
matrix and nickel in the NiO precipitates contribute to
the overall measured concentration of Ni. Conse-
quently, we endeavored to determine the correct
degree of solid solubility of Ni in ZnO using TEM-
EDXS analysis which offers a much higher spatial
resolution.
Quantitative TEM-EDXS Analysis
The main problem during the EDXS analysis was that
during the measurement the precipitates were not in
contrast, so we were unable to identify how many, or
indeed, if any precipitates existed in the analysed
volume. We tried to overcome this problem in the
following way. If we performed EDXS analyses at
many points with suf®cient precision and lateral
resolution we could distinguish between measure-
ments where precipitates were present and those
where precipitates were absent on the basis of
statistics (deviation from the median value). To
enhance the precision of the method we performed
an optimisation of the analytical parameters.
Optimisation of the Analytical Parameters
Compromises were made among the parameters of
lateral spatial resolution, counting statistics, spectrum
collection time and foil thickness. To estimate how
many precipitates are present in the analysed volume,
the geometry of the electron beam and the foil
thickness need to be known. We used several different
beam diameters in this study; 20, 50, 100 and 500 nm.
The shape of the smallest electron beam used was
ellipsoidal, with diameters 20 and 30 nm. According
to an equation proposed by Reed [11] the beam
diameter broadening for foils with different thickness
was calculated and the results are shown in Fig. 4.
Experimentally it was found that during a period of
5 min the drift of the sample was a few nm, and the
sample contamination was reasonably low. For longer
collection times, carbon build-up was found to be
quite high, especially at small beam diameter. If 5 min
is the longest time for EDXS spectra collection and
with a requirement for at least 2� 104 counts for the
smallest peak (Ni K� in this case), for an uncertainty
less than 2% (1.4% in the case of 2� 104 counts at a
95% con®dence limit) [13] then the foil thickness at
the measuring point should be around 200 nm. At this
thickness the in¯uence of the amorphous contamina-
tion layer, originating from the ion erosion process, is
also low. The foil thickness was determined using the
contamination spot method [13]. Because the foil is
Fig. 3. TEM micrographs of precipi-tates in ZnOss grains in (a) ± pureZnOss and (b) ± a 0.8ZnOss ± 0.2NiOsssample
Analytical Electron Microscopy Study of a ZnO-NiO Solid Solution 291
relatively thick the need to perform absorption and
¯uorescence corrections were critically assessed. In
the Ni-Zn-O system the mass absorption coef®-
cients for the Ni and Zn lines are relatively small
[10] hence for a thickness of around 200 nm the
correction factor is very close to 1 (1.002). This
means that absorption corrections need not necessa-
rily be employed. The ¯uorescence correction was
made using to the equation proposed by Nockolds et
al. [12]. In Fig. 5, the calculated ratio of the
¯uorescence intensity to the primary intensity for
2 wt% Ni in ZnO is plotted as a function foil
thickness. It is evident from the diagram, that if the
errors are to be kept to a minimum (below 1%) the
¯uorescence correction should be used.
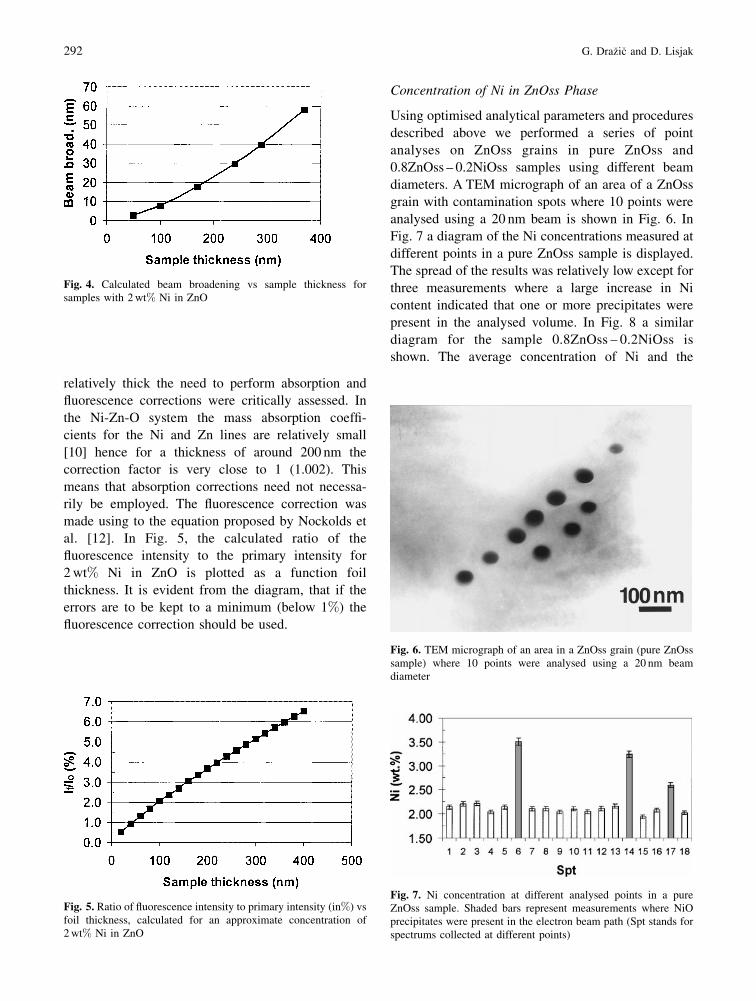
Concentration of Ni in ZnOss Phase
Using optimised analytical parameters and procedures
described above we performed a series of point
analyses on ZnOss grains in pure ZnOss and
0.8ZnOss ± 0.2NiOss samples using different beam
diameters. A TEM micrograph of an area of a ZnOss
grain with contamination spots where 10 points were
analysed using a 20 nm beam is shown in Fig. 6. In
Fig. 7 a diagram of the Ni concentrations measured at
different points in a pure ZnOss sample is displayed.
The spread of the results was relatively low except for
three measurements where a large increase in Ni
content indicated that one or more precipitates were
present in the analysed volume. In Fig. 8 a similar
diagram for the sample 0.8ZnOss ± 0.2NiOss is
shown. The average concentration of Ni and the
Fig. 4. Calculated beam broadening vs sample thickness forsamples with 2 wt% Ni in ZnO
Fig. 5. Ratio of ¯uorescence intensity to primary intensity (in%) vsfoil thickness, calculated for an approximate concentration of2 wt% Ni in ZnO
Fig. 6. TEM micrograph of an area in a ZnOss grain (pure ZnOsssample) where 10 points were analysed using a 20 nm beamdiameter
Fig. 7. Ni concentration at different analysed points in a pureZnOss sample. Shaded bars represent measurements where NiOprecipitates were present in the electron beam path (Spt stands forspectrums collected at different points)
292 G. Dra�zi�c and D. Lisjak

spread of the results were much higher than in the
case of the pure ZnOss sample. The question was,
how many NiO precipitates contributed to the total Ni
concentration in the measured points. From the TEM
micrographs shown in Figs. 3a and 3b the numerical
density of precipitates (number of precipitates per unit
volume) in both samples was estimated. From the
beam diameter (for a 20nm beam), beam broadening
and sample thickness, the analysed volumes were
calculated and the number of precipitates per analysed
volume estimated. It was found that in the pure ZnOss
sample approximately 0.1 precipitate per analysed
volume and in the case of the 0.8ZnOss ± 0.2NiOss
sample 2±10 precipitates per analysed volume were
present. In Table 1 the results of quantitative EDXS
analyses performed on pure ZnOss and 0.8ZnOss ±
0.2NiOss samples using different beam diameters are
given.
From Table 1 we can see that for both samples the
smallest relative standard deviation of measurements
was obtained when the largest beam diameter
(500 nm) was used. In the pure ZnOss sample the
standard deviation of the measurements using a 20 nm
beam was very close (2.2%) to that of the measure-
ments performed with a 500 nm beam (1.8%). In the
case of the pure ZnOss sample, where the number of
precipitates was relatively low, we were able to
determine the correct concentration of Ni in solid
solution using the described procedure. In the case of
the 0.8ZnOss ± 0.2NiOss sample the relative standard
deviation of the measurements using a 20 nm beam is
much higher (3.4%) than with a 100 nm beam (1.7%)
or a 500 nm beam diameter (1.4%). The large spread
in the results (20 nm beam) was in accordance with
the estimated number of precipitates per analysed
volume (2 to 10 precipitates). When larger beam
diameters were used (100 and 500 nm) the relative
variation in the number of precipitates in the analysed
volume was much smaller, resulting in a lower
relative standard deviation. With 20 nm, the smallest
beam diameter achieved in our microscope (with
reasonable count rate, etc.), we were unable to
determine the correct concentration of Ni in the
ZnOss solid solution. Perhaps using dedicated ®eld
emission gun (FEG) microscopes with beam dia-
meters an order of magnitude smaller than in our case
and using a foil thickness below 100 nm, so that
number of precipitates per analysed volume would be
smaller than 1, it would be possible to determine the
correct concentration of Ni using the described
procedure.
Summary
Using analytical electron microscopy, nano-size,
presumably NiO, precipitates were found in ZnOss
grains in ZnOss-NiOss samples with different
ZnOss/NiOss ratios. Precipitates were in contrast just
in certain orientations, so normally during the EDXS
analysis they were not visible. The presence of the
precipitates, too small to be seen in the scanning
electron microscopy could explain the erroneous
results for the Ni concentration in the ZnOss phase
obtained using SEM-EDXS.
Optimising analytical parameters, taking into
account beam diameter, foil thickness, beam broad-
ening, acquisition time, peak intensities and absorp-
tion and ¯uorescence corrections, the reproducibility
of measurements of Ni in ZnO was equal to or better
than 2% (relative standard deviation).
Fig. 8. Ni concentration at different analysed points in a0.8ZnOss ± 0.2NiO sample (Spt stands for spectrums collected atdifferent points)
Table 1. Average concentration of Ni in ZnOss grains in pure ZnOssand 0.8ZnOss---0.2NiOss samples as a function of beam diameter
Beam Average Ni Rel. stand.Sample diameter
(nm)conc.(wt%)
deviation(%)
Pure ZnOss 500 2.2 1.820� 2.1 2.2
0.8ZnOss ± 0.2NiOss 500 3.1 1.4100 3.1 1.720 3.0 3.4
� Measurements with a clear indication of the presence ofprecipitates were not taken into account (see Fig. 7).
Analytical Electron Microscopy Study of a ZnO-NiO Solid Solution 293

Quantitative EDXS analyses were performed on
ZnOss grains using 20, 100 and 500 nm electron beam
diameters on samples consisting of pure ZnOss and
0.8ZnOss ± 0.2NiOss. In each sample, the spread of
the results was correlated to beam diameter (analysed
volume). It was found that in the case when the
number of precipitates was less than one per analysed
volume (pure ZnOss sample) the measured points
where a precipitate (or precipitates) was included
could easily be determined on the basis of the
deviation from the mean (or better median) value.
Using this procedure, the correct (without the
in¯uence of the precipitates) degree of solubility of
Ni in ZnOss could be measured. When the number of
precipitates per analysed volume was greater than 1
we were not able to avoid the in¯uence of precipitates
on the measured concentration of Ni.
Acknowledgements. The ®nancial support of the Ministry of Scienceand Technology of the Republic of Slovenia is gratefully acknowl-edged. The authors wish to thank Mrs. Medeja Gec for TEM samplepreparation.
References
[1] M. Drofenik, D. Lisjak, I. Zajc, J. Am. Ceram. Soc. 1997, 80,1741.
[2] D. Lisjak, I. Zajc, M. Drofenik, J. Mater. Sci. Lett. 1997, 16,304.
[3] K. Hauffe, C. Seyferth, Reaktionen in und an festenStoffen, Springer Berlin Heidelberg New York Tokyo, 1966,p. 640.
[4] A. Novrotsky, A. Muan, J. Inorg. Nucl. Chem. 1971, 33,35.
[5] D. Lisjak, M. Drofenik, G. Drazic, D. Kolar, J. Mater. Sci.1998, 33, 4201.
[6] D. Lisjak, I. Zajc, M. Drofenik, J. Jamnik, Solid State Ionics1997, 99, 125.
[7] D. Lisjak, M. Drofenik, D. Kolar, submitted to J. Mater. Res.[8] G. Cliff, G. W. Lorimer, J. Microscopy 1975, 103, 203.[9] J. I. Goldstein, J. L. Costley, G. W. Lorimer, S. J. B. Reed, SEM
1977. In: O. Johari (Ed.) IITRI, Chicago, 1977, p. 315.[10] K. F. J. Heinrich, The Electron Microprobe. In: T. D. McKin-
ley, K. F. J. Heinrich, D. B. Wittry (Eds.) J. Wiley & Sons, NewYork, 1964.
[11] S. J. B. Reed, Ultramicroscopy 1982, 7, 405.[12] C. Nockolds, M. J. Nasir, G. Cliff, G. W. Lorimer, Inst. Phys.
Conf. Ser. No. 52, Inst. of Physics, Bristol and London, 1979,p. 417.
[13] D. B. Williams, C. B. Carter, Transmission Electron Micro-scopy ± Part IV : Spectrometry. Plenum Press, New York, 1996.
294 Analytical Electron Microscopy Study of a ZnO-NiO Solid Solution