analytical currents: nirs is great for libraries
TRANSCRIPT
To understand a protein’s function, it’soften important to know which proteinsit interacts with and in what order. Thisis a difficult task, particularly for peptiderecognition molecules, which mediatemany protein–protein interactions. Butit might become easier with a new com-putational and experimental methoddeveloped by Stanley Fields, CharlesBoone, Gianni Cesareni, and colleaguesat the University of Washington, theUniversity of Toronto (Canada), theUniversity of Rome Tor Vergata (Italy),and Mount Sinai Hospital–Toronto(Canada).To demonstrate the new strategy, the
researchers chose the SH3 domains fromthe yeast Saccharomyces cerevisiae. Proteinsthat bear an SH3 domain are typicallyinvolved in signal transduction or reor-ganization of the cytoskeleton.First, the researchers screened a library
of random 9-amino-acid-long peptidesto see which ones would bind to variousSH3 domains. From these results, theresearchers derived a set of patterns, which
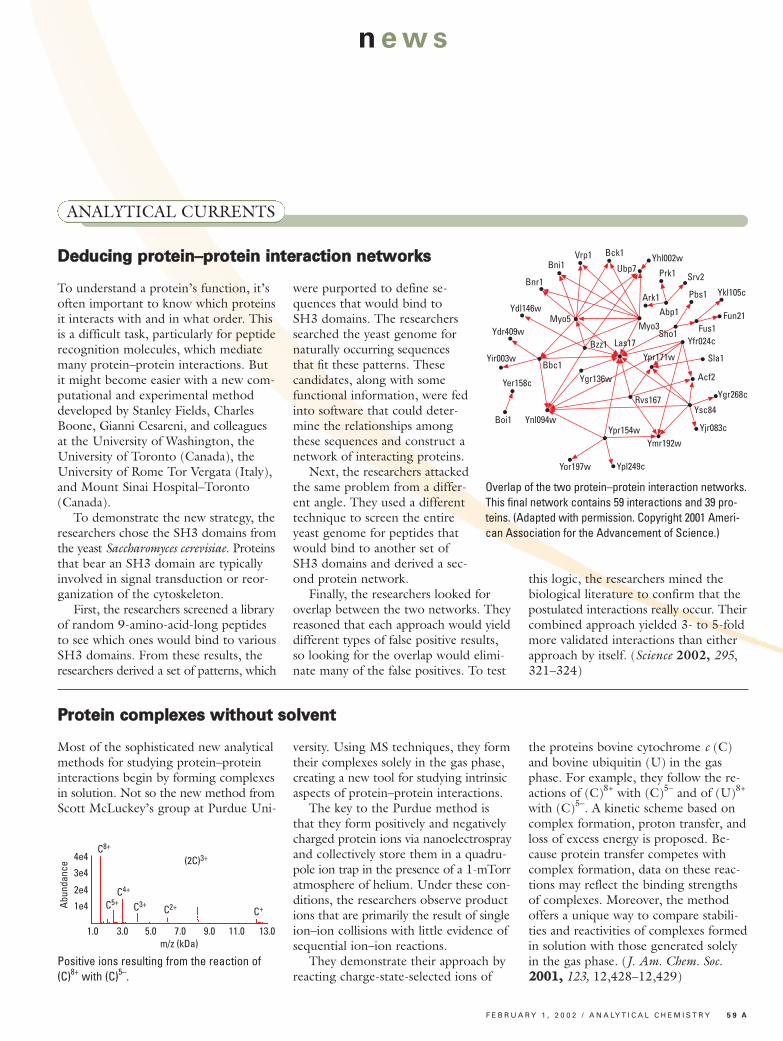
were purported to define se-quences that would bind toSH3 domains. The researcherssearched the yeast genome fornaturally occurring sequencesthat fit these patterns. Thesecandidates, along with somefunctional information, were fedinto software that could deter-mine the relationships amongthese sequences and construct anetwork of interacting proteins.Next, the researchers attacked
the same problem from a differ-ent angle. They used a differenttechnique to screen the entireyeast genome for peptides thatwould bind to another set ofSH3 domains and derived a sec-ond protein network.Finally, the researchers looked for
overlap between the two networks. Theyreasoned that each approach would yielddifferent types of false positive results,so looking for the overlap would elimi-nate many of the false positives. To test
this logic, the researchers mined thebiological literature to confirm that thepostulated interactions really occur. Theircombined approach yielded 3- to 5-foldmore validated interactions than eitherapproach by itself. (Science 2002, 295,321–324)
news
Yhl002wUbp7 Prk1 Srv2
Ykl105c
Fun21Fus1
Yfr024c
Sla1
Acf2
Ygr268c
Ysc84
Yjr083c
Pbs1
Sho1Myo3
Abp1Ark1
Ypr171w
Ypr154w
Rvs167
Ymr192w
Bck1Vrp1Bni1
Bnr1
Ydl146wMyo5
Bzz1 Las17
Ygr136wBbc1
Ynl094wBoi1
Yer158c
Yir003w
Ydr409w
Ypl249cYor197w
Overlap of the two protein–protein interaction networks.This final network contains 59 interactions and 39 pro-teins. (Adapted with permission. Copyright 2001 Ameri-can Association for the Advancement of Science.)
DDeedduucciinngg pprrootteeiinn––pprrootteeiinn iinntteerraaccttiioonn nneettwwoorrkkss
ANALYTICAL CURRENTS
PPrrootteeiinn ccoommpplleexxeess wwiitthhoouutt ssoollvveenntt
Most of the sophisticated new analyticalmethods for studying protein–proteininteractions begin by forming complexesin solution. Not so the new method fromScott McLuckey’s group at Purdue Uni-
versity. Using MS techniques, they formtheir complexes solely in the gas phase,creating a new tool for studying intrinsicaspects of protein–protein interactions.The key to the Purdue method is
that they form positively and negativelycharged protein ions via nanoelectrosprayand collectively store them in a quadru-pole ion trap in the presence of a 1-mTorratmosphere of helium. Under these con -ditions, the researchers observe productions that are primarily the result of singleion–ion collisions with little evidence ofsequential ion–ion reactions.They demonstrate their approach by
reacting charge-state-selected ions of
the proteins bovine cytochrome c (C)and bovine ubiquitin (U) in the gasphase. For example, they follow the re-actions of (C)8+ with (C)5– and of (U)8+
with (C)5–. A kinetic scheme based oncomplex formation, proton transfer, andloss of excess energy is proposed. Be-cause protein transfer competes withcomplex formation, data on these reac-tions may reflect the binding strengthsof complexes. Moreover, the methodoffers a unique way to compare stabili-ties and reactivities of complexes formedin solution with those generated solelyin the gas phase. (J. Am. Chem. Soc.22000011,, 123, 12,428–12,429)
F E B R U A R Y 1 , 2 0 0 2 / A N A LY T I C A L C H E M I S T R Y 5 9 A
Abun
danc
e 4e4
3e4
2e4
1e4
1.0 3.0 5.0 7.0 9.0 11.0 13.0m/z (kDa)
C8+
C5+C4+
C3+ C2+
(2C)3+
C+
Positive ions resulting from the reaction of(C)8+ with (C)5–.

6 0 A A N A LY T I C A L C H E M I S T R Y / F E B R U A R Y 1 , 2 0 0 2
news
ANALYTICAL CURRENTS
Australian researchers show that a prin-cipal theory to determine interactiveforces between colloidal particles maynot always work in the real world. CalumDrummond and Robert Considine atthe CSIRO Molecular Science and theCooperative Research Center for WaterQuality and Treatment (both in Australia)use atomic force microscopy (AFM) toshow that although pairs of colloids inaqueous electrolyte appear smooth atnanometer scales, their surfaces arerough—and that can weaken short-range forces. Surface properties of colloids are
known to determine flow and dispersionin suspensions and particulate fluids. Afundamental theory used to predictthese interactive forces is the Derjaguin,Landau, Verwey, and Overbeek (DLVO)theory, in which the total interactionenergy between two surfacesis calculated as the sum of the van derWaals and electrical double layer ener-gies. By using AFM to measure topog-raphy and determine force–separationcurves between pairs of silica colloids inaqueous electrolyte, the researchers dis-covered that the force–separation datawere entirely repulsive, which is incon-sistent with the anticipated van derWaals attraction expected to dominateover separations at <5 nm.
Other scientists havepreviously proposed thatinteractions between ideal-ly smooth silica sheets in-volve non-DLVO repul-sive forces, such as stericor hydration, which maydominate the silica–silicainteraction at short rangeand reduce the signifi-cance of van der Waalsforces. The two researchersnot only propose anddemonstrate that surfaceroughness explains the ab-sence of an attractive re-gion in the force– separa-tion data but also notethat other short-rangeforces would be weak -ened in systems that havenanometer-scale surfaceroughness.Drummond and Consi-
dine also report that the experimentaldecay length of the repulsive force isin good agreement with the predictedDebye length, suggesting that the ori-gin of the repulsive forces is an electricaldouble layer interaction. They obtainedgood agreement between the fitted dif-fuse layer potential (�fit) and the elec-trostatic potential (�-potential) at the
plane of shear from electrophoretic mo-bilities at low electrolyte concentration(<5 mM KNO3). But at higher ionicstrengths, the researchers saw a system-atic divergence of �fit and �-potential.This is consistent with the importanceof surface roughness as the Debyelength shortens, they say. (Langmuir2001, 17, 7777–7783)
KNO3 (mM)El
ectro
stat
ic p
oten
tial (
mV)
0.01
–100
–50
–75
–25
0
0.1 1 10 100 1000
ElectrophoresisAFM
–125
Comparison of electrostatic potential of silica colloids byparticle electrophoresis (circles) and by fitting force-versus-separation data with Derjaguin, Landau, Verwey, and Over-beek theory (diamonds) at pH ~8 as a function of electrolyteconcentration.
RRoouugghhiinngg iitt iinn tthhee rreeaall wwoorrlldd
In an era of sophisticated methods that
need expensive equipment, it is reassuring
to know that applications are still being
found for “tried-and-true” colorimetric analy-
ses. In this case, Shigehiro Yamaguchi,
Kohei Tamao, and Seiji Akiyama at Kyoto
University (Japan) describe borane-con-
taining compounds that selectively bind
fluoride ions and undergo color changes.
The key to these fluoride-binding com-
pounds is an extended π-electron system
around the boron atom, which leads to
unique electronic properties. For example,
when F– binds to the central boron in trian -
thrylborane, a strong absorption band at
470 nm disappears, and new bands pop up
around 360 to 410 nm—a huge 60-nm shift in
the maximum wavelength. Add more anthryl
groups, and the shift becomes even larger.
Moreover, the compounds are selec-
tive. The trianthrylborane’s binding con-
stant for F– in tetrahydrofuran solution is
~3 � 105 M–1, which is more than 2 orders
of magnitude better than with acetate or
hydroxide. Adding water removes the anion
and regenerates the original compound.
Furthermore, other potentially interfering
anions, such as Cl–, Br–, and ClO4–, don’t
even bind to the borane. (J. Am. Chem. Soc.
2001,123, 11,372–11,375)
CCoolloorr--cchhaannggiinngg fflluuoorriiddee sseennssoorr
F E B R U A R Y 1 , 2 0 0 2 / A N A LY T I C A L C H E M I S T R Y 6 1 A
n ews
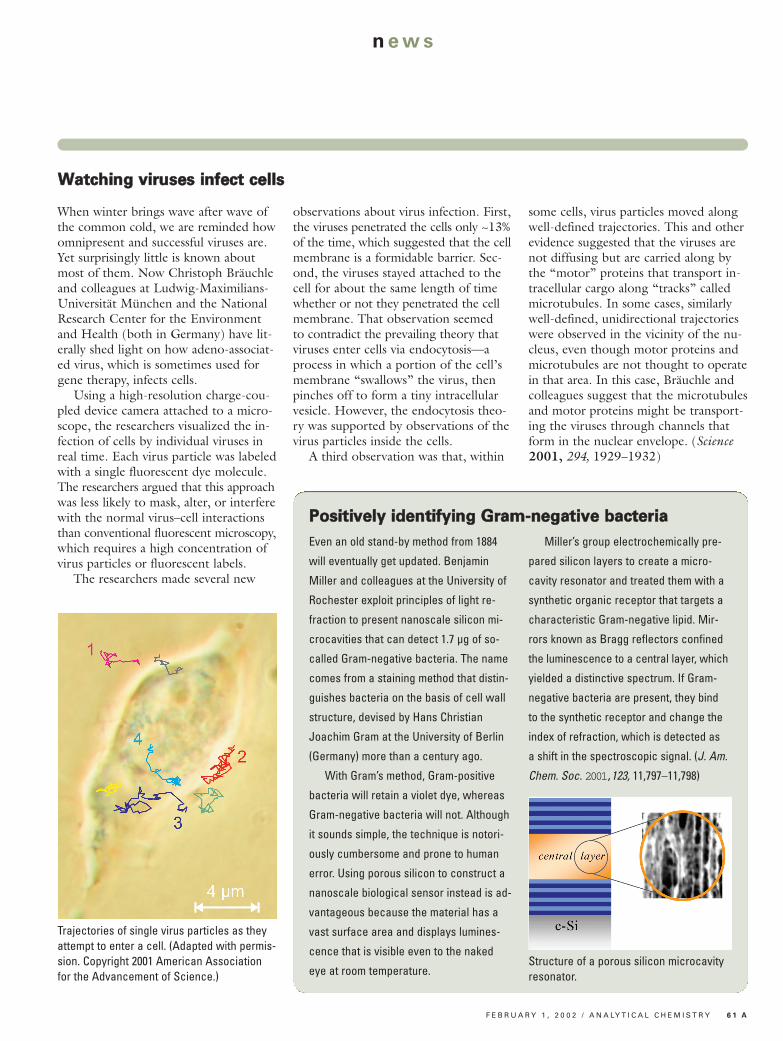
When winter brings wave after wave ofthe common cold, we are reminded howomnipresent and successful viruses are.Yet surprisingly little is known aboutmost of them. Now Christoph Bräuchleand colleagues at Ludwig-Maximilians-Universität München and the NationalResearch Center for the Environmentand Health (both in Germany) have lit-erally shed light on how adeno-associat-ed virus, which is sometimes used forgene therapy, infects cells.Using a high-resolution charge-cou-
pled device camera attached to a micro-scope, the researchers visualized the in-fection of cells by individual viruses inreal time. Each virus particle was labeledwith a single fluorescent dye molecule.The researchers argued that this approachwas less likely to mask, alter, or interferewith the normal virus–cell interactionsthan conventional fluorescent microscopy,which requires a high concentration ofvirus particles or fluorescent labels.The researchers made several new
observations about virus infection. First,the viruses penetrated the cells only ~13%of the time, which suggested that the cellmembrane is a formidable barrier. Sec-ond, the viruses stayed attached to thecell for about the same length of timewhether or not they penetrated the cellmembrane. That observation seemedto contradict the prevailing theory thatviruses enter cells via endocytosis—aprocess in which a portion of the cell’smembrane “swallows” the virus, thenpinches off to form a tiny intracellularvesicle. However, the endocytosis theo-ry was supported by observations of thevirus particles inside the cells.A third observation was that, within
some cells, virus particles moved alongwell-defined trajectories. This and otherevidence suggested that the viruses arenot diffusing but are carried along bythe “motor” proteins that transport in-tracellular cargo along “tracks” calledmicrotubules. In some cases, similarlywell-defined, unidirectional trajectorieswere observed in the vicinity of the nu-cleus, even though motor proteins andmicrotubules are not thought to operatein that area. In this case, Bräuchle andcolleagues suggest that the microtubulesand motor proteins might be transport-ing the viruses through channels thatform in the nuclear envelope. (Science2001, 294, 1929–1932)
Trajectories of single virus particles as theyattempt to enter a cell. (Adapted with permis-sion. Copyright 2001 American Associationfor the Advancement of Science.)
WWaattcchhiinngg vviirruusseess iinnffeecctt cceellllss
Even an old stand-by method from 1884
will eventually get updated. Benjamin
Miller and colleagues at the University of
Rochester exploit principles of light re-
fraction to present nanoscale silicon mi-
crocavities that can detect 1.7 µg of so-
called Gram-negative bacteria. The name
comes from a staining method that distin-
guishes bacteria on the basis of cell wall
structure, devised by Hans Christian
Joachim Gram at the University of Berlin
(Germany) more than a century ago.
With Gram’s method, Gram-positive
bacteria will retain a violet dye, whereas
Gram-negative bacteria will not. Although
it sounds simple, the technique is notori-
ously cumbersome and prone to human
error. Using porous silicon to construct a
nanoscale biological sensor instead is ad-
vantageous because the material has a
vast surface area and displays lumines-
cence that is visible even to the naked
eye at room temperature.
Miller’s group electrochemically pre-
pared silicon layers to create a micro -
cavity resonator and treated them with a
synthetic organic receptor that targets a
characteristic Gram-negative lipid. Mir-
rors known as Bragg reflectors confined
the luminescence to a central layer, which
yielded a distinctive spectrum. If Gram-
negative bacteria are present, they bind
to the synthetic receptor and change the
index of refraction, which is detected as
a shift in the spectroscopic signal. (J. Am.
Chem. Soc. 2001,123, 11,797–11,798)
Structure of a porous silicon microcavityresonator.
PPoossiittiivveellyy iiddeennttiiffyyiinngg GGrraamm--nneeggaattiivvee bbaacctteerriiaa

6 2 A A N A LY T I C A L C H E M I S T R Y / F E B R U A R Y 1 , 2 0 0 2
news
ANALYTICAL CURRENTS
Having previously constructed carbonnanotube membranes (CNMs), CharlesMartin’s group has turned its attentionto enhancing the flow rate across such amembrane. Martin and his colleagues atthe University of Florida–Gainesville de-scribe what they believe is the first exampleof electroosmotic flow (EOF) in CNMsplus several ways of controlling the flow.CNMs are made via chemical vapor
deposition of carbon onto a microporousalumina template, which creates uniform,densely packed, open-ended carbon nano -tubes. The high density of nanotubes(1011 nanotubes/cm2) enhances fluxacross the membrane and makes it a likelycandidate as a chemically selective filter.Because CNMs have a negative sur-
face charge, the EOF moves in the samedirection that cations migrate across themembrane—a process the investigatorsfollow by measuring the flux of a phenol
probe molecule. One method of control-ling the rate and direction of flow is tochange the magnitude and sign of theapplied transmembrane current; anothermethod is the reversible change that fol-lows from varying the solution’s pH.For example, the team observed no EOFin the presence of a pH 3.5 buffer, butrestored the flow with a pH 7.2 buffer.Electrochemical derivatization of the
nanotube walls also affected the EOF.Carboxylate groups enhance anionicsurface charge density and increase theEOF, but ammonium ions reverse theflow’s direction. In addition, applying anegative potential to a membrane in anelectrolyte solution induces an excessnegative surface charge and vice versa.This potentiostatic charging is particular-ly promising because CNMs, like gold,are electronically conductive. (J. Am.Chem. Soc. 2001, 123, 12,335–12,342)
(b)
(a)
(a) Parallel arrays of nanotubes are held to-gether within a membrane by a carbon sur-face film. (b) Individual nanotubes removedfrom a membrane expose branches of smallerdiameter.
CCNNMMss——NNeeww cchheemmiiccaallllyy sseelleeccttiivvee ffiilltteerrss??
A new way of probing moleculardynamics on metal surfaces hasstirred some excitement. GiladHaran and Amir Weiss at theWeizmann Institute of Science(Israel) use time-dependent, sin-gle-molecule surface-enhancedRaman scattering (SERS) to probemolecular surface dynamics.The researchers generated
SERS spectra of single rhodamine6G molecules adsorbed on silvernanocrystals on a time scale ofseconds. Large spectral fluctuationswere observed, especially in thecase of vibrational bands at 614and 774 cm–1, yet the overallspectral position of these bands
remained unchanged.Haran and Weiss suggest that the time
scale of these fluctuations depends on thepower of illumination and on electrolyteconcentration. The most likely mechanismleading to this behavior, they say, involveslateral motion of the adsorbed molecule.The spectral fluctuations are due to mod -ulation of the charge-transfer contributionthrough lateral diffusion of the Ram anscattering molecule, they add. The re-searchers show that the rate of spectralfluctuations depends linearly on laser in-tensity and on the anion concentration inthe solution on top of the silver colloids.The researchers say their single mole-
cule study offers a new view of the charge-transfer process in Raman scattering en-hancement at metal surfaces. It alsosuggests how single-molecule SERScan be used to investigate surfaceprocesses with very high spatial res -olution under ambient conditions.(J. Phys. Chem. B 2001, 105, 12,348–12,354)
Time-dependent spectral trajectory of asingle rhodamine 6G molecule illuminat-ed with 10 W/cm2 laser power. Strongfluctuations of the bands at 614 and774 cm–1 are clearly evident.
DDyynnaammiicc pprroobbiinngg ooff mmeettaall ssuurrffaacceess
100
200
300
400
500
600
2
1.8
1.6
1.4
1.2
1
0.8
0.6
0.4
0.2
Time (seconds)
Raman shift (cm–1)500 1000 1500
Intensity scale
F E B R U A R Y 1 , 2 0 0 2 / A N A LY T I C A L C H E M I S T R Y 6 3 A
n ews
There’s a lot to like about near-IR spec-troscopy (NIRS). Now, M. Blanco andM. A. Romero from the UniversitatAutónoma de Barcelona (Spain) give usone more reason. They propose a gen-eral method for constructing NIRS li-braries and using them to identify phar-maceutically active compounds.Methods like LC or MS are expen-
sive because a skilled scientist must setup various individualized methods andinterpret the results. But a single, inex-pensive, automated NIRS method can
analyze huge numbers of compoundsonce a comparative “fingerprint” libraryhas been established to meet a project’sneeds. Diffuse reflectance NIRS solidscan even be used to analyze solids.The researchers demonstrate their
method by constructing a library ofNIRS spectra for 125 different raw ma-terials and examining various situations.NIR spectra are analyzed using patternrecognition methods to create parame-ters like correlation coefficients. Becausethis parameter is defined by only a few
spectra, it is helpful for quickly devel-oping a library. The researchers alsodemonstrate the potential for fine dis-tinction between samples that appearambiguous to the general library. By an-alyzing for additional parameters, theresearchers derived three sublibrariesthat distinguished between particle sizesof five kinds of sugar, chiral enantiomersof ketoprofen, and mixed amorphousand crystalline complexes of diacetyl -midecamycin. (Analyst 2001, 126,2212–2217)
NNIIRRSS iiss ggrreeaatt ffoorr lliibbrraarriieess
Researchers have identified amyloid-�
(A�) polypeptides as possible biomarkers
for Alzheimer’s disease (AD). Now, Nigel
Clarke, Frank Crow, and their colleagues at
the Mayo Clinics in Rochester, Minn. and
Jacksonville, Fla. report a single-step
assay for these compounds in cells and
cell lysates for which analysis has been
difficult because of low concentrations and
possible cross-reactions within the lysate.
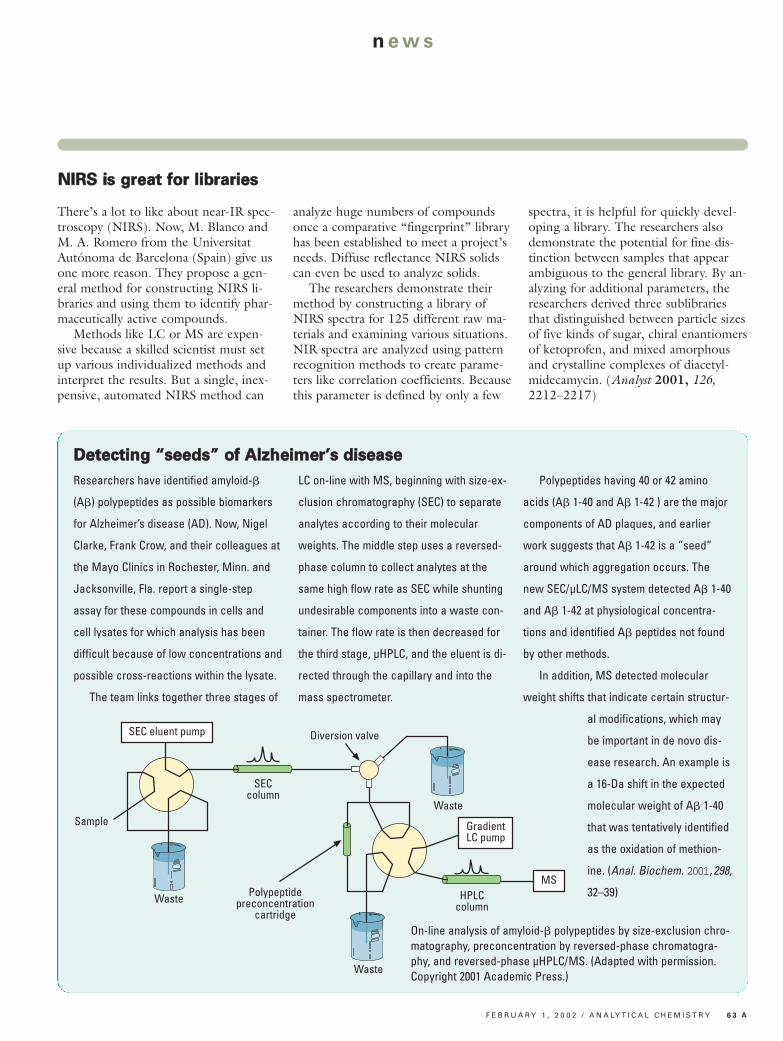
The team links together three stages of
LC on-line with MS, beginning with size-ex-
clusion chromatography (SEC) to separate
analytes according to their molecular
weights. The middle step uses a reversed-
phase column to collect analytes at the
same high flow rate as SEC while shunting
undesirable components into a waste con-
tainer. The flow rate is then decreased for
the third stage, µHPLC, and the eluent is di-
rected through the capillary and into the
mass spectrometer.
Polypeptides having 40 or 42 amino
acids (A� 1-40 and A� 1-42 ) are the major
components of AD plaques, and earlier
work suggests that A� 1-42 is a “seed”
around which aggregation occurs. The
new SEC/µLC/MS system detected A� 1-40
and A� 1-42 at physiological concentra-
tions and identified A� peptides not found
by other methods.
In addition, MS detected molecular
weight shifts that indicate certain structur-
al modifications, which may
be important in de novo dis-
ease research. An example is
a 16-Da shift in the expected
molecular weight of A� 1-40
that was tentatively identified
as the oxidation of methion-
ine. (Anal. Biochem. 2001,298,
32–39)
Sample
Waste
Waste
Waste
Diversion valve
SECcolumn
Polypeptidepreconcentration
cartridge
HPLCcolumn
MS
SEC eluent pump
GradientLC pump
On-line analysis of amyloid-� polypeptides by size-exclusion chro-matography, preconcentration by reversed-phase chromatogra-phy, and reversed-phase µHPLC/MS. (Adapted with permission.Copyright 2001 Academic Press.)
DDeetteeccttiinngg ““sseeeeddss”” ooff AAllzzhheeiimmeerr’’ss ddiisseeaassee

6 4 A A N A LY T I C A L C H E M I S T R Y / F E B R U A R Y 1 , 2 0 0 2
news
RESEARCH PROFILES
You probably wouldn’t expect an assayfor studying biomolecular interactionsto have its roots in ancient Rome. Youespecially wouldn’t expect it of a label-free, real-time assay that is conductedon chips. But that is the case for a newmethod developed by Ashutosh Chilkotiand Nidhi Nath at Duke University andreported in this issue ofAnalytical Chemistry (pp504–509). The method relies on the
same phenomenon that givescolloidal solutions of noblemetals their intense colors.Known as colloidal surfaceplasmon resonance (SPR), orplasmon absorbance, this ef-fect occurs in metal particles~10–100 nm in diameter. Atthat scale, light can directlyinduce oscillations of the particles’ surface electrons,which will then absorb elec-tromagnetic radiation at aparticular wavelength. EarlyRomans exploited this effectto make vibrantly colored“ruby” glass, which containedgold particles of exactly theright size.Chilkoti and Nath didn’t
know about this ancient lineage at first.They were interested in conventionalSPR, in which the plasmons, or chargedensity waves, are excited indirectly. Inparticular, the researchers wanted to finda way to make SPR similar to DNA mi-croarrays, which can have tens of thou-sands of elements. “It’s always in the back of my mind:
How could we improve [SPR]?” Chilkotisays. “And how could you do it in anarray format?” Other researchers haveused a variant called SPR imaging to an-alyze arrays, but so far, such assays havebeen on a small scale.An important step for analyzing
large-scale arrays would be to performSPR on surfaces rather than in solution,Chilkoti and Nath decided. From papers
by Michael Natan, they learned to makean optically transparent monolayer fromself-assembled gold colloids on a func-tionalized glass surface. Thus, they hadchips. Soon after, Chilkoti and Nath dis-covered that Takayuki Okamoto’s grouphad determined that the absorbance ofsuch a colloidal gold monolayer was
sensitive to changes in the surroundingsolvent. This was colloidal SPR at work.Another crucial step would be to use
colloidal gold for biological assays. Otherresearchers have used color changes dueto the aggregation of gold colloids toidentify single-base mismatches in DNAand used changes in the peak intensityand position of the plasmon absorbanceto denote the binding of biomoleculeson the surface of a colloid. However,those assays were performed in solution.To Chilkoti, the next logical step was
using self-assembled gold colloids on chipsto perform colloidal SPR. It surprised himthat nobody had done so yet. “I guess itwas our role to make the leap and to justtry it,” he says.The researchers fabricated their chips
and tested them by following the kineticsof fibrinogen adsorption using a UV–visspectrophotometer. In later experiments,the researchers attached a biotin deriva-tive to the chip’s surface and followedthe binding of either an anti-biotin anti-body or streptavidin. The resulting curvesclearly distinguished the tight binding of
streptavidin from the bindingand gradual dissociation of theantibody.The researchers obtained a
detection limit of ~1 µg/mLof streptavidin (~16 nM) anda dynamic range of ~1–30µg/mL. At the moment, themethod is less sensitive thanconventional SPR, Chilkotinotes. He considers themethod a quick screeningtool, complementary to con-ventional SPR.Although the researchers
did not conduct an arraystudy, they demonstrated theprinciple by replacing thespectrophotometer with acolor scanner, which couldimage an entire array. Scan-ning distinguished betweendifferent stages of functional-ization and varying concen-
trations of adsorbed fibrinogen.Chilkoti notes with satisfaction that
the detection for the new assay could beperformed on a commercially availablespectrophotometer or scanner. That ispossible because the colloidal SPR effectshows up as a change in absorbance.Conventional SPR, on the other hand,is measured as a change in reflectivity,which requires a more complicated opti-cal setup and, thus, an instrument dedi-cated to that purpose, he explains.“One of the motivations we have is
to use simple methods as far as possible,”Chilkoti says. It seems fitting, doesn’t it,that this quest for simplicity led the re-searchers to a technique practiced byancient Roman craftsmen? a
——EElliizzaabbeetthh ZZuubbrriittsskkyy
Fabrication protocol(a)
1
Glass
2 3
SilaneSAM
AuCM AuCM - MPA Biotin-functionalizedAuCM - MPA
Wavelength (nm)
Abso
rban
ce
0.20
0.15
0.10
0.05
0.00
300 400 500 600 700 800 900
After protein bindingBefore protein binding
Detection protocol(b)
Light
(a) Schematic representing the fabrication of the immobilized colloidalgold sensor chip. (b) Binding of a biomolecule results in a shift in thepeak wavelength and an increase in the intensity of the absorbance.
AA ccoolloorriimmeettrriicc aassssaayy ffoorr tthhee aaggeess

F E B R U A R Y 1 , 2 0 0 2 / A N A LY T I C A L C H E M I S T R Y 6 5 A
n ews
Genetic fingerprinting can place a sus-pect at a crime scene or identify a par-ticular strain of bacteria, but getting thetest results can take up to 48 h. Themajority of that time is spent separatinglarge strands of DNA, because mostseparation schemes use polymeric gels.Entropic trap arraysetched into silicon haveshown promise as DNAsieving devices in auto-mated instrumental detec-tion schemes—situationswhere gels degrade after afew uses and are difficultto fabricate reproducibly.The silicon structures havea much more open struc-ture, and fabrication andpore-size distributionsin these silicon “gels”are much more easily controlled.In the January 15 issue
of Analytical Chemistry(pp 394–401), JongyoonHan and Harold Craig-head at Cornell Universitydescribe fine-tuning themicroscopic dimensions oftheir entropic trap arrayobstacle courses to opti-mize separations of DNA. They reportrun times of just 30 min for double-stranded, 200-kilobase-pair DNA frag-ments using this small, rugged device.The entropic trap array is a series of
channels, 30 µm wide and 1.5 cm long,etched in a silicon substrate using stan-dard photolithography techniques capa-ble of 1-µm resolution. A cross-sectiondown the long axis of the channel de-scribes a symmetrical square wave—theamplitude (well depth) and spatial peri-od (width of a well plus that of a wall)were optimized in this report. Once thetop glass cover is bonded in place, thechannel is filled with a buffer solution.The result is a series of wells separatedby barriers just high enough to form agap of 75–100 nm below the top cover.
When a dc voltage is applied downthe length of the channel, electric fieldstrengths in the shallow regions are verylarge, yet nearly negligible in the deepregions. The ratio of the electric fieldstrengths in deep and shallow regions iscontrolled by their relative depths. The
result is a standing electrical squarewave, where the high electric field, ca-pable of elongating DNA, is prevalentonly at the constrictions in the device.In solution, DNA without its protec-
tive protein coat forms a random coil—a loose, nebulous, globule resemblinga very long, gossamer thread loopedaround on itself. Historically, the ran-dom coil has been thought of as aspherical ball in solution. But Han says,“It’s not a ball. It’s a string, and canchange its shape easily.”If a molecule is relatively large, “it
has more conformational states availableto it,” says Craighead. Loops of DNAfluctuate into the barrier region; drivenby thermal and Brownian effects, theyare dragged further into the gap by the
high electrostatic field present there.When enough loops enter the gap, thewhole coil gets a boost over the barrier.Once started into the gap, the rate
at which DNA traverses the gap is thesame for all sizes of globular DNA mol-ecules and depends on the average dc
field applied to the device.Diffusion between barriersis similarly independent ofDNA length. The selectiv-ity comes from the differ-ence in time it takes eachlong and short DNA inrandom coils to enter theentropic barrier regionfrom a deep well, and thisdepends on the entropy ofeach coil. Optimizing theselectivity of the DNAseparation means tweak -ing the entropic term.“We do that by changingthe depths of the wells,”says Craighead.Deep wells must be at
least 2 µm wide to accom-modate DNA in the glob-ular form. “I want to keepthe DNA as spherical aspossible, to get the maxi-mum entropic hindrance
effect,” says Han. If the wells are toowide, then you must have more barriersand longer arrays to do the same separa-tion. If the wells are too narrow, DNAdoes not resume the random coil beforethe next barrier, and the entropic hin-drance effect is lost.Entropic trap arrays can be fabricated
reproducibly and reused thousands oftimes. Their small sizes reduce samplesize requirements. DNA is easily recov-ered from them, making a fine fit for in-corporation into an instrument-basedanalysis system for DNA screening.Once the design is optimized, “all youneed to do is set the dc field, insert theDNA, and forget about it—[whichmeans] less knob-turning,” says Han. a
——ZZeellddaa ZZiieegglleerr
Turning up the spatial frequency of wells and walls also changes the frequency of the standing electrical pulse train.
TTwweeaakkiinngg eennttrrooppyy’’ss eeddggee
6 6 A A N A LY T I C A L C H E M I S T R Y / F E B R U A R Y 1 , 2 0 0 2
news
RESEARCH PROFILES
Sometimes we don’t recognize themany facets of a chemical until it doesdamage. Such is the case with some pes-ticides and pharmaceuticals that seem tobe acting as endocrine disruptors, evenat low levels in the environment. Shu-nitz Tanaka, Hideki Kuramitz, and re-searchers at Hokkaido University,Gunma University, and Hokkai-do College of Pharmacy (all inJapan) describe a method to elec-trochemically evaluate the inter-action of endocrine-disruptingchemicals (EDCs) and estrogenreceptors (ERs) in this issue ofAnalytical Chemistry (pp 533–538). Although a number ofcompetitive binding assays havebeen developed to examine various ER–ligand interactions,screening the binding capacitiesof EDCs with electrochemicaltechniques has not been previ-ously reported.Increasing incidences of hor-
mone-dependent cancers and re-productive disorders in humansand wildlife have been blamed onanthropogenic EDCs, such ascrop pesticides, plastic additives,and synthetic hormones or theirmetabolites. EDCs mimic orblock natural estrogen activitieswhen they bind to an ER. Envi-ronmental groups are now lobbyingpolicymakers and chemical industries invarious countries to screen these contro-versial and risky chemicals and possiblyphase them out of production and use.As electrochemists and pharmacolo-
gists, Tanaka and colleagues have beenstudying competitive protein–ligand in-teractions for the last decade. After they“exhaustively investigated” model systemslike avidin–biotin and lectin–sugar, theywanted to “apply this electrochemicalmethod to a more practical field,” saysTanaka, a professor and electroanalyticalchemist at Hokkaido University. So theresearchers tried their method in a recep-tor-based assay for screening the EDCs,
which fit with their growing interest inpractical and environmental applications.Unlike previous protein–ligand system
assays, the electrochemical method doesnot depend on dangerous radioactivity la-beling nor does it require washing or sep-aration steps. Because many EDCs do nothave strong binding affinities to the ER,
the results could be significantly altered bywashing and separation procedures. In thenew assay, protein–ligand interactions canbe evaluated simply by the monitoringchanges in the electrode response to freeligand—in this case, 17�-estradiol— labeled with an electroactive compound.The researchers used this protein–
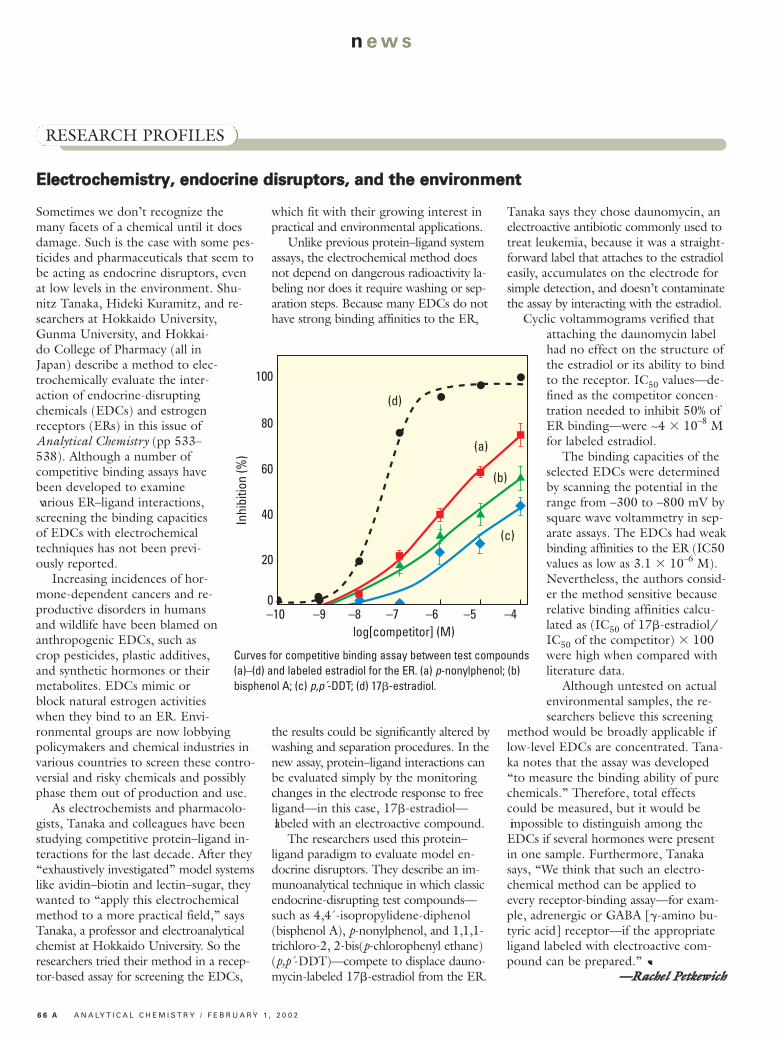
ligand paradigm to evaluate model en-docrine disruptors. They describe an im-munoanalytical technique in which classicendocrine-disrupting test compounds—such as 4,4´-isopropylidene-diphenol(bisphenol A), p-nonylphenol, and 1,1,1-trichloro-2, 2-bis(p-chlorophenyl ethane)(p,p´-DDT)—compete to displace dauno-mycin-labeled 17�-estradiol from the ER.
Tanaka says they chose daunomycin, anelectroactive antibiotic commonly used totreat leukemia, because it was a straight-forward label that attaches to the estradioleasily, accumulates on the electrode forsimple detection, and doesn’t contaminatethe assay by interacting with the estradiol.Cyclic voltammograms verified that
attaching the daunomycin labelhad no effect on the structure ofthe estradiol or its ability to bindto the receptor. IC50 values—de-fined as the competitor concen-tration needed to inhibit 50% ofER binding—were ~4 � 10–8 Mfor labeled estradiol.The binding capacities of the
selected EDCs were determinedby scanning the potential in therange from –300 to –800 mV bysquare wave voltammetry in sep-arate assays. The EDCs had weakbinding affinities to the ER (IC50values as low as 3.1 � 10–6 M).Nevertheless, the authors consid-er the method sensitive becauserelative binding affinities calcu-lated as (IC50 of 17�-estradiol/IC50 of the competitor) � 100were high when compared withliterature data.Although untested on actual
environmental samples, the re-searchers believe this screening
method would be broadly applicable iflow-level EDCs are concentrated. Tana-ka notes that the assay was developed“to measure the binding ability of purechemicals.” Therefore, total effectscould be measured, but it would be impossible to distinguish among theEDCs if several hormones were presentin one sample. Furthermore, Tanakasays, “We think that such an electro-chemical method can be applied toevery receptor-binding assay—for exam-ple, adrenergic or GABA [�-amino bu-tyric acid] receptor—if the appropriateligand labeled with electroactive com-pound can be prepared.” a
——RRaacchheell PPeettkkeewwiicchh
log[competitor] (M)
Inhi
bitio
n (%
)
–10
100
80
60
40
20
0–9 –8 –7 –6 –5 –4
(d)
(a)
(b)
(c)
Curves for competitive binding assay between test compounds(a)–(d) and labeled estradiol for the ER. (a) p-nonylphenol; (b)bisphenol A; (c) p,p´-DDT; (d) 17�-estradiol.
EElleeccttrroocchheemmiissttrryy,, eennddooccrriinnee ddiissrruuppttoorrss,, aanndd tthhee eennvviirroonnmmeenntt
F E B R U A R Y 1 , 2 0 0 2 / A N A LY T I C A L C H E M I S T R Y 6 7 A
n ews
GOVERNMENT AND SOCIETY
In September of last year, the Food Safe-ty and Inspection Service (FSIS) of theU.S. Department of Agriculture andAOAC International (formerly the Asso-ciation of Official Analytical Chemists)reached agreement on a plan to developand establish an online database of stan-dard analytical methods for food safetylaboratories. According toAOAC, a prototype of thedatabase is expected to beunveiled in June, thentested for two years withthe hope that the systemwill be fully implementedby September 2004.The database is part of
a major effort in the Unit-ed States to address con-cerns about the safety ofthe food supply and thelack of validated methodsto test for contaminantsand pathogens. Publicconcern over the foodsupply has been growingin the past five years, fueled by outbreaks ofE. coli contamination inmeat in the 1990s that re-sulted in several deaths.The Centers for DiseaseControl and Prevention estimate that73,000 cases of E. coli infection and 61deaths from such infections occur annu-ally in the United States. More recently,the public also began to fear terrorist at-tacks using biological agents. In 1997,President Clinton launched a food safe-ty initiative to improve monitoring ofthe nation’s food supply.The online analytical laboratory
methods database will ultimately besearchable by matrix, category, instru-mentation/technology, or analyte. “Weenvision a user-friendly, interactive, flex-ible, Web-accessible database that willalso include discussion groups, as well aslinks to suppliers of instruments, reagents,reference materials, contract services,and proficiency testing,” says Krystyna
McIver, who is overseeing the design ofthe analytical laboratory methods data-base for AOAC. “We anticipate hundredsand eventually thousands of methodsbeing stored in the database.”The database methods will also con-
form to International Organization forStandardization (ISO) 17025 guide-
lines. “ISO 17025 is being used as agold standard for the food safety testinglaboratories because it is the laboratorystandard that is used in the most forums,including internationally,” says RalphStafko, director of federal, state, andlocal government relations at FSIS. Ad-hering to ISO guidelines could renderthis database useful to food chemistsworldwide.William Krueger, director of laborato-
ry services at the Minnesota Departmentof Agriculture, says that the new onlinedatabase is “the third leg of a stool”being built by National Food Safety Sys-tem (NFSS). NFSS is a federally fundedintergovernmental working group formedin 1998 to develop a national communi-cation structure among all the federal,
state, and local food safety laboratoriesin the United States. The first leg of thestool was the creation of an accredita-tion system for the government foodsafety laboratories based on ISO 17025.“The U.S. Army’s food safety testinglaboratories are already accredited, whilethe FSIS, FDA, and other NFSS pilot
laboratories are currently50–99% prepared for ISO17025 accreditation,” re-ports Krueger.“Food safety laboratory
standards are the secondleg of the stool,” althoughnone exists yet, addsKrueger. In 1999, NFSSrolled out the computerdatabase eLEXNET, whichis a repository for govern-ment laboratory data onpathogens in food. Al-though eLEXNET wasstarted as a repository forinformation about E. coli0157:H7, the database isbeing expanded to coverdata and laboratory meth-ods for the food-bornepathogens Salmonella,Listeria monocytogenes,and Campylobacter, says
Stafko. “The electronic data will be help-ful to food safety laboratories to providerapid responses to food poisoning out-breaks, as well as additional regulatoryand public health concerns,” says Stafko.However, according to Krueger, 80% ofthe data currently in eLEXNET comefrom laboratory methods that are notvalidated.All of the laboratory methods en-
tered into the new methods databasewill undergo some review or validationby AOAC. Adds Anita Mishra-Szymans-ki, managing director of the AOAC’sOfficial Methods/Peer Verified Meth-ods Program, “We hope to provide anorder to the current chaos of analyticallaboratory methods.” a
——LLaauurraa RRuutthh
SSttaannddaarrddiizziinngg ffoooodd aannaallyyssiiss
PH
OTO
DIS
C
6 8 A A N A LY T I C A L C H E M I S T R Y / F E B R U A R Y 1 , 2 0 0 2
news
PEOPLE
David Nelson willreceive the first an-nual Pittcon Her-itage Award, jointlysponsored by thePittsburgh Confer-ence on AnalyticalChemistry and Ap-
plied Spectroscopy and the ChemicalHeritage Foundation. The award recog-nizes individual achievement in entre-preneurial careers that have shaped theinstrumentation community, inspiredachievement, promoted public under-standing of the modern instrumentationsciences, and highlighted the role of an-alytical chemistry in world economies.Nelson started his career at Beckman
Instruments, before moving to Cary In-struments where he became presidentin 1968. He joined Hewlett-Packard in1973 as the marketing manager for ana-lytical products and then launched Nel-
son Analytical, Inc., in 1980. Nelson re-tired in 1991 and now runs his own con-sulting company, Nelson Consulting. Theaward will be presented at the upcomingPittcon meeting in New Orleans, La.
DDaavviidd NNeellssoonn rreecceeiivveess PPiittttccoonn HHeerriittaaggee AAwwaarrdd
The Society for Analytical Chemists of
Pittsburgh (SACP) is accepting nominees
for the 23rd Annual Analytical Chemistry
Starter Grant Award. The $20,000 grant
recognizes an assistant professor’s dedi-
cation to high-quality, innovative research
in the analytical field. Nominees who
have accepted an appointment since De-
cember 31, 1998, at a U.S. college or uni-
versity are eligible. Applications must be
received by February 28; the winner will
be announced by May 1. For more infor-
mation, contact Fu-mei C. Lin at 800-825-
3221, ext. 204; fax 412-825-3224.
SSAACCPP 22000022 SSttaarrtteerr GGrraanntt AAwwaarrdd
CALTECH POSTDOCTORALSCHOLARS POSITION AT JPLThe California Institute of Technology (Caltech) PostdoctoralScholars Program at the Jet Propulsion Laboratory (JPL) is invit-ing applicants to apply for two or more positions in its Earth andSpace Sciences Division’s Spectroscopy and Detector DevelopmentLaboratory to carry out programs of research in the areas of ana-lytical chemistry and instrument development relevant to NASA’ssolar system exploration missions. Research topics will include de-veloping and demonstrating feasibility of miniature in-situ instru-ments and detection techniques such as ion-trap mass spectroscopy,ion mobility spectroscopy, and sample introduction methods suchas laser ablation and microwave heating techniques.
Appointment is contingent upon evidence of completion of Ph. D.degree. Participation in the program by foreign nationals (exceptU. S. Permanent Residents) must be approved by the National Aero-nautics and Space Administration (NASA) to work at JPL. Annualstarting salary for a new Ph. D. is approximately $45,000 and canvary somewhat according to the applicant’s qualifications. Postdoc-toral scholars are awarded initially for a one-year period which maybe renewed in one-year increments to a three-year maximum. Pleasesend curriculum vitae, statement of research interests and a list ofthree references to Dr. Isik Kanik at the address below:
MS 183-601Jet Propulsion Laboratory4800 Oak Grove DrivePasadena, CA 91109Fax: (818) 393-4605
E-mail: [email protected]
The California Institute of Technology and the Jet Propulsion Laboratoryare Equal Opportunity/Affirmative Action Employers. Women,
minorities, veterans, and disabled persons are encouraged to apply.