analyst day - perionfocus for 2016 are: • innovate and launch new cross screen high-impact ad...
TRANSCRIPT

1
ANALYST DAY
DECEMBER 31, 2015

This presentation contains historical information and forward-looking statements within the meaning of The Private Securities Litigation Reform Act of 1995 with respect to the business, financial condition and results of operations of Perion. The words “will”, “believe,” “expect,” “intend,” “plan,” “should” and similar expressions are intended to identify forward-looking statements. Such statements reflect the current views, assumptions and expectations of Perion with respect to future events and are subject to risks and uncertainties. Many factors could cause the actual results, performance or achievements of Perion to be materially different from any future results, performance or achievements that may be expressed or implied by such forward-looking statements, or financial information, including, among others, the failure to realize the anticipated benefits of companies and businesses we acquired and may acquire in the future, risks entailed in integrating the companies and businesses we acquire, including employee retention and customer acceptance; the risk that such transactions will divert management and other resources from the ongoing operations of the business or otherwise disrupt the conduct of those businesses, potential litigation associated with such transactions, and general risks associated with the business of Perion including intense and frequent changes in the markets in which the businesses operate and in general economic and business conditions, loss of key customers, unpredictable sales cycles, competitive pressures, market acceptance of new products, inability to meet efficiency and cost reduction objectives, changes in business strategy and various other factors, whether referenced or not referenced in this presentation . Various other risks and uncertainties may affect Perion and its results of operations, as described in reports filed by the Company with the Securities and Exchange Commission from time to time, including its annual report on Form 20-F for the year ended December 31, 2014 filed with the SEC on April 16, 2015. Perion does not assume any obligation to update these forward-looking statements..
FORWARD LOOKING STATEMENTS
Non-GAAP financial measures, including adjusted EBITDA, consist of GAAP financial measures adjusted to exclude acquisition related expenses, other non-recurring expenses, share-based compensation expenses, accretion and gain from the reversal of acquisition related contingent consideration, impairment of goodwill, amortization and impairment of acquired intangible assets and the related taxes thereon, as well as certain accounting entries under the business combination accounting rules that require us to recognize a legal performance obligation related to revenue arrangements of an acquired entity based on its fair value at the date of acquisition. The purpose of such adjustments is to give an indication of our performance exclusive of non-cash charges and other items that are considered by management to be outside of our core operating results. These non-GAAP measures are among the primary factors management uses in planning for and forecasting future periods. Furthermore, the non-GAAP measures are regularly used internally to understand, manage and evaluate our business and make operating decisions, and we believe that they are useful to investors as a consistent and comparable measure of the ongoing performance of our business. However, our non-GAAP financial measures are not meant to be considered in isolation or as a substitute for comparable GAAP measures, and should be read only in conjunction with our consolidated financial statements prepared in accordance with GAAP. Additionally, these non-GAAP financial measures may differ materially from the non-GAAP financial measures used by other companies.
NON-GAAP MEASURES

3
EXECUTIVE SUMMARY

US MARKET OPPORTUNITY
Offline Media Spend Online Media Spend
Direct Response$20B 16%
Brand$18B 42%
Brand$108B 84%
$128B $43B
Direct Response$25B 58%
US DIGITAL AD SPEND FOR BRAND
$14.8
$17.7
$21.2
$24.6
$28.0
$31.1
2012 2013 2014 2015 2016 2017
Brand 40% 42% 44% 46% 48% 50%
DR 60% 58% 56% 54% 52% 50%
Source: Kantar Media Intelligence, eMarketer
BRANDS ARE CLOSING
THE DIGITAL SPEND GAP
4
01

5
RICH MEDIA AD SPENDINGUNITED STATES, 2014-2018
VIDEO AD SPENDINGUNITED STATES, 2014-2018
Source: eMarketer, 2015 Source: eMarketer, 2015
02SPENDING ON BRAND-ORIENTED
FORMATS WILL NEARLY DOUBLE BY 2018

AND MOBILE AND PROGRAMMATIC
AD SPEND ARE GROWING AS WELL
US DISPLAY AD SPENDING SHARE, BY TYPE, 2011-2017 % OF TOTAL
Note: read as 28% of display-related spending was through RTB in 2013; numbers may not add up to 100% due to rounding. Source: MAGNA GLOBAL and eMarketer
03
$19.2
$30.5
$42.1
$50.8
$59.8
$0.00
$15.00
$30.00
$45.00
$60.00
$75.00
2014 2015 2016 2017 2018
MOBILE AD SPEND (BILLIONS) 2014-2017
6

7
Sharp rise in ad-block usage, particularly among males and younger demos –primarily on desktop
Mobile ad blocking still unfolding; iOS 9 built in ad blocking capability, still not set as a default
SOURCE: PAGEFAIR AND ADOBE
HOWEVER, AD BLOCKING IS ALSO GROWING AS CONSUMERS
ARE FED UP WITH POOR DIGITAL AD EXPERIENCES04
Travel Finance Local Lifestyle Business News Sports Ent. Adult Comics Tech Games
5% 10% 10% 10% 15% 15% 20% 20% 20% 25% 25% 30%
AD-BLOCK USAGE RATES, BY VERTICAL (GLOBAL)
DESKTOP AD-BLOCKER USERS (GLOBAL)

8
OUR STRATEGY TAKES INTO ACCOUNT
THESE TRENDS…

9
DELIVER HIGH-QUALITY, ENGAGING AND DATA-DRIVEN AD SOLUTIONS TO BRANDS AND PUBLISHERS.

10
HIGH-QUALITY AS
A DIFFERENTIATOR
1. Providing premium publishers
with high-impact ad formats
and search results
2. Engaging creative that delivers
superior results for brands
3. Dynamic data-driven technology
on social, mobile platforms
4. A commitment to outstanding
execution and service
5. Exclusive inventory
and branded search
% of brands/agencies that
agreed the following items are
important to high-quality
PREMIUM AD
PLACEMENT/
POSITION
VARIETY OF
DIGITAL
FORMATS
SCALABLE FORMATS
ACROSS MULTIPLE
PARTNERS
74% 71% 59%
Source: Independent Online Study; 1,193 Total Respondents (June 2015)

11
HIGH-QUALITY IS A LARGE
AND OWNABLE MARKET
MOBILE AD SPEND INCREASING FROM 42% IN 2015 TO 66% OF TOTAL AD SPEND IN 2018
NATIVE, HIGH-IMPACT, VIDEO CATEGORIES GROWING AT >30%
Global digital advertising spend
$255B
Growing from $72B in 2015
Growing from $170B in 2015
Source: eMarketer, 2018 Projections
Mobile ad spend
$169B
High-quality total addressable market
$13B

12
THE COMBINATION WITH
UNDERTONE ESTABLISHES
PERION AS THE MARKET
LEADER HIGH-IMPACT FORMATS
BRAND & AGENCY RELATIONSHIPS
CREATIVE INNOVATION
PROGRAMMATIC DIRECT
TECHNOLOGY
SOCIAL & MOBILE
MARKETING PLATFORM
MOBILE ENGAGEMENT
PLATFORM
DATA DRIVEN ANALYTICS
SOFTWARE PUBLISHER
MONETIZATION SOLUTIONS
CONTENT PUBLISHER
MONETIZATIONFORMATS

OUR THREE MAIN AREAS OF
FOCUS FOR 2016 ARE:
• Innovate and launch new cross screen high-impact ad formats
• Scale mobile/social acquisition platform with programmatic and fully managed options
• Launch programmatic high-impact private marketplace
• Invest in real-time dynamic creative optimization
1. New Formats
2. Engagement
3. Programmatic
• Continue to expand search based ad formats beyond downloads
• Grow engagement and optimization platform for content publishers cross device
• Develop/acquire non-traditional programmatic ad platform for content publishers
• Launch high-impact creative publishing platform
Build out unique first party data set to solidify differentiation13
PUBLISHERS ADVERTISERS

14

15
SEARCH REPRESENTS 50% OF TOTAL DIGITAL AD SPENDING -
AND GROWING
$82B $121B
2015 2018

OUR SEARCH
BUSINESS HAS
STABILIZED…
16
REVENUE HAS STABILIZED
-
20.0
40.0
60.0
80.0
100.0
120.0
Q1/14 Q2/14 Q3/14 Q4/14 Q1/15 Q2/15 Q3/15
Search monetization revenue ($M)
• New rev-share model provides more certainty and visibility
• Turnaround in Q3.15: sequential growth for the first time in six
quarters
• Double digit profitability
$129.2M revenue

… HOWEVER THE
INDUSTRY IS
STILL VOLATILE
17
NO PLACE FOR SMALL PLAYERS:
• Downloadable software market is shrinking,
leaving room only for big players such as Perion
• Perion has already proven its ability to execute
in this changing environment
• Additional policies and new changes in the
ecosystem:• Windows 10
• Chrome
• Ad blockers

18
OPPORTUNITIES FOR 2016: LEVERAGING OUR ASSETS
OPPORTUNITIES
1. Expanding our offering to new audiences
2. Expanding our offering to mobile
3. Enhancing our offering: new opportunities rising from Bing partnership (API feed, native ads)
1. Long term contract with Bing (until 2018) with very advantageous commercial terms
2. Proprietary technology
3. Publishers centric skill set
ASSETS

OUR NEW
TARGET
AUDIENCE:
CONTENT
PUBLISHERS
19
Premium content publishers covering:
USA | UK | Australia | France | Germany
Vertical markets including:
News & Media Art & entertaining
Health & LifeStyle

NONE OF THEM KNOWS HOW TO BALANCE THE NEED FOR
ENGAGEMENT AND MONETIZATION
• No connection between engagement & monetization tools
• No centralized view or use of data
• Optimizing single ad slots and not revenue per page/site
Market is flooded with single point tools, with very little connection, if any, between them
ANALYTICS, OPTIMIZATION, DATA, ETC.
Point
Solutions
ENGAGEMENTMONETIZATION
E
M
M
M
M
20

21
AND PUBLISHERS DON'T HAVE THE CAPACITY
TO LOOK BEYOND IMMEDIATE THREATS
• Majority of Publishers are still
focused on developing an adequate
digital/mobile solution as they are in
the war for survival
• Very few have been able to dedicate
sufficient resources to develop a
longer term strategy, or to tackle the
“next level” of challenges
Most Publisher are still struggling
with the “basics”
Most trending topics are all
immediate threats…
Ad Fraud
Ad Blockers
Viewability
Expanding file sizes of ads

22
WHICH ARE BEING ADDRESSED WITH
TOO MANY SINGLE POINT SOLUTIONS
Findings of CodeFuel’s research:
• On 125 sites reviewed, 375 unique vendors were identified
• Outside Google, Facebook & AppNexus, very few vendors
are commonly used
• Connections per site range between 20 to 100+
• Majority of vendors offer a single point solution
• Leading categories by number of connection per site:
Analytics (92 vendors), Networks (39 vendors), DSPs (46
vendors), Engagement (22 vendors)
Leading categories by % used by Publishers
99%
95%
87%
85%
85%
78%
77%
74%
64%
57%
54%
45%
45%
28%
20%
20%
12%
2%
Analytics
Network
DSP
Targeting
Engagement
Other
DMP
Exchange
Security
SSP
Platform
Content mkt.
Video
affiliate mkt
Optimization
Link
Network - Native
in-image advertising
# Avg. Connections
With no clear standard in the
market, point solutions vary
dramatically among publishers
23
=
Allow Publishers To Focus On What They
Do Best By Building Engagement &
Monetization Solutions Not ToolsTools = require extensive additional efforts by PublisherSolution = require limited efforts by Publisher
OUR VALUE PROPOSITION: MAKE THE
PUBLISHER'S LIFE SIMPLER

24
OUR SOLUTION

25
OUR SOLUTION

26
27
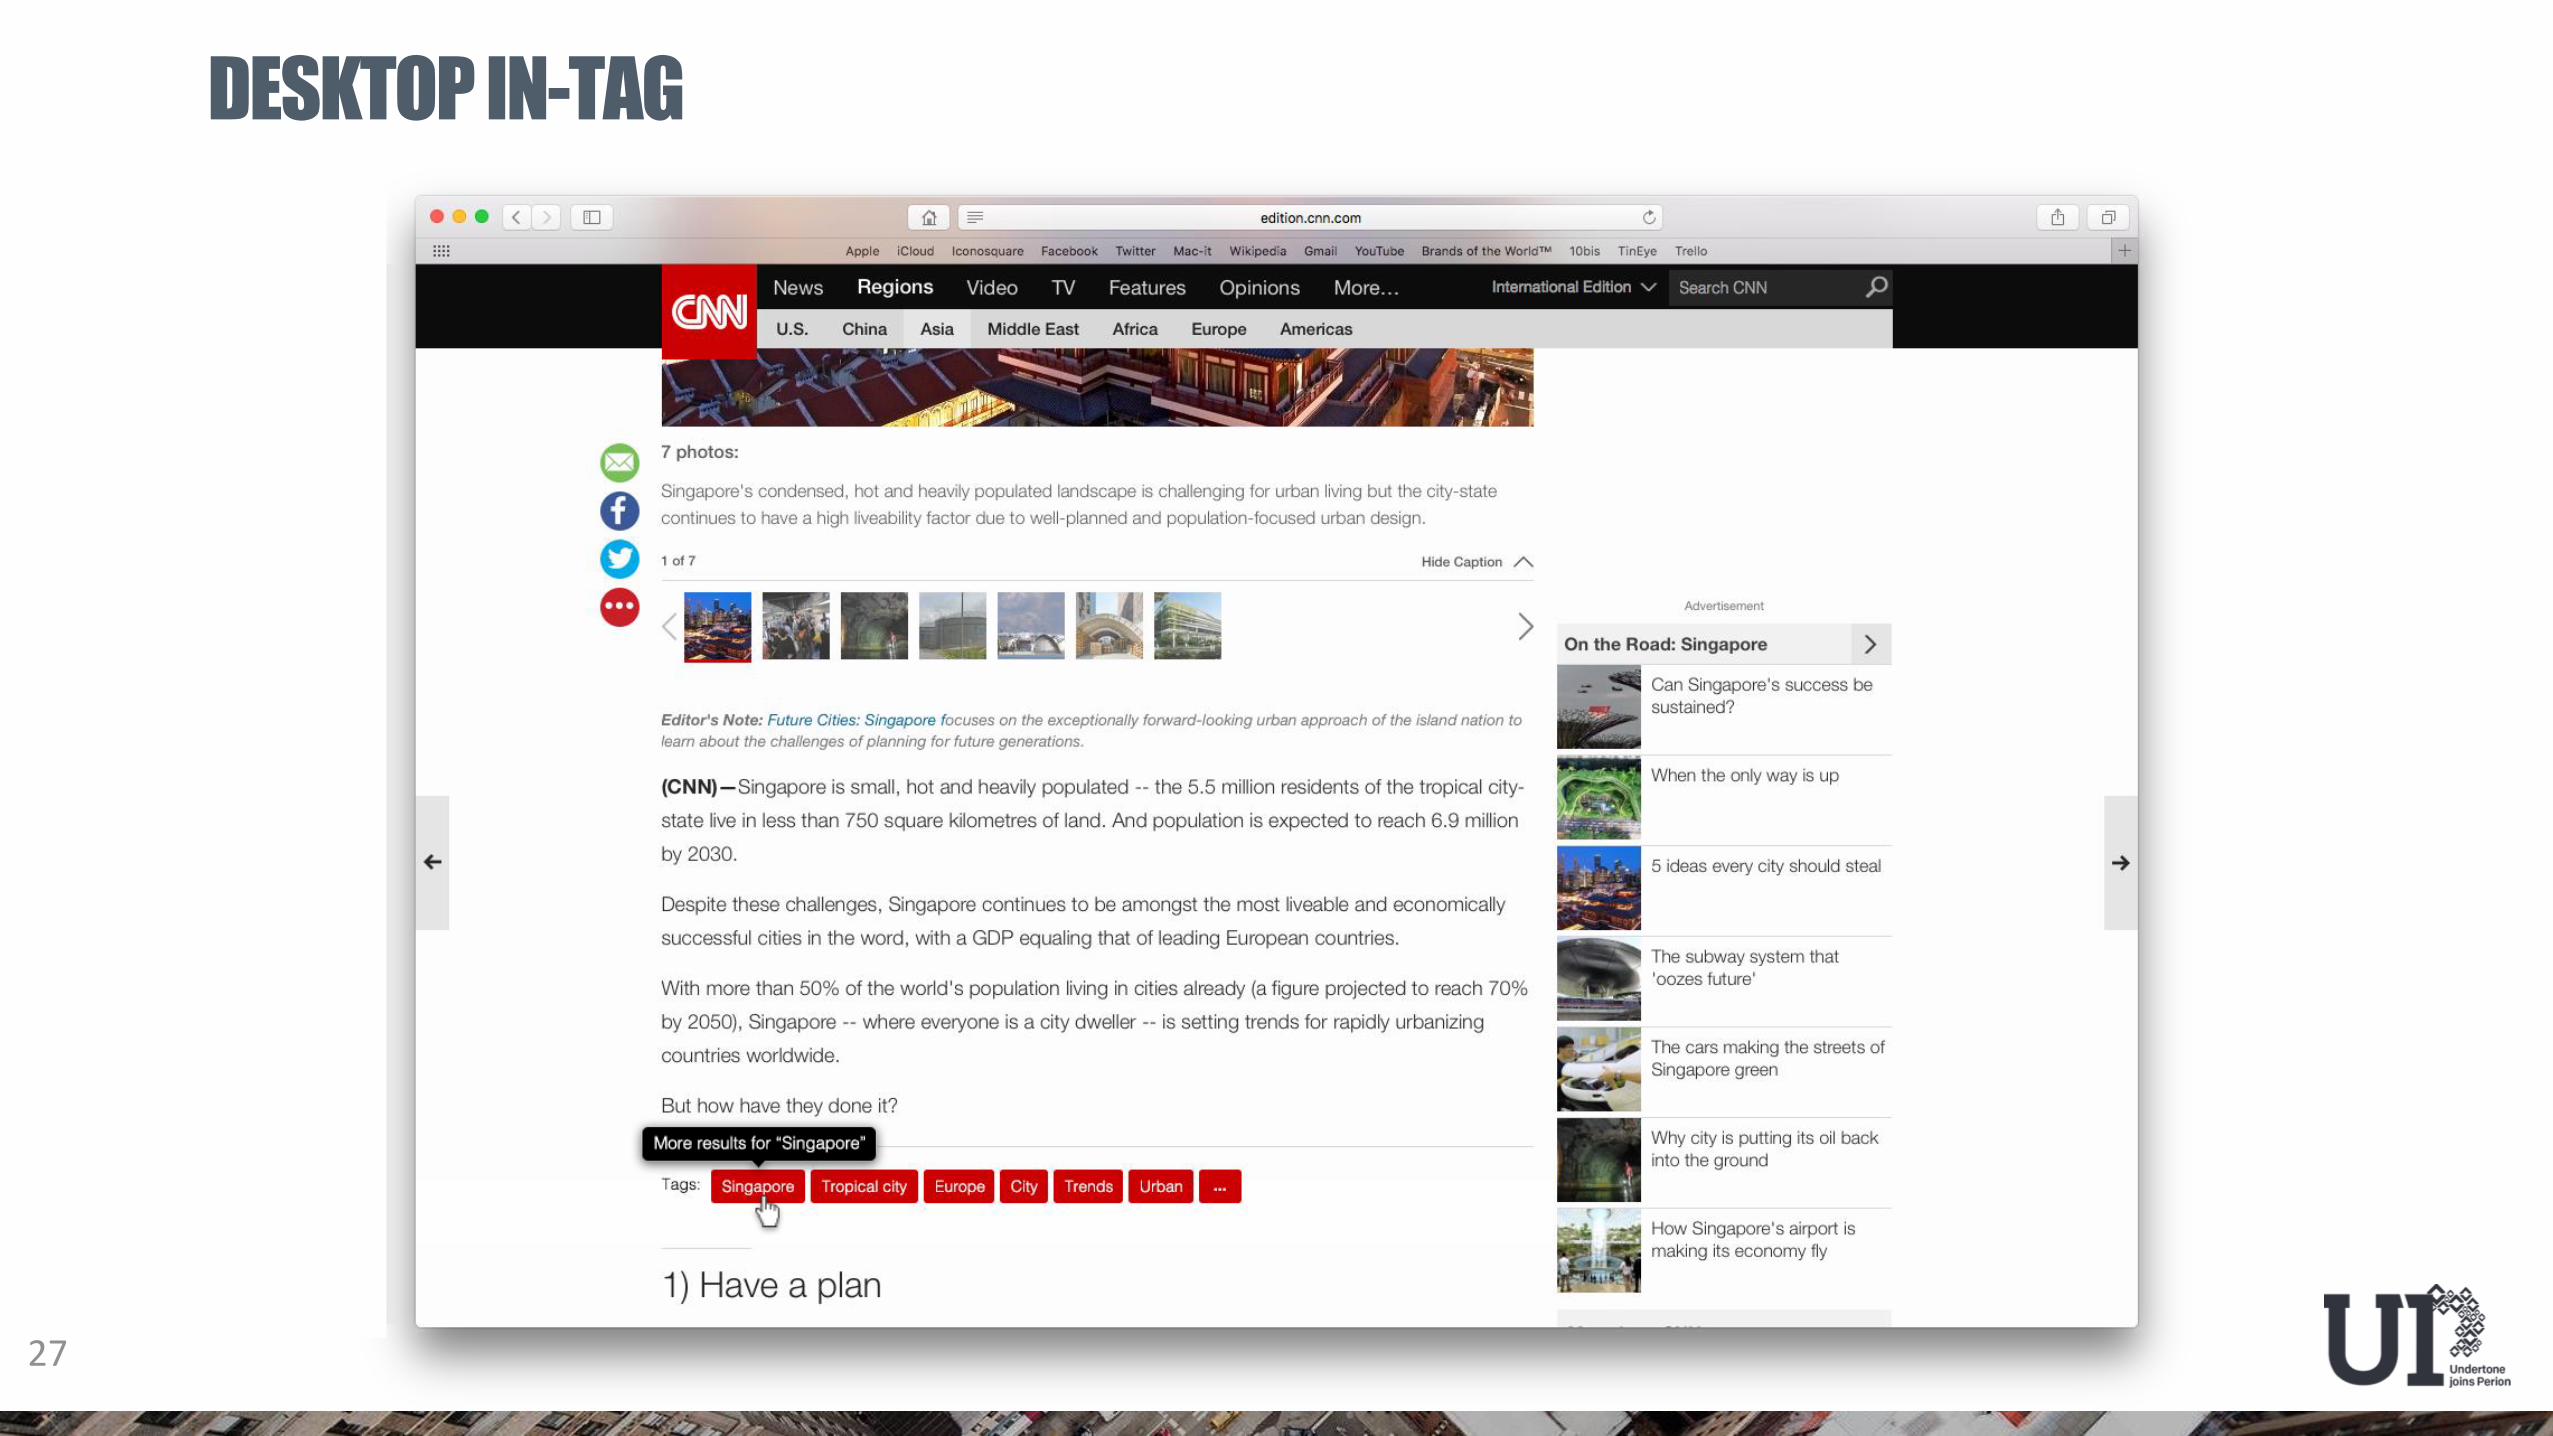
DESKTOP IN-TAG
28
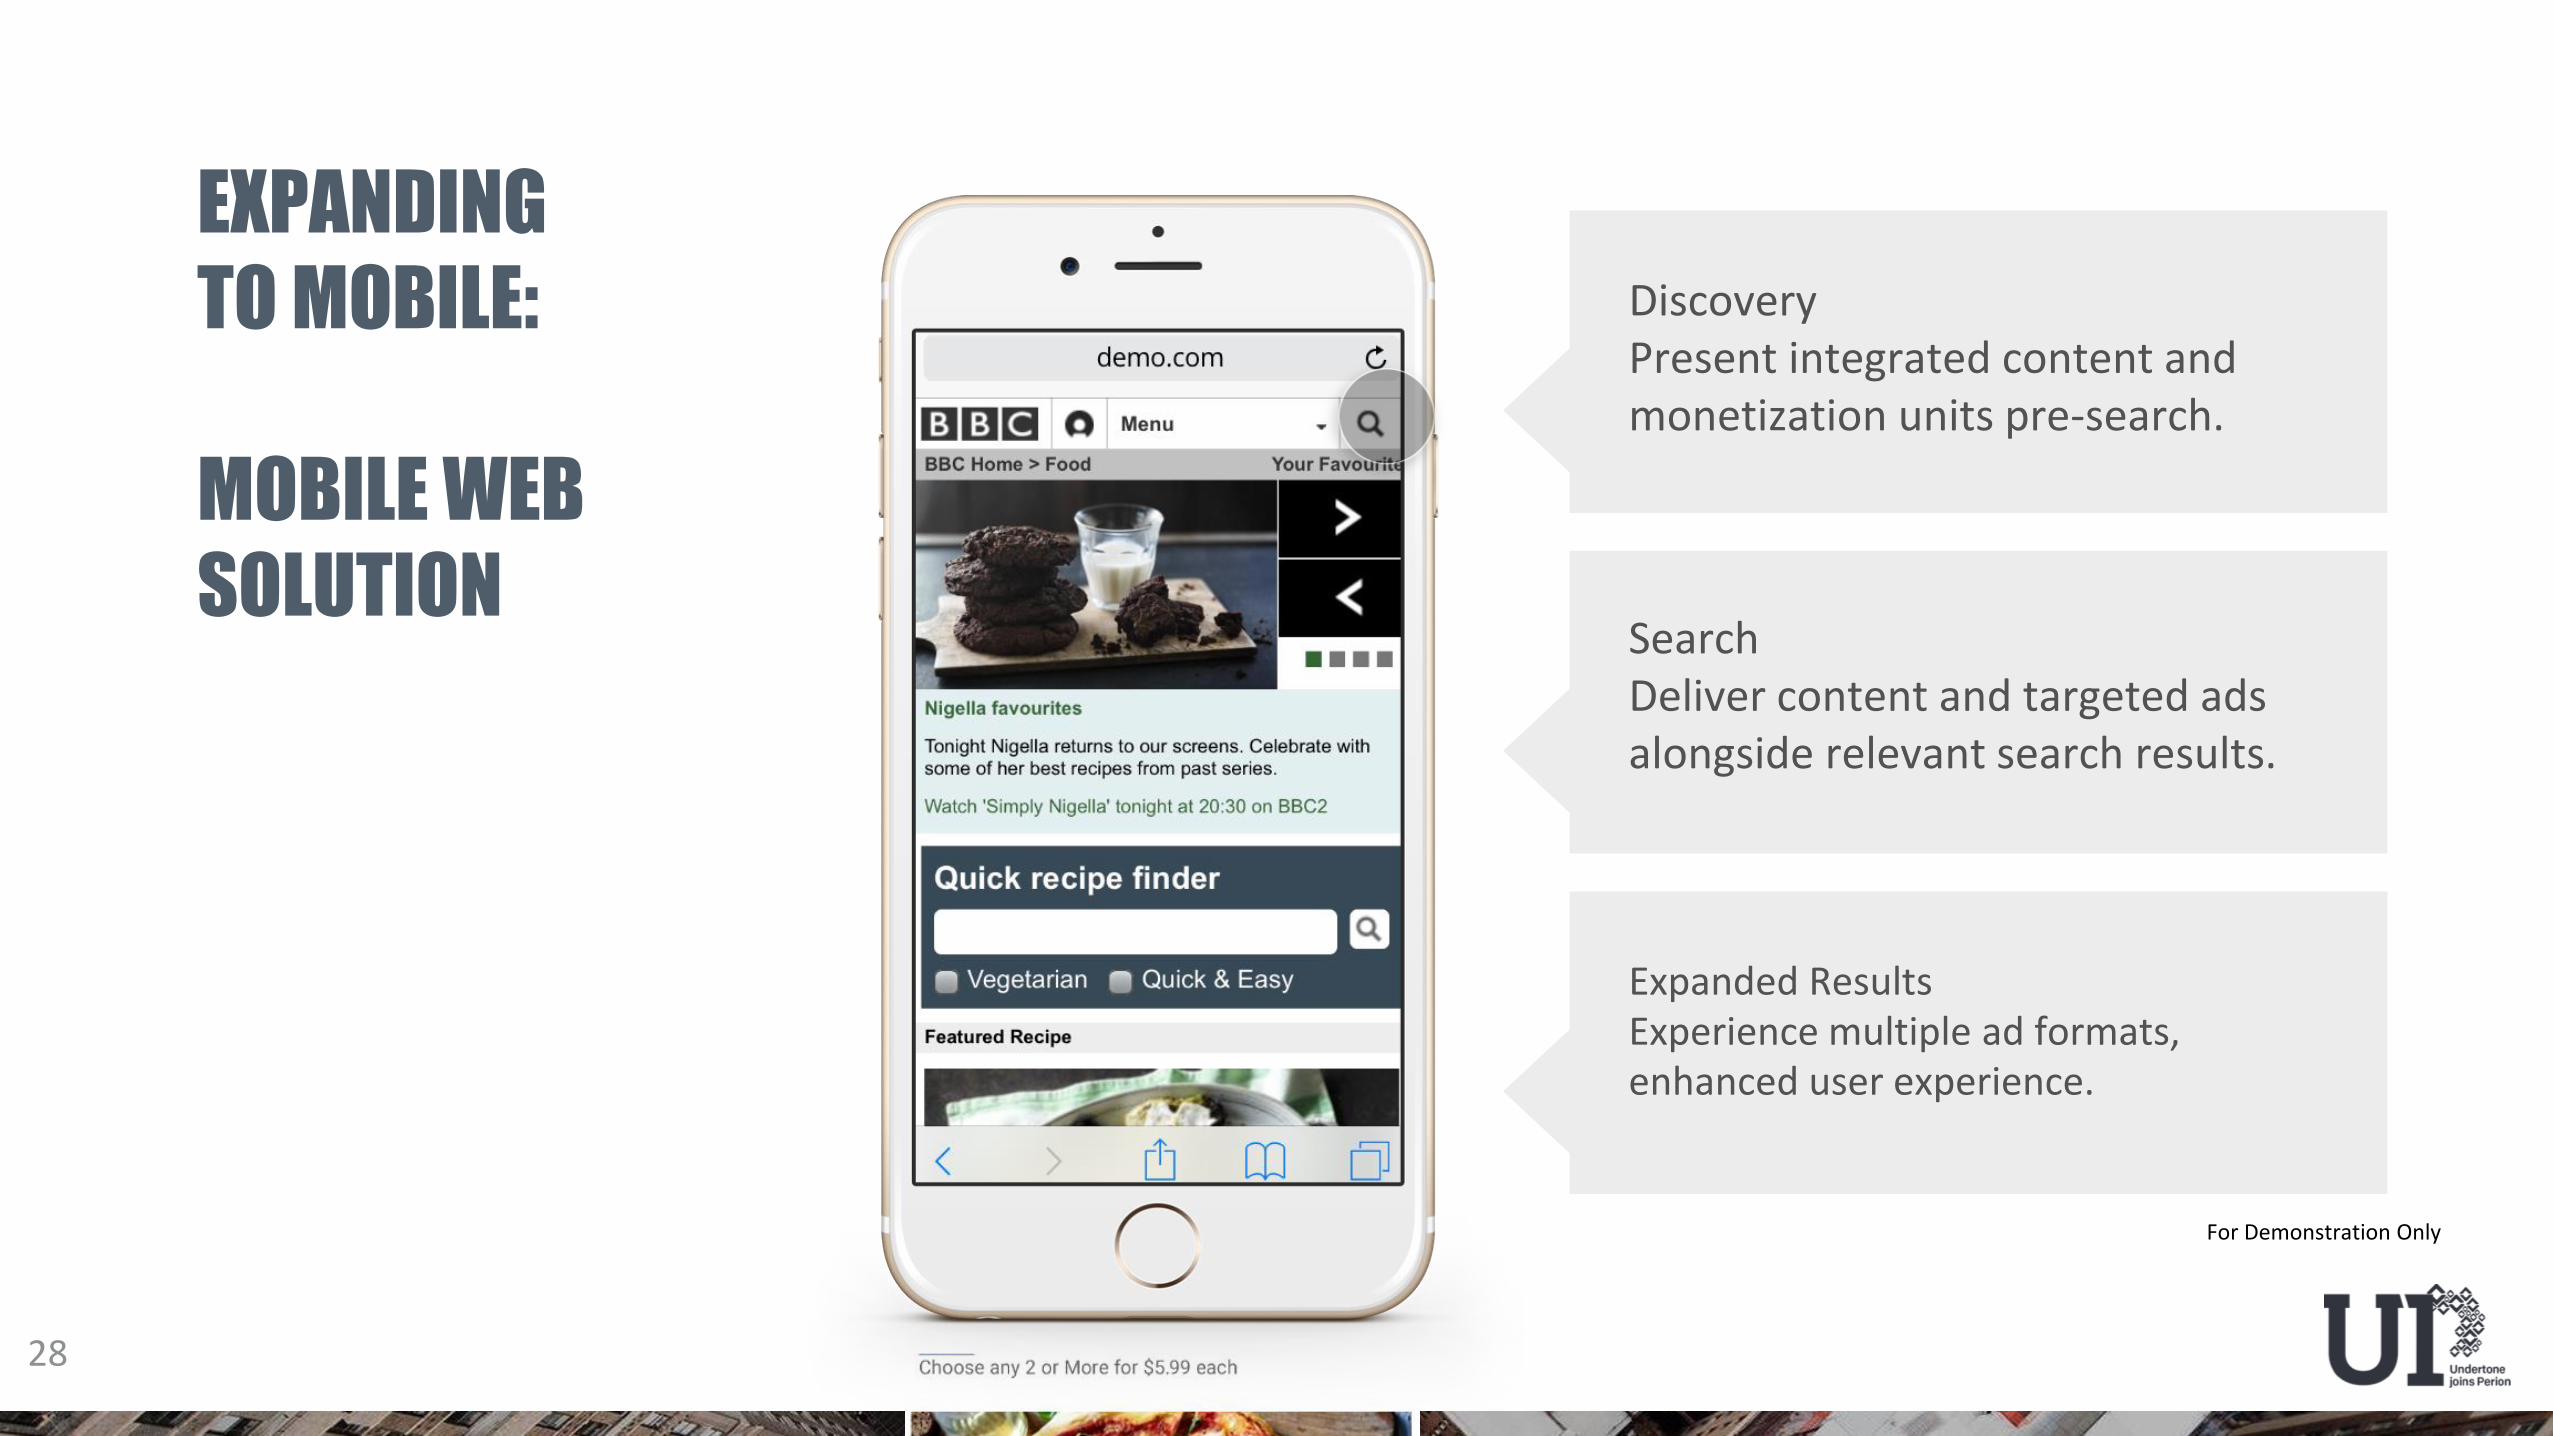
EXPANDING
TO MOBILE:
MOBILE WEB
SOLUTION
DiscoveryPresent integrated content and monetization units pre-search.
SearchDeliver content and targeted ads alongside relevant search results.
Expanded ResultsExperience multiple ad formats, enhanced user experience.
For Demonstration Only
29
=
1. Stabilizing legacy business
2. New growth opportunities leveraging
our existing assets
SUMMARY

30

Source: Forrester Research, "The State of Consumers and Technology Benchmark 2014 US" as
cited in company blog, Jan 16, 2015 184904
CAPTURING CONSUMER ATTENTION IS DIFFICULT

HOW WE DO IT
HIGH-QUALITY
INVENTORY
INNOVATION
+TECHNOLOGY
STUNNING
CREATIVE &
HIGH-IMPACT
FORMATS

33
Auto CPG Fin Services Pharmaceutical Retail Tech/Telecom
WHO WE DO IT FOR

WHAT WE DO:FULL SERVICE DELIVERY & SUPPORT
CREATIVETurns creative
vision into digital reality through ideation, design and build of high
impact units
MEDIA
PLANNINGFinds a solution
that works best for brand’s specific
campaign objectives
CLIENT
SERVICESWorks with client
from start to finish, ensuring creative is
built, tags are launched, results
are analyzed
INVENTORY
MANAGEMENTMaintains quality of our publishers
inventory, ensuring brands are always
displayed in premium, safe environments
PERFORMANCEPerforms deep
analysis to strategically optimize for
optimal performance
throughout the campaign

STANDOUT CREATIVE FORMATS
DRIVE BETTER RESULTS
124%greater
unaided recall
more likely to be
shared on social
networks
higher overall
likeability
more likely to elicit
personal
recommendations
61%
40%
58%
Source: Ipsos ISI/Undertone High-impact Study (2014
Results)

4.29% Average CTR
PAGEGRABBER X™
PAGEGRABBER X™ is an immersive, highly
engaging, full-page takeover. Built with
responsive design, this unit ensures a
seamless and scalable experience across
devices.
Our proprietary full-screen, inherently viewable creative

2.1% Average Interaction Rate
SCREENSHIFT™Our proprietary full-screen, push down unit
SCREENSHIFT® is the industry’s
first high impact format built using
responsive design. Full-browser
width, pushes down publisher
content and contains leave-
behind to re-engage with.

tilt draw twist shake
32%
Avg Engagement Rate
UMOTION ADS™
UMOTION™ is our latest mobile
takeover ad unit that leverages
native smartphone capabilities,
allowing for a unique, participatory
ad experience.
14+ Avg Seconds Time Spent
1.8% Avg Interaction Rate
32%

TAPESTRY®
TAPESTRY is our new storytelling format
that enables a unique brand narrative using
playful mashups of static images and
animated GIFs. This format takes advantage
of the consumer’s natural behavior to see
what’s next; user controls the pace of the
story by tapping to proceed.
LAUNCH
PARTNER

PREMIUM PUBLISHERSDelivering high impact ads with publishers takes a lot of time and effort; Undertone enables standout brand experiences at scale – over 1 billion monthly impressions
BETTER INVENTORYOur relationships with media partners provide access to their best inventory: unique formats and large-canvas units
TAILORED SITE LISTSPublishers or categories based on specific campaign needs
THE GREEN LIST™

HIGH-QUALITY INVENTORY

SUPERIOR INNOVATION
& TECHNOLOGY
FUTURE
PROOF LABS
Exploring the Future
of Digital
Advertising
PIXL
STUDIOS
Creating Standout
Brand Experiences
VIRTUOSO
Enabling High-Impact
Buying Programmatically
Mobile First
Rich Media
Publishing
Platform

43

44
THE MOBILE MARKETING
UNIVERSE IS CROWDED
• It’s difficult to determine the best traffic sources, understand your performance, and optimize ad campaigns effectively.
• Cost of acquiring users increased 60% last year making ROI difficult.
• You invest time and money to drive installs, only to have 70% of users churning in less than 3 months post-install.
ACQUIRING & ENGAGING
MOBILE USERS IS CHALLENGING

45
Our Unique
Solution
keep ‘emuser engagement
Easy and scalable connectivity to large number of traffic sources enabling better ROI optimization
get ‘emuser acquisition
Easy creation and management of mobile CRM campaigns with smart engagement tools increasing user value
We organize the universe of mobile marketing.

WITH UNMATCHED FLEXIBILITY
ON A SINGLE PLATFORM
46
self-serve
the first do-it-yourself, cross-network mobile advertising platform in the industry
fully-managed
rely on our expert account team to manage and optimize your campaigns for you
or

get ‘em
user acquisition
47

The challenge with acquiring users…

• centralized media buying and campaign management
• flexible reach
• unified reporting
• streamlined optimization
• sophisticated retargeting
…is solved with our platform
DEMO

keep ‘em
user engagement
50

ENGAGING MOBILE USERS
IS CHALLENGING
marketers invest time and
money to drive installs, only to
have your users quickly churn
out of their app

OUR PLATFORM SOLVES
THIS CHALLENGE
It is designed to efficiently increase user value by allowing the marketer to do all of the above quickly
But don’t take our word for it – ask our clients…
…and partners
and many more…

CUSTOMER TESTIMONIALS
“with growmobile, we've been able to scale our ad spends and provide a very strong ROI month over month.”
Tim Hsu,
User Acquisition
“we chose MakeMeReach because their software is among the most cutting-edge in the market. With MMR our KPI objectives were taken into account and we felt we had true business partners by our side.”
Jessica Delpirou,
Country Manager France

organic user growth;
i.e. virality, reviews
keep 'emuser engagement
get 'emuser acquisition
TOGETHER OUR PLATFORM IS UNMATCHED
highly-optimized acquisition
spend
successful user retargeting
reward-based acquisition

57
FINANCIAL INFORMATION

UPDATING GUIDANCESTABILITY COUPLED WITH GROWTH
Q4’15 Guidance Prior: New:Revenue $52 - 54M $64-66M Adjusted EBITDA $6 - 7M $9.5-10.5M
$-
$10
$20
$30
$40
$50
$60
$70
Q1'15 Q2'15 Q3'15 Q4'15E
• 2015 expected revenues $217 – 219M
• 2015 expected adj EBITDA $52 – 53M
Addition of Undertone

From 85% search revenue to a more balanced breakdown:
REVENUE BREAKDOWN
NEWLY DIVERSIFIED REVENUES*
STRONG GROWTH TRAJECTORY
(2016E) Search Advertising Product
* EBITDA in 2016 reflects search business model transition and continued investment in Growmobile.
2
2(2015E)
Search Advertising Product
• 2016 EBITDA margin expected to be approximately 10-12%*
• Long-term EBITDA margins expected to be 15-18%
• 2016 revenue growth expected to be approximately 60%
• Long-term revenue growth expected to be 10-15%

REVENUE BREAKDOWN
69.4%
56.9%49.6%
37.5%
25.9%
18.1%33.1% 44.7%
58.2%70.8%
12.5% 10.1% 5.7% 4.3% 2.7%
Q3'14 Q4'14 Q1'15 Q2'15 Q3'15
SEARCH REVENUE BY PAYMENT MODEL, %
Old model Rev share Ads
UNDERTONE REVENUE BREAKDOWN, %

ADVERTISING
REVENUE
SEASONALITY
61
• The advertising business is highly seasonal
• Historically, the fourth quarter has been the strongest quarter
while Q1 is the weakest
Q4'14 Q1'15 Q2'15 Q3'15
YUMI UT SZMK TRMR RUBI

REVENUE RECOGNITIONGROSS NET REVENUE
• Gross/Net Revenue recognition basis:
o Inventory/Financial risk
o Substantial Product/Content contribution
• Revenue generating categories:o Search Gross - over 90% of current revenues with managed financial risk
Net - less than 10% of revenues without any financial risk
o Product Gross - sale of Proprietary product
o Advertising Gross - over 80% of current net sales High-Impact proprietary andstandard ad formats
Net - less than 20% of current net sales from standard display andmobile ad formats

REVENUE GROWTH & PROFIT PROFILE
• Perion's growth profile:
o Growmobile & Sitefuel fastest (triple digit) growth from a small (single digit) base
o Undertone high (double digit) growth from substantial (triple digit) base
o Download Monetization low (stable to single digit) growth from substantial (triple digit) base
• Perion's profit profile:
o Growmobile: Investment stage expected to draw down EBITDA, profitable 2017
o Undertone: High level of profitability, margin increasing with transition to high-impact formats
o Download Monetization: High profitability not sustainable with loss of tail, expected to stabilize as transition is
completed

BALANCED TRANSACTIONDiverse financing
• Periono LT Public Convertible Debt $37M - Profits sufficient to support debt and covenants
o ST Bank Leumi Credit Facility $20M - Leveraging Bluechip receivables
o JPMorgan Equity Financing $10M - Reinforces commitment by quality institutional investor
o Cash & equivalents >$50M
• Undertoneo Renewed 5 year debt by US bank consortium $50M
o UT profits sufficient to support debt and covenants
o Financing fixed working capital spread

8 countries
Global Presence in
TEL AVIV (HQ)
High-quality ad solutions:
a $13B opportunity
2015 Net Revenue
~$218M
Employees
675+
2015 EBITDA
~$52M
Number of Brand Advertisers & Publishers
1300+
2015 SUMMARY
HIGH-IMPACT
AD FORMATS
OUTSTANDING
EXECUTION
EXCLUSIVE
INVENTORY
DATA-DRIVEN
TECHNOLOGY
ENHANCED
ENGAGEMENT
BRANDED
SEARCH