analysis of well containment and control attempts …
TRANSCRIPT

ANALYSIS OF WELL CONTAINMENT AND CONTROL ATTEMPTS IN THE AFTERMATH OF THE DEEPWATER BLOWOUT IN MC252
FINAL REPORT
Submitted to: The National Commission on the BP Deepwater Horizon Oil Spill and Offshore Drilling
Submitted by:
Mayank Tyagi, PhD. John Rogers Smith, PhD., P.E.
Darryl A. Bourgoyne, MS. Craft & Hawkins Department of Petroleum Engineering
Louisiana State University Baton Rouge, LA 70803
January 11, 2011
All findings, opinions, statements, and recommendations contained in this report are solely those of its authors. The report has been submitted to the staff of the National Commission on the BP Deepwater Horizon Oil Spill and Offshore Drilling, but the report is not the work product of the Commission or its staff, and should not be construed in any respect as the official or unofficial findings, opinions, statements, or recommendations of the Commission or its staff.

1
EXECUTIVE SUMMARY An analysis of the following well containment and control attempts in response to the Macondo blowout is performed in chronological order: containment dome, top kill, capping stack, and static kill. This report’s primary objective is to document and critique the actions taken and their results and to identify the key lessons learned from this landmark experience that are relevant to minimizing the impact of any future deepwater blowouts. Secondary objectives are to explain the successes and failures or mistakes, identify additional alternatives or adaptations that might have been relevant, and consider possible improvements in the methods used or decisions made.
Identification of strengths, weaknesses, opportunities, and threats is attempted for each containment option. The following questions are considered in identifying these factors:
1. How effective was the containment attempt in terms of rate of capture and percentage captured, or success in stopping or sealing the blowout?
2. What risks were imposed? 3. What opportunities were potentially offered by a containment option beyond
its intended purpose? 4. What threats to the operation were created by a particular response?
Major findings of this report are as follows:
1. The cofferdam failed due to buoyancy from lighter hydrocarbons trapped inside the dome after hydrates plugged the flow path. As designed, it would not have worked even absent hydrate blockage given the well’s flow rate and fluid properties. The cofferdam approach requires further development for application to irregular leak sources that preclude use of a sealing connection.
2. The top kill apparently failed due to the limited flow-rate capacity design of the mud pumping system. There would have been a reasonable chance of success if the kill fluid was pumped at rates higher than 109 barrels per minute; albeit, such rates would have increased risks to blowout preventer stack integrity.
3. Removal of the riser to allow a sealed connection for collecting and/or stopping the flow should have been given stronger consideration for early implementation versus the non-sealing attempts at collection from the riser leaks.
4. A capping stack with direct vertical access well intervention capabilities is the most desirable containment mechanism when the potential exists to latch and seal it to the well.
5. The post bullhead (static) kill cement job should have been deferred until more certain control of the flow path, cement placement, and cement evaluation were possible. Use of a bridge plug or storm packer to allow blowout preventer replacement before cementing would have been more pragmatic.
6. The current practices for intermediate casing design, which do not require accounting for the maximum loads corresponding to shutting-in a blowout, should be re-evaluated in light of the risks involved in each particular case.

2
INTRODUCTION
An analysis of selected Macondo well containment and control attempts is performed: The containment dome, top kill, capping stack, and static kill operations are reviewed in chronological order. Appendix A provides the Macondo well schematic used for the calculations involved in this study. This analysis aims to identify the key lessons learned that may be relevant to minimizing the impact of any future deepwater blowouts. Apart from explaining the successes and failures (or mistakes) and documenting relevant alternative methods, this report identifies possible improvements in the methods used and decisions made.
Four attempts to contain and control the Macondo well are presented in chronological order to capture an engineering-based rationale for their selection and application. Analysis of each attempt is made using the available data provided by Commission staff and found in the news media. Identification of strengths (S), weaknesses (W), opportunities (O), and threats (T) is undertaken for each containment option. The following questions are considered in identifying these factors:
1. How effective was the containment attempt in terms of rate of capture and percentage captured, or success in stopping or sealing the blowout?
2. What risks were imposed? 3. What opportunities were potentially offered by a containment option beyond
its intended purpose? 4. What threats to the operation were created by a particular response?
Some of the threats that are specifically analyzed include: 1. Could implementing this option cause the well’s flow rate to the seafloor to
increase? 2. Could implementing this option cause an underground blowout resulting in
oil broaching to the seafloor, e.g. due to a casing or rupture disk failure? 3. Was there a reasonable risk: 1) of interference with other responses, 2) to
the integrity of the blowout preventer (BOP) stack or wellhead, 3) to personnel on the rigs and work vessels, and 4) associated with surface handling of flammable hydrocarbons under pressure on the rigs and work vessels?
4. What impact would weather conditions such as tropical storms and hurricanes have and how did uncertainty regarding these conditions play a critical role in the decisions made?
Additional factors addressed are: 1. What was the apparent intent of the response? 2. What were the critical failure points in the designs? 3. Were assumptions about the threats posed by various well control options
reasonably founded? 4. Did the well casing design play a critical role in determining the success or
failure of these attempts?

3
ANALYSIS OF FOUR WELL CONTAINMENT & CONTROL ATTEMPTS IN CHRONOLOGICAL ORDER
MAY 6-8, 2010: COFFERDAM CONTAINMENT DOME
The intent of the cofferdam operation (see Figure 1) was to implement a readily deployable containment method with known risks (associated with surface handling of flammable hydrocarbons under pressure on floating vessels). Further, it posed no additional risks to well integrity or the BOP stack. The operation failed primarily due to poor provisions for handling hydrates. There was a high probability of hydrate formation at the prevailing seafloor conditions, and the absence of effective hydrate dissociation mechanisms led to critical failure. If successful, it could have captured more oil than the Riser Insertion Tube Tool.
Figure 1: Cofferdam containment dome operation (Source: The New York Times).
A simple design analysis of the cofferdam is presented to evaluate and understand its flow-capture potential. The dimensions of the cofferdam were 24 ft
× 14 ft
× 40 ft. Thus, the volume of the containment dome was approximately 3,440 ft³ (= 2,394 barrels). It was to be connected to the Discoverer Enterprise drillship, which had a

4
maximum capture rate of 15,000 barrels per day (bbls/day), using a 6 5/8-in drillpipe. One risk of the dome’s large volume was the likelihood of hydrocarbons mixing with seawater to form hydrates, which in fact did end up collecting in and plugging the opening at the top of the dome. However, if the system had been filled with a synthetic base drilling fluid or methanol before being lowered over the hydrocarbon plume, it should have been possible to inhibit hydrate formation and allow production to the surface within the limits of the Enterprise. From available data, it seems that there was a top door vent that was kept open during the lowering of the cofferdam, and it had only a limited provision (circulating hot water in the riser once connected) for hydrate dissociation.
A separate issue is the volumetric size, weight, and related buoyancy of the cofferdam. The reported weight was approximately 100 tons. To understand the forces on the cofferdam when filled with lighter hydrocarbons, the following calculations are presented. Assume the weight of dome is W lbs, its volume is V ft3, it is filled with fluids of specific gravity γ, the density of seawater is , the density of free gas is
ρg , and the cofferdam’s steel is lb/ft3. Buoyancy force = Density of the displaced fluid * Volume displaced.
Weight (buoyed) of cofferdam = 1100
−
s
w
ρρ tons = 87 tons = 173,740 lbs
Vρw 1− γ( )≥ W 1−ρw
ρs
Condition for dome to be buoyant
∴γ ≤1−W
Vρw
1−ρw
ρs
The cofferdam’s volume that can be filled with lower density fluids is limited by the vent on its side, which reduces its effective height to about 25 ft. Consequently, the estimated effective volume is about 8,400 ft³. Our calculations indicate that the cofferdam would become buoyant if filled with a fluid with a specific gravity less than 0.68. The specific gravity of methane hydrate (CH4)8 (H2O)46 is approximately 0.9. Thus, if the cofferdam were filled with hydrates alone it would not become buoyant. Yet, filling the dome with Macondo well fluids (which had a specific gravity equivalent to 0.577 per BP’s 0.25 psi/ft gradient) would have made the system buoyant. Further, the collection rate of Enterprise (15,000 bbls/day) was lower than the now-known flow rate, which implies that even if the cofferdam had not plugged with hydrates, it would have eventually become buoyant after filling with hydrocarbons. The formula explaining this relationship is:
Rate of accumulation of low specific gravity hydrocarbons inside the cofferdam
= Inflow rate of the hydrocarbons from the riser into the cofferdam
- Outflow rate of hydrocarbons through the hole at the top of the cofferdam
ρw
ρs

5
The rate at which hydrates form within the cofferdam could reduce, or even stop, the outflow of hydrocarbons. However, that would only affect how fast the cofferdam filled with hydrocarbons and became buoyant. The cofferdam could only avoid buoyancy if the amount of hydrocarbons within it were not increasing over time, i.e. if hydrocarbons were leaving the dome at the same or a faster rate than they were entering it. BP’s later “top hat” was smaller in volume, thereby increasing the ratio of weight to volume to keep the top hat non-buoyant when filled with low specific gravity fluids. It also had vents so that it would not fill with excess hydrocarbons.
Amount of recovered oil: The cofferdam plugged up with hydrates and did not recover any leaked oil. S: Available; deployable; no additional burden on well integrity or BOP stack.
W: Away from the leak source (cannot capture all of the leakage); temporary; no vents; no or limited provision for hydrate dissociation; volume of chamber increases risks of hydrate formation; cumbersome to handle; inability to seal the dome to the leak point; limited by surface handling capacity; depends on continued connection to surface vessels (weather sensitivity).
O: Could potentially collect most of the leaked oil from the end of the broken riser on the seafloor or another large or irregular leak source.
T: Surface handling of flammable hydrocarbons (under pressure) on surface vessels.
Opportunities for improved application:
The risk of almost immediate formation of hydrates could have been reduced by filling the cofferdam with a synthetic base fluid or methanol before lowering it over the leak. Not lowering directly over the leak (area of high hydrate concentration) would definitely increase the chances of installing the dome effectively. These recommendations, however, do not reduce the likelihood of failure in the event that free gas becomes trapped inside the dome. The dome’s potential is also limited by the fact that the collection rates of surface vessels to which it connects must be higher than the flow rate of the low-density hydrocarbons from the leak source. If the cofferdam had worked as anticipated, because the flow rate was higher than the 15,000 bbls/day the Enterprise could process, the cofferdam would have filled with hydrocarbons, become buoyant, and failed even absent the hydrate issues. It is therefore important to design cofferdams or any collection dome/caps with vents to regulate the volume of hydrocarbons inside them. This strategy was adopted in the design of the top hat.
MAY 26-28, 2010: TOP KILL
The “top kill” procedure (see Figure 2) involved pumping heavy drilling mud into the well with the objective that the pressure imposed by pumping additional fluid
6
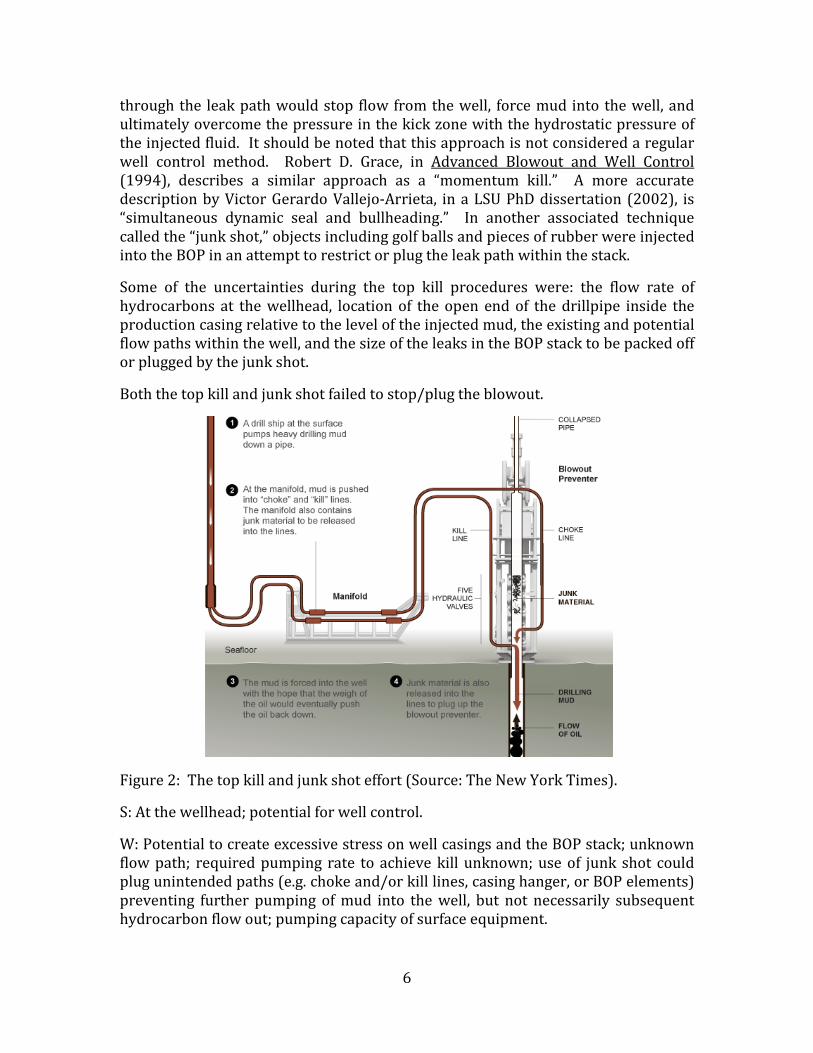
through the leak path would stop flow from the well, force mud into the well, and ultimately overcome the pressure in the kick zone with the hydrostatic pressure of the injected fluid. It should be noted that this approach is not considered a regular well control method. Robert D. Grace, in Advanced Blowout and Well Control (1994), describes a similar approach as a “momentum kill.” A more accurate description by Victor Gerardo Vallejo-Arrieta, in a LSU PhD dissertation (2002), is “simultaneous dynamic seal and bullheading.” In another associated technique called the “junk shot,” objects including golf balls and pieces of rubber were injected into the BOP in an attempt to restrict or plug the leak path within the stack.
Some of the uncertainties during the top kill procedures were: the flow rate of hydrocarbons at the wellhead, location of the open end of the drillpipe inside the production casing relative to the level of the injected mud, the existing and potential flow paths within the well, and the size of the leaks in the BOP stack to be packed off or plugged by the junk shot.
Both the top kill and junk shot failed to stop/plug the blowout.
Figure 2: The top kill and junk shot effort (Source: The New York Times).
S: At the wellhead; potential for well control.
W: Potential to create excessive stress on well casings and the BOP stack; unknown flow path; required pumping rate to achieve kill unknown; use of junk shot could plug unintended paths (e.g. choke and/or kill lines, casing hanger, or BOP elements) preventing further pumping of mud into the well, but not necessarily subsequent hydrocarbon flow out; pumping capacity of surface equipment.

7
O: Could potentially stop the flow completely and achieve a hydrostatic kill; use of junk shot could restrict leakage rate and increase likelihood of achieving kill.
T: Casing failure; BOP stack failure; erosion of BOP elements and the riser kink allowing an increased hydrocarbon flow rate; possibility that failed rupture disks in the 16” casing (either from the excessive pressure during the kill or from the initial phase of the blowout) could provide a flow path leading to underground blowout at the 18” casing shoe and, therefore, potential for hydrocarbons to broach to the seafloor.
If we approximate the flow through the BOP stack as a choke restriction during the top kill operation, then a simple choke pressure drop and flow-rate relationship can be calculated as follows:
( )
1
0
21
20
2
as rateleak estimatecan weC),in (changeerosion no Assuming
0,1 :kill topsuccessfulFor
1,0 :kill topBefore1,0
bop
bopmudHC
mudbop
HCbop
HCmudleak
leakbop
pp
Cqp
Cqp
qqqCqp
∆
∆=
=∆
==
=∆
==≤≤+=
=∆
βα
βαβαβα
Note that we have ignored fluid density effects, mixing, and leak path erosion phenomena in generating this rough estimate. Using the boost line pressure of approximately 2,600 pounds per square inch (psi) for both cases, an average choke line pressure of 6,000 psi for a mud pumping rate of 80 barrels per minute (bpm) (Figure 5) and lower stack pressure of 3,400 psi before the mud injection, we can estimate flow rate for oil as follows:
qHC = 803400 − 2600( )6000 − 2600( )
= 38.8 bpm
This hydrocarbon flow rate corresponds to approximately 55,880 bbls/day. It also assumes that at a 6,000 psi choke line pressure, only mud was flowing through the BOP and, therefore, the flow of oil stopped temporarily during the kill attempt. It is noteworthy that the above estimates, based on choke-performance relationship and using simultaneous measurements of pressure and mud pumping rates during the top kill, can yield a reasonable value for the flow rate. If this calculation had been made following the top kill’s failure, it could have informed a redesign of the operation.
8
Explanation of the top-kill’s failure:
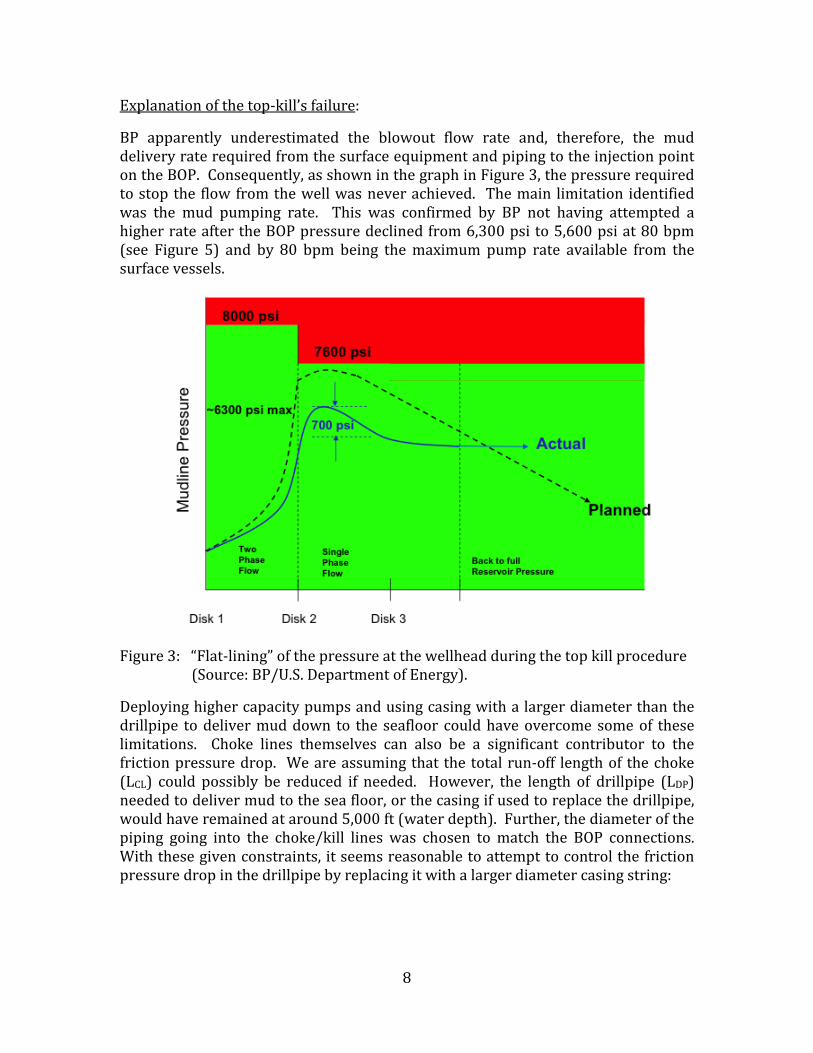
BP apparently underestimated the blowout flow rate and, therefore, the mud delivery rate required from the surface equipment and piping to the injection point on the BOP. Consequently, as shown in the graph in Figure 3, the pressure required to stop the flow from the well was never achieved. The main limitation identified was the mud pumping rate. This was confirmed by BP not having attempted a higher rate after the BOP pressure declined from 6,300 psi to 5,600 psi at 80 bpm (see Figure 5) and by 80 bpm being the maximum pump rate available from the surface vessels.
Figure 3: “Flat-lining” of the pressure at the wellhead during the top kill procedure (Source: BP/U.S. Department of Energy).
Deploying higher capacity pumps and using casing with a larger diameter than the drillpipe to deliver mud down to the seafloor could have overcome some of these limitations. Choke lines themselves can also be a significant contributor to the friction pressure drop. We are assuming that the total run-off length of the choke (LCL) could possibly be reduced if needed. However, the length of drillpipe (LDP) needed to deliver mud to the sea floor, or the casing if used to replace the drillpipe, would have remained at around 5,000 ft (water depth). Further, the diameter of the piping going into the choke/kill lines was chosen to match the BOP connections. With these given constraints, it seems reasonable to attempt to control the friction pressure drop in the drillpipe by replacing it with a larger diameter casing string:

9
psp = ρgLDP +dpdl
DP
f
LDP +dpdl
CL
f
LCL + pwh
dpdl
f
=ρ0.75µ0.25q1.75
8624d4.75 Pressure drop (field units) for turbulent flow regime
BP’s initial interpretation of the “flat-line” observed during the top kill also proved incorrect. BP inferred that the mud column length in the well may have been limited due to flow out into the formation at the 18” casing shoe through “failed” rupture disks, which then prevented the attainment of hydrostatic control. Moreover, BP thought these rupture disks might have failed during the initial phase of the blowout (due to collapse loads resulting from an annular flow path to the seafloor when the riser was connected to the rig on the surface). Further, in such an event, there was high likelihood of broaching at the 18” casing shoe, and BP apparently concluded at that time that valve stacking (cap or BOP on BOP) strategies should not be implemented. Obviously, this conclusion was later corrected.
The observed phenomena of a flat-line can also be explained by the following two scenarios, which are both plausible and more straightforward than BP’s interpretation, though maybe not as common:
a) The mixing of mud and hydrocarbons below the injection point, until a steady-state length (see Figure 4) was achieved, created additional hydrostatic in the well resulting in the observed flat-line. A heavy liquid tends to fall through a light liquid, especially when the fluids are immiscible (as is the case of heavy water-based mud falling through oil). This tendency is strongest when there is no other flow in the system, but can occur to a degree even when the light fluid is moving upwards. This is the same effect that caused the heavy spacer to fall back through the seawater when BP was displacing the well to seawater before the negative test prior to the blowout. It typically results in some steady-state distribution of the fraction of the heavy fluid suspended in the lighter fluid column in the well below the point where the heavy fluid is being injected. When this occurs in a gas-liquid system, that fraction is called the “zero net liquid flow (ZNLF) holdup.”
ρmix = αρmud + 1−α( )ρHC
⇒ Lmix =∆pWH
ρmixg The observed pressures of 6,300 to 5,600 psi during the top kill (i.e. 700 psi pressure drop) correspond to only 821 ft of a 16.4 pounds per gallon (ppg) mud column. The length of the actual column would necessarily be longer because hydrocarbons were flowing upward past the “held up” mud.

10
Figure 4: Schematic to explain hydrostatic pressure due to a zero net flow liquid
holdup mixing column.
b) Increased flow rate through leaks in the BOP and riser kink may have caused
a washout (increase in the flow leak area) that reduced the pressure drop (see Figure 5).
Figure 5: Pressure vs. mud flow rate during top kill (Source: BP/U.S. Department of
Energy).
Assuming that stopping the formation flow required a boost line pressure of 2,600 psi, an average lower stack pressure value of 6,000 psi at 80 bpm, and a stack pressure of 8,900 psi, the required top kill mud pump rate (qreq) we obtain is:
qreq = 808900 − 2600( )6000 − 2600( )
=108.9 bpm

11
The 8,900 psi value used in this calculation is based on documents from BP indicating that this pressure would be adequate to stop flow from the M56A and M56E sands (according to information available at the time of the top kill attempt). The higher pressured M56A sand had a formation pressure gradient of 13.1 lb/gal equivalent, measured at a depth of 17,788 feet with a Modular Formation Dynamics Tester (MDT) tool and an assumed average formation fluid density of 5.18 lb/gal. The calculated shut-in pressure at the BOP stack for these conditions is 8,690 psi. Consequently, a wellhead pressure of 8,900 psi should have stopped flow from these sands. The actual shut-pressure recorded after closing the capping stack in July was only 7,100 psi, which is much lower than this estimate, probably due to pressure depletion of the formations. However, at the time that the top kill was being attempted, the best estimate would have been based on the MDT data and the assumption of no pressure depletion. It is also notable that this pressure exceeds the 8,000 psi limit shown in Figure 3. The authors are not certain about the basis for that limit. It is presumably related to the pressure capabilities of the 16” casing, the rupture disks, and/or the riser flex joint in the lower marine riser package (LMRP).
Using the limited information provided about the top kill attempt, it is likely that a top kill using a mud pump rate of 109 bpm to generate 8,900 psi below the BOP stack for a prolonged period could have been successful. It is clear that the likelihood of success for this approach would have been high, because it is now known that the bullhead (static) kill used with the capping stack was successful.
In hindsight, the failure of the top kill was not a definite indicator that there was any higher risk in using a sealing option to control the well versus using loose-fitting collection-only devices. Based on the evidence available to the response team when the top kill pumping system was designed, an under-estimation of the most likely hydrocarbon flow rate may have been reasonable because there was considerable uncertainty regarding the actual figure. However, top kill contingencies for much higher flow rates should have been considered or, at least, reconsidered after the initial failure. It is very likely that if the top kill had been designed to deliver more than 109 bpm of 16.4 ppg drilling fluid below the BOP stack for a sustained period, the Macondo blowout could have been stopped between May 26-28, 2010. Given that the well was successfully shut-in with the capping stack in July, and that the subsequent bullhead (static) kill was successful, certainly a higher rate top kill would have been successful at that time. The actual pressure that would have been required in late May, and the actual limits on that pressure due to the risk of having a well integrity (e.g. rupture disk) failure are not known, but a higher pump rate could have been attempted without exceeding the established 8,000 psi limitation. Another unknown about the potential success of the un-tried high-rate top kill is how fast the BOP stack restrictions and the choke and kill lines would have eroded. Alternative diagnostic methods for analyzing the pressure response curve during the top kill should have been investigated, such as the pressure-rate relationship while pumping.

12
JULY 10-12, 2010: CAPPING STACK
From July 10-12, 2010, a sealing cap was bolted on the top of the original BOP stack through a connector flange on top of the flex joint (see Figure 6). The cap had three blind shear rams that could be closed to completely stop the flow from the well. The risks associated with the sealing cap were primarily related to the wellhead, the well’s casing integrity, and the BOP stack’s integrity. The capping stack arrangement, with only blind shear rams, limited its versatility for routing flow or allowing direct vertical access into the well. However, side choke and kill outlets allowed it to vent flow and could potentially have been used to route flow for recovery at the surface. Similarly, additional components could potentially have been built into the top of the capping stack, such as an annular preventer, to allow for vertical intervention into the well below the capping stack to conduct diagnostic and remedial operations, such as logs to confirm the flow path or a dynamic kill to stop the flow without closing the capping stack’s blind shear rams. Additional examples are provided below.
S: Common response technique for surface blowouts; successfully stopped flow from the well by shutting it in; had provisions for directing flow to the surface through existing choke and kill lines and/or allowing a controlled rate of flow into the sea through a choked outlet.
W: Required time-consuming assembly and fabrication of a customized capping stack; required removal of the riser and the resulting potential for increased hydrocarbon flow while preparing for installation; installation required establishing a pressure containing connection at the top flange on the flex joint, which was time-consuming; did not provide for vertical access into the well absent the addition of more components; if the well could not be shut in, relied on existing choke and kill line connections, with limited flow-rate capacity, to route hydrocarbons to the surface for collection.
O: Could be adapted to provide a means for vertical intervention directly into the well, which would have provided a safer approach than replacing the BOP stack, as well as a more conclusive means of killing, cementing, and evaluating the well (as described in subsequent sections).
T: The shut-in imposed significant pressure on well components and could have resulted in an equipment failure or underground blowout.
Why was capping stack used so late in the sequence of operations?: The concern that increased pressure on the well could cause an underground blowout when applying a sealing option was raised immediately following the top kill attempt. There was also an earlier concern that cutting the riser to remove the kink, which would be necessary to install a capping stack, would result in significantly increased flow from the well. It is possible that installation of a capping stack might have been delayed either due to concerns about these risks or due to the unavailability of required components for the system. When the capping stack was eventually

13
installed, the well’s integrity had almost certainly been reduced by erosion caused by the months of high flow. The available documentation indicates both that the risk of initiating underground flow due to a rupture disk failure was a major concern and that the pressures measured after shutting-in the well with the capping stack were considered to be low enough to minimize this risk and, upon analysis, not so low as to indicate that a rupture disk failure had already occurred. Certainly, the moderate but building pressures measured after the capping stack was installed were a major consideration in leaving it closed.
Why was there no intervention capability in the capping stack (all three were blind shear rams)?: A sealing cap with an annular preventer would have been beneficial as a means to provide vertical access into the wellbore for intervention. Capping stacks have often been used in controlling blowouts from surface wellheads. A difference is that a surface capping stack would typically allow a conventional BOP stack with pipe rams and an annular preventer to be added on top of it to provide direct vertical intervention access into the well. Examples of the types of possible intervention include: 1) running coil tubing, stripping, or snubbing pipe into the well to achieve a conventional circulating kill or dynamic kill; 2) running wireline into the well to set a mechanical plug; 3) perforating the production casing to gain access to a flow path outside the casing; or 4) running logs to identify a flow path or confirm that a flow path has been sealed successfully.
Figure 6: The capping stack (Source: The New York Times).

14
Opportunity for improved application:
A sealing cap with at least one annular preventer and a side outlet with piping to the surface could have provided better collection and intervention capabilities. It is unknown why such an intervention option was not provided for. The choke and kill lines in the original BOP provided a connection to the surface. The ability to directly enter the well with pipe during the blowout would have been a tremendous advantage if the well had indeed been leaking into formations below the seafloor. For example, if a large leak through a rupture disk were present, the bullhead (static) kill would have been unsuccessful. A bottom kill using pipe lowered directly into the well itself could have been used to fill the well with kill mud from the bottom and stop the flow of hydrocarbons, even if there had been a significant leak in the well above. Furthermore, once the flow of hydrocarbons was stopped with kill mud, mechanical and/or smaller cement plugs could have been placed through the capping stack near the bottom of the well, and tools could have been used to evaluate the condition of the annular flow path outside of the production casing. It is also conceivable that, once well integrity was evaluated and confirmed, operations to evaluate the primary cement job could have been conducted. As explained in more detail later, a sealing cap option should be emphasized as the first strategy to be implemented in any future Macondo type deepwater blowout where a direct seal to the well is feasible.
AUGUST 3-5, 2010: STATIC KILL
A “static kill” (more commonly referred to as “bullheading” within the industry) was used to successfully regain hydrostatic control of the Macondo well. It was followed by the bullheading of cement to seal the well and prevent further flow. The cementing operation was declared successful on August 8, 2010. In the authors’ opinion, neither of these methods should be expected to generally achieve such success in future situations. However, bullheading mud with an appropriate density was specifically applicable in this situation, and could have provided a second barrier to supplement the capping stack if the mud weight had included a riser margin. Nevertheless, bullheading mud is primarily applicable to cased holes, and its utility for wells where a significant interval of open hole is exposed is generally restricted to reducing surface pressures rather than regaining hydrostatic control. Bullheading cement can often be a successful means to seal a well as an alternative to placing a cement plug. Yet, bullheading cement carries risks and creates complications that the authors believe were inappropriate in this situation. These conclusions are explained in the following paragraphs. The explanations include a discussion of the main points of contention raised by Pat Campbell of Superior Energy Services, Inc. and Robert D. Grace of GSM, Inc. regarding the use of these methods. Alternatives for improving the reliability of techniques to create hydrostatic control and achieve a seal inside the well, with lower risk, are also described.

15
Figure 7: The bullhead (static) kill operation (Source: The New York Times).
Description of bullheading:
Prior to bullheading, the flow had already been stopped by the closing of the capping stack atop the well. Therefore, achieving a high mud injection rate was no longer necessary, as it would have been for a successful top kill. After ensuring that the well was hydrostatically controlled by bullheading mud, cement was pumped in to permanently seal the well. On August 8, 2010, National Incident Commander Admiral Thad Allen declared that this operation had been successful. Later, an “ambient test” was conducted, which demonstrated that the Macondo well would not leak if opened to the sea, confirming that the cement had in fact sealed the well.
Introduction to discussion:
The following review of the static kill will provide an assessment of the contrasting perspectives on this operation submitted by Pat Campbell and Robert D. Grace. In summary, Mr. Campbell considered this technique only applicable “when no relief well” or “other alternative means of entering the wellbore . . . was available or timely.” He recommended against the static kill’s use because it was a higher risk alternative as compared to utilizing the relief well or some other circulating kill method. Conversely, Mr. Grace claimed that the static kill was the “logical primary well control option” with “as close to 100 percent” probability of success “as any

16
operation in the oilfield” and stated that “in most instances . . . , the mud is then displaced by cement to permanently control the formation.” These two perspectives will be considered and critiqued in the following analysis.
Effectiveness of bullheading as a method to regain well control:
The International Association of Drilling Contractors (IADC) has defined appropriate well control training requirements, accredits training (WellCAP) programs meeting those requirements, and issues certificates to successful graduates of those programs at over 100 providers worldwide. It has also published guidelines for deepwater well control that are widely recognized and utilized. The IADC does not recognize bullheading as a primary method of well control for a “drilling well,” i.e. a well where there is significant open hole or multiple open zones. Although bullheading is a common and standard approach for killing a cased well, where fluids can be forced into the producing zone, IADC considers bullheading an “other well control method.” Also, no mention is made of dynamic (top) kills, which are a rare, special form of bullheading. Nevertheless, IADC does require training for subsea wells on the subject of “when bullheading should be used in lieu of constant bottom hole pressure methods” and on the bullheading method itself. Similarly, the IADC deepwater guidelines state that “[b]ullheading may be a viable alternative unless the open hole section is lengthy. Forcing influx fluids down the wellbore may induce underground interzonal flow.”
In general, in wells with a significant span of open hole exposed, such as Macondo, bullheading is only useful for displacing kick fluids from the cased hole and reducing surface pressures; it is not reliable for achieving a kill, and on multiple occasions, has resulted in a well experiencing underground flow (e.g. interzonal transfers or an underground blowout). If the pressure in the well at the zone accepting the bullheaded fluids (the loss zone) is not greater than the reservoir pressure would be when flow from it has stopped, bullheading cannot increase the well pressure enough to stop formation flow. These conditions often exist when the loss zone is a significant distance above the kick zone, which is why the IADC raises a caution about using this method when there is a lengthy open hole. This is because the dense mud being bullheaded can end up flowing into a loss zone above the kick zone and never completely fill the well. The general case is that, if a significant length (sometimes less than 1,000 feet) of open hole exists above a kick zone, there will be a weak zone that will accept all of the bullheaded fluids, and this weak zone will be far enough above the kick zone such that the kick zone will remain underbalanced during and following the bullheading attempt.
However, a contrasting condition was known to exist in the Macondo well. A known lost circulation zone, weaker than the zones above the kick zone but supporting a mud weight that would control the kick zone, existed below the kick zone. Thus, it was logical to expect that bullheading would be a successful kill method, because kill density fluid could be displaced from the surface to a depth below the kick zone. Hydrostatic control could therefore be regained despite almost 900 feet of open hole

17
above the kick zone. In summary, bullheading mud was logical and effective because the Macondo’s loss zone was below its kick zone.
Risks associated with bullheading mud:
The contention by Mr. Campbell that bullheading mud creates a higher risk of loss of well and equipment integrity than circulating kill methods is widely recognized by the industry and, in the opinion of the authors, was well understood to be relevant in this case. Apparently, a decision was made that the risks associated with having the capping stack as the only barrier—e.g. of leaks, damage, or loss of component control—were greater than the risks that a casing rupture disk would burst or loss of pressure containment in some other well component would occur during the short term, slightly higher pressures (reportedly only about 35 psi higher) imposed during bullheading. It was reasonable to expect that bullheading mud could be achieved at pressures only slightly greater than the shut-in pressure because the formation flow capacity was very high, and therefore injectivity would likely also be very high. The judgment that the well system had adequate integrity to withstand 8,000 psi wellhead pressure has not been reviewed in this study. Nevertheless, the primary pressure risk had already occurred weeks earlier when the well had been shut-in with the capping stack.
Risks associated with bullheading cement:
Bullheading cement into the well raised more critical concerns. As Mr. Campbell stated, no action should be undertaken that could “make final P&A [plug and abandonment] more problematic or create a situation in which all possible control and means of killing the well is eliminated.” The authors of this report expect that all responsible parties would agree with this statement.
The principal consideration as stated by Mr. Campbell was that the flow path(s) of fluids in the well were unknown (i.e. whether the flow was through the production casing, the annulus, or both). Also, it was unknown where the connection, or connections, between the annulus and the inside of the well were (e.g. shoe track or parted casing) and whether it might be different for different flow directions, (e.g. casing hanger sealing from above but not below). Therefore, the flow path and ultimate position of the cement pumped into the well could not be known. The position of the drillpipe in the well was also unknown, and it would likely be cemented into the well. These factors could have substantially complicated proper plug and abandonment of the Macondo well, and would have prevented use of the wellbore for a kill if later complications, such as a delay or problems in the relief well, occurred. Bullheading cement would also prevent use of diagnostics within the wellbore (e.g. bond, temperature, and noise logs or pressure tests through perforations) to confirm that the annulus had been properly killed and sealed. These concerns were explicitly provided to the Department of Energy science team that was advising Secretary of Energy Steven Chu. Specifically, the team was notified that “[t]he final position of any cement volume pumped is uncertain unless flow path and fluid swapping/fingering tendencies between the cement and the

18
other fluids in the well are well known. Cement around drillpipe or cement between the 9-7/8 x 7” and the other casings would significantly complicate proper [plug and abandonment] of the well” and related “revisions in plans that result in a less than rigorous [plug and abandonment], e.g. drillstring cemented in the well and some partially tested plugs” in the Macondo annulus would not represent actions in the best public interest.
A more serious concern was that the cement could have only partially blocked the flow path to the surface. This can occur when the set cement has permeability or leaks due to small channels, cracks, or microannuli. These small leaks cannot be filled with mud because they become temporarily plugged with the solids in mud but will allow gas or oil to flow up from below. It should be noted that liner top cement jobs that leak but are difficult to successfully repair due to the small flow paths through the cement are a widely recognized example of this type of problem. A long cement column in the well with this kind of leak would have prevented later attempts to fill the well with mud and use its hydrostatic pressure, i.e. with a riser margin as explained below, to inhibit resumption of the blowout if control with the capping stack was lost.
S: Common technique; successfully killed the well hydrostatically; multiple attempts possible with mud; cement successfully sealed well.
W: Does not guarantee a successful hydrostatic kill; bullheading cement can only be tried once unless intentionally overdisplaced; effectiveness of seal in annulus (if any) cannot be tested directly; does not provide any protection for leakage past the casing hanger seals.
O: Could be adapted to provide a means for hydrostatic control using a “riser margin” even if the BOP or capping stack were removed; potentially provides means for permanent cementing of the well.
T: Imposes maximum pressure on well components and may result in equipment failure or an underground blowout; cement placement is uncertain and may preclude more effective cementing.
Results of bullheading cement:
Bullheading cement was successful in preventing flow from the Macondo well into the sea as evidenced by the “ambient test.” The impact of this cement on the utility of the relief well and wellbore for plug and abandonment of the Macondo well and for providing the means to verify the effectiveness of that plugging have not been assessed. However, access to the inside of the Macondo well would be necessary to allow for a bond log of cement placement in the annulus and, if desired, perforating to conduct pressure tests on the seal in the annulus. Those would be conclusive methods to confirm that the well was sealed properly. It is the authors’ impression that the Macondo well was essentially “junked” by cementing the drillstring inside the well, which precluded those kinds of conclusive tests. In the authors’

19
experience, such tests were conducted prior to the final abandonment of other wells in comparable situations.
Alternative procedures available:
Multiple existing alternatives to bullheading cement could have provided more reliable barriers in the Macondo well until a relief well kill or other circulating kill was achieved. A specific recommendation that was provided to the Department of Energy team was to bullhead a denser mud into the well to provide a “riser margin,” i.e. an overbalance even in the event that the capping stack was removed or leaked. This would not have compromised future use of the wellbore in the ways described above.
A highly preferable alternative to cementing the well would have been to allow replacement of the Deepwater Horizon BOP stack by placing a bridge plug or storm packer in the wellhead housing. This could have been used in conjunction with the mud providing a riser margin to regain a second barrier. Note that no second barrier (in addition to cement) was present when the BOP was actually replaced. If the capping stack had been designed to include an annular preventer, i.e. a second barrier that would seal on pipe or wireline, rather than only blind shear rams, this barrier would have been in place during installation of the bridge plug or storm packer. Installation of a bridge plug or storm packer through a BOP stack has been a widely used approach for creating a second barrier before replacing the BOP stack.
COMMENTS ON SEVERAL KEY DECISIONS
Cutting the Riser Kink
It was very likely that the kink in the riser would ultimately become the location of the highest leak rate due to the significant pressure drop across the kink and the resulting heavy erosion which occurred at that location. It is the authors’ opinion that cutting the riser and starting with containment at the wellhead should be the first choice in a decision tree for blowout responses. An explanation for this conclusion follows, including reasons why containment efforts at locations further away from the wellhead are likely to be less effective.
Assume that the minimum leak rate with the riser kink intact is Qmin and the maximum rate without the kink is Qmax (i.e. the riser is removed or the kink has eroded to the point that it provides no resistance to flow). Also, assume the kink’s erosion is a linear deterioration process that happens over n days (see Figure 8). The shaded areas correspond to the cumulative oil volume leaked under two different scenarios (blue for riser erosion, green for cutting the riser and installing a positive flow connector). The key issue is that even if one option appears “worse” for a small duration, it could still be a desired solution in the overall strategy (in this case, minimizing the cumulative volume of leaked oil).

20
Figure 8: Schematic of flow rate over time to demonstrate the benefit of quickly establishing a positive flow connector at the wellhead. The blue shaded area represents flow volume if the riser remains and erodes; the green area represents flow volume if the riser is removed and a positive flow connector is installed.
If the riser remains and erodes, the total volume leaked during the n days would be (n/2)(Qmin + Qmax). Now consider the scenario of cutting the riser and attaching a positive flow connector with diversion capabilities upstream of the location of the kink (i.e. directly above the BOP stack). Assume that the process of cutting and installing the connector takes m days during which the leak flow rate is Qmax. Yet, once installed, any such connector can always provide similar backpressure to that exerted by the riser kink if the connector has controlled venting capabilities. The amount of total volume leaked during n days in this situation is ((n-m) Qmin +m Qmax). A simple comparison of these rates demonstrates that if m < n/2 then removing the riser decreases the amount of oil released. That is, if the riser will erode in two weeks, but it takes less than a week to cut the riser and install a flow diverter, the riser should not be left in place for longer than two weeks. Note that after n days, the riser kink, due to erosion, has a flow rate corresponding to Qmax while the positive connector could potentially bring the flow rate back to Qmin. The advantages offered by installation of a positive connector/diverter or capping stack far outweigh the risks of cutting the kinked riser, unless it is not possible to effectively connect the diverter or capping stack. Further, using the restriction from a capping stack or other positive connector with controlled venting capabilities could have helped a subsequent top kill procedure by providing greater back pressure (as was the intent of the junk shot).
Justification of assumed linear erosion rate:
Erosion is highly likely with large flow rates and reservoir drawdown (particularly if sand is present). Two extreme scenarios are: 1) the kink eroded very quickly due to high sand production shortly after the blowout (likely); and 2) kink erosion was slow due to little or no sand production (improbable). It is reasonable to use a linear erosion rate to approximate the average of these two scenarios.

21
Intermediate Casing Design Criterion
The currently accepted intermediate casing design criterion for “worst case” burst loads does not necessarily anticipate the scenario of shutting-in a well during a blowout. Partial “evacuation” with gas or an annulus filled with seawater after shut-in are common burst design considerations for intermediate casing. During the Macondo blowout, flow of hydrocarbons in the annular space between the production and intermediate casings was considered plausible. The shut-in pressure required to stop this flow was a critical factor in selecting well control and containment strategies. The intermediate (16”) casing design used in the Macondo well had a 6,920 psi burst rating, which was only slightly higher than the burst load of 6,668 psi that would be imposed by the anticipated shut-in wellhead pressure of 8,900 psi. Although this design rating posed problems during the effort to control the Macondo blowout, it satisfied the typical industry criterion for an intermediate casing design. It is therefore the current design criterion itself that does not anticipate post-blowout related burst loads being brought to bear on intermediate casings.
Most of the strategies for shutting-in the blowout were apparently considered to pose a serious risk of either damage to the 16” intermediate casing itself or a rupture disk failure. Either of these would have allowed hydrocarbons from the reservoir to flow into shallower formations and potentially broach to the seafloor. The risk of such an occurrence would have been much lower if the 16” casing and its associated rupture disks had been rated for a burst pressure sufficiently greater than the maximum pressure that might exist if one were to bullhead mud down the well after shutting-in a blowout. This would essentially involve making the design criterion for intermediate casing equivalent to the criterion for surface casing. Under this approach, intermediate casing would have a significantly higher burst pressure design (i.e. more conservative) than is currently used by many Gulf of Mexico operators.
Use of a more conservative design criterion for intermediate casing strings (including drilling liners) warrants further investigation (especially for wells where the impact of a casing failure could be more significant than in a typical shelf well). The specific question arising from the Deepwater Horizon accident is: Are there situations in which well conditions justify using intermediate casing designs based upon blowout burst loads?
ALTERNATE “WHAT-IF” ANALYSIS WITH THE BENEFIT OF HINDSIGHT
The information developed through BP’s eventually-successful shut-in of the Macondo well provides an opportunity to evaluate, using hindsight, what would have been the most logical course of action. This section of the report attempts to use this information not to criticize the steps taken, but to illuminate the role alternate decisions might have played.

22
What-if Scenario #1: Intermediate Casing Designed for Shutting-in a Blowout
Throughout the Macondo blowout response, there were key concerns that the rupture disks in the intermediate 16” casing had failed during the initial blowout or that they could fail due to the pressure imposed by shutting-in the well or other kill operations. If the intermediate casing string (specifically the 16” section) had been designed to contain the maximum possible burst load for shutting-in a blowout, this concern would have been less significant. Apparently, many key decisions were driven at least in part by this concern. These most likely include: 1) the selection of the maximum allowable wellhead pressure during top kill efforts; 2) the apparent reluctance in May and June to use a “shut-in” option, possibly because of concerns over failed rupture disks; and 3) the decision to bullhead cement from the surface once the bullhead (static) mud kill had apparently succeeded.
If the response team had confidence in the intermediate casing’s burst load capability, higher pump rates (resulting in higher pressures below the leaking BOP stack) may have been considered feasible during the top kill. Using the limited information provided about the top kill attempt, it is likely that a top kill using a pump rate of 109 bpm to generate 8,900 psi below the BOP stack for a prolonged period could have been successful. High pump rates do increase the risk of erosion in choke and kill lines. However, the integrity of these lines only had to be maintained for the duration that mud was pumped during the kill. Similarly, greater confidence in the intermediate casing’s capability to resist burst loads might have encouraged earlier use of a capping stack. It is clear that the likelihood of success for either of these approaches would have been high, because it is now known that the bullhead (static) kill used with the capping stack was successful.
What-if Scenario #2: Top Kill Failed Due to BOP Restriction Erosion
Before attempting the top kill, responders should have considered installing equipment, like the capping stack, that could be used to contain enough pressure to shut-in the well. In this scenario, the only reason for using loose-fitting oil capture and collection methods that do not seal the well is to reduce the amount of hydrocarbons released while tight-sealing equipment is prepared and installed.
The main weakness of a top kill approach is that it depends on a partially closed BOP stack to act as a flow restriction. If this restriction erodes due to the blowout flow and the mud pumped during the top kill, the operation might fail because sufficient pressure below the BOP stack cannot be generated no matter how fast the mud is pumped. If a top kill fails for this reason, the hydrocarbon flow rate after the attempt would most likely be higher than before. If the BOP stack were not providing a significant restriction to flow, there would be little advantage to leaving it in place. Some viable options to therefore consider would be: 1) rapidly installing a capping stack similar to the one that was used successfully; 2) unlatching the Deepwater Horizon’s LMRP and installing a BOP stack in its place; and 3) unlatching the entire Deepwater Horizon BOP stack and replacing it with a new BOP stack. It is now known that the capping stack approach (option 1) was successful, but it may

23
not have been as effective if the pressures required to shut-in the well were significantly higher than those observed. The capping stack was installed on the top of the Deepwater Horizon LMRP, which reduced the system’s allowable pressure limits. In addition, the capping stack apparently took a substantial amount of time to design, construct, and deploy since it was a custom-fabricated stack with a flanged type connection. The sole advantage to installing the capping stack above the LMRP was that only the back pressure provided by the riser kink had to be removed. That is to say that any back pressure provided by the BOP stack while the well was blowing out could remain in place while the capping stack was installed.
Because it is now known that the BOP latching system worked (as evidenced by the successful replacement of the BOP stack after the well was cemented), strong arguments can now be made for either unlatching the LMRP connection and replacing the LMRP with a new BOP stack (option 2) or completely replacing the BOP stack (option 3). Both of these options have significant advantages over the capping stack approach. These advantages are: 1) the BOP connections below the LMRP are rated to considerably higher pressures; 2) BOP stacks are designed to allow pipe and other tools to enter the well; and 3) replacement BOP stacks are more readily available than a custom made capping stack.
It is conceivable that if the equipment were on hand immediately after the failed top kill, and there was confidence in the BOP latching system, a replacement BOP could have been installed well before the capping stack was available. If this were done, the well could then have been shut-in and re-entered with pipe to circulate kill mud and run tools to evaluate wellbore integrity.
CONCLUSIONS The authors of this report would like to point out that the engineering approaches used by BP and the supervising government teams to successfully bring the Macondo blowout under control appear to be sound and should be recognized as such. In particular, the approach of pursuing multiple independent strategies in parallel and allocating monumental resources to stop the blowout should be acknowledged.
The major findings of this report are as follows:
1. The cofferdam failed due to buoyancy from lighter hydrocarbons trapped inside the dome after hydrates plugged the flow path. As designed, it would not have worked even absent hydrate blockage given the well’s flow rate and fluid properties. The cofferdam approach requires further development for application to irregular leak sources that preclude use of a sealing connection.
Hydrates plugged the flow path at the top of the dome causing it to fill with light hydrocarbons and rendering it buoyant. Filling the cofferdam with a synthetic base drilling fluid or methanol before lowering it over the leak could have reduced the risk of almost immediate hydrate formation.

24
The ratio of the cofferdam’s weight to its volume was a critical design factor. In fact, the weight-volume ratio was not large enough to overcome the buoyancy force if the dome was completely filled with hydrocarbons. This is significant because the flow rate out of the riser most likely exceeded the collection capability of the Enterprise to which the dome was attached, thus ensuring that the cofferdam would fill with hydrocarbons and become buoyant even absent hydrate problems.
2. Top kill attempts failed due to the limited flow-rate capacity design of the mud pumping system. There would have been a reasonable chance of success if the kill fluid were pumped at rates higher than 109 bpm; albeit, such rates would have increased risks to BOP stack integrity.
There were two key reasons the top kill attempt proved to be unsuccessful and failed to bring the blowout under control. The first and perhaps most decisive reason was the 80 bpm pumping rate limitation for the system that was deployed. The response team did not appear to consider that the blowout rate could be greater than 13,000 bbls/day. Because of this, the pumps and piping deployed to pump mud into the BOP stack was under-sized. Second, the failed top kill attempt supplied useful data about the hydrocarbon flow rate and the flow restriction then being provided by the BOP stack. Modeling the BOP stack restriction using a choke-performance relationship for pressure drop and flow rate can provide a reasonable estimate of 55,880 bbls/day for the well flow rate at the time of the top kill. Further, similar calculations can generate an estimate for the required pumping rate for top kill to have been successful given that flow rate (109 bpm in order to generate a wellhead pressure value of 8,900 psi).
It is likely that a higher pump rate top kill option was not considered due to concerns about the BOP stack and well casing integrity. There was considerable uncertainty regarding the actual flow rate. Therefore, top kill contingencies for much higher flow rates should have been considered, or at least reconsidered, after the initial failure.
3. Removal of the riser to allow a sealed connection for collecting and/or stopping the flow should have been given stronger consideration for early implementation versus the non-sealing attempts at collection from the riser leaks.
A key guiding principle for the response teams throughout the containment effort was “don’t make it worse.” It appears as though this principle caused the teams to eliminate from further consideration any option that temporarily increased the flow rate. One option that there is no evidence was even considered was re-entering the well and performing a bottom kill. A positive connector with flow diversion capability and an annular preventer (as described in Conclusion 4 below) would have been able to provide flow resistance similar to the riser kink and would have allowed for several different well intervention strategies. The cumulative amount of leaking oil would have been reduced if the riser could have been removed and another positive connector installed in half of the time in which the riser would have eroded to the point that it no longer exerted any back pressure.

25
It is possible that, if the BOP stack had been removed and replaced with a new BOP stack immediately after the unsuccessful top kill attempts, the well could have been brought under control within the first weeks of June. This argument is supported by the fact that the BOP stack was successfully unlatched and replaced after the Macondo well was cemented. Flow-rate modeling would be required to determine if less oil would have been discharged into the sea if the BOP stack had been removed and replaced prior to the bullhead (static) kill, but the simple analysis included herein demonstrates the potential reduction, rather than increase, in leak volumes if a sealing response is rapidly deployed.
4. A capping stack with direct vertical access well intervention capabilities is the most desirable containment mechanism when the potential exists to latch and seal it to the well.
The capping stack that was attached to the Deepwater Horizon BOP stack both stopped the flow from the well and contained its pressure. The stack was comprised of three blind shear rams. Provisions were also in place to allow hydrocarbon collection through the choke and kill lines in the event that the well could not be capped because of concerns about its integrity. It is significant to note that no provisions were made to allow direct vertical access into the BOP and wellbore through the capping stack. Additional equipment, such as an annular preventer, could have been added into the top portion of the capping stack to allow tools to be lowered from the ocean’s surface through the stack, the BOP, and into the well. Direct access could have made it possible to clear obstructions in the BOP stack and lower pipe and tools into the well. These tools could have then been used to determine if there were leaks in the well below the seabed while the well was shut-in. Running pipe through the capping stack into the well would have allowed kill mud to be circulated to the bottom of the well for a conclusive bottom kill.
5. The post bullhead (static) kill cement job should have been deferred until more certain control of the flow path, cement placement, and cement evaluation were possible. Use of a bridge plug or storm packer to allow BOP replacement before cementing would have been more pragmatic.
Following the bullhead (static) mud kill, cement was then bullheaded into the well. This operation was successful in preventing flow from the Macondo well into the sea as evidenced by the subsequent “ambient test.” However, the impact of this cement on the utility of the relief well and the Macondo wellbore for plug and abandonment and for providing the means to verify the effectiveness of that plugging are unknown. The conclusive pressure tests and methods to verify cement placement in the Macondo annulus that would have otherwise been possible were apparently prevented by this bullhead cement job.
There are several alternatives to bullheading cement that could have provided reliable barriers in the Macondo well until a relief well kill or other circulating kill was achieved. One possibility would have been to follow the initial bullhead (static) mud kill with a denser mud to provide a “riser margin,” i.e. an overbalance in the event that the capping stack was removed or leaked. This option would not have

26
compromised future use of the wellbore, as bullheading cement did. Another, preferable alternative to bullheading cement would have been placing a bridge plug or storm packer into the wellhead housing. This could have been used in conjunction with the mud providing a riser margin to regain a second barrier. Further, if the capping stack had been designed to include an annular preventer, all operations conducted on the well after pumping the mud with a riser margin could have been conducted with two barriers in place (i.e. the capping stack and riser margin). Replacement of the BOP stack could then have been performed after installing a bridge plug or storm packer. This would have both been safer than the approach used and would have subsequently allowed full utility of the Macondo well itself for relief well killing, cementing, and then conclusively evaluating the seals in the well.
6. The current practices for intermediate casing design, which do not require accounting for the maximum pressures corresponding to shutting-in a blowout, should be re-evaluated in light of the risks involved in each particular case.
Most of the strategies for shutting-in the blowout were apparently considered to pose a serious risk of damage to the 16” intermediate casing or to rupture disks in that casing. Either would allow hydrocarbons to flow from the well into shallower formations and potentially broach to the seafloor. If the intermediate casing string had been designed to contain the maximum possible burst load for shutting-in a blowout, this concern would not have had the significance that it did. Therefore, use of a more conservative design criterion for intermediate casing strings (including drilling liners) warrants further investigation, especially for wells where the impact of a casing failure could be more significant than in a typical shelf well.

27
GLOSSARY Bridge Plug A mechanical plug that can be installed inside a well, typically in the
casing, to seal off the portion of the well below the bridge plug. The plug is typically placed, run in the well, and set using drillpipe or an electric wireline. The plug may be left permanently in the well or may be retrieved or drilled out.
Cased Hole The portion of a well that has had casing run and cemented in place to protect and isolate the wellbore and formations behind the casing from continued operations inside the well.
Cement Bond Log
“A representation of the integrity of the cement job, especially whether the cement is adhering solidly to the outside of the casing. The log is typically obtained from one of a variety of sonic-type tools. The newer versions, called cement evaluation logs, along with their processing software, can give detailed, 360-degree representations of the integrity of the cement job, whereas older versions may display a single line representing the integrated integrity around the casing.” (http://www.glossary.oilfield.slb.com/)
Circulating Kill
A circulating kill requires two flow paths down to and up from a depth in close proximity to or below the kicking/flowing formation. A common example of a circulating kill is using pipe positioned near the bottom of a well to pump kill mud into the wellbore while returns are taken up the annular flow path. Another less common example of a circulating kill is using a relief well to pump kill mud into a blowout well in close proximity to the flowing formation with the return flow path being the blowout well itself.
Flow Rate
Flow rate is a generic term that describes the volumetric rate of flow of a fluid anywhere in a hydraulic system (pipe, well, choke, pump).
Hysteresis “Phenomenon in which the response of a physical system to an external influence depends not only on the present magnitude of that influence but also on the previous history of the system. Expressed mathematically, the response to the external influence is a doubled-valued function; one value applies when the influence is increasing, the other applies when the influence is decreasing (Path-dependent states).” (http://www.reference.com/browse/hysteresis)
IADC Wellcap
The International Association of Drilling Contractors Well Control Accreditation Program is called WellCAP. (http://www.iadc.org/wellcap.htm)

28
Kick Zone
The kick zone is a permeable formation that is allowing, or has allowed, fluids from the formation (a kick) to enter the well due to the hydrostatic pressure in the well being less than the formation pressure.
Open Hole The portion of a well where the hole that has been drilled has not been covered with casing, i.e. the uncased portion of the well. This is typically the portion of the well currently being drilled below a previously set casing string.
Perforation Any hole penetrating a pipe or the wall of the well-hole. Most often, a hole penetrating through the production casing or liner and the cement into a productive formation to allow flow only from that formation into a well. Most perforating is done with shaped charges, called jet perforating guns, but other methods can be used, especially when it is only necessary to make a hole in the pipe.
Riser Margin
The increase in mud weight that is necessary to overbalance formation pressures if the riser is removed, which reduces the hydrostatic pressure in the well.
Storm Packer
“A heavy-duty retrievable packer assembly that can be run in to isolate the wellbore of a new well in the event of suspended activities, for example, during a severe storm. An on-off disconnect feature enables the storm packer to be set at a safe depth while using the weight of the string below the packer to maintain the set and hang off the drill string to avoid pulling all the way out of the hole.” (http://www.glossary.oilfield.slb.com/)
Washout A hole, typically caused by erosion, in a pressure-containing component of a well or hydraulic flow system. A leak in the drillpipe or drill collars is typically referred to as a washout.
Zero Net Liquid Flow Holdup
“The phenomenon of accumulation of liquid in the well until a constant fraction of the well is occupied by liquid with gas flowing through it and no liquid is being carried over to the surface is known as Zero Net Liquid Flow (ZNLF) holdup.” (http://etd.lsu.edu/docs/available/etd-0418102-111522/unrestricted/Flores-Avila_dis.pdf)

29
APPENDIX A: MACONDO WELL SCHEMATIC