analysis of the efficiency and profitability of the ... papers describe research in progress by the...
TRANSCRIPT
WP/08/63
Analysis of the Efficiency and Profitability of the Japanese Banking
System
Elena Loukoianova


© 2008 International Monetary Fund WP/08/63 IMF Working Paper Monetary and Capital Markets Department
Analysis of the Efficiency and Profitability of the Japanese Banking System1
Prepared by Elena Loukoianova
Authorized for distribution by Cheng Hoon Lim March 2008
Abstract
This Working Paper should not be reported as representing the views of the IMF. The views expressed in this Working Paper are those of the author(s) and do not necessarily represent those of the IMF or IMF policy. Working Papers describe research in progress by the author(s) and are published to elicit comments and to further debate.
The paper analyzes the efficiency and profitability of Japanese banks from 2000-06. It uses a non-parametric approach, the data envelopment analysis (DEA) to analyze banks’ cost and revenue efficiency. The results show that the performance of Japanese banks has steadily improved since 2001, but there are significant differences within the banking sector, with regional banks being less cost and revenue efficient relative to both City and Trust banks. While Japanese bank profitability is low compared to that in other advanced countries, there is considerable potential for efficiency gains, particularly through increased cost-sharing arrangements among regional banks, consolidation of regional banks with major or other regional banks, and the creation of bank consortia to pool resources for asset and risk management. JEL Classification Numbers: G21 Keywords: Banking, Banking systems, Profitability, Japan Author’s E-Mail Address: [email protected]
1 This paper builds on work published in the 2007 Selected Issues Paper on Japan, http://www.imf.org/external/pubs/cat/longres.cfm?sk=21260.0. The author is grateful to Gianni de Nicolo, Todd Groome, Kenneth Kang, Cheng Hoon Lim, Mark O’Brien, Hung Tran, Francisco Vazquez, and other colleagues at the IMF for useful discussions and comments. Kiran Sastry and Graham Colin-Jones provided invaluable research and editorial assistance.
2
Contents Page
I. Introduction ............................................................................................................................3
II. Brief Literature Review.........................................................................................................4
III. Performance of Japanese Banks...........................................................................................5
IV. Assessing Efficiency: An Application of Data Envelopment Analysis.............................10
V. Efficiency Analysis: A Cross-Country Perspective ............................................................13
VI. Profitability Analysis .........................................................................................................16
VII. Conclusions and Policy Considerations ...........................................................................22 References ...............................................................................................................24 The Basic Input-Oriented DEA Problem ................................................................26 Measure of Total Factor Productivity – An Output-Oriented Malmquist Index.....28
Tables Table 1. Japan: Non-Performing Loans and Credit Costs of Regional Banks...........................6 Table 2. Japan: Indicators of Banks Performance, 2005 ...........................................................8 Table 3. Indicators of Banks Performance in Comparator Countries, 2005..............................9 Table 4. Income per Branch and Employee in Comparator Countries, 2005. ...........................9 Table 5. Japan: Cost and Revenue Efficiency Scores, 2005....................................................11 Table 6. List of Sampled Bank Segments in Comparator Countries .......................................14 Table 7. Efficiency Estimates for Large Banks, 2005. ............................................................15 Table 8. Cross-Country Estimates of Cost and Revenue Efficiency by Bank Segments, 2003.16 Table 9. Return on Assets , 1999-2005....................................................................................18 Table 10. Return on Equity, 1999-2005...................................................................................19 Table 11. Net Interest Margin, 1999-2005...............................................................................19 Table 12. Return Volatility, 1999-2005...................................................................................21 Figures Figure 1. Japan: Shares of Deposits and Loans of Private Financial Institutions......................6 Figure 2. Japan: Performance Indicators of Japanese Banks, 2000-05......................................7 Figure 3. Japan: Unit Revenue and Net Income, 2000-05.........................................................8 Figure 4. Japan: Evolution of Total Factor Productivity, 2000-05. .........................................13 Figure 5. Japan: Breakdown of Core Profit, 2000-06.1...........................................................17 Figure 6. Japan: Z-Index by Bank Segment, 2001-05. ............................................................20 Figure 7. Z-Index in Comparator Countries, 1999-2005. ........................................................22 References................................................................................................................................24 Appendixes Appendix I. Data Envelopment Analysis (DEA) Methodology ..............................................26 Appendix II. Integrating Arrangements for Regional Banks in Selected European Countries31

3
I. INTRODUCTION
Although the health of the Japanese banking system has improved, its profitability remains weak. Banks recorded high profit levels in FY2006, but this was largely due to one-time reversal of loan loss allowances. Excluding this volatile component, profitability remains low, as net interest margins continue to decline and remain below those in other developed countries.2 Thus, enhancing core profitability remains an important challenge for banks.
This paper analyzes the efficiency and profitability of Japanese banks from 2000-06. The paper uses data envelopment analysis (DEA) to analyze the cost and revenue efficiency of Japanese banks. The results of this analysis and other profitability indicators suggest some possible reasons for the low profitability of Japanese banks. The paper then compares this level of profitability with that of banks in other major industrial countries.
The analysis in this paper demonstrates that the overall performance of Japanese banks has steadily improved since 2001, but there are significant differences within the banking sector. Efficiency analysis indicates that both groups of regional banks appear to be inefficient both in terms of cost and revenue relative to City and Trust banks. Moreover, total factor productivity of both groups of regional banks has been flat over the last six years. Performance indicators reinforce those findings: Trust banks demonstrate the highest profitability in terms of return on assets and equity, while both groups of regional banks perform worse than City and Trust banks. The differences in the performance of the various bank segments reflect their underlying characteristics, the size of the banks, and most importantly, their business mix. In particular, most regional banks are small in size and function as the main banking service providers within particular geographical regions.
Japanese banks appear to be relatively efficient compared to their peers in selected industrial countries. However, some performance indicators suggest that there is room for improvement, since their performance in terms of income and profitability is still low by international standards.
The paper proceeds as follows. Section II provides a helicopter tour of the literature on the analysis of profitability and efficiency of the Japanese banking sector. Section III analyzes the performance of the four segments of the Japanese banks―City banks, member banks of the Regional Bank Association of Japan,3 member banks of the Second Association of Regional Banks, 4 and Trust banks. Then it compares the performance of the Japanese
2 Bank of Japan, 2007.
3 Hereafter Regional banks.
4 Hereafter, Tier II regional banks.
4
banking system with those of selected industrial countries―France, Germany, Spain, Switzerland, the U.K., and the US. Section IV estimates the efficiency of the four bank segments of the Japanese banking system using the data envelopment analysis (DEA), including changes in total factor productivity over time. Section V compares the efficiency of the Japanese banks with that of banks in the same set of selected industrial countries. In section VI, the paper examines standard profitability indicators for Japanese banks and provides a cross-country comparison. Finally, in section VII the paper proposes policy actions on how to improve efficiency and boost the profitability of banks in Japan.
II. BRIEF LITERATURE REVIEW
There has been relatively little academic research undertaken on the profitability and cost efficiency of Japanese banks, especially for the post-1996 period. Most studies have focused on the use of parametric and non-parametric techniques to analyze cost and overall technical efficiency of Japanese banks.5 Fukuyama (1993) found that the majority of big (City) banks operated close to their minimum efficiency scale. However, Altunbas (2000) showed that, taking into account the risk and quality factors, the Japanese banking sector demonstrated diseconomies of scale and the optimal size of banks should be smaller than it was at that time. In contrast, smaller Japanese banks appeared to have potentially significant economies of scale (Drake and Hall, 2001). Separately, IMF (2006) found that the low profitability of the Japanese banking sector is largely due to low revenues rather than high costs. Therefore, IMF (2006) recommended that policies should increasingly focus on promoting a more profitable environment for private banks, with the following key priorities: (i) ensuring that past balance sheet problems do not reemerge; (ii) broadening the range of products and services; (iii) taking steps to enhance bank governance; and (iv) leveling the playing field with government financial institutions (GFOs). In addition, Oyama and Shiratori (2001) suggested that Japanese banks should (i) improve their profitability by better loan pricing; (ii) expand the banks’ payable market; and (iii) improve corporate governance by exposing banks to greater market discipline.
In contrast to the previous studies, this paper utilizes data for the financial year 2005-06 to offer a fresh perspective on the cost and revenue efficiency of Japanese banks. Similar to most previous studies, this paper utilizes a non-parametric approach, the DEA. However, unlike Drake and Hull (2001), this paper uses the number of employees for sub-sectors of Japanese banks, which makes the results of the DEA more accurate, as the price of labor is taken into account directly. To shed new light on recent developments, the paper also focuses on the comparison of the efficiency and profitability of the various sub-sectors of banks in Japan and other advanced countries for 2003, which has not been done by previous studies.
5 Fukuyama, 1993; McKillop, 1996; Altunbas, 2000; Oyama and Shiratori, 2001); Drake and Hall, 2003; and IMF, 2006.

5
In addition, the paper performs the DEA exercise for the largest financial groups in Japan and some advanced countries.
III. PERFORMANCE OF JAPANESE BANKS
The Japanese banking sector essentially consists of 12 major and internationally oriented banks and more than a hundred much smaller regional banks. Major banks are split into two segments, City banks and Trust banks. Regional banks are divided into two associations, Regional Bank Association of Japan and the Second Association of Regional Banks.6 All regional banks have been operating as commercial banks since 1989.
• City banks operate as commercial banks, offering banking services mainly to large corporate customers. They operate across a wide spectrum of financial activities, dominating most segments in the domestic market, and some are also active internationally.
• Trust banks specialize in asset and wealth management, including providing advice and asset management services for pension funds. In addition, they are active in the real estate loan market.
• Regional banks focus their business mainly on retail banking in specific geographical areas. More than 80 percent of the loan customers of regional banks are local small and medium size enterprises (SMEs); and individual deposits account for approximately 70 percent of all the deposits. Regional banks function as the main financial service providers in the regions, accepting deposits and financing, providing payment services, and offering international and security services―such as retail sales of government bonds and mutual funds.7
• Tier II regional banks, which belong to the Second Association of Regional Banks, are smaller institutions that also focus their business on banking in specific geographical areas. Since their principal mission is to contribute to the region’s social and economic development, emphasis is placed on meeting the financial needs of local individuals, corporations, SMEs, and public-sector bodies.
6 Originally, member banks of the Second Association of Regional Banks were established as joint stock companies under the Sogo Bank Law of 1951 and were referred as “Sogo Banks.” Over time, they started to operate similarly to commercial banks and started to convert to regional banks. Although the converted regional banks carry out exactly the same operations as the original regional banks, their origins differ. As a result, the new regional banks have set up their own Second Association of Regional Banks independently of the Regional Banks Association of Japan.
7 Regional Banks Association of Japan, 2007.

6
City banks have the largest share of the market in terms of deposits and loans—at about 33 percent and 35 percent respectively (Figure 1), followed by the two groups of regional banks combined. The share of nonperforming loans (NPLs) in total loans has been declining in both groups of regional banks (Table 1), although it tends to be higher than that of major banks because of their higher proportionate exposure to SMEs.
Figure 1. Japan: Shares of Deposits and Loans of Private Financial Institutions (March 31, 2006) 1
Deposits Loans
Regional banks 23.0%
City banks 32.8%
USD 7,158 billion
Tier II regional banks 6.5%
Shinkin banks 13.0%
Financial institutions for agriculture,
forestry, and fishery 10.9%
Others 13.8%
USD 4,673 billion
Regional banks 25.6%
City banks 34.6%
Tier II regional banks 7.5%
Shinkin banks 7.2%
Financial institutions for agriculture,
forestry, and fishery 7.3%
Others 13.6%
Source: Bank of Japan. 1 Shinkin banks (founded in 1951) are cooperative financial institutions, with membership composed of local residents and small and medium-sized companies (with less than 300 employees).
Table 1. Japan: Non-Performing Loans and Credit Costs of Regional Banks
Mar-02 Mar-03 Mar-04 Mar-05 Mar-06 Sep-06
Regional banks
NPLs/Loans 7.69 7.69 6.92 5.52 4.49 4.30 Credit costs/Average loans (bp) 111 82 119 50 41 34
Tier II regional banks
NPLs/Loans 8.91 8.90 7.39 6.34 5.28 5.04 Credit costs/Average loans (bp) 120 110 75 74 n.a. n.a.
Sources: Regional Banks Association of Japan; The Second Association of Regional Banks.
(Percent)
Performance varies significantly by bank segment (Figure 2 and Table 2). City banks and Trust banks had the highest return on equity (ROE) and assets (ROA) respectively. On the other hand, Regional and Tier II regional banks had the lowest ROA and ROE, reflecting their poorer asset quality, limited product range, and smaller volumes. Revenue and net income per bank employee and per branch also varied considerably across bank segments. Both groups of regional banks showed much lower revenue and net income per bank employee and per branch than their major counterparts, as they provide mainly banking services through their wide branch networks. A significant decline in the cost-to-income ratio

7
since 2002 indicates recent improvements in the profitability of the Japanese banking system; however, this ratio still remains high by international standards.
Figure 2. Japan: Performance Indicators of Japanese Banks, 2000-05. (Percent)
Return on Assets Return on Equity
-1.2
-1.0
-0.8
-0.6
-0.4
-0.2
0.0
0.2
0.4
0.6
0.8
2000 2001 2002 2003 2004 2005
System averageCity BanksRegional banksTier II regional banksTrust Banks
-50
-40
-30
-20
-10
0
10
20
2000 2001 2002 2003 2004 2005 2006
System average
City Banks
Regional banks
Tier II regional
Interest Income to total Operating Income Net Interest Income to Total Assets
20
30
40
50
60
70
80
90
2000 2001 2002 2003 2004 2005
System average
City banks
Regional banks
Tier II regional banks
Trust banks
0.0
0.5
1.0
1.5
2.0
2.5
2000 2001 2002 2003 2004 2005
System average
City banks
Regional banks
Tier II regional banks
Trust banks
Total Expenses to Assets Ratio Cost-to-Income Ratio
1.0
1.5
2.0
2.5
3.0
3.5
4.0
4.5
5.0
2000 2001 2002 2003 2004 2005
System averageCity BanksRegional banksTier II regional banksTrust Banks
40
60
80
100
120
140
160
2000 2001 2002 2003 2004 2005
System averageCity BanksRegional banksTier II regional banksTrust Banks
Sources: IMF, Global Financial Stability Report; Japanese Bankers Association; and IMF staff calculations.
8
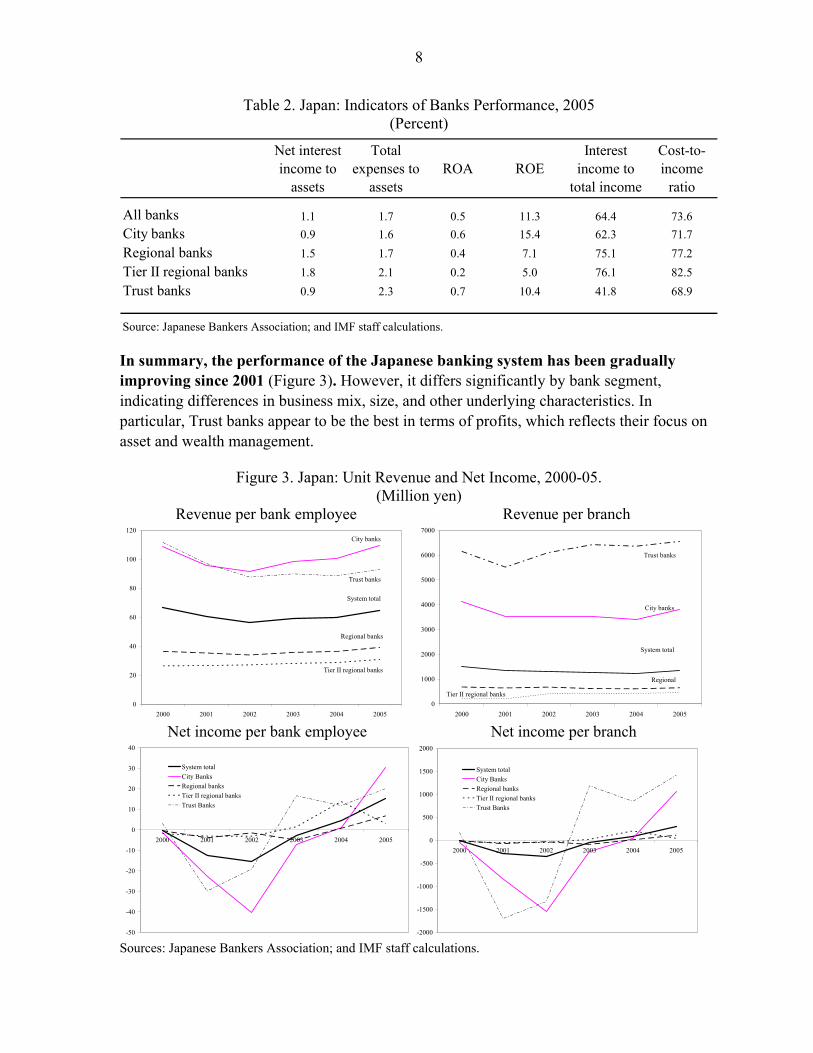
Table 2. Japan: Indicators of Banks Performance, 2005 (Percent)
Net interest income to
assets
Total expenses to
assetsROA ROE
Interest income to
total income
Cost-to-income
ratio
All banks 1.1 1.7 0.5 11.3 64.4 73.6City banks 0.9 1.6 0.6 15.4 62.3 71.7Regional banks 1.5 1.7 0.4 7.1 75.1 77.2Tier II regional banks 1.8 2.1 0.2 5.0 76.1 82.5Trust banks 0.9 2.3 0.7 10.4 41.8 68.9
Source: Japanese Bankers Association; and IMF staff calculations.
In summary, the performance of the Japanese banking system has been gradually improving since 2001 (Figure 3). However, it differs significantly by bank segment, indicating differences in business mix, size, and other underlying characteristics. In particular, Trust banks appear to be the best in terms of profits, which reflects their focus on asset and wealth management.
Figure 3. Japan: Unit Revenue and Net Income, 2000-05. (Million yen)
Revenue per bank employee Revenue per branch
0
20
40
60
80
100
120
2000 2001 2002 2003 2004 2005
System total
City banks
Trust banks
Regional banks
Tier II regional banks
0
1000
2000
3000
4000
5000
6000
7000
2000 2001 2002 2003 2004 2005
System total
City banks
Trust banks
Regional
Tier II regional banks
Net income per bank employee Net income per branch
-50
-40
-30
-20
-10
0
10
20
30
40
2000 2001 2002 2003 2004 2005
System totalCity BanksRegional banksTier II regional banksTrust Banks
-2000
-1500
-1000
-500
0
500
1000
1500
2000
2000 2001 2002 2003 2004 2005
System totalCity BanksRegional banksTier II regional banksTrust Banks
Sources: Japanese Bankers Association; and IMF staff calculations.
9
Both groups of regional banks tend to have higher than average interest income in the total income, reflecting their characteristics of targeting specific geographical areas with wide branch networks and their focus on retail banking and providing lending to SMEs and public-sector bodies. Also, Tier II regional banks state their principal mission as being to contribute to the social and economic development of the Japanese regions.
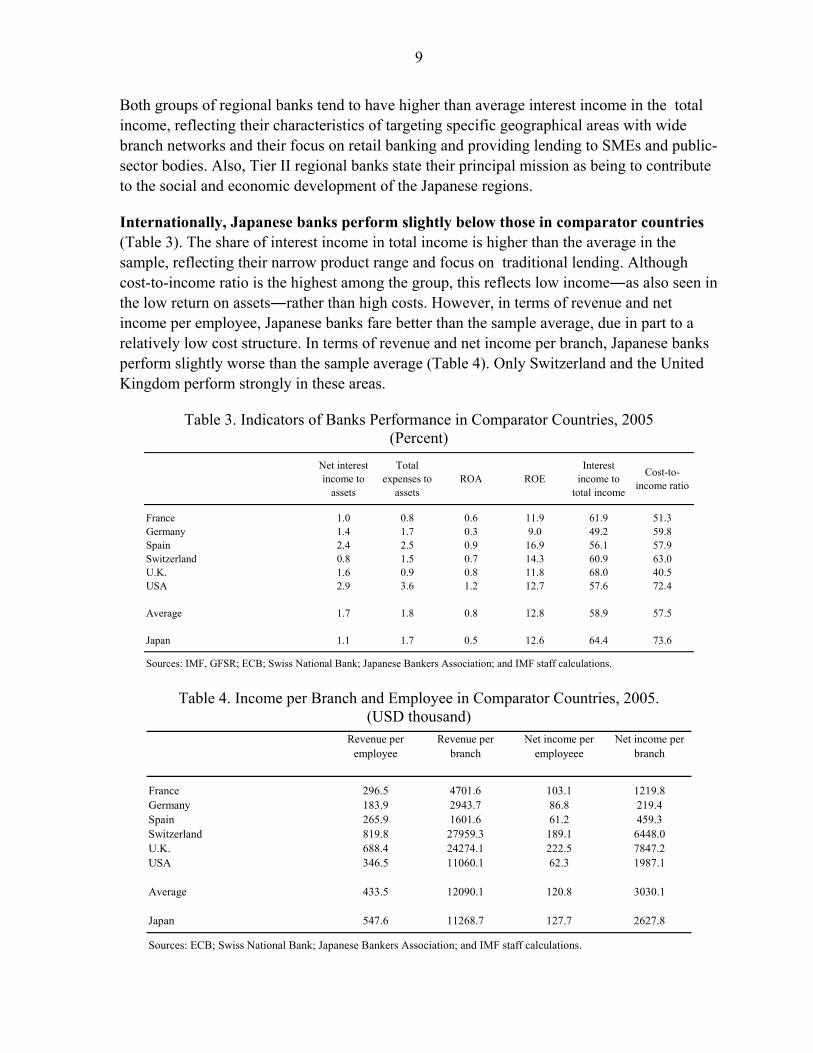
Internationally, Japanese banks perform slightly below those in comparator countries (Table 3). The share of interest income in total income is higher than the average in the sample, reflecting their narrow product range and focus on traditional lending. Although cost-to-income ratio is the highest among the group, this reflects low income―as also seen in the low return on assets―rather than high costs. However, in terms of revenue and net income per employee, Japanese banks fare better than the sample average, due in part to a relatively low cost structure. In terms of revenue and net income per branch, Japanese banks perform slightly worse than the sample average (Table 4). Only Switzerland and the United Kingdom perform strongly in these areas.
Table 3. Indicators of Banks Performance in Comparator Countries, 2005 (Percent)
Net interest income to
assets
Total expenses to
assetsROA ROE
Interest income to
total income
Cost-to-income ratio
France 1.0 0.8 0.6 11.9 61.9 51.3Germany 1.4 1.7 0.3 9.0 49.2 59.8Spain 2.4 2.5 0.9 16.9 56.1 57.9Switzerland 0.8 1.5 0.7 14.3 60.9 63.0U.K. 1.6 0.9 0.8 11.8 68.0 40.5USA 2.9 3.6 1.2 12.7 57.6 72.4
Average 1.7 1.8 0.8 12.8 58.9 57.5
Japan 1.1 1.7 0.5 12.6 64.4 73.6
Sources: IMF, GFSR; ECB; Swiss National Bank; Japanese Bankers Association; and IMF staff calculations.
Table 4. Income per Branch and Employee in Comparator Countries, 2005. (USD thousand)
Revenue per employee
Revenue per branch
Net income per employeee
Net income per branch
France 296.5 4701.6 103.1 1219.8Germany 183.9 2943.7 86.8 219.4Spain 265.9 1601.6 61.2 459.3Switzerland 819.8 27959.3 189.1 6448.0U.K. 688.4 24274.1 222.5 7847.2USA 346.5 11060.1 62.3 1987.1
Average 433.5 12090.1 120.8 3030.1
Japan 547.6 11268.7 127.7 2627.8
Sources: ECB; Swiss National Bank; Japanese Bankers Association; and IMF staff calculations.

10
IV. ASSESSING EFFICIENCY: AN APPLICATION OF DATA ENVELOPMENT ANALYSIS
This section uses data envelopment analysis (DEA) to examine the efficiency of the Japanese banking system. The DEA is a linear programming technique for evaluating performance and benchmarking in a multivariate setting. 8 The methodology uses information on the input-output combination of individual entities to construct an efficiency frontier enveloping the data. This frontier is then used to measure the efficiency of the individual entities relative to a benchmark entity, chosen by the model. The DEA produces efficiency estimates without a priori functional restrictions on the underlying production processes.9 By duality, the DEA can be used to assess either cost or revenue efficiency, depending on the setup. Cost efficiency looks at how banks use their inputs to produce a given level of outputs. Revenue efficiency examines how much output banks can produce using the same inputs. The results of the DEA depend on two conditions: (i) the technologies used by individual banks have to be comparable, i.e. they have to be dedicated to similar activities; and (ii) the set of inputs and outputs must adequately reflect the nature of their business activity.
The DEA exercises conducted for the Japanese banking system use the sets of inputs and outputs aimed at capturing the nature of banking activities. Four banking segments were covered—City banks, Trust banks, and both groups of regional banks. The choice of inputs and outputs followed the bank intermediation approach,10 which assumes that banks intermediate funds between depositors and borrowers at the lowest possible cost. Here, the framework assumes that banks use three inputs to produce three outputs. The outputs consist of (i) loans and bills discounted, (ii) trading and investment securities, and (iii) core operating profit. The first two represent a considerable part of banks’ assets and are customary to the literature. 11 The third, core operating profit, is defined as a sum of net interest income and net non-interest income, less general and administrative expenses, and its inclusion is justified by the recent emphasis on the improving profitability of the Japanese banks. The inputs include (i) deposits, (ii) number of employees, and (iii) number of bank branches. Deposits affect bank profitability, and bank branches is a proxy for measuring banks’ distribution network.
The corresponding input and output prices were estimated using Japanese banks’ aggregated unconsolidated financial statements.12 Output prices were estimated by
8 See Appendix I for a description of the DEA framework; and Fare, Grosskopf, and Lovell (1994), Zhu (2003) for detailed presentations of the DEA methodology.
9 In other words, the analysis does not require specifying a production function or a profit-maximization model for generating its results.
10 Sealey and Lindley, 1977.
11 Sealey and Lindley, 1977.
12 Financial statements of the Japanese banks are provided by the Japanese Bankers Association.

11
dividing (i) interest income by the amount of loans; (ii) non-interest income by the amount of trading and investment securities; and (iii) and operating income by the interest and fee generating volume of transactions. Input prices were estimated by dividing (i) interest expenses by the amount of total deposits, (ii) total personnel expenses by the number of employees, and (iii) other general and administrative expenses by the number of bank branches.
The results indicate that in FY2005 Japanese banks exhibited higher revenue efficiency than cost efficiency (Table 5).13 The efficiency scores here are in percent with a score below 100 indicating that the bank segment is relatively less efficient than the benchmark (which by definition has a score of 100). For cost efficiency as measured under the constant return to scale (CRS), Japanese banks as a whole have an average score of 69 percent, implying that the average gap between their observed input-output combinations and the efficient frontier is 31 percent. There are two benchmark segments, City banks and Trust banks. However, both groups of regional banks were well below the benchmark in terms of cost efficiency (44 percent of the benchmark level for Regional banks and 32 percent for the Tier II regional banks). Average revenue efficiency for the entire system under the CRS was estimated slightly higher at 87.8 percent, implying an efficiency gap of only 12.2 percent. Similar to cost efficiency results, City and Trust banks were more revenue efficient than both groups of regional banks.
Table 5. Japan: Cost and Revenue Efficiency Scores, 2005 (Percent)
Score RTS Score RTS
Constant Return to Scale
City banks 100.0 - 100.0 -Regional banks 44.1 IRS 76.5 DRSTier II regional banks 31.7 IRS 74.9 DRSTrust Banks 100.0 - 100.0 -
Mean 69.0 87.8
Variable Return to Scale
City banks 100.0 100.0Regional banks 44.8 92.0Tier II regional banks 38.2 81.3Trust Banks 100.0 100.0
Mean 70.8 93.3
Sources: Japanese Bankers Association; and IMF staff calculations.Based on DEA exercise with three outputs: loans, trading and investment securities, and core profit; and three inputs: personnel, number of branches, and deposits.
Cost efficiency Revenue Efficiency
13 The results were computed using end-FY2005 data aggregated by bank segments, and thus indicative of their respective averages.

12
The results suggest that both groups of regional banks have significant potential for improving efficiency. A closer examination shows that compared to City and Trust banks, regional banks are using more personnel and branches to attain the observed output. In other words, with the present mix, these banks could produce more, if they utilized their inputs more efficiently. In addition, in the cost efficiency exercise, regional banks are estimated to be operating under the increasing return to scale (IRS), suggesting that they are too small to exploit scale economies. These findings are not entirely surprising, since both groups of regional banks tend to be populated by small institutions. This also indicates that there is potential for them to increase the volume of their operations through merging with other regional banks or major―City and Trust―banks. At the same time, the findings are understandable, given that regional banks operate under institutional constraints originating from their unique role in the regions, some degree of public ownership, their social mandate, and their overall role for regional development in Japan. Also, their branch network may be influenced by geographic outreach goals, linked to social considerations and restricted to some extent by the demographics, as older generations prefer to visit a branch or speak to a bank employee, rather than use internet banking.
Total factor productivity (TFP) in the Japanese banking system improved during the period 2000-05 (Figure 4).14 In addition to estimating efficiency, the DEA can also be applied to measure the evolution of productivity over time, i.e. total factor productivity. Overall TFP was estimated to have improved by about 9 percent over the period, with City banks experiencing the biggest improvement of around 25 percent, followed by Trust banks—about 16 percent. On the other hand, TFP of both groups of regional banks was flat and even declined slightly by about 1 percent for Regional banks and about 4 percent for Tier II regional banks.
The relative inefficiency of regional banks, as well as their stagnant growth in TFP, suggests significant potential gains could be achieved from further consolidation and cost-sharing arrangements. Mergers, either among regional banks or with City and Trust banks, could improve cost efficiency and profitability by lowering operating costs. At the same time, regional banks could benefit from developing further cost-sharing arrangements, for example by outsourcing and centralizing some bank operations.
14 The time evolution of TFP was assessed using a Malmquist productivity index (see Appendix I for a description of the methodology) using annual data for 2000-05.

13
Figure 4. Japan: Evolution of Total Factor Productivity, 2000-05. (Cumulative Malmquist productivity index, 2000=100)
0.7
0.9
1.1
1.3
1.5
2000 2001 2002 2003 2004 2005
City banks
Regional banksSystem average
Tier II regional banks
Source: Japanese Bankers Association; and IMF staff calculations.
Trust Banks
V. EFFICIENCY ANALYSIS: A CROSS-COUNTRY PERSPECTIVE
This section presents a cross-country assessment of cost and revenue efficiency. It uses information for banking sectors in six industrial countries―France, Germany, Spain, Switzerland, the United Kingdom, and the United States. Two exercises were conducted using data from the financial statements of: (i) two to five of the largest (in terms of assets) internationally active banks in each country, 15 and (ii) banks from different bank segments, including at the regional level (Table 6).16 For Japan, the three largest financial groups whose financial statements were used in the first exercise were Mitsubishi UFJ Financial Group, Mizuho Financial Group, and Sumitomo Mitsui Financial Group. The DEA specification used here is almost the same as in the previous section, but data on trading and investment securities were replaced with total securities due to data limitations. All financial data in the OECD database were converted into U.S. dollars at end-2003 market exchange rates.
15 Consolidated financial statements of bank groups for end-2005 are taken from the Bank Scope database. The number of branches for some banks was taken from individual bank financial statements or estimated from the best publicly available information.
16 The data were gathered from the OECD Banking Statistics for 2003 (the most recent information). The institutions included only resident banks, including their domestic and foreign branches and domestic subsidiaries, but excluding foreign subsidiaries.
14
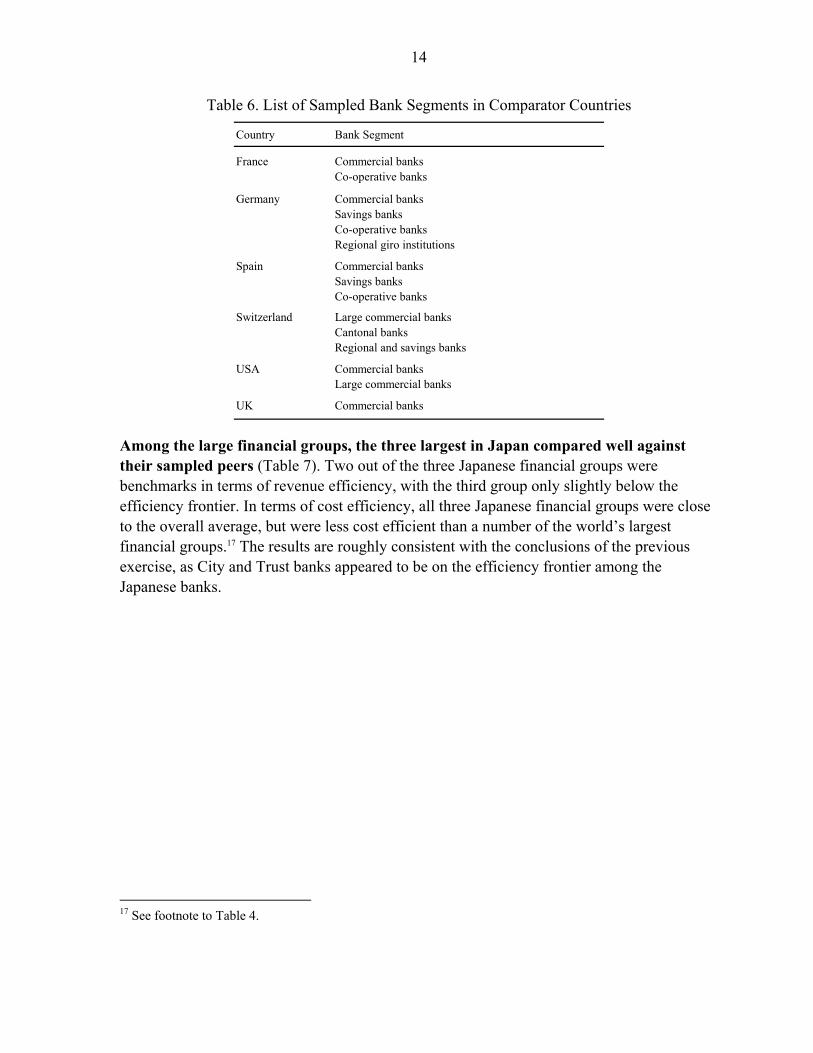
Table 6. List of Sampled Bank Segments in Comparator Countries
Country Bank Segment
France Commercial banksCo-operative banks
Germany Commercial banksSavings banksCo-operative banksRegional giro institutions
Spain Commercial banksSavings banksCo-operative banks
Switzerland Large commercial banksCantonal banksRegional and savings banks
USA Commercial banksLarge commercial banks
UK Commercial banks
Among the large financial groups, the three largest in Japan compared well against their sampled peers (Table 7). Two out of the three Japanese financial groups were benchmarks in terms of revenue efficiency, with the third group only slightly below the efficiency frontier. In terms of cost efficiency, all three Japanese financial groups were close to the overall average, but were less cost efficient than a number of the world’s largest financial groups.17 The results are roughly consistent with the conclusions of the previous exercise, as City and Trust banks appeared to be on the efficiency frontier among the Japanese banks.
17 See footnote to Table 4.

15
Table 7. Efficiency Estimates for Large Banks, 2005. (Percent)
Banks
Score RTS Score RTS
Barclays Plc 0.654 DRS 0.577 DRSUBS AG 1 0.511 IRS 1.000 -HSBC Holdings Plc 1.000 - 0.844 DRSCitigroup Inc 1.000 - 1.000 -BNP Paribas 1.000 - 1.000 -Royal Bank of Scotland Plc (The) 0.942 DRS 0.740 DRSBank of America Corporation 0.950 IRS 0.906 DRSCrédit Agricole S.A. 0.955 IRS 0.635 DRSJP Morgan Chase & Co. 0.859 IRS 0.887 DRSDeutsche Bank AG 0.889 DRS 0.376 DRSSociété Générale 0.847 IRS 0.790 IRSSantander Central Hispano Group-Banco Santander Central Hispano 0.993 DRS 0.540 DRSCredit Suisse 0.487 IRS 0.443 IRSBayerische Hypo-und Vereinsbank AG 0.984 DRS 0.914 IRSDresdner Bank AG 0.567 IRS 0.614 IRSCommerzbank AG 0.661 IRS 0.692 IRSBanco Bilbao Vizcaya Argentaria SA 0.920 DRS 0.400 IRSCaja de Ahorros y Pensiones de Barcelona, LA CAIXA 1.000 - 0.519 IRS
Average 0.845 0.715
Kabushiki Kaisha Mitsubishi UFJ Financial Group-Mitsubishi UFJ Financial Group Inc 0.750 DRS 1.000 -Mizuho Financial Group 0.817 DRS 1.000 -Sumitomo Mitsui Financial Group, Inc 0.809 DRS 0.911 IRS
Japanese average 0.792 0.970
Total average 0.838 0.752
Sources: Bank Scope database; Japanese Bankers Association; and IMF staff calculations.
Cost Efficiency Revenue Efficiency
1 Number of bank branches includes number of branches in Switzerland and worldwide subsidiaries, and does not include branches in other countires. Therefore, it can be underestimated, which affects its cost efficiency estimate..
Based on DEA exercise with three outputs: loans, trading and investment securities, and core profit; and three inputs: personnel, number of branches, and deposits.
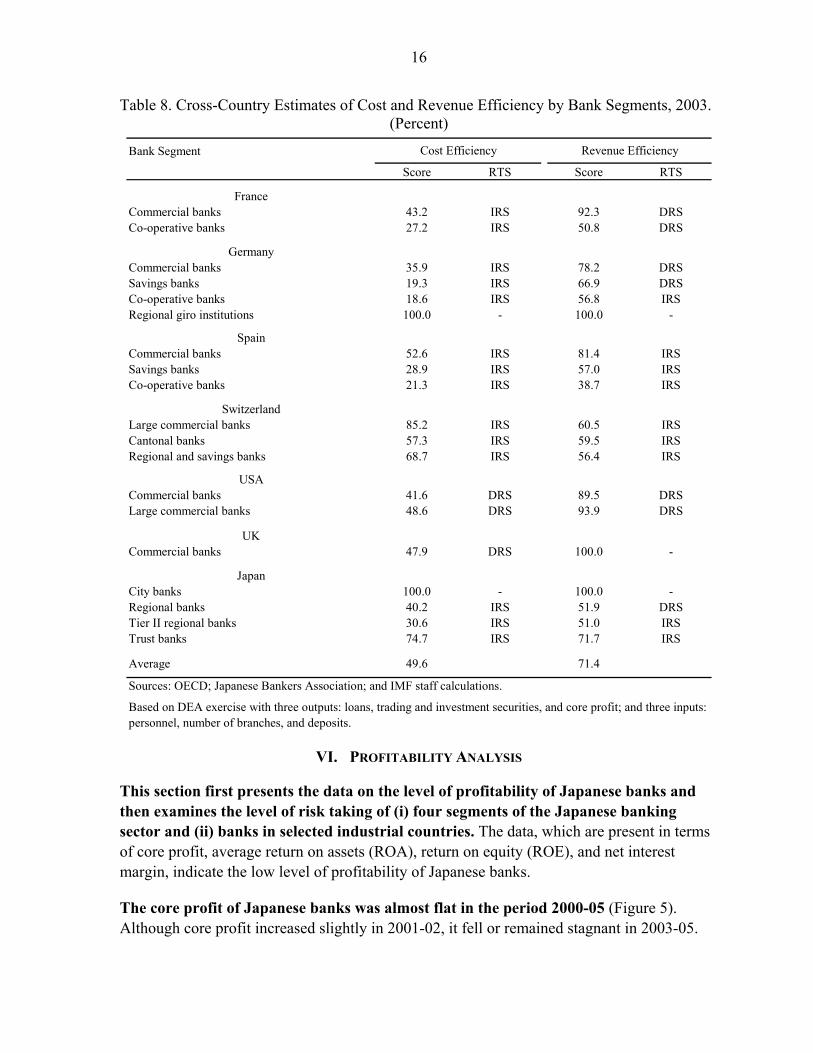
By banking segment, Japanese City and Trust banks compare well against their sampled peers, while both groups of regional banks were below average in terms of cost and revenue efficiency (Table 8). The results are consistent with the previous findings, as City banks are found to be the benchmark in the cross-country exercise, while Trust banks scored well above the total average. Both groups of Japanese regional banks were slightly more efficient than German and Spanish savings and co-operative banks, but less efficient than Swiss and German regional banks in terms of both cost and revenue.
16
Table 8. Cross-Country Estimates of Cost and Revenue Efficiency by Bank Segments, 2003. (Percent)
Bank Segment
Score RTS Score RTS
FranceCommercial banks 43.2 IRS 92.3 DRSCo-operative banks 27.2 IRS 50.8 DRS
GermanyCommercial banks 35.9 IRS 78.2 DRSSavings banks 19.3 IRS 66.9 DRSCo-operative banks 18.6 IRS 56.8 IRSRegional giro institutions 100.0 - 100.0 -
SpainCommercial banks 52.6 IRS 81.4 IRSSavings banks 28.9 IRS 57.0 IRSCo-operative banks 21.3 IRS 38.7 IRS
SwitzerlandLarge commercial banks 85.2 IRS 60.5 IRSCantonal banks 57.3 IRS 59.5 IRSRegional and savings banks 68.7 IRS 56.4 IRS
USACommercial banks 41.6 DRS 89.5 DRSLarge commercial banks 48.6 DRS 93.9 DRS
UKCommercial banks 47.9 DRS 100.0 -
JapanCity banks 100.0 - 100.0 -Regional banks 40.2 IRS 51.9 DRSTier II regional banks 30.6 IRS 51.0 IRSTrust banks 74.7 IRS 71.7 IRS
Average 49.6 71.4
Sources: OECD; Japanese Bankers Association; and IMF staff calculations.
Based on DEA exercise with three outputs: loans, trading and investment securities, and core profit; and three inputs: personnel, number of branches, and deposits.
Cost Efficiency Revenue Efficiency
VI. PROFITABILITY ANALYSIS
This section first presents the data on the level of profitability of Japanese banks and then examines the level of risk taking of (i) four segments of the Japanese banking sector and (ii) banks in selected industrial countries. The data, which are present in terms of core profit, average return on assets (ROA), return on equity (ROE), and net interest margin, indicate the low level of profitability of Japanese banks.
The core profit of Japanese banks was almost flat in the period 2000-05 (Figure 5). Although core profit increased slightly in 2001-02, it fell or remained stagnant in 2003-05.

17
All three components of core profit—net interest income, net non-interest income, and general and administrative expenses—remained largely unchanged during the period.
Figure 5. Japan: Breakdown of Core Profit, 2000-06.1 (Percent of Assets)
-1.5
-1.0
-0.5
0.0
0.5
1.0
1.5
2.0
2000 2001 2002 2003 2004 2005 2006
General and adminstrative expensesNet non-interest incomeNet interest incomeCore profit
1 The data for the first half of FY2006 have been annualized by simply doubling the values for that period.
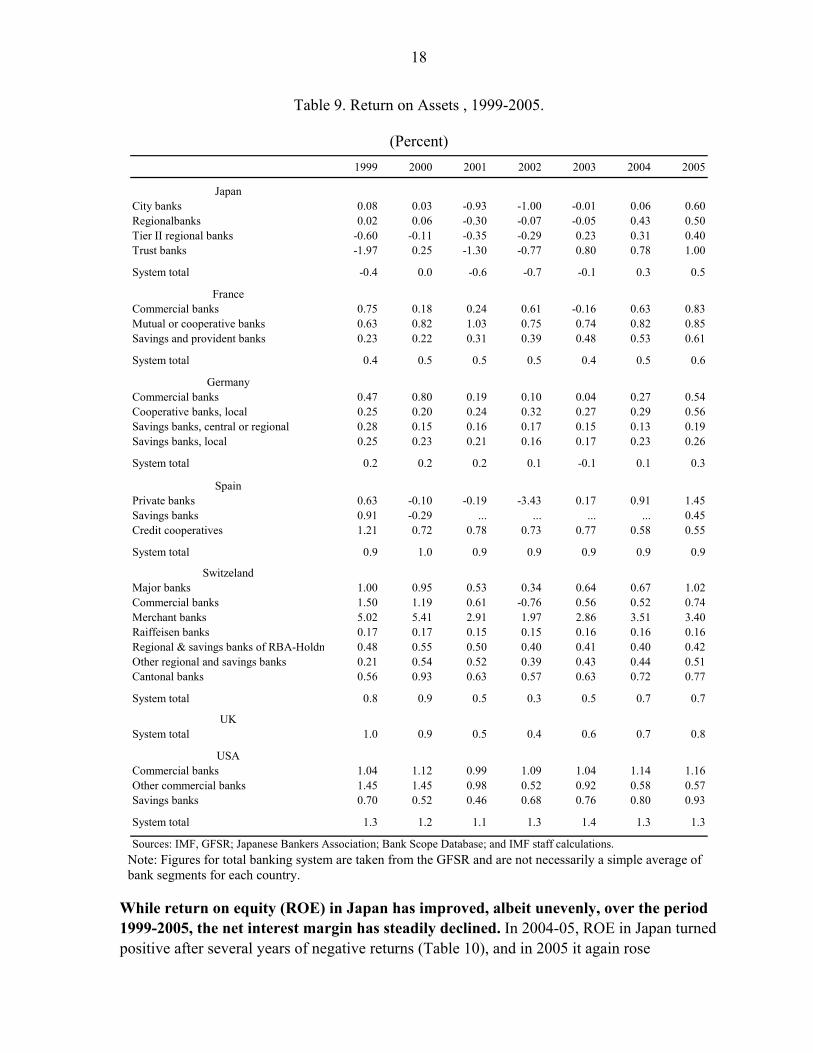
In 2005, the overall average ROA of Japanese banks was below that of banks in other industrial countries, except Germany (Table 9). By banking segment, the ROA of City banks was lower than that of commercial banks in the United States, the United Kingdom, and other industrial countries, while the ROA of Trust banks was comparable with that of large banks elsewhere. With the exception of comparable banks in Germany and Switzerland, the Japanese regional banks have a lower ROA than their peers.18 The comparison suggests that a stronger focus on asset and wealth management, as is the case in other industrial countries, could raise the profitability of Japanese regional banks.
18 Note that the DEA efficiency analysis, which compared Japanese banks with those of other countries, was based on the OECD data for 2003. ROA of Regional banks in Japan was negative in 2003. The ROA of Tier II regional banks in Japan was lower than that of regional and cantonal banks in Switzerland and local cooperative banks in Germany.
18
Table 9. Return on Assets , 1999-2005.
(Percent) 1999 2000 2001 2002 2003 2004 2005
JapanCity banks 0.08 0.03 -0.93 -1.00 -0.01 0.06 0.60Regionalbanks 0.02 0.06 -0.30 -0.07 -0.05 0.43 0.50Tier II regional banks -0.60 -0.11 -0.35 -0.29 0.23 0.31 0.40Trust banks -1.97 0.25 -1.30 -0.77 0.80 0.78 1.00
System total -0.4 0.0 -0.6 -0.7 -0.1 0.3 0.5
FranceCommercial banks 0.75 0.18 0.24 0.61 -0.16 0.63 0.83Mutual or cooperative banks 0.63 0.82 1.03 0.75 0.74 0.82 0.85Savings and provident banks 0.23 0.22 0.31 0.39 0.48 0.53 0.61
System total 0.4 0.5 0.5 0.5 0.4 0.5 0.6
GermanyCommercial banks 0.47 0.80 0.19 0.10 0.04 0.27 0.54Cooperative banks, local 0.25 0.20 0.24 0.32 0.27 0.29 0.56Savings banks, central or regional 0.28 0.15 0.16 0.17 0.15 0.13 0.19Savings banks, local 0.25 0.23 0.21 0.16 0.17 0.23 0.26
System total 0.2 0.2 0.2 0.1 -0.1 0.1 0.3
SpainPrivate banks 0.63 -0.10 -0.19 -3.43 0.17 0.91 1.45Savings banks 0.91 -0.29 ... ... ... ... 0.45Credit cooperatives 1.21 0.72 0.78 0.73 0.77 0.58 0.55
System total 0.9 1.0 0.9 0.9 0.9 0.9 0.9
SwitzelandMajor banks 1.00 0.95 0.53 0.34 0.64 0.67 1.02Commercial banks 1.50 1.19 0.61 -0.76 0.56 0.52 0.74Merchant banks 5.02 5.41 2.91 1.97 2.86 3.51 3.40Raiffeisen banks 0.17 0.17 0.15 0.15 0.16 0.16 0.16Regional & savings banks of RBA-Holdn 0.48 0.55 0.50 0.40 0.41 0.40 0.42Other regional and savings banks 0.21 0.54 0.52 0.39 0.43 0.44 0.51Cantonal banks 0.56 0.93 0.63 0.57 0.63 0.72 0.77
System total 0.8 0.9 0.5 0.3 0.5 0.7 0.7
UKSystem total 1.0 0.9 0.5 0.4 0.6 0.7 0.8
USACommercial banks 1.04 1.12 0.99 1.09 1.04 1.14 1.16Other commercial banks 1.45 1.45 0.98 0.52 0.92 0.58 0.57Savings banks 0.70 0.52 0.46 0.68 0.76 0.80 0.93
System total 1.3 1.2 1.1 1.3 1.4 1.3 1.3
Sources: IMF, GFSR; Japanese Bankers Association; Bank Scope Database; and IMF staff calculations. Note: Figures for total banking system are taken from the GFSR and are not necessarily a simple average of bank segments for each country.
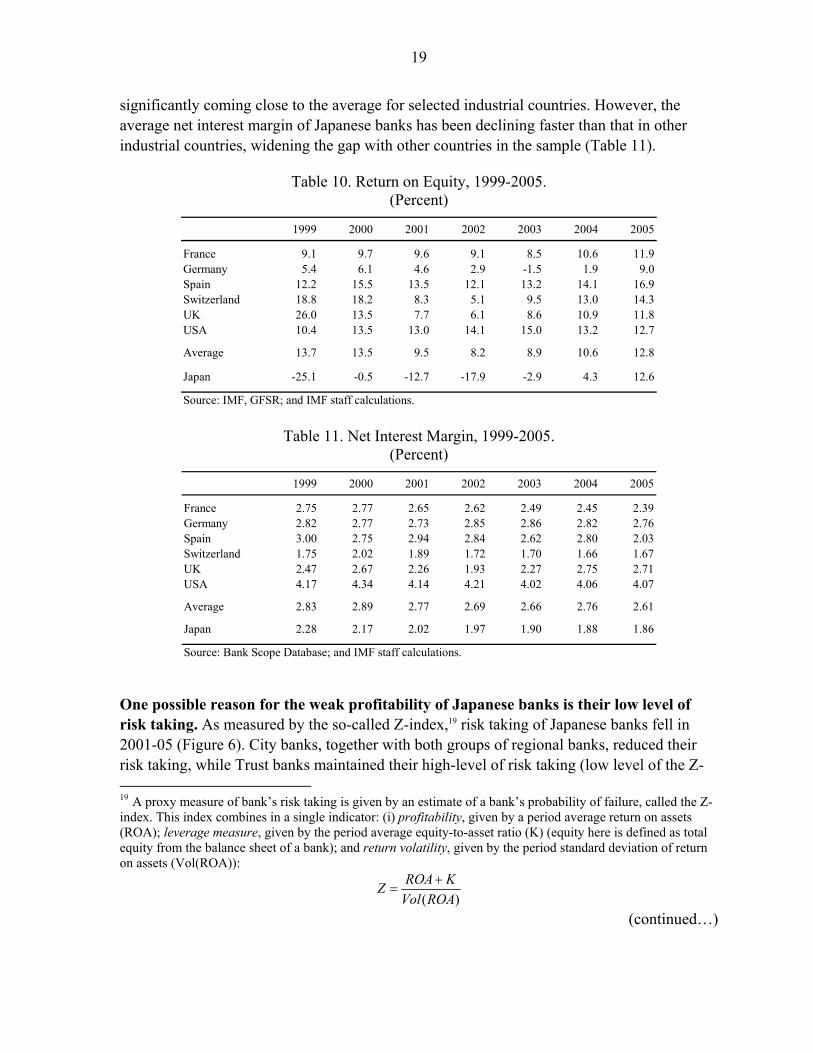
While return on equity (ROE) in Japan has improved, albeit unevenly, over the period 1999-2005, the net interest margin has steadily declined. In 2004-05, ROE in Japan turned positive after several years of negative returns (Table 10), and in 2005 it again rose
19
significantly coming close to the average for selected industrial countries. However, the average net interest margin of Japanese banks has been declining faster than that in other industrial countries, widening the gap with other countries in the sample (Table 11).
Table 10. Return on Equity, 1999-2005. (Percent)
1999 2000 2001 2002 2003 2004 2005
France 9.1 9.7 9.6 9.1 8.5 10.6 11.9Germany 5.4 6.1 4.6 2.9 -1.5 1.9 9.0Spain 12.2 15.5 13.5 12.1 13.2 14.1 16.9Switzerland 18.8 18.2 8.3 5.1 9.5 13.0 14.3UK 26.0 13.5 7.7 6.1 8.6 10.9 11.8USA 10.4 13.5 13.0 14.1 15.0 13.2 12.7
Average 13.7 13.5 9.5 8.2 8.9 10.6 12.8
Japan -25.1 -0.5 -12.7 -17.9 -2.9 4.3 12.6
Source: IMF, GFSR; and IMF staff calculations.
Table 11. Net Interest Margin, 1999-2005. (Percent)
1999 2000 2001 2002 2003 2004 2005
France 2.75 2.77 2.65 2.62 2.49 2.45 2.39Germany 2.82 2.77 2.73 2.85 2.86 2.82 2.76Spain 3.00 2.75 2.94 2.84 2.62 2.80 2.03Switzerland 1.75 2.02 1.89 1.72 1.70 1.66 1.67UK 2.47 2.67 2.26 1.93 2.27 2.75 2.71USA 4.17 4.34 4.14 4.21 4.02 4.06 4.07
Average 2.83 2.89 2.77 2.69 2.66 2.76 2.61
Japan 2.28 2.17 2.02 1.97 1.90 1.88 1.86
Source: Bank Scope Database; and IMF staff calculations.
One possible reason for the weak profitability of Japanese banks is their low level of risk taking. As measured by the so-called Z-index,19 risk taking of Japanese banks fell in 2001-05 (Figure 6). City banks, together with both groups of regional banks, reduced their risk taking, while Trust banks maintained their high-level of risk taking (low level of the Z- 19 A proxy measure of bank’s risk taking is given by an estimate of a bank’s probability of failure, called the Z-index. This index combines in a single indicator: (i) profitability, given by a period average return on assets (ROA); leverage measure, given by the period average equity-to-asset ratio (K) (equity here is defined as total equity from the balance sheet of a bank); and return volatility, given by the period standard deviation of return on assets (Vol(ROA)):
( )ROA KZ
Vol ROA+
=
(continued…)

20
index) reflecting in part a higher volatility of their returns on assets with their focus on asset and wealth management (Table 12).
Figure 6. Japan: Z-Index by Bank Segment, 2001-05.
0
2
4
6
8
10
12
14
2001 2002 2003 2004 2005Source: Japanese Bankers Association; Bank Scope Database; and IMF staff calculations.
City banks
Regional banks Tier II regional banks
Trust banks
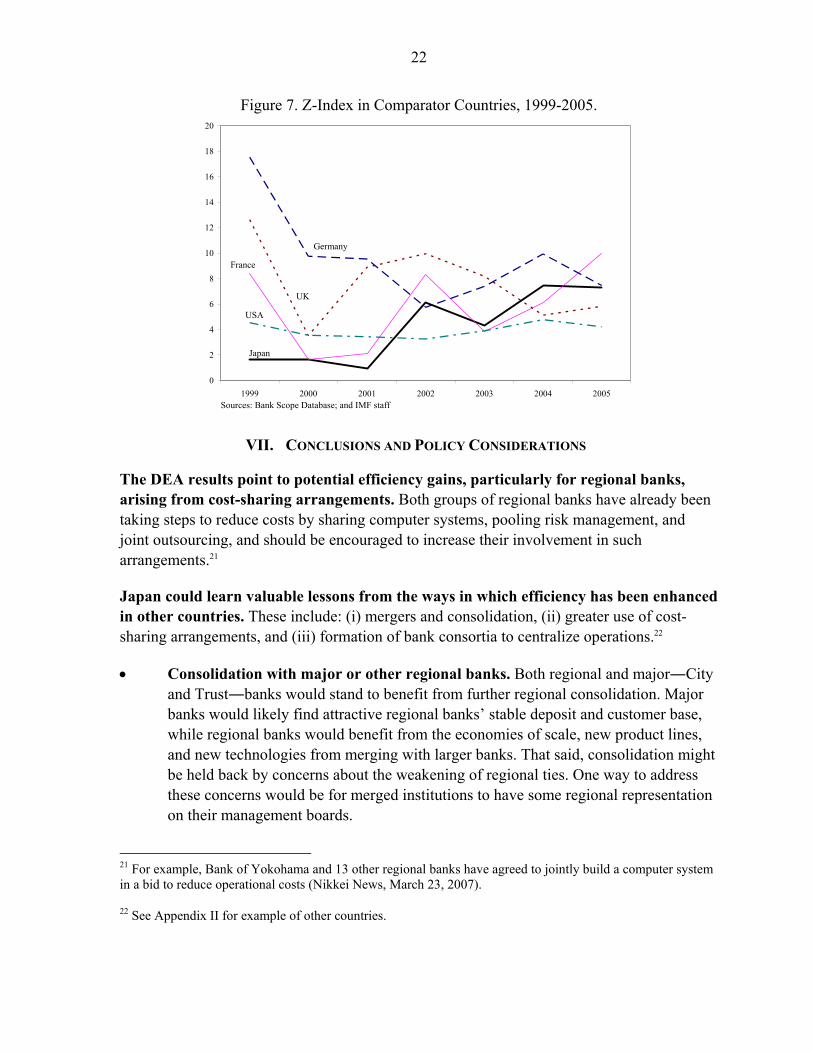
Compared to other industrial countries, the Japanese banking system exhibited an average Z-index level in 2002-05 (Figure 7). In 2005, banks in the United Kingdom and the United States exhibited higher degrees of risk taking (lower Z-index level) compared to Japan. Overall, this suggests that banks in the above mentioned countries may be assuming a higher risk profile than those in Japan by offering a wider range of banking products, using more sophisticated products on a bigger scale, and being more involved in asset and wealth management.
Likewise, Japanese banks would likely benefit from greater diversification of their products and activities and a further deepening of Japanese capital markets. To some extent, the narrow product range of Japanese banks reflects the features of the Japanese financial system. Compared to other industrial countries, corporations rely less on capital markets for their financing needs, while individual investors hold a larger share of their wealth as bank deposits. Banks in other countries with more vibrant capital markets engage in a wider range of activities, including greater securitization of their loan books, and offer more sophisticated deposit and savings products. However, the markets for more sophisticated financial products are growing, for example, in asset-backed securities and real estate investment trusts. Continued development of these markets could help banks to improve their product mix and overall profits.20
The Z-index increases with profitability and equity capital as percent of assets, and decreases with return volatility. Thus, a larger value of the Z-index indicates a lower risk profile for a bank (De Nicolo et al., 2003). 20 IMF, 2005.

21
Table 12. Return Volatility, 1999-2005. (Percent)
1999 2000 2001 2002 2003 2004 2005
JapanCity Banks 0.15 0.20 0.75 1.09 1.91 0.66 0.35Regional Banks 0.53 0.67 0.68 0.49 2.34 0.45 0.51Regional II Banks 2.83 2.36 4.33 0.67 0.36 0.58 0.70Trust Banks 7.08 5.12 7.06 3.22 7.58 5.46 4.31
Average 2.64 2.09 3.21 1.37 3.05 1.79 1.47
FranceCommercial Banks 1.40 7.62 6.16 1.75 3.94 2.31 1.40Mutual or Cooperative Banks 0.31 0.52 0.55 0.33 0.36 0.26 0.25Savings and Provident Banks 0.13 0.18 0.13 0.15 0.16 0.15 0.14
Average 0.61 2.77 2.28 0.74 1.49 0.90 0.60
GermanyCommercial Banks 1.02 1.82 2.01 3.46 2.54 1.98 2.50Cooperative Banks, local 0.17 0.33 0.27 0.31 0.21 0.24 0.64Savings Banks, central or regional 0.21 ... ... ... ... ... ...Savings Banks, local 0.14 0.23 0.14 0.23 0.33 0.28 0.20
Average 0.39 0.79 0.81 1.33 1.03 0.83 1.11
SpainPrivate Banks 1.25 2.19 3.64 12.21 3.44 1.71 2.01Savings Banks 0.10 ... ... ... ... ... ...Credit Cooperatives 0.10 0.29 0.34 0.39 0.37 0.35 0.13
Average 0.48 1.24 1.99 6.30 1.91 1.03 1.07
SwitzelandMajor Banks 0.34 0.56 0.43 0.57 0.34 0.35 0.09Commercial Banks 1.45 1.64 1.20 2.88 0.39 0.65 0.64Merchant Banks 5.53 3.75 4.15 2.49 2.50 5.09 4.36Raiffeisen Banks 0.08 0.16 0.08 0.09 0.09 0.08 0.09Regional & Savings Banks of RBA_Hold 0.28 0.32 0.22 0.19 0.16 0.19 0.27Other Regional and Savings Banks 1.01 0.19 0.15 0.15 0.19 0.18 0.14Cantonal Banks 0.22 1.33 0.23 0.24 0.25 0.28 0.27
Average 1.27 1.14 0.92 0.95 0.56 0.97 0.84
UKBanks 1.52 5.93 2.45 2.15 3.04 4.11 3.50
USACommercial Banks 2.89 3.74 3.67 4.01 3.41 2.80 3.29Cooperative Banks 0.77 0.86 0.73 ... ... ... ...Savings Banks 2.55 3.58 4.39 4.53 4.13 3.37 3.29
Average 2.07 2.73 2.93 4.27 3.77 3.08 3.29
Sources: Bank Scope Database; and IMF staff calculations.
22
Figure 7. Z-Index in Comparator Countries, 1999-2005.
0
2
4
6
8
10
12
14
16
18
20
1999 2000 2001 2002 2003 2004 2005
Japan
USA
Germany
UK
France
Sources: Bank Scope Database; and IMF staff
VII. CONCLUSIONS AND POLICY CONSIDERATIONS
The DEA results point to potential efficiency gains, particularly for regional banks, arising from cost-sharing arrangements. Both groups of regional banks have already been taking steps to reduce costs by sharing computer systems, pooling risk management, and joint outsourcing, and should be encouraged to increase their involvement in such arrangements.21
Japan could learn valuable lessons from the ways in which efficiency has been enhanced in other countries. These include: (i) mergers and consolidation, (ii) greater use of cost-sharing arrangements, and (iii) formation of bank consortia to centralize operations.22
• Consolidation with major or other regional banks. Both regional and major―City and Trust―banks would stand to benefit from further regional consolidation. Major banks would likely find attractive regional banks’ stable deposit and customer base, while regional banks would benefit from the economies of scale, new product lines, and new technologies from merging with larger banks. That said, consolidation might be held back by concerns about the weakening of regional ties. One way to address these concerns would be for merged institutions to have some regional representation on their management boards.
21 For example, Bank of Yokohama and 13 other regional banks have agreed to jointly build a computer system in a bid to reduce operational costs (Nikkei News, March 23, 2007).
22 See Appendix II for example of other countries.

23
• Development of cost-sharing arrangements. To reduce costs, smaller banks could outsource bank operations and develop centralized arrangements, for example, for risk management, information sharing, etc. Regional banks could also rely more on internet banking to reduce personnel and other administrative costs. For example, cantonal banks in Switzerland developed expertise and production centers for credit card services, training, and information technology to lower costs.
• Creation of bank consortia to pool resources for asset and risk management. This could improve efficiency by raising the scale of operations and expanding the range of investments. Centralized risk management could help regional banks to diversify their product mix, as in the case of Switzerland where cantonal banks have been jointly issuing a variety of bonds as well as working together in pension fund management.
These measures could help regional banks prepare for changes in the banking system that are likely to raise pressure for consolidation. The privatization of Japan Post in October 2007, whose branch networks overlap with those of regional banks, and growing interest by major and foreign banks to broaden their branch networks is likely to generate greater interest in regional banks.23 At the same time, restructuring funds are looking to promote corporate rehabilitation in regional economies, for example, by restructuring non-performing loans held by regional banks.
Further deregulation and development of the capital markets could also generate new business opportunities for banks. The Japanese authorities have proposed ideas for enhancing Tokyo’s appeal as an international financial center, including by relaxing the barriers between banks and securities companies, consolidating financial exchanges, and developing further the capital markets. Although the proposals are still in the early stage of discussions, they hold the promise of new business opportunities for banks in asset and wealth management and other fee-earning activities.
23 Such developments are already taking place: for example, in 2006, Bank of Fukuoka contributed capital to Kumamoto Family Bank and Kyushu-Shinwa Holdings Inc. and the integration of the management of regional banks or their merger took place in Yamaguchi, Hiroshima, and Wakayama prefectures. However, consolidation has been held back by tight “family” ownership and close links with local borrowers.

24
References
Altunbas, Y., M.H.Lui, P.Molynex, and P.Seth, 2000, “Efficiency and Risk in Japanese Banking,” Journal of Banking and Finance, Vol. 24, pp.1605-28.
Bank of Japan, 2007, Financial System Report, Tokyo: Bank of Japan.
Brunner, A., J. Decressin, D. Hardy, and B. Kudela, 2004, “Germany’s Three-Pillar Banking System Cross-Country Perspectives in Europe,” IMF Occasional Paper No. 233, Washington D.C.: International Monetary Fund.
De Nicolo, G., P. Bartholomew, J. Zaman, and M. Zephirin, 2003, “Bank Consolidation, Internationalization, and Conglomeration: Trends and Implications for Financial Risk,” IMF Working Paper WP/03/158, Washington D.C.: International Monetary Fund.
Drake, L. and M. Hall, 2003, “Efficiency in Japanese Banking: An Empirical Analysis,” Journal of Banking and Finance, Vol. 27, pp.891-917.
Fare, R., S. Grosskopf, and K.Lowell, 1994, Production Frontiers, Cambridge: Cambridge University Press.
Fukao, M. et al., 2004, “The Profitability of Japanese Industries: Non-Financial Sectors, Banks, and Life-Insurance Companies,” Japan Financial Review, No. 5, Tokyo: Japan Center for Economic Research.
———, 2004, “Banks and the Safety Net,” Japan Financial Report, No. 11, Tokyo: Japan Center for Economic Research.
Fukuyama, H., 1993, “Technical and Scale Efficiency of Japanese Commercial Banks: A Non-Parametric Approach,” Applied Economics, Vol. 25, pp. 1101-12.
International Monetary Fund, 2005, “Why Is Japanese Banking Sector Profitability so Low?” in Japan: Selected Issues, (Washington D.C.: International Monetary Fund).
Maudos, J. and J.M.Pastor, 2001, “Cost and Profit Efficiency in Banking: An International Comparison of Europe, Japan, and the USA,” Applied Economic Letters, vol. 8, pp.383-87.
McKillop, D.G., J.C.Glass, and Y.Morikawa, 1996, “The Composite Cost Function and Efficiency in Giant Japanese Banks,” Journal of Banking and Finance, Vol. 20, pp.1651-71.
Oyama, T. and T.Shiratori, 2001, “Insights into the Low Profitability of Japanese Banks: Some Lessons from the Analysis of Trends in Banks’ Margins,” Discussion Paper No. 01-E-1, Tokyo: Bank of Japan.

25
Regional Banks Association of Japan, 2007, Regional Banks in Japan 2006, http://www.chiginkyo.or.jp.
Sealey, C. Jr. and J. Lindley, 1977, “Inputs, Outputs, and a Theory of Production and Cost at Depositary Financial Institutions,” Journal of Finance, Vol. 32, Iss. 4, pp. 1251-66.
Zhu, J., 2003, Quantitative Models for Performance Evaluation and Benchmarking, New York: Springer International Series in Operations Research and Management Science.
26
Appendix I. Data Envelopment Analysis (DEA) Methodology
The DEA methodology is based on information on inputs and outputs of individual entities to construct an efficiency frontier enveloping the data. The model chooses a benchmark entity, which lies on this frontier and measures the efficiency of other individual entities relative to the benchmark entity. Two alternative approaches are available in DEA to estimate the efficiency frontier. One is input-oriented, and the other is output-oriented. In the input-oriented model, the inputs are minimized and the outputs are kept at their current levels. In the output-oriented model, the outputs are maximized and the inputs are kept at their current level.
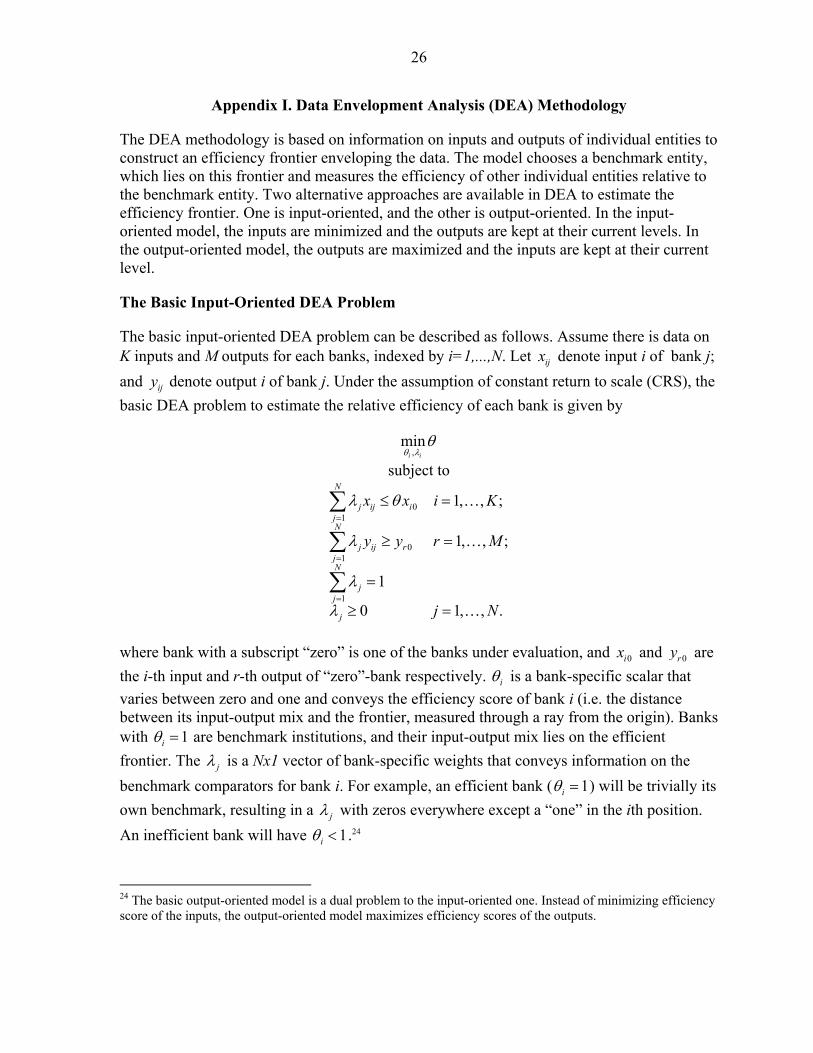
The Basic Input-Oriented DEA Problem
The basic input-oriented DEA problem can be described as follows. Assume there is data on K inputs and M outputs for each banks, indexed by i=1,...,N. Let ijx denote input i of bank j; and ijy denote output i of bank j. Under the assumption of constant return to scale (CRS), the basic DEA problem to estimate the relative efficiency of each bank is given by
,min
i iθ λθ
subject to
01
01
1
1, , ;
1, , ;
1
0 1, , .
N
j ij ijN
j ij rjN
jj
j
x x i K
y y r M
j N
λ θ
λ
λ
λ
=
=
=
≤ =
≥ =
=
≥ =
∑
∑
∑
K
K
K
where bank with a subscript “zero” is one of the banks under evaluation, and 0ix and 0ry are the i-th input and r-th output of “zero”-bank respectively. iθ is a bank-specific scalar that varies between zero and one and conveys the efficiency score of bank i (i.e. the distance between its input-output mix and the frontier, measured through a ray from the origin). Banks with 1iθ = are benchmark institutions, and their input-output mix lies on the efficient frontier. The jλ is a Nx1 vector of bank-specific weights that conveys information on the benchmark comparators for bank i. For example, an efficient bank ( 1iθ = ) will be trivially its own benchmark, resulting in a jλ with zeros everywhere except a “one” in the ith position. An inefficient bank will have 1iθ < .24
24 The basic output-oriented model is a dual problem to the input-oriented one. Instead of minimizing efficiency score of the inputs, the output-oriented model maximizes efficiency scores of the outputs.

27
Additional restrictions to the basic model can be used to relax the CRS assumption and compute scale effects. The CRS assumption is only appropriate when banks are operating at the optimal scale, which may be too restrictive in reality. A subtle modification of the model allows us to compute efficiency under variable returns to scale (VRS) and disentangle technical efficiency from scale efficiency. This requires the addition of the convexity constraint, 1' 1iλ = , where 1 is aNx1 vector of ones. The VRS model produces a convex hull of intersecting planes that envelope the data more tightly than the CRS model and thus tends to produce generally higher estimates of efficiency.
The concept of total cost efficiency consists of technical efficiency and allocative efficiency. Its measurement can be illustrated with the help of Figure I.1.
Figure I.1. An Illustration of Technical and Allocative Efficiency
x1/y
x2/y
a
c
o
bI
W
d
-w1/w2
Technical efficiency can be measured as follows. Consider a firm producing a single output y with two inputs x1 and x2 with the input-output combination represented by point a. To facilitate the presentation, assume further that the technology is CRA, represented by isoquant I. Clearly, the input-output mix given by point a is inefficient, as it lies inside the production frontier entailed by the isoquant. A measure of the technical inefficiency can be given by the distance ab, which measures the amount by which the two inputs could be proportionally reduced without affecting output. Alternatively, technical inefficiency can be normalized using the ratio ab/ao and represented by its complement TE = 1 – ab/ao=bo/ao. The resulting measure, which is commonly used, varies from zero to one, with a larger value indicating higher technical efficiency. In particular, a value of one indicates that a specific input-output combination lies on the efficient isoquant.
Allocative efficiency can be assessed if information on input prices is available. Suppose input prices in the example are given by w1 and w2 and represented by the isocost line W. At the relative input prices, the cost-minimizing input mix is given by point d. Therefore, the

28
technical efficiency point b entails an excess cost equivalent to the distance bc, and the relative measure of this allocative inefficiency is given by the ratio AE=co/bo.
Thus, total cost efficiency (CE) can be defined as the product of technical and allocative efficiency:
co co boCE TE AEao bo ao
= ≡ × = × .
These three measures are bounded by zero and one, where higher values imply a higher efficiency. Further, they can be readily interpreted as percent deviations. For example, a value of economic efficiency score of 0.8 implies a gap of 0.2, or that the bank is 20 percent less efficient than its benchmark comparator.
Measure of Total Factor Productivity – An Output-Oriented Malmquist Index
Total factor productivity can be assessed using an output-oriented Malmquist index.25 Assume that for each time period t=1,...,T, banks produce an observed vector of M non-negative outputs, ( )1 , ,t t Mty y=y K , using N non-negative inputs, ( )1 , ,t t Ntx x=x K , using an unobserved, possibly time-variant, production technology,
( ){ }, : can produce , 1, , .t t t t tS t T= =x y x y K
By assumption, output set tS satisfies usual regularity conditions, i.e. it is closed, bounded, convex, and satisfies strong disposability of outputs. This allows us to construct a well-defined output distance function,
( ) ( ){ }, inf : , /t t t t t tD Sθ θ= ∈x y x y .
In other words, tD measures the distance between the observed output of each bank at time t and the maximum output attainable with the observed input mix, given the technology available at time t. Notice that ( ), 1t t tD =x y if and only if the observed input-output combination observed at time t lies at the boundaries of the technology frontier available at time t, otherwise, ( ), 1t t tD <x y .
Three additional distance functions, ( )1 1,t t tD + +x y , ( )1 ,t t tD + x y , and ( )1 1 1,t t tD + + +x y are defined in a similar way, either by re-dating the variables or by re-dating the technology, although in the first two cases, the resulting distances may exceed one (i.e. the observed input-output combinations may lie above the production set of the other period).
An output-oriented Malmquist productivity index can be expressed as 25 The description of the methodology here follows Fare et al., 1994.
29
( )( )
( )( )
( )( )
12
1 1 1 1 11
1 1 1 1
, , ,, , ,
t t t t t t t t tt
t t t t t t t t t
D D DM
D D D+ + + + +
++ + + +
⎡ ⎤= × ×⎢ ⎥
⎣ ⎦
x y x y x yx y x y x y
,
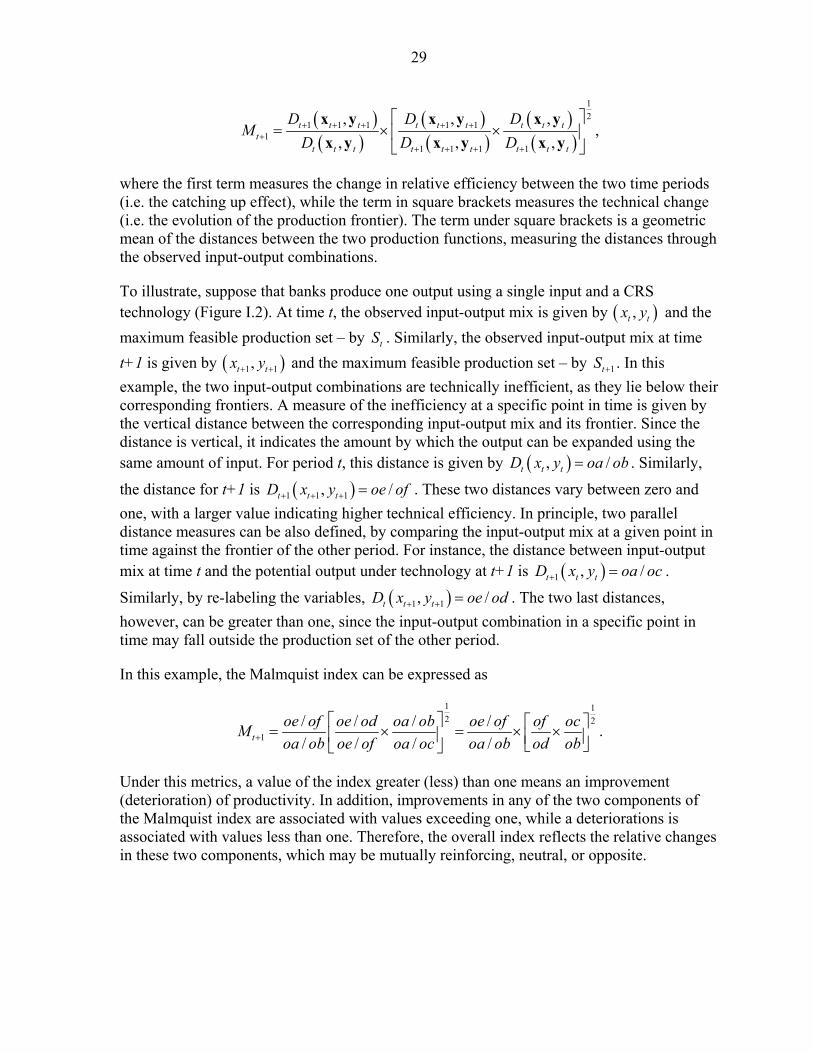
where the first term measures the change in relative efficiency between the two time periods (i.e. the catching up effect), while the term in square brackets measures the technical change (i.e. the evolution of the production frontier). The term under square brackets is a geometric mean of the distances between the two production functions, measuring the distances through the observed input-output combinations.
To illustrate, suppose that banks produce one output using a single input and a CRS technology (Figure I.2). At time t, the observed input-output mix is given by ( ),t tx y and the maximum feasible production set – by tS . Similarly, the observed input-output mix at time t+1 is given by ( )1 1,t tx y+ + and the maximum feasible production set – by 1tS + . In this example, the two input-output combinations are technically inefficient, as they lie below their corresponding frontiers. A measure of the inefficiency at a specific point in time is given by the vertical distance between the corresponding input-output mix and its frontier. Since the distance is vertical, it indicates the amount by which the output can be expanded using the same amount of input. For period t, this distance is given by ( ), /t t tD x y oa ob= . Similarly,
the distance for t+1 is ( )1 1 1, /t t tD x y oe of+ + + = . These two distances vary between zero and one, with a larger value indicating higher technical efficiency. In principle, two parallel distance measures can be also defined, by comparing the input-output mix at a given point in time against the frontier of the other period. For instance, the distance between input-output mix at time t and the potential output under technology at t+1 is ( )1 , /t t tD x y oa oc+ = .
Similarly, by re-labeling the variables, ( )1 1, /t t tD x y oe od+ + = . The two last distances, however, can be greater than one, since the input-output combination in a specific point in time may fall outside the production set of the other period.
In this example, the Malmquist index can be expressed as
1 12 2
1/ / / // / / /t
oe of oe od oa ob oe of of ocMoa ob oe of oa oc oa ob od ob+
⎡ ⎤ ⎡ ⎤= × = × ×⎢ ⎥ ⎢ ⎥⎣ ⎦⎣ ⎦.
Under this metrics, a value of the index greater (less) than one means an improvement (deterioration) of productivity. In addition, improvements in any of the two components of the Malmquist index are associated with values exceeding one, while a deteriorations is associated with values less than one. Therefore, the overall index reflects the relative changes in these two components, which may be mutually reinforcing, neutral, or opposite.
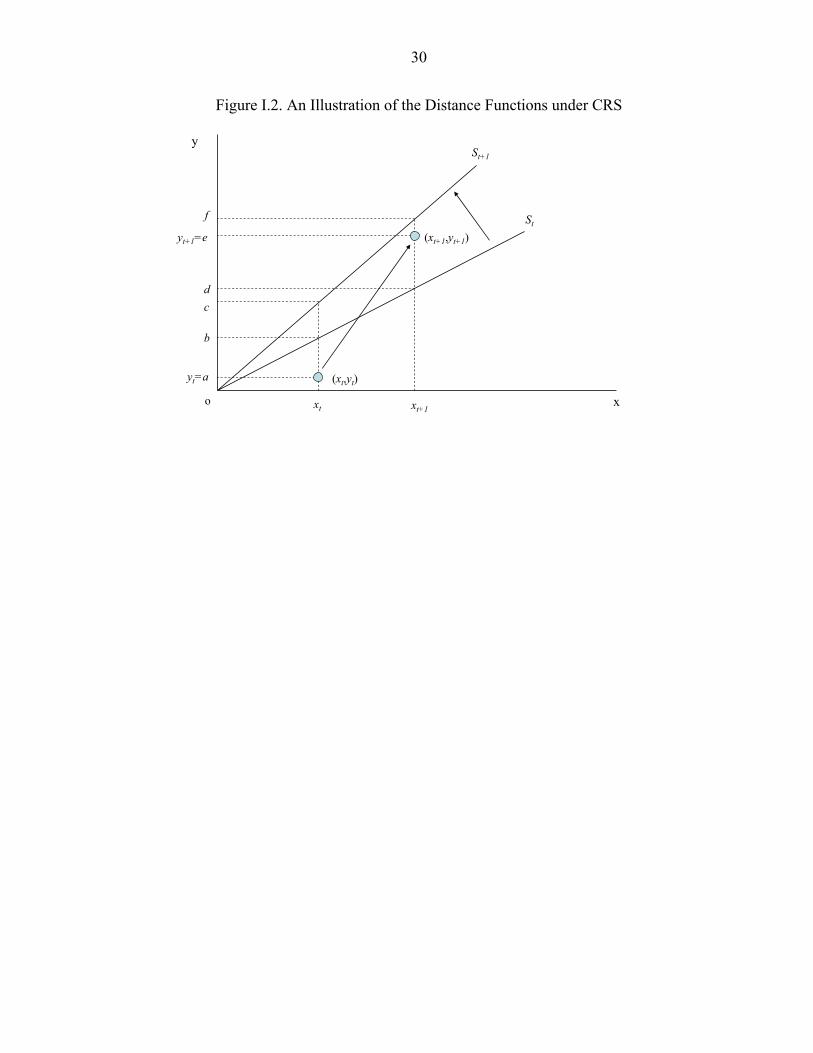
30
Figure I.2. An Illustration of the Distance Functions under CRS
x
ySt+1
St
xt xt+1
yt=a
yt+1=e
b
cd
f
(xt,yt)
(xt+1,yt+1)
o

31
Appendix II. Integrating Arrangements for Regional Banks in Selected European Countries
Germany26
There are two types of regional banks in Germany, savings banks (“Sparkassen”) and their head institutions (“Landesbanken”). The mandate of the Sparkassen and Landesbanken is to foster the economic development of their regions by following viable business plans. Most Sparkassen belong to municipalities (except for seven institutions owned by foundations): thus, they usually do not compete with each other. Although Sparkassen are permitted to engage in universal banking activities, the majority of them concentrate on retail banking. The Sparkassen are organized in Länder associations: Each region (Land) among the old regions (Länder) used to have its own Landesbank, which can be viewed as a head institution (or the apex) of Sparkassen in the respective Land. In particular, the Landesbanken
• act as the central banks for the Sparkassen, particularly those that do not tap the interbank market;
• perform the role of short-term debtors and long-term creditors vis-à-vis the Sparkassen, thereby relieving them of maturity-mismatch risk;
• offer back-office operations and settlement services (through six transaction banks) and asset management services (through some seven investment management companies); and
• engage in wholesale lending and deposit taking.
To manage risk, any Sparkasse or Landesbank is ultimately backed by a joint liability scheme, which comprises the full set of regional support funds of the Sparkassen, which are called on first in case of difficulties, and the security reserve of the Landesbanken. The scheme backs the institutions rather than depositors. The associations of the Sparkassen and Landesbanken also supervise their members to reduce moral hazard. Thus, in some ways Sparkassen act as one institution due to mutual support but also inspection by the association, which is politically powerful.
Recent restructuring measures in the regional banking segment currently being implemented include:
• Teaming up Landesbanken and Sparkassen (vertical integration): This provides the Landesbanken with access to the retail market and thus to cheaper funding. Currently some Landesbanken are seeking a closer association with their local Sparkassen in
26 Brunner et al. (2004).

32
various form, for example, through cooperation agreements or the development of a group framework to obtain a single rating.
• Teaming up Landesbanken (horizontal integration) to realizeeconomies of scale and reduce costs. Some Landesbanken own stakes in others; seek to cooperate in back-office operations; have signed a strategic agreements that have resulted in joint activities in several business areas; or have merged to form a single bank.
There are also regional cooperative banks (volksbanken and raiffeisenbanken), with a system of mutual support and supervision (an apex bank), which do no compete with each other, similar to Sparkassen.
Spain27
The savings banks (cajas de ahorros) have been a major force in extending financial services in Spain. They have a large network of branches, strong regional identity, and close ties with the communities.
Cajas’ legal form, which precludes clear ownership, limits their capacity to tap external sources of capital, thus, they must rely largely on retained profits. To help address those limitations, cajas have been allowed to raise funds through the issuance of non-voting shares (cuotas participativas), preferred shares, and subordinated debt instruments (participaciones preferentes). Cuotas participativas are specific instruments for cajas, whereas other instruments can be issued by all financial institutions. These measures have reduced cost of funding for cajas, thus allowing them to be more cost efficient.
The peculiar structure of savings banks―foundations that do not have owners―requires adequate arrangements to ensure good governance and strong market orientation. In this regard, some proposals on improving governance of savings banks have been considered, including a creation of a Corporate Governance Code.
Also, deregulation in 1988 allowed the cajas to expand their operations outside their home regions allowing them to compete on a national (and potentially international) markets. Moreover, legal barriers preventing mergers and strategic alliances among cajas were eased in 2002, allowing mergers of savings banks from different regions.28
Switzerland 29
There are two types of banks in Switzerland with a strong regional focus, cantonal banks and regional banks. Both groups of banks focus mostly on traditional retail lending, particularly
27 IMF, 2006, Spain: Financial Sector Stability Assessment, 2006.
28 Previously, only mergers between cajas from the same region were regulated.
29 IMF, 2007, Switzerland: Financial Sector Stability Assessment; and Association of Swiss Cantonal Banks.

33
mortgages, albeit the larger ones are also active in a wide range of financial activities. Their operations tend to be geographically limited to their cantons or regions.
Most cantonal banks are entirely owned by their cantons and required to fulfill social objectives. They are allowed to engage in universal banking activities, and are broadly subject to the same regulatory and supervisory framework as other banks in Switzerland. However, cantonal banks enjoy public guarantees of their liabilities and are subject to somewhat lower capital requirements, although this latter preferential treatment is being phased out to level the playing field.
Regional banks have mutual ownership and are grouped under the umbrella of the RBA Holding, which they own. The BRA Holding facilitates the cost-sharing support processes such as finance, information systems, and communication.
Competitive pressures in recent years have encouraged smaller banks to develop various types of cost-sharing arrangements and outsourcing their back-office operations to benefit from scale economies. Cantonal banks established various expertise and production centers, particularly for investment and pension funds, asset management, credit card services, training and information technology. Those joint ventures create economies of scale, contain costs, and enhance know-how. Also, cantonal banks have been working closely together in the capital market business for over 50 years. In many domestic bond issues and public Swiss franc foreign bond issues they act jointly as an ordinary partnership under the name “Schweizerische Kantonal banken” (Swiss Cantonal Banks). They also participate in the primary and secondary placement of domestic and foreign share issues.
Austria 30
Three banking segments―the savings banks, rural credit cooperatives (raiffeisenbanken), and industrial credit cooperatives (volksbanken)―have tiered structures, with apex or central institutions at the top-most tier providing centralized services such as liquidity management and risk assessment to the other institutions in the sector. This allows small banks to gain economies of scale through the centralized provision and development of products and services by the apex banks. Coupled with the system-wide shared ATM network, which enhances the ability of customers to use banks outside their geographical region, the result is a significant level of competition in most aspects of the banking sector. In addition, smaller banks have clustered together and have become increasingly tied to lead banks.
An ongoing restructuring of the banking sector has witnessed a trend toward greater integration of banks, primarily within the tiered segments. The savings banks have pursued a franchising-type strategy. For example, Erste Bank has been acquiring stakes in the six largest regional savings banks, selling its regional branches to these regional banks, and facilitating the merger of weak banks.31 The sector has also consolidated by jointly planning 30 IMF, 2007, Austria: Financial Sector Stability Assessment, 2006.
31 As the lead institution in the savings bank segment, Erste Bank has the right of first refusal in any proposed merger or acquisition within the savings bank segment.

34
and developing products and by standardizing products, processes, and sales structures. The cooperative segments have consolidated through mergers of weak individual cooperatives―particularly among the raifessen banks―and by expanding the services provided by the apex banks.