analysis of the economic impact of the irish thoroughbred · pdf file ·...
TRANSCRIPT
Analysis of the Economic Impact of the Irish Thoroughbred IndustryOctober 2013
Commissioned by Irish Thoroughbred Breeders’ Association
Irish Thoroughbred Breeders’ Association
Greenhills, Kill, County Kildare
Telephone: +353 45 877543
Fax: +353 45 877429
Email: [email protected]
@ITBA_Official
https://www.facebook.com/IrishThoroughbredBreedersAssociation


Contents
1
Executive Summary . . . . . . . . . . . . . . . . . . . . . . . . . . . . . . . . . . . . . . . . . . . . . . . . . . . . . . . . . . . . . . . . . . . . . . . . . . . . . . . . . . . . . . . . . . . . . . . . . 2
The Structure of the Thoroughbred Industry . . . . . . . . . . . . . . . . . . . . . . . . . . . . . . . . . . . . . . . . . . . . . . . . . . . . . . . . . . . . . . . . . . . . . . 4
A Major Industry in Ireland . . . . . . . . . . . . . . . . . . . . . . . . . . . . . . . . . . . . . . . . . . . . . . . . . . . . . . . . . . . . . . . . . . . . . . . . . . . . . . . . . . . . . . . . . 8
The Here and Now: The Industry since the Recession . . . . . . . . . . . . . . . . . . . . . . . . . . . . . . . . . . . . . . . . . . . . . . . . . . . . . . . . . . . . 11
Long Term Threats to the Industry . . . . . . . . . . . . . . . . . . . . . . . . . . . . . . . . . . . . . . . . . . . . . . . . . . . . . . . . . . . . . . . . . . . . . . . . . . . . . . . . 13
Options to Secure the Future of the Industry . . . . . . . . . . . . . . . . . . . . . . . . . . . . . . . . . . . . . . . . . . . . . . . . . . . . . . . . . . . . . . . . . . . . . 15
Appendices . . . . . . . . . . . . . . . . . . . . . . . . . . . . . . . . . . . . . . . . . . . . . . . . . . . . . . . . . . . . . . . . . . . . . . . . . . . . . . . . . . . . . . . . . . . . . . . . . . . . . . . . 16
Research
This report was prepared and researched by Wilson Hartnell . It was managed and authored by Alistair Hodgett and Niamh O’Keeffe with research assistance from Ian Power . Alan Dukes offered guidance and direction . Special thanks also to Elizabeth Headon for her insights .
This report was commissioned by the Irish Thoroughbred Breeders’ Association, with Joe Osborne (Chairman, ITBA) and Shane O’Dwyer (Manager, ITBA) providing industry expertise and support .
This report acknowledges the importance of several major sources namely Horse Racing Ireland, Weatherbys Ireland, The International Federation of Horseracing Authorities, ‘An Analysis of the Economic Impact of the Irish Thoroughbred Horse Industry 2009’ and ‘An Analysis of the Economic Impact of the Irish Thoroughbred Horse Industry 2010’ .

2
The thoroughbred industry in Ireland is highly successful and globally competitive . It directly employs approximately 14,000 individuals and thousands more indirectly . It made a direct economic contribution of nearly e1 .1 billion to the Irish economy in 2012 .
Racehorse owners are the key drivers of wider industry economic activity . Their activity supports the direct economic activity of hundreds of breeding and training operations spread throughout the country as well as supporting the indirect economic activity of the off-course betting industry .
Superficially, the industry has bottomed out since the recession with annual foal production, prize money, employment and gross expenditure stabilising .
However, there are indications that issues are developing which could threaten the industry . For instance, the value of exports is rising while the number of horses exported is falling suggesting that we are “selling the best” . This is the direct opposite of the decisions by founders of the modern industry to breed, train and stand the best in Ireland which first developed the industry here .
In addition, the number of racehorse owners has continued to decline dramatically, from 7,164 in 2007 to 4,463 in 2012 .
A number of options are available to secure the future of the industry . This report recommends:
• Improving the proportion of ownership costs covered by prize money
• Securing a more stable source of support for the industry
• Increasing direct government support
• Reducing the disincentives / increasing incentives available to the small-scale owners, breeders and trainers to remain in the industry
• Fostering opportunities in new markets
Due to its scale and its location, Ireland will never be the biggest producer of racehorses and mares in the world . However, with careful planning and prudent policy making, we have the unique opportunity to be the best in the world with our unmatched bloodstock, world class personnel and our excellent horse racing infrastructure .
Executive Summary
“Thoroughbred horses and horse racing are an integral part of “Irishness”, not only for us Irish but also for millions of people all around the world. Breeders, racehorse owners and trainers everywhere know and respect their Irish counterparts. Racing fans all over the world know what good sport is to be had in Ireland and they know that Irish-bred horses are a force to be reckoned with on racecourses everywhere.
Racing and the social enjoyment connected with it are an essential part of the Irish tourism offering, as well as being an important part of social life and recreation for hundreds of thousands of Irish people.
All of this is made possible by the skill and dedication of breeders, trainers, owners and stable staff all over the country, supported by people in a wide range of businesses supplying goods and services to the thoroughbred sector.
This report is concerned with what we need to do to nurture and develop this unique natural resource.”
Alan DukesOctober 2013
3

54
This section outlines the structure of the thoroughbred industry in Ireland and illustrates the diversity of the size and scale of breeding and training operations across the country . As the research shows, the sector consists of widely geographically dispersed economic activity driven by owners, breeders and trainers . Our research has found that owners act as the major driving force of this unique industry .
Racehorse owners
According to recent statistics there are 4,463 racehorse owners in Ireland1
Ownership comes in a variety of forms, for example through syndicates, clubs and companies . However, the majority of racehorses are owned by a single owner . In 2012, approximately 85% of racehorses had a single owner .
The financial return owners make on their investment comes from the prize money, breeding income and the sale of horses in training . The long-term success of the industry rests on the relative attractiveness of this return as all other industry participants are directly or indirectly dependent on investment by owners .
Racehorse owners’ contribution to the economy
Of all players in the industry, owners are the greatest driver of wider economic activity
• Investment by owners acts as the major driving force within the industry .
• Their activity directly supports the hundreds of breeder and trainer operations spread throughout the country .
• It also supports the thousands of individuals involved in racing and racing support services .
• The financial return on this investment comes in the form of prize money, bloodstock sales and stallion fees . However, the return is not purely monetary in nature as the dream of victory in the classics or Cheltenham and the prestige of owning
a world-class thoroughbred act as major influences on any investment decision .
• The economic activity of this group also generates related economic activity . The industry is responsible for the employment of thousands more people in the provision of auxiliary services to the industry . There are high quality jobs in feed and bedding suppliers, veterinary services, regulation, farriers, research and development, educational establishments, administration organisations, insurance providers and transportation . (Further information on industry employment is discussed in section 3) .
Rural development
The industry is mainly composed of a large number of small scale operations spread throughout the country . There are a few notable exceptions which are large scale operations employing hundreds of people .
One of the major advantages of the industry is that it provides significant employment and economic activity in rural areas where there can be a shortage of other employment opportunities .
The largest concentrations of industry participants are in the counties of Tipperary, Kildare, Cork, Wexford and Meath .
Breeders and trainers
According to recent statistics there are:
• 7,781 registered breeders2
• 704 licensed trainers3
Owners are the primary customer of both breeders and trainers . The thoroughbred stock produced by these actors supports racing festivals and meets which in turn support the off-course betting industry . This activity is actually a self-perpetuating cycle where each facet is heavily reliant on the others . If investment by owners declines in response to lower returns, this will lead to lower foal production and reduced levels of training activity, which in turn will
lead to a decline in the quality of Irish racing and have a negative impact on festival/race meeting attendance and on betting turnover . This in turn will further lower the overall return from investment through reduced prize money, yearling values and stallion fees .
High quality international racing, in Great Britain in particular, also has a huge impact on the sale of Irish bloodstock .
This structure has fostered a world-class industry in Ireland .
• The actions of many small owners have supported Ireland in winning and keeping a position in the global top tier of training, breeding and racing .
• Ireland breeds the fourth largest number of foals in the world accounting for 7 .34% of world output and by far the most on a per capita basis (2011 share of global output: USA 24 .19% Australia 15 .44%, Argentina 8 .51% and Japan 6 .86%)4 . Ireland remains the largest producer of
thoroughbred foals in Europe with approximately 40% of the European foal crop5 .
• In addition, Ireland has the third largest number of mares in the world, accounting for 8% of world output and once again, the most on a per capita basis6 .
• Irish-bred horses occupy 4 of the top 10 ranked places in the LONGINES World Best Racehorse Rankings7 . In addition, 6 of the last 7 European Champion two-year olds were trained in Ireland, with 5 of them also bred here8 .
• Seven of the top 10 yearlings sold in Ireland and the UK in 2012 were Irish bred .
• Irish horses made an international net gain of e10 million in prize money in 2012 alone . Prize money won abroad by Irish trained horses was far in excess of the prize money won by foreign trained horses in Ireland9 .
The Structure of the Thoroughbred Industry
1 Horse Racing Ireland (HRI) Factbook (2012)2 HRI Factbook (2012)3 HRI Factbook (2012)
4 The International Federation of Horseracing Authorities (IFHA) Annual Report (2011)5 HRI Factbook (2012)6 IFHA Annual Report (2011)7 LONGINES World Best Racehorse Rankings (2013)8 HRI Factbook (2012)9 HRI Factbook (2012)

76
Racecourses
There are 26 racecourses spread across the length and breadth of Ireland10 . They act as important economic hubs and tourist attractions . They also provide the essential infrastructure that supports Irish racing which in turn acts as a shop window for the breeding industry .
Racegoers
The industry benefits from the enthusiastic support of a large segment of the Irish public .
• Including repeat visitors, 1 .19 million people attended race meetings during 201211 .
• Attendance at the top 7 racing festivals in 2012 alone was 463,00012 .
• These festivals also generate substantial media exposure . The Galway Racing Festival attracts approximately 900,000 television viewers annually capturing an average audience share of 23% . Furthermore, the Galway Racing Festival is the one of the largest in the world based on attendance: 144,315 in 201213 .
• Fairyhouse and Punchestown racing festivals attract similar average audience shares14 .
• A day at the races is an integral and celebrated part of Irish culture . Its unique blend of sport, hospitality and excitement has been attracting racegoers for hundreds of years .
• Horse racing is a source of national pride as Ireland is globally renowned for its excellence in breeding and training, with Irish horses and jockeys consistently ranked among the best in the world . In a recent Ipsos MRBI survey, 80% of people ‘strongly agreed’ or ‘agreed’ that “horse racing plays an important role in Irish heritage” and 78% of people ‘strongly agreed’ or ‘agreed’ that they “feel proud when an Irish horse or jockey wins a big race overseas”15 .
• Similarly, horse racing has ranked second only to rugby as the sport which provides Ireland with the most international prestige16 . This is an opinion that has remained consistent over decades .
1
2
3
4
5
6
7
8
9
10
11
12
BALLINROBE
BELLEWSTOWN
CLONMEL
CORK-MALLOW
CURRAGH
DOWNPATRICK
DOWN ROYAL
DUNDALK
FAIRYHOUSE
GALWAY
GOWRAN PARK
KILBEGGAN
13 KILLARNEY
14
15
16
17
18
19
20
21
22
23
24
25
LAYTOWN
LEOPARDSTOWN
LIMERICK
LISTOWEL
NAAS
NAVAN
PUNCHESTOWN
ROSCOMMON
SLIGO
THURLES
TIPPERARY
TRAMORE
26 WEXFORD
26 Irish Racecourses
67
142
3
5
8
9
10
11
12
13
16
20
1921
22
23
24
26
1518
254
17
1
67
DONEGAL
DERRY
ANTRIM
TYRONE
FERMANAGHLEITRIM
MONAGHAN
ARMAGH
CAVAN
LONGFORD
DOWN
LOUTH
MEATH
DUBLINWESTMEATH
ROSCOMMON
SLIGO
MAYO
GALWAY
OFFALY
KILDARE
CLARE
LAOIS WICKLOW
CARLOW
TIPPERARY
LIMERICKKILKENNY WEXFORD
WATERFORD
CORK
KERRY
10 HRI Factbook (2012) 11 HRI Factbook (2012)12 HRI Factbook (2012)13 HRI, Go Racing Ireland - Sponsorship Opportunities (2012)
14 HRI, Go Racing Ireland - Sponsorship Opportunities (2012)15 Ipsos MRBI Survey (2013)16 Ipsos MRBI Survey (2013)

98
This section examines the overall contribution of the thoroughbred industry to the Irish economy in relation to the economic value, employment and tourism it generates . It is essential to convey the size and importance of the industry in order to demonstrate the relatively modest degree of support it receives in comparison to its main competitors for racehorse owner and breeder investment, France and the UK .
Direct economic contribution of approximately e1 .1 billion in 2012 .
Gross Value of the Industry to the Economy 2008-2012 (e000)
2008 2009 2010 2011 2012Racecourses and festivals 426,130 377,929 371,929 375,088 361,283
Training fees 289,810 254,667 238,869 221,634 208,244
Stock keep fees 225,300 213,382 179,107 160,071 154,162
Irish coverings 205,156 155,917 416,781 146,266 144,464
Exports 182,449 174,406 146,948 156,493 174,339
Irish domestic public sales 56,715 38,475 38,760 46,170 53,295
Total 1,385,560 1,214,776 1,122,394 1,105,722 1,095,786
• Racecourses and festivals (e361m)
• Training fees (e208m): 9,238 horses in training in 2012
• Exports (e174m): 3,497 Irish foaled horses were exported to 36 countries through auction in 2012
• Stock keep fees (e154m)
• Irish stallion fees (e144m)
• Irish domestic public sales (e53m)
• The indirect economic contribution of the industry is far greater . For instance, the off-course betting industry generates a turnover of approximately e1 .35 billion from horse racing alone17 . In addition, the e1 .1 billion does not include any of the turnover generated by the online betting industry from Irish racing .18
Total employment of approximately 14,000
• There are approximately 14,00019 full time equivalent staff employed directly in the thoroughbred industry20 . However, this figure does not include the thousands of additional economic participants that directly contribute to the success of the industry .
• Full employment figures are based on the assumption that changes in employment follow changes in the gross value of the industry on a 1:1 basis21 .
• Employment is spread throughout rural areas where alternative sources of employment are limited . This is in line with the Government’s policy to maximise job creation and sustainable enterprise development in rural areas of Ireland22 .
• Thus, in addition to its direct contribution to Irish GDP and employment, the thoroughbred equine sector plays an essential role in rural development .
Total Employment 2008-2012
Sector 2008 2009 2010 2011 2012Breeding 6,107 4,738 3,982 3,923 3,888
Racing 3,920 3,469 3,080 3,034 3,007
Betting 6,998 6,528 6,034 5,944 5,891
Other 2,509 2,196 1,846 1,819 1,802
Racecourse 996 950 935 921 913
Licensed Trainers 775 774 738 707 704
Jockeys 619 591 570 562 556
Educational 151 126 119 117 116
Total Employment 22,075 19,372 17,304 17,027 16,877
Generates substantial tourism
• An estimated 80,000 people travel to Ireland annually for racing activities23 .
Over 37% of the e45m in prize money comes from within the industry
• Owners contribute approximately 25% of all prize money . Funding also comes from Horse Racing Ireland (62%), commercial sponsorship (8%), the Irish European Breeders’ Fund (4%) and Northern Ireland Funding (1%)24 .
Sources of Prize Money 2007-2012 (e000)
2007 2008 2009 2010 2011 2012HRI 32,269 34,009 3,0277 28,327 28,054 28,049
Owners 17,651 17,224 14,664 12,321 11,132 10,957
Commercial 7,306 6,824 5,603 3,024 2,813 3,665
EBF 1,928 1,888 1,969 1,942 1,995 1,786
NI Funding 454 456 376 399 403 414
Total 59,608 60,401 52,889 46,013 44,397 44,871
The betting industry generates a turnover from horse racing in excess of e1.35 billion
• This return is many times that achieved by breeders, owners and trainers whose contribution to the thoroughbred industry far outweighs that of the betting industry .
• The off-course betting industry redistributes only e21 .6m to the horse racing industry through the 1% betting levy25 .
• In addition, the online betting industry redistributes nothing to the thoroughbred industry or to the national exchequer .
A Major Industry in Ireland
17 The Irish Bookmakers Association report that approximately 50% of total turnover from off-course betting comes from horse racing . To arrive at our figure we apply this percentage to total-off course betting figures sourced from HRI Factbooks .
18 Appendix B contains a detailed description of the methodology and source material used to calculate the gross value of the industry .
19 Appendix C contains a detailed description of the methodology and source material used to calculate employment within the industry .
20 50% of total turnover in this industry derives from horse racing and so only one half of the 6,000 employees can be directly attributed to the Irish thoroughbred industry .
21 This is a highly conservative assumption which potentially underestimates the overall level of employment within the industry as employment is less volatile than turnover or profit on average .
22 Commission for the Economic Development of Rural Areas (2013)
23 HRI Factbook (2008)24 HRI Factbook (2012)25 Indecon, ‘Review of Certain Aspects of the Irish Horse Racing Industry’ Report (2012)

1110
This section will analyse trends within the industry over the last five years . A number of key performance indicators such as the stabilisation in foal production, employment, prize money and gross expenditure suggest that superficially the industry had bottomed out since the recession . However, it is important to note that in all of these categories the industry is still far below 2008 levels .
Number of horses
• Crucially, the number of foals has remained stable (7,546) since 2010 following two years of dramatic decline in 2009 and 2010 .
• The pace of the decline in the number of mares is also slowing from a fall of almost 20% in 2010 to a 6% fall in 2012 .
• However, the number of registered stallions has continued to fall at a rate of around 10% annually, with a projected estimate of 237 stallions registered for the 2012 season .
• Thus, there are encouraging signs that the industry may be beginning to bottom out . However, it is important to note that in all of these categories the numbers of horses are still far below their 2008 levels, most notably with respect to the number of mares, foals, horses in training and stallions .
Gross value of the industry
• The gross value of the industry has remained steady since 2010 and now stands at almost e1 .1 billion .
• Prize money remained stable in 2010 and 2011, and increased slightly in 2012 .
• The fall in training fees and stock keep fees over the last twelve months has been offset by the increase in exports and bloodstock sales, while Irish stallion fees and festival expenditure have remained relatively stable over the last two years .
• The decline in off-course betting on horse racing has also stabilised .
Employment
• Employment in the industry is less volatile than gross value . Additionally, alternative employment prospects in rural areas are scarce . Due to these facts, we conclude that while employment in the industry has fallen since 2008, it has not shrunk to the same extent as expenditure . That said it is very likely that there has been a considerable increase in the level of under-employment within the industry over the last five years .
• Stable staff, trainer and jockey employment levels have also remained constant over the last 12 months .
• As of 2012, total Full Time Equivalent (FTE) employment in the industry stands at approximately 11,000 . Additionally, 6,000 FTEs are estimated to be employed by the off-course betting sector (approximately 50% of whose turnover is on horse racing ie 3,000 FTEs) . Therefore, direct employment by the industry amounts to approximately 14,000 FTEs .
The Here and Now: The Industry since the Recession
International comparisons: Contribution of the betting industry
• In France 9 .6% of betting turnover is returned to racing26 . Furthermore, 54% of keep and training expenses are covered by prize money won27 . In addition, e35m in premiums are distributed to owners of horses that were bred or “assimilated” in France . Also, prize money in France has consistently increased over the last 14 years28 .
• In comparison, only 1 .6% of betting turnover is returned to racing in Ireland29 and only 25% of expenses are covered by prize money won30 . Furthermore, prize money has decreased from e60m in 2008 to e45m in 2012 (a 25% fall)31 . Worryingly, a similar drop in prize money contributed to the rapid collapse of the Italian thoroughbred industry since 2008 .
• Ireland has 21% less net prize money per individual runner than in the UK, and 14 .2% less net prize money per horse in training32 .
• It also has less economic support per job (e4,096) than the UK (e5,051)33 and particularly France (e14,914)34 .
26 IFHA Annual Report (2011)27 IFHA Annual Report (2011)28 French Racing and Breeding Committee Information Booklet (2012)29 IFHA Annual Report (2011)30 IFHA Annual Report (2011)31 Indecon, ‘Review of Certain Aspects of the Irish Horse Racing Industry’
Report (2012)
32 Indecon, ‘Review of Certain Aspects of the Irish Horse Racing Industry’ Report (2012): Net prize money is obtained by subtracting owner contributions to prize money from total prize money . This figure is then divided by the number of individual runners or the number of horses in training in both countries .
33 Deloitte, The Economic Impact of British Racing Report (2013)34 PMU, Activity Report (2012) and France Galop Data (2013)

1312
This section exposes the fragile state of the industry identifying a number of alarming trends which could potentially threaten the long-term success of the industry . It is essential that any challenges are addressed as early as possible so that proposals that will help secure the future of the industry can be developed and implemented .
The value of exports is rising while the number of horses exported is falling indicating that the industry is “selling the best” it has to offer
• There has been approximately a 10% increase in the value of exports of foals since 2010 while the number of foals exported has decreased by 10% in the same period .
• There has been a 20% increase in the value of exports of yearlings since 2010 while the number of yearlings exported has decreased by 10% .
• These divergences are explained by a selling off of the best – the diametric opposite of what initially cultivated this world class industry in Ireland .
Racehorse ownership has continued to decline dramatically since 2008
• The long-term success of the industry relies on ensuring continued investment from owners . Worryingly, last year witnessed its most extensive annual fall in the number of owners so far from 5,140 in 2011 to 4,463 in 2012 (a 13% reduction) .
At the moment, the industry is benefiting from the legacy of previous decades’ development of quality in the form of income from stallion fees and exports
• The reduction in the number of mares and foals, together with the export of quality horses, may take a decade or more to impact on the quality of stallions and on the corresponding fees .
• The Irish industry and its supporters in government need to focus more on the long-term, an approach from which the industry has benefited so much in the past .
Recent ECJ Ruling on Bloodstock VAT
• The European Court of Justice ruling on the 4 .8% VAT rate heretofore applicable to bloodstock is now under review . The uncertainty and concern about a possible increase in the rate above the agricultural rate is now a threat to all stakeholders .
Ireland’s competitive position – now and in the future – is at risk of deteriorating
• The 39% drop in foal production in Ireland between 2008 and 2011 means that the Irish industry has fallen from a position of 3rd largest producer of foals to fourth (10% to 7%) over the four years from 2008 to 2011, eclipsed by Argentina35 .
• If this trend continues, countries with growing foal production – such as Japan – will push Ireland further down the rankings .
• During this same period other countries, most notably France, have not seen these declines .
• A number of high profile stallions have retired to stud in England in recent years thus threatening Ireland’s position of dominance in this important area .
• As a result of a number of factors, notably those determining prize money levels and other support measures, our nearest European competitor countries are improving their attractiveness for industry participants .
The generational investment decisions for major studs will depend in part on the comparative health of the foundation industry and on the availability of quality mares and foals
• As other countries improve the broad base of mares and foals, they may be more attractive as long-term locations for the leading industry participants .
Long Term Threats to the Industry
35 IFHA Annual Report (2011)

1514
Comparison of declines in mares and foals by geographic location 2006 - 2011
While the global thouroughbred industry witnessed single digit declines in the number of mares and foals of 8 and 6 per cent respectively during the period 2008 to 2010, the sharp decline in Ireland was even more severe than that in Italy . By contrast, the French industry weathered the global decline much better, suggesting the support measures in place were more effective at protecting ownership than in Ireland .
0
50000
100000
150000
200000
2006 2007 2008 2009 2010 2011
Foals Mares
Global
– 8%
– 6%
0
5000
10000
15000
20000
25000
2006 2007 2008 2009 2010 2011
Foals Mares
Ireland
– 23%
– 39%
0
2000
4000
6000
8000
10000
2006 2007 2008 2009 2010 2011
Foals Mares
France
– 10%
+ 1%
0
500
1000
1500
2000
2500
3000
3500
2006 2007 2008 2009 2010 2011
Foals Mares
Italy
– 22%
– 22%
Stallions
Foals
Mares
1716
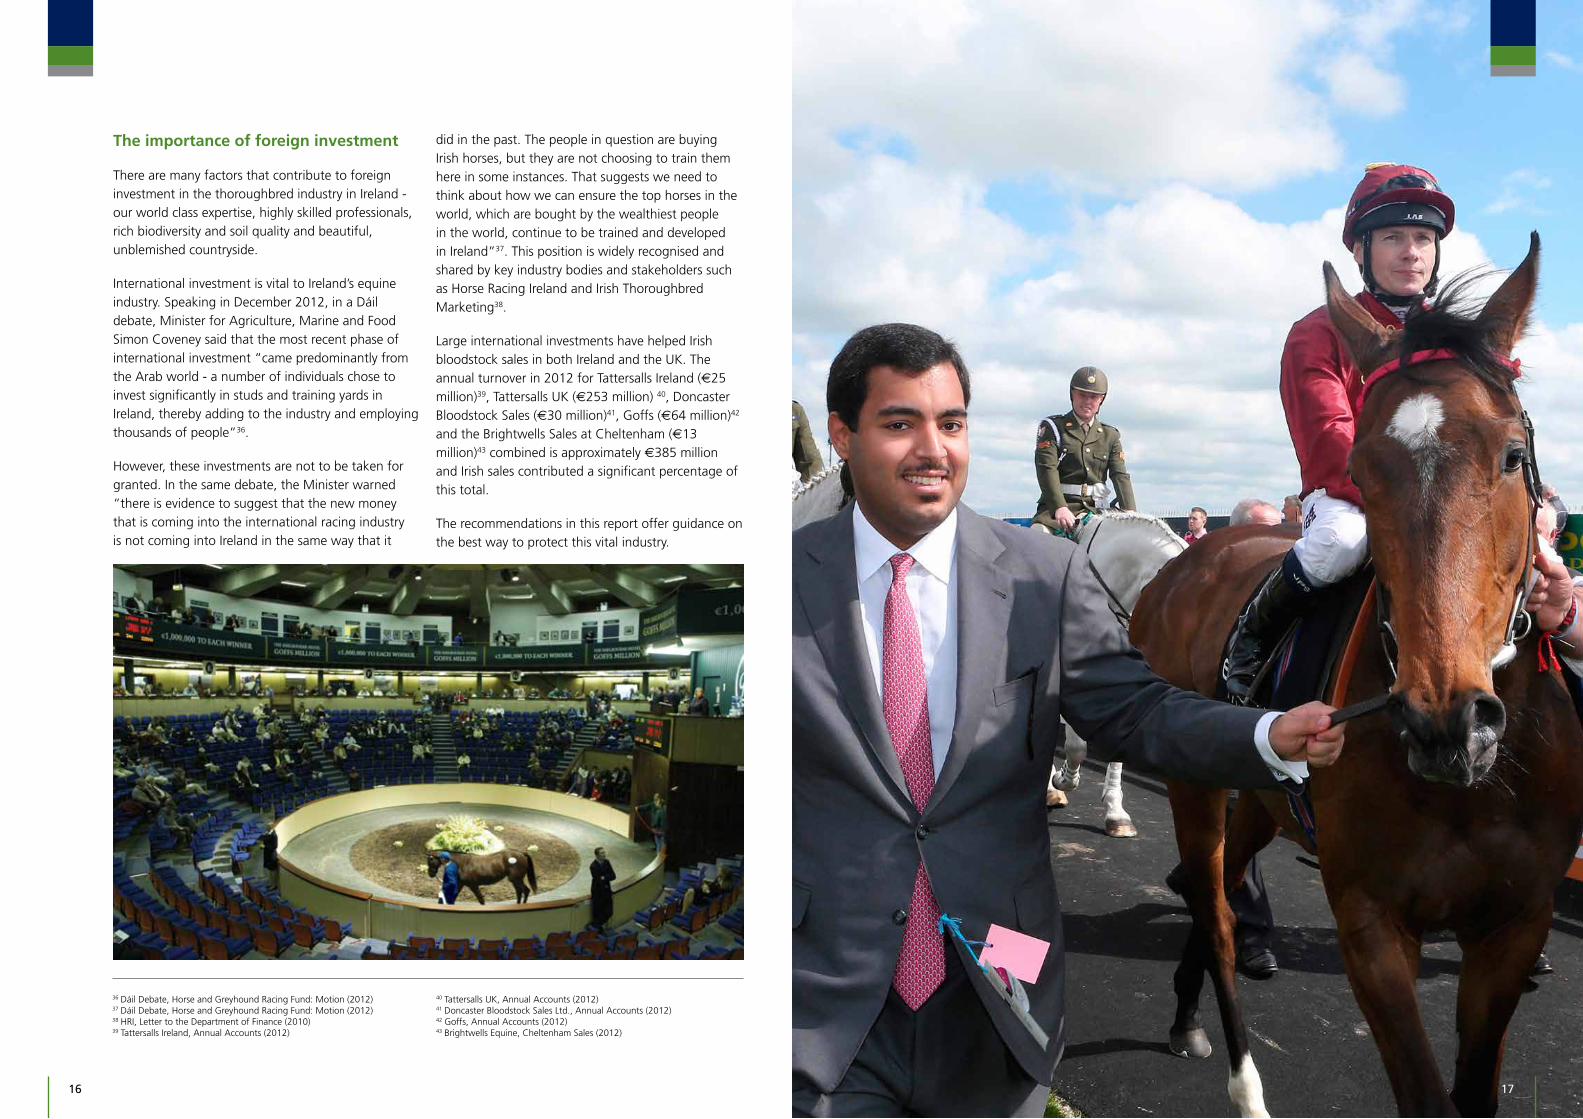
The importance of foreign investment
There are many factors that contribute to foreign investment in the thoroughbred industry in Ireland - our world class expertise, highly skilled professionals, rich biodiversity and soil quality and beautiful, unblemished countryside .
International investment is vital to Ireland’s equine industry . Speaking in December 2012, in a Dáil debate, Minister for Agriculture, Marine and Food Simon Coveney said that the most recent phase of international investment “came predominantly from the Arab world - a number of individuals chose to invest significantly in studs and training yards in Ireland, thereby adding to the industry and employing thousands of people”36 .
However, these investments are not to be taken for granted . In the same debate, the Minister warned “there is evidence to suggest that the new money that is coming into the international racing industry is not coming into Ireland in the same way that it
did in the past . The people in question are buying Irish horses, but they are not choosing to train them here in some instances . That suggests we need to think about how we can ensure the top horses in the world, which are bought by the wealthiest people in the world, continue to be trained and developed in Ireland”37 . This position is widely recognised and shared by key industry bodies and stakeholders such as Horse Racing Ireland and Irish Thoroughbred Marketing38 .
Large international investments have helped Irish bloodstock sales in both Ireland and the UK . The annual turnover in 2012 for Tattersalls Ireland (e25 million)39, Tattersalls UK (e253 million) 40, Doncaster Bloodstock Sales (e30 million)41, Goffs (e64 million)42 and the Brightwells Sales at Cheltenham (e13 million)43 combined is approximately e385 million and Irish sales contributed a significant percentage of this total .
The recommendations in this report offer guidance on the best way to protect this vital industry .
36 Dáil Debate, Horse and Greyhound Racing Fund: Motion (2012)37 Dáil Debate, Horse and Greyhound Racing Fund: Motion (2012)38 HRI, Letter to the Department of Finance (2010)39 Tattersalls Ireland, Annual Accounts (2012)
40 Tattersalls UK, Annual Accounts (2012)41 Doncaster Bloodstock Sales Ltd ., Annual Accounts (2012)42 Goffs, Annual Accounts (2012)43 Brightwells Equine, Cheltenham Sales (2012)

1918
This section outlines a variety of potential policies that, if implemented, will tackle the challenges faced by the industry and help secure a robust and sustainable recovery . Key means include improving the proportion of costs that are covered by prize money, securing a more stable source of support for the industry and fostering opportunities for the industry in new markets .
Improve the proportion of ownership costs covered by prize money
• This is a major determinant of the decision to remain active in breeding and racing44 .
Secure a more stable source of funding for the industry
• Increase the proportion of industry funding coming from the betting industry .
• Betting weathers recession well and thus is well-suited to provide a counterbalance to the impact of recession on the small-scale owner .
• The Government contribution to the racing industry is equivalent to 1 .6% of betting turnover in Ireland, vastly inferior to the return in our competitor set (Argentina 26%, Italy 14%, France 10% and Japan 6%)45 .
• Extend the betting levy to online betting which currently returns nothing to the industry yet prospers from it . Similar measures have already been introduced throughout Europe . For instance, France has established a turnover tax of 20% and the UK is introducing a 10% horse racing levy on online betting in 2014 . These proposals have already garnered widespread support from industry participants including the Irish Bookmakers Association (IBA) which welcomes a level playing field within the betting industry .
Increase direct government support
• Increase the level of exchequer funding to the industry via HRI or other means .
• Introduce industry specific legislation rather than catch-all agricultural legislation .
• As with any major investment in the Irish economy, it is imperative that the Government nurtures this economic activity by developing a stable and supportive policy framework to maintain and grow this high value export market into the future .
• The Government should ensure that future legislation impacting on the industry, including further measures to tax and regulate gambling, continue in full consultation with the industry .
Bloodstock VAT
• Any changes in the 4 .8% bloodstock VAT rate should be delayed as long as possible; any increase in the rate should be kept to a minimum; and derogations should be provided for young and breeding stock – which logically fit into the category of “agricultural animals” .
Increase incentives for owners, breeders and trainers, especially those operating on a small scale
• Introduction of a Mare Depreciation Scheme on a four-year scale such as that in place for stallions .
• Extend the Business Expansion Scheme to bloodstock through the provision of annual tax relief of e150,000 for investment in bloodstock .
Foster opportunities in new markets
Ireland’s success in horse racing and breeding is internationally renowned and has in itself become an exportable commodity . The partnership between Ireland and China on the Tianjin Equine Culture City project is a clear illustration of this . The project will help will help China to develop a horse racing and breeding industry and is expected to generate almost e40m in exports for Ireland within three years46 . This project and others that develop horse racing and breeding have many advantages for the Irish industry and should be encouraged and promoted as a valuable source of exports and to showcase the Irish industry’s expertise and success .
Options to Secure the Future of the Industry
44 IFHA Annual Report (2011) 45 IFHA Annual Report (2011) 46 RTE News, ‘Ireland to help establish e2bn Chinese equine centre’ (2012)

20
Appendix A: Sources of Information
Alan Dukes/ITBA, An analysis of the Economic Impact of the Irish Thoroughbred Horse Industry (2009)
Alan Dukes/ITBA, An analysis of the Economic Impact of the Irish Thoroughbred Horse Industry (2010)
Brightwells Equine, Cheltenham Sales (2012)
Commission for the Economic Development of Rural Areas (2013)
Dáil Debate, Horse and Greyhound Racing Fund: Motion (2012)
Deloitte, The Economic Impact of British Racing Report (2013)
Doncaster Bloodstock Sales Ltd ., Annual Accounts (2012)
French Racing and Breeding Committee Information Booklet (2012)
Goffs, Annual Accounts (2012)
Horse Racing Ireland Factbooks (2007 – 2012)
Horse Racing Ireland, Go Racing Ireland - Sponsorship Opportunities (2012)
HRI, Letter to the Department of Finance (2010)
Indecon, ‘Review of Certain Aspects of the Irish Horse Racing Industry’ Report (2012)
Ipsos MRBI Survey (2013)
LONGINES World Best Racehorse Rankings (2013)
NUI Maynooth, The Economic Contribution of the 2011 Irish National Hunt Festival at Punchestown to the Economy of Kildare and its surrounding regions (2012)
PMU, Activity Report (2012)
Tattersalls UK Yearling Sales (2012)
Tattersalls UK, Annual Accounts (2012)
Tattersalls Ireland, Annual Accounts (2012)
The International Federation of Horseracing Authorities Annual Report (2011)
Appendix B: Gross Value of the Industry
Research for this report was conducted through a review of available data, with calculations and assumptions as detailed below .
Racecourses and festivals (e361m): First, we estimate the amount spent by the average festival and race meeting attendee respectively . Average festival spending is based on the 2011 NUIM Punchestown report with adjustments made for other festivals . Average race meeting spending is based on a team estimate . Second, we multiply these averages by their respective attendance figures which are sourced from the HRI .
Training fees (e208m): First, we calculate the average fee per horse based on HRI figures for the number of horses in training and total training fee data from the previous
‘Analysis of the Economic Impact of the Irish Thoroughbred Horse Industry’ reports carried out in 2009 and 2010 . Second, we multiply the average training fee per horse by the number of horses in training .
Stock keep fees (e154m): This is obtained through multiplying the number of mares, foals, yearlings and stores by their respective average annual cost of maintenance, which is obtained from the ‘Analysis of the Economic Impact of the Irish Thoroughbred Horse Industry’ 2009 report . Data on the number of mares and foals is sourced from the HRI 2012 Factbook .
Irish Stallion Fees (e144m): This is estimated through the following method . First, the average stallion fee was calculated using data obtained from Irish Thoroughbred Marketing . Second, an upper bound estimate of the total number of mares covered by Irish stallions was calculated using data obtained from Weatherbys General Stud Book . An upper bound estimate was applied to offset the underestimation inherent in choosing the average stallion fee as a measure . This is because in general stallions commanding above average fees tend to cover more mares annually then stallions with below average fees . Finally, we arrive at our total stallion fee figure by multiplying the average stallion fee by the total number of mares covered by Irish stallions . The 2012 figure involves the additional assumption that the average % increase in the total number of mares covered from December 31st of a given year, to when stallion registration is complete, remains constant over time .
Irish domestic public sales (e53m): Total bloodstock sales data are obtained from previous HRI Factbooks . Next, we rely on the Analysis of the Economic Impact of the Irish Thoroughbred Horse Industry 2009 report survey which revealed that 57% of the sales revenue was of domestic origin . We assume that this proportion has remained constant over the last five years and apply it accordingly .
Exports (e174m): HRI Factbook 2012
Appendix C: Employment Calculations
The total and direct employment figures are based on the assumption that annual changes in employment follow changes in the gross value of the industry on a perfectly proportional basis . This is a highly conservative assumption which potentially underestimates the overall level of employment within the industry as employment is less volatile than turnover or profit on average . In addition, this study utilizes the employment data from the ‘Analysis of the Economic Impact of the Irish Thoroughbred Horse Industry’ 2009 report choosing 2010 as the base year for all our calculations . All employment figures refer to full time equivalent employees .
Appendices