analysis of prostate cancer tumor microenvironment
TRANSCRIPT

Prostate Cancer
Analysis of Prostate Cancer Tumor Microenvironment IdentifiesReduced Stromal CD4 Effector T-cell Infiltration in Tumors withPelvic Nodal Metastasis
Chara Ntala a,b, Mark Salji a,b, Jonathan Salmond c, Leah Officer b,d, Anna Vieira Teodosio d,Arnaud Blomme a, Ewan J. McGhee a, Ian Powley e, Imran Ahmad a,b,Marianna Kruithof-de Julio f, George Thalmann f, Ed Roberts a, Carl S. Goodyear g,Tamara Jamaspishvili h, David M. Berman h, Leo M. Carlin a,b, John Le Quesne b,d,e,Hing Y. Leung a,b,*
aCRUK Beatson Institute, Glasgow, UK; b Institute of Cancer Sciences, University of Glasgow, Garscube Estate, Switchback Road, Glasgow, UK; cDepartment of
Pathology, Queen Elizabeth University Hospital, Glasgow, UK; dMedical Research Council Toxicology Unit, University of Cambridge, Leicester, UK; e Leicester
Cancer Research Centre, University of Leicester, Leicester, UK; fDepartment of Urology, Bern University Hospital, University of Bern, Bern, Switzerland;g Institute of Infection, Immunity and Inflammation, University of Glasgow, Glasgow, UK; hDepartment of Pathology and Molecular Medicine, Queen’s
University, Kingston, ON, Canada
E U R O P E A N U R O L O G Y O P E N S C I E N C E 2 9 ( 2 0 2 1 ) 1 9 – 2 9
ava i lable at www.sc iencedirect .com
journa l homepage: www.eu-openscience.europeanurology.com
Article info
Article history:
Accepted May 5, 2021
Associate Editor:
Guillaume Ploussard
Keywords:
Prostate cancerTumor microenvironmentImmune cellsLymph node
Abstract
Background: Pelvic nodal metastasis in prostate cancer impacts patient outcomenegatively.Objective: To explore tumor-infiltrating immune cells as a potential predictive toolfor regional lymph node (LN) metastasis.Design, setting, and participants: We applied multiplex immunofluorescence andtargeted transcriptomic analysis on 94 radical prostatectomy specimens in patientswith (LN+) or without (LN–) pelvic nodal metastases. Both intraepithelial andstromal infiltrations of immune cells and differentially expressed genes (mRNA andprotein levels) were correlated with the nodal status.Outcome measurements and statistical analysis: The identified CD4 effector cellsignature of nodal metastasis was validated in a comparable independent patientcohort of 184 informative cases. Patient outcome analysis and decision curveanalysis were performed with the CD4 effector cell density–based signature.Results and limitations: In the discovery cohort, both tumor epithelium andstroma from patients with nodal metastasis had significantly lower infiltrationof multiple immune cell types, with stromal CD4 effector cells highlighted as thetop candidate marker. Targeted gene expression analysis and confirmatory proteinanalysis revealed key alteration of extracellular matrix components in tumors with
f
. CRanc Tel@be
nodal metastasis. O
* Corresponding author1BD, UK; Institute of CGlasgow, G61 1QH, UK.E-mail address: h.leung
http://dx.doi.org/10.1016/j.euros.2021.05.0012666-1683/© 2021 Published by Elsevier B.V. on behalf of European AssociaBY-NC-ND license (http://creativecommons.org/licenses/by-nc-nd/4.0/).
note, stromal CD4 immune cell density was a significant
UK Beatson Institute, Garscube Estate, Switchback Road, Glasgow, G61er Sciences, University of Glasgow, Garscube Estate, Switchback Road,. +44 141 330 3658.atson.gla.ac.uk (H.Y. Leung).
tion of Urology. This is an open access article under the CC

independent predictor of LN metastasis (odds ratio [OR] = 0.15, p = 0.004), andwas further validated as a significant predictor of nodal metastasis in thevalidation cohort (OR = 0.26, p < 0.001).Conclusions: Decreased T-cell infiltrates in the primary tumor (particularly CD4effector cells) are associated with a higher risk of LN metastasis. Future evalua-tion of CD4-based assays on prostate cancer diagnostic biopsy materials mayimprove selection of at-risk patients for the treatment of LN metastasis.Patient summary: In this report, we found that cancer showing evidence ofcancer metastasis to the lymph nodes tends to have less immune cells presentwithin the tumor. We conclude that the extent of immune cells present within aprostate tumor can help doctors determine the most appropriate treatment planfor individual patients.© 2021 Published by Elsevier B.V. on behalf of European Association of Urology. Thisis an open access article under the CC BY-NC-ND license (http://creativecommons.
org/licenses/by-nc-nd/4.0/).
E U R O P E A N U R O L O G Y O P E N S C I E N C E 2 9 ( 2 0 2 1 ) 1 9 – 2 920
1. Introduction
Prostate cancer (PCa) is the second most prevalent cancer inmen worldwide [1]. During PCa progression, regional lymphnodes (LNs) are common sites for metastases. Even with theadoption of the Briganti nomogram and similar strategies,only around 20% of patients undergoing extended pelvicnode dissection will be confirmed to have histologicalevidence of nodal metastasis. There is a lack of sensitive andspecific markers for predicting cancer spread to the LNs atthe time of diagnosis.
Tumor-infiltrating immune cells have previously beenidentified as prognostic and predictive biomarkers inseveral cancers [2–7]. The exact immune cell subpopula-tion, and its functional polarization and spatial distributionhave been shown to influence cancer aggressiveness,metastatic potential, and clinical outcome for cancerpatients [4,5,8]. Therefore, the in situ cancer immune cellcomposition may have direct clinical implications forprognosis as well as therapeutic responses.
Multiplex immunofluorescence (mIF) has been instru-mental in the investigation of the tumor microenvironment.Fluorescent signals are easily quantifiable due to their linearand additive nature, allowing for more objective andreproducible quantitation compared with chromogenicimmunohistochemistry (IHC) [9]. The benefits of multi-plexing with tyramide signal amplification lie in collectingmaximum information from a single tissue section[10]. Therefore, cell populations can be classified accurately,and their spatial associations and frequency of coexpressionamong different cell types can be determined [4,11].
The reported relationships between tumor-infiltratingimmune cells in PCa with patient outcomes have variedwidely in the literature. Several studies have associateddifferent immune cells, such as macrophages, and CD8 andCD4 T lymphocytes, with PCa patient survival; however,these results have been inconsistent [12–16]. Therefore, it isessential to study the baseline immune status of high-riskdisease in order to gain a better understanding of diseaseprogression and to inform treatment plans. In this study, wehypothesized that a local immune cell signature can predictpelvic nodal metastasis. We further investigated for
potential correlation between tumoral immune infiltratesand common genetic alterations in PCa, such as ERGtranslocation and loss of PTEN expression.
We characterized the tumor immune infiltrates withinradical prostatectomy (RP) specimens by mIF, along withtargeted transcriptomic analysis of the tumor microenvi-ronment. We identified a CD4 effector cell–based tumoralimmune signature of LN+ disease, which was then validatedin a comparable independent patient cohort. Together, weexplored the possibility of exploiting the immune landscapeof intermediate- and high-risk PCa as potential prognosticmarkers for nodal metastasis.
2. Patients and methods
2.1. Discovery cohort
Formalin-fixed, paraffin-embedded (FFPE) histological sections fromintermediate- and high-risk PCa patients who underwent RP andlymphadenectomy with curative intent (50 with and 45 without LNmetastasis) were retrospectively identified between June 04, 2008, andJanuary 23, 2018, at Queen Elizabeth University Hospital in Glasgow. Allpatients found positive for pelvic node following RP and pelvic nodedissection in this period were selected for an analysis. A similar numberof patients with similar clinicopathological factors but negative for pelvicnodes following surgery were then included as controls.
2.2. Validation cohort
To validate findings from the discovery cohort, we studied a tissuemicroarray (TMA) of RP specimens containing primary PCa fromUniversity of Bern. This included 285 patients with primary PCa whounderwent RP. A total of 251 patients had one 0.6 mm core and34 patients had two 0.6 mm cores from the PCa index lesion. Data from184 cases were informative with adequate cancer content in the tissuesamples and interpretable images following staining.
2.3. Laboratory investigations
Methodologies for the following are provided in the Supplementarymaterial:
1 Construction of a TMA2 Multiplex immunofluorescence staining

E U R O P E A N U R O L O G Y O P E N S C I E N C E 2 9 ( 2 0 2 1 ) 1 9 – 2 9 21
3 Machine learning and multispectral analysis (Supplementary Fig. 1)4 Transcriptomic analysis of FFPE tissue using HTG EdgeSeq Precision
Immuno-Oncology Panel (Supplementary Table 1)5 Manual chromogenic IHC and scoring6 Second harmonic generation (SHG) image acquisition and analysis for
the determination of collagen quantity and quality
2.4. Statistical methods
Statistical analyses were carried out with Graph Prism 8 and IBM SPSSstatistics 25. R v3.5.2 software was used for creating CD4 effector T-celldensity plots, survival analysis, receiver operator characteristic (ROC)analysis, and decision curve analysis. Comparisons between groups wereconducted using Mann–Whitney U tests (unpaired, nonparametric, twotailed), and Fisher’s and chi-square tests where appropriate. Kaplan-Meier curves were compared using Cox’s proportional hazards regres-sion model. ROC curve analysis and multivariate logistic regressionmodels were used to identify predictive factors of LN metastasis. For thetargeted gene expression panel, HTG reveal software was used forstatistical analysis using the DESeq2 test with an adjusted p value of<0.05 and a log fold change value of >1.5.
3. Results
3.1. Clinicopathological characteristics
Patient clinicopathological characteristics included in thediscovery TMA are presented in Table 1. Besides their age,patients with and without LN metastasis (LN+, n = 50 andLN–, n = 44, respectively) have highly comparable clinico-pathological parameters (including the number of excisedLNs, preoperative prostate-specific antigen [PSA] levels, pTstage, Gleason score, and presence of perineural invasion).
3.2. Tumoral immune infiltrates are associated with pelvic
nodal disease
We developed two mIF protocols, which allowed for thesimultaneous evaluation of up to six markers in a singleFFPE tissue section (Figs. 1 and 2). Each tissue core wasvisually examined, and cores with benign tissue, tissue
Table 1 – Clinical and histopathological characteristics of the discovery
Overall
N = 94
Age at diagnosis, median (95% CI) 65 (63–66)
Number of lymph nodes excised, median (95% CI) 15 (13–17)
Peak PSA, median (95% CI) 14.8 (12.3–16.7)
Stage, N (%)
pT2 34 (36.17)
pT3-T4 60 (63.83)
Gleason score, N (%)
7 65 (69.15)
>7 (8–9) 29 (30.85)
PNI, N (%)
Negative 15 (15.96)
Positive 79 (84.04)
Relapse-free survival, median (95% CI) 39 (44.3–33.6)
CI = confidence interval; LN = lymph node; PNI = perineural invasion; PSA = proMann-Whitney and Fisher’s exact tests were used for statistical calculations.
folding, or staining artifacts were excluded. The immunecell densities were quantified within the epithelial andstromal compartments separately.
Tumors with LN metastasis generally had less immuneinfiltration (Table 2 and Fig. 3), with significant reducedtumor (both intraepithelial and stromal) infiltration by M1-like macrophages and CD8 effector T cells. Of particularinterest, stromal CD4 effector T-cell infiltration showed alarge difference between LN– and LN+ tumors: 32.5 versus91.35 cells/mm2 (p < 0.001; Table 2). There were nosignificant differences in M2-like macrophages, B cells,CD4 regulatory T cells, CD8 regulatory T cells, CD4 PD-1–positive T cells, and CD8 PD-1–positive T cells betweenpatients with or without LN involvement.
3.3. Common molecular changes in PCa did not correlate with
immune cell densities
Of the 94 patients in our TMA, 92, 91, and 89 had at least twoout of three evaluable cores for ERG, PTEN, and Ki67 stainingby IHC, respectively (Supplementary Table 2 and Supple-mentary Fig. 2). Consistent with the reported incidence ofTMPRSS2/ERG translocation [17,18], 43/92 (47%) stainedpositive for ERG. However, ERG immunoreactivity did notcorrelate with nodal metastasis (p = 0.836). PTEN stainingwas detected in 52/91 (57%) patients. Consistent withprevious reports [19,20], with PTEN loss significantlyassociated with nodal metastasis (p < 0.001). Overall,immune cell infiltrates did not correlate with ERG status,PTEN status, or proliferation index (Ki67 staining; Supple-mentary Tables 3–5).
3.4. Transcriptomic analysis highlighted the association
between altered tumor extracellular matrix and nodal status
To gain additional insight into the molecular mechanismsassociated with LN+ prostate tumors, we used a targetedHTG EdgeSeq Immuno-Oncology panel (SupplementaryTable 1) to compare LN+ versus LN– prostate tumors.
TMA of patients with (LN+) and without (LN–) lymph node metastasis
Lymph node metastasis
LN–, n = 44 LN+, n = 50 p value
67 (66–70) 62 (59–65) <0.00117 (14–18) 13.5 (10–17) 0.05115.5 (11.5–17.7) 14.2 (11–17) 0.831
0.08920 (45.45) 14 (28)24 (54.55) 36 (72)
0.10934 (77.27) 31 (62)10 (22.73) 19 (38)
0.15610 (22.73) 5 (10)34 (77.27) 45 (90)39 (53.9–41.5) 40 (57.1–39.8) 0.404
state-specific antigen; TMA = tissue microarray.

Fig. 1 – Application of a macrophage and B-cell multiplex immunofluorescence panel in prostate cancer primary tumors. (A) A spectrally unmixedprostate cancer core stained with the macrophage and B-cell panel (panel 1). Enlarged subsections of the core highlighted in Figure 1A, showing eachmarkers of the composite image individually after spectral unmixing, together with DAPI nuclear marker (blue pseudocolor) and autofluorescencesignal (black pseudocolor): (B) CD68 (labeled with Opal 520, green pseudocolor), (C) CD163 (labeled with Opal 570, red pseudocolor), (D) AE1/3Pancytokeratin (labeled with Opal 650, magenta pseudocolor), (E) CD20 (labeled with Opal 690, cyan pseudocolor), and (F) cell phenotype map of thesame core as in Figure 1A identifying the cell populations defined by the individual markers of the multiplex immunofluorescence stain. (G) Summaryof each defined cell phenotype (pseudocolor used for visualization and associated markers). (Images shown were obtained at 10T magnification.)
E U R O P E A N U R O L O G Y O P E N S C I E N C E 2 9 ( 2 0 2 1 ) 1 9 – 2 922
Nineteen genes were identified to be differentiallyexpressed: 15 were upregulated and four were down-regulated in LN+ cases (DESeq2, adjusted p < 0.05, foldchange >1.5; Fig. 4A). Interestingly, among the mostupregulated genes in LN+ cases were extracellular matrix(ECM) core proteins, namely, collagen type I and III (COL1A1and COL3A1) and fibronectin 1 (FN1; Fig. 4A). We appliedIHC to study protein expression of collagen I, collagen III,and FN1. In addition, we characterized the collagenstructure by SHG multiphoton microscopy (without theuse of antibodies). Gray level co-occurrence matrix (GLCM)texture analysis was used to compare the SHG images. Thecollagen score derived from the mean decay distance of theSHG signal showed that the structure of collagen I wassignificantly associated with LN spread: 17.72 (interquartilerange [IQR] 11.52–34) in LN+ versus 13.43 (IQR 9.14–21.46)in LN– (p < 0.001; Fig. 4B). In contrast to the findingsregarding the collagen structure, collagen I staining(assaying for its level) within the stroma did not show
any statistically significant differences between the twogroups: 32.92 (95% confidence interval [CI] 29.89–21.8) inLN+ versus 29.87 (95% CI 21.8–37.49) in LN– (p = 0.189;Fig. 4C). Tumors often display a fibrotic stroma, which ischaracterized by increased collagen deposition as well asaltered organization, such as increased collagen density andcollagen fiber elongation [21,22]. In the presence ofunaltered overall collagen abundance, the observed in-creased SHG collagen I density score in LN+ patients eludesto a stroma with increased cross-linking and elongatedcollagen fibers. Collagen III staining within epithelial andstromal compartments was significantly increased in LN+cases: 22.28 (95% CI 15.93–23.79) versus 16.11 (95% CI12.65–17.37, p = 0.006; Fig. 4D). FN1 staining was alsosignificantly increased in LN+ patients: 26.36 (95% CI 20.32–36.94) versus 17.93 (95% CI 10.83–24.23, p = 0.001; Fig. 4E).Despite their association with nodal status, none of theseECM factors were found to be associated with the level ofstromal CD4 effector cell density (Supplementary Table 6).

Fig. 2 – Application of a lymphocytic T-cell multiplex immunofluorescence panel in prostate cancer primary tumors. (A) A spectrally unmixed prostatecancer core stained with the lymphocytic T cell panel (panel 2). Enlarged subsections of the core highlighted in Figure 2A, showing each markers ofthe composite image individually after spectral unmixing, together with DAPI nuclear marker (blue pseudocolor) and autofluorescence signal (blackpseudocolor): (B) CD8 (labeled with Opal 520, red pseudocolor), (C) CD4 (labeled with Opal 570, yellow pseudocolor), (D) AE1/3 Pancytokeratin (labeledwith Opal 620, magenta pseudocolor), (E) FoxP3 (labeled with Opal 690, green pseudocolor), (F) PD-1 (labeled with Opal 650, orange pseudocolor), and(G) Cell phenotype map of the same core as in Figure 2A identifying the cell populations defined by the individual markers of the multipleximmunofluorescence stain. (H) Summary of each defined cell phenotype (pseudocolor used for visualization and associated markers). (Images shownwere obtained at 10T magnification.)
E U R O P E A N U R O L O G Y O P E N S C I E N C E 2 9 ( 2 0 2 1 ) 1 9 – 2 9 23
3.5. Validating tumor immune signature associated with LN+
disease
A summary of the immune cell densities for the validationcohort (184 informative cases; Supplementary Table 7),stratified by nodal status, is presented in SupplementaryTable 8. Consistent with the findings from the discovery TMA,stromal CD4 effector T-cell populations were significantlydecreased in LN+ patients (51.8 vs 100.5 cells/mm2, p < 0.001;Supplementary Table 8). Insignificant trends of reduced tumor(epithelial) CD8 cytotoxic Tcells and (epithelial or stromal) M1-like macrophage infiltration were observed between patientswith and without nodal disease (Supplementary Table 8).
3.6. Stromal CD4 effector cells predicted presence of LN spread
A crucial question was whether different immune cellinfiltrates could be used as predictive biomarkers of LN
invasion. Since stromal CD4 effector T cells wereidentified as the immune cell population reproduciblyassociated with the status of nodal involvement, weformally tested whether stromal CD4 effector T-cellinfiltrates independently predict the presence of pelvicnodal disease. We performed multivariate regressionanalyses on data from the discovery cohort, includingstandard of care clinicopathological factors (namely pTstage, Gleason score from RP, peak preoperative PSA level,and percentage of positive cores) currently used topredict the presence of regional LN metastasis accordingto the Briganti nomogram [23]. Stromal CD4 effector T-cell density remained an independent predictor of LNspread (odds ratio [OR] = 0.15, p = 0.004; Table 3). Simi-larly, based on data from the validation cohort, stromalCD4 effector T-cell density remains a significant indepen-dent predictor of LN metastasis (OR = 0.26, p < 0.001;Table 3).

Table 2 – Comparisons of intraepithelial and stromal immune cell densities (cells/mm2) in patients with and without lymph node metastasis
Immune cell densities,cells/mm2 (95% CI)
All (N = 94) Lymph node metastasis
LN– = 44 LN+ = 50 p value
EpitheliumM1-like macrophages 83 20.64 (17.07–27.45) 16.38 (11.01–21.15) 0.046M2-like macrophages 83 18.46 (11.49–24.9) 16.2 (11.98–31.94) 0.895B cells 83 2.81 (1.41–8.29) 1.7 (0.84–4.2) 0.205CD4 effector T cells 66 23 (13.3–32.9) 18 (11.8–22) 0.093CD4 regulatory T cells 66 3.25 (1–6.2) 1.5 (0–4.2) 0.159CD4 PD-1–positive T cells 57 8.02 (0–18.7) 16.2 (5.87–21.7) 0.19CD8 effector T cells 66 12.6 (6.5–21) 1.8(0.68–5.7) 0.001CD8 regulatory T cell 66 3.8 (0.41–5.69) 2.2 (0.5–4.8) 0.772CD8 PD-1–positive T cells 66 5.3 (0–9.4) 0 (0–6.82) 0.277StromaM1-like macrophages 83 64.04 (39.11–89.31) 45.03 (39.7–55.3) 0.047M2-like macrophages 83 65.32 (53.91–76.92) 73.83 (54.69–83.85) 0.7B cells 83 8.9 (5.27–23.53) 7.05 (4.27–11.51) 0.193CD4 effector T cells 66 91.35 (55.41–154.1) 32.5 (14.1–70.61) <0.001CD4 regulatory T cells 66 4.65 (1.6–7.94) 4.71 (3.6–5.4) 0.971CD4 PD-1–positive T cells 66 7.74 (0–16.2) 8.73 (1.8–13.3) 0.597CD8 effector T cells 66 40.63 (28.1–95.46) 22.7 (11.5–31.38) 0.008CD8 regulatory T cells 66 0.56 (0.29–1.9) 0.51 (0.31–1.7) 0.9CD8 PD-1–positive T cells 66 8.1 (2.9–16.3) 4.66 (0.7–7.9) 0.06
CI = confidence interval; LN = lymph node.Mann-Whitney test was used for all statistical calculations. Significant data on immune infiltrates are presented in bold.
Fig. 3 – Representative multiplex immunofluorescence images showing reduced immune cell infiltration in patients with (LN+; left) versus patientswithout (LN–; right) LN metastasis. Images are spectrally unmixed for (A) panel 1: macrophage and B cell and (B) panel 2: T lymphocyte. LN = lymphnode.
E U R O P E A N U R O L O G Y O P E N S C I E N C E 2 9 ( 2 0 2 1 ) 1 9 – 2 924

Fig. 4 – Extracellular matrix components with the primary tumors are increased and disorganized in patients with lymph node metastasis. (A)Differentially expressed genes in patients with and without lymph node metastasis revealed upregulation of core ECM components (namely collagen I/COL1A1, collagen III/COL3A1, and fibronectin 1/FN1) in patients with LN metastasis (fold change >1.5, adjusted p < 0.05). (B) Mean decay distance of thesecond harmonic generation (SHG) signal emitted by fibrillar collagen I. Mean decay distance is represented by boxplots showing the second and thirdquartiles of the data, with the whiskers indicating the maximum and minimum data points for LN– (n = 89) and LN+ (n = 113) cores. Outliers areshown by individual data points. (C) Percentage of stroma positive for collagen I staining is presented as median with 95% CI in LN– (n = 41) and LN+(n = 46) patients. Collagen I was restricted to stroma, and in order to avoid confounding from the relative epithelial/stromal ratio in each core, wequantified the presence of collagen I within the stromal compartment only. (D) Percentage (%) of collagen III staining is presented as median with 95%CI in LN– (n = 44) and LN+ (n = 47) patients. Lymph node–positive tumors had higher collagen III immunoreactivity. (E) Percentage of FN1 staining ispresented as median with 95% CI in LN– (n = 34) and LN+ (n = 45) patients. Two-tailed Mann-Whitney test was used for all statistical comparisons.CI = confidence interval; ECM = extracellular matrix; LN = lymph node.
E U R O P E A N U R O L O G Y O P E N S C I E N C E 2 9 ( 2 0 2 1 ) 1 9 – 2 9 25

Table 3 – Multivariate regression analysis of stromal CD4 effector T cells with standard of care clinicopathological factors commonly used forthe prediction of nodal metastasis
OR 95% CI p value
Discovery cohortpT stage 2.96 0.72–12.12 0.131Gleason score 1.05 0.24–4.57 0.944Peak preop PSA 0.99 0.94–1.03 0.719Percentage of positive cores 1.01 0.99–1.03 0.175Number of lymph nodes excised 0.95 0.87–1.03 0.254High stromal CD4 effector T cells 0.15 0.04–0.53 0.004Validation TMApT stage 2.49 1.17–5.27 0.017Gleason score 3.74 1.48–9.44 0.005Peak preop PSA 1.04 1.02–1.5 <0.001High stromal CD4 effector T cells 0.26 0.12–0.54 <0.001
CI = confidence interval; OR = odds ratio; PSA = prostate-specific antigen; TMA = tissue microarray.For pT stage, the reference was pT2 versus pT3–4. For Gleason score, the reference was Gleason score 7 versus Gleason score >7.In the discovery cohort, high density of stromal CD4 effector T cells (upper two tertiles) was an independent predictor of lymph node metastasis. In thevalidation cohort, high density of stromal CD4 effector T cells (upper tertile) was an independent predictor of lymph node metastasis. Significant data onimmune infiltrates are presented in bold.
E U R O P E A N U R O L O G Y O P E N S C I E N C E 2 9 ( 2 0 2 1 ) 1 9 – 2 926
3.7. Increased stromal CD4 effector cells were associated with
improved survival
During tumor progression, pelvic LNs are common sites formetastases. All cancer staging systems, including the TNMstaging system for PCa, assess the presence of LN involvementas part of clinical evaluation of patient prognosis [24]. Apply-ing Youden’s Index analysis, we determined the thresholdCD4 effector T-cell density in the validation cohort to be53.15 cells/mm2, which was applied to the discovery andvalidation cohorts as a cutoff to define the CD4 effector statusin a multivariate generalized linear model in predicting nodalstatus: discoverycohort (n = 94), p = 0.015; validation cohort(n = 182), p = 0.0003. An ROC analysis showed increased areaunder the curve (AUC) with the addition of CD4 effector T-cellstatus, although not reaching statistical significance byDelong’s test (discovery cohort: AUC = 60.2 vs 70.6,p = 0.13; validation cohort: AUC = 78.1 vs 80.5, p = 0.32;Fig. 5A and B). Decision curve analysis was then performedshowing the standardized net benefit for risk thresholds,suggesting that the addition of CD4 effector cell status mayimprove the performance in detecting nodal metastasis(solid green vs solid red line in Fig. 5C), with the greatestbenefit versus risk (signified by the largest differencebetween true positive and false positive findings) in patientswith medium risk (risk threshold range of 0.4–0.6; Fig. 5D). Inaddition, analysis of the overall positive and the true positivefor node-positive disease also suggested the usefulness ofCD4 effector cell status as a marker in the medium- to high-risk range (risk threshold >0.4; Fig. 5E). Consistent with theliterature, the presence of nodal metastasis was associatedwith less favorable relapse-free survival in the validationcohort (Fig. 5F). Applying tumor stromal CD4 effector T-celldensity to stratify patients in the validation cohort, patientswith reduced CD4 effector T cells were found to have poorerrelapse-free survival outcome (Cox’s proportional hazardsmodel p = 0.03, hazard ratio = 1.49, n = 168, 132 events;Fig. 5G).
4. Discussion
To the best of our knowledge, this is the first study to havecarried out a comprehensive analysis of the tumor immuneinfiltrates and the tumor transcriptome to investigate forpotential associations with PCa pelvic nodal metastasis.There has been significant progress in gene expressionapproaches to PCa prognostication [25]. However, there hasbeen little advancement in protein-based approaches, eventhough dysregulated protein expression is more directlylinked with the phenotype of invasive PCa. We propose thatthe addition of stromal CD4 effector T-cell immune celldensity of intermediate- and high-risk tumors can improvethe current algorithms of nodal metastasis prediction toolssuch as the Briganti nomogram [23]. This could easily beimplemented at the diagnostic biopsy setting and poten-tially spare patients from the unnecessary side effects of LNdissection. Similarly, a tumor immune signature informeddecision on whole pelvic radiation can be based on thelikelihood of nodal disease. While the adoption of quanti-tative mIF in the clinical setting may be challenging, futureoptimization of a chromogenic IHC assay warrants assess-ment in diagnostic prostate needle biopsy cores.
For the first time, we show that stromal CD4 effector T-cell infiltration significantly correlates with LN metastasisin PCa. Even though CD8 T-cell infiltration is generallyaccepted as a tumor suppressive immune subpopulation,CD4 effector T cells have been highlighted as key players ofthe immune response [26]. Effector helper T cells areessential for the initiation and maintenance of anticancerimmune responses. They are known to induce thetransformation of cytotoxic T cells into long-lived functionaleffector cells [27].
Impaired immune infiltrates in progressing tumors mayresult from the lack of migration cues mediated bychemokines required for T-cell receptor stimulation. Datafrom our transcriptomic analysis on chemokine expressionwas not conclusive, with three chemokines found to be
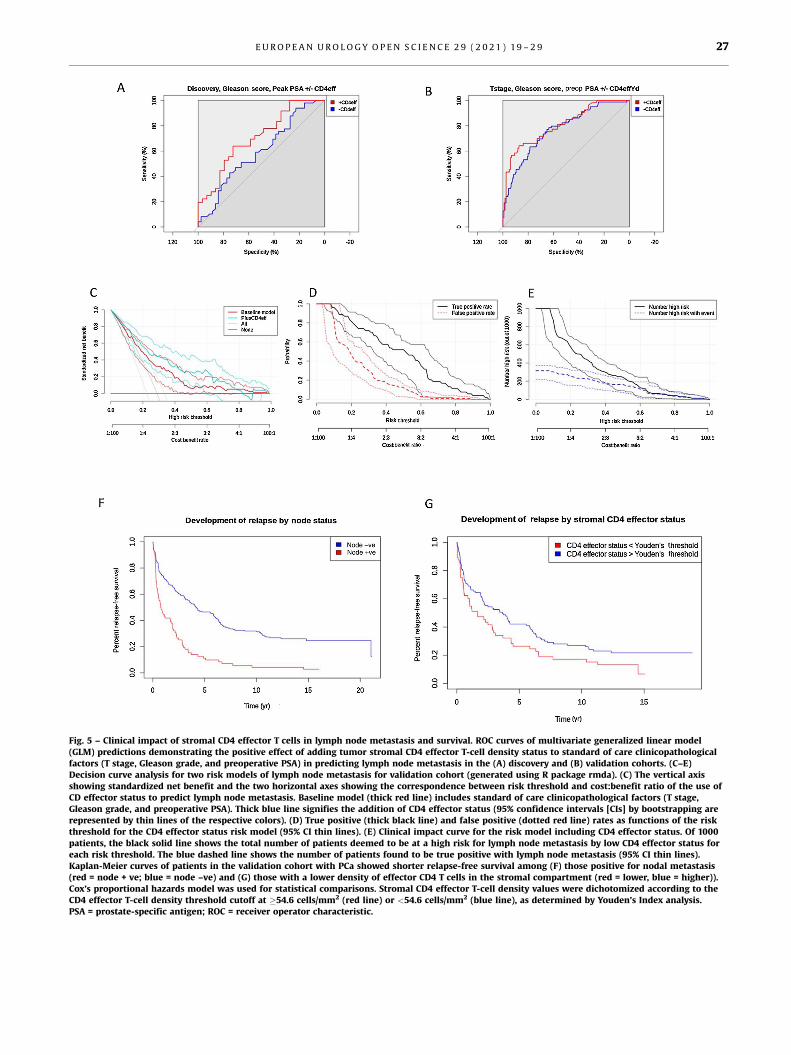
Fig. 5 – Clinical impact of stromal CD4 effector T cells in lymph node metastasis and survival. ROC curves of multivariate generalized linear model(GLM) predictions demonstrating the positive effect of adding tumor stromal CD4 effector T-cell density status to standard of care clinicopathologicalfactors (T stage, Gleason grade, and preoperative PSA) in predicting lymph node metastasis in the (A) discovery and (B) validation cohorts. (C–E)Decision curve analysis for two risk models of lymph node metastasis for validation cohort (generated using R package rmda). (C) The vertical axisshowing standardized net benefit and the two horizontal axes showing the correspondence between risk threshold and cost:benefit ratio of the use ofCD effector status to predict lymph node metastasis. Baseline model (thick red line) includes standard of care clinicopathological factors (T stage,Gleason grade, and preoperative PSA). Thick blue line signifies the addition of CD4 effector status (95% confidence intervals [CIs] by bootstrapping arerepresented by thin lines of the respective colors). (D) True positive (thick black line) and false positive (dotted red line) rates as functions of the riskthreshold for the CD4 effector status risk model (95% CI thin lines). (E) Clinical impact curve for the risk model including CD4 effector status. Of 1000patients, the black solid line shows the total number of patients deemed to be at a high risk for lymph node metastasis by low CD4 effector status foreach risk threshold. The blue dashed line shows the number of patients found to be true positive with lymph node metastasis (95% CI thin lines).Kaplan-Meier curves of patients in the validation cohort with PCa showed shorter relapse-free survival among (F) those positive for nodal metastasis(red = node + ve; blue = node –ve) and (G) those with a lower density of effector CD4 T cells in the stromal compartment (red = lower, blue = higher)).Cox’s proportional hazards model was used for statistical comparisons. Stromal CD4 effector T-cell density values were dichotomized according to theCD4 effector T-cell density threshold cutoff at �54.6 cells/mm2 (red line) or <54.6 cells/mm2 (blue line), as determined by Youden’s Index analysis.PSA = prostate-specific antigen; ROC = receiver operator characteristic.
E U R O P E A N U R O L O G Y O P E N S C I E N C E 2 9 ( 2 0 2 1 ) 1 9 – 2 9 27

E U R O P E A N U R O L O G Y O P E N S C I E N C E 2 9 ( 2 0 2 1 ) 1 9 – 2 928
significantly upregulated (Fig. 4A). Upregulated ISG15 andAFI6 expression in tumors with nodal disease is consistentwith increased tumorigenesis, but upregulated CXCL14levels were suggested to suppress cancer invasion. Instead,core ECM molecules were increased at both mRNA andprotein levels in LN+ patients. Enhanced ECM depositionand remodeling results in a more disorganized and fibroticstroma in LN+ patients. Tumor-associated fibrosis is a well-established regulator of tumor progression but can also be acritical regulator of immune surveillance [28–31]. Highcollagen density may function as a physical barrier for T-cellinfiltration in pancreatic ductal adenocarcinoma and wasable to abolish completely chemokine-guided movement[30]. Our results are consistent with the notion that aremodeled and denser ECM may hinder effector T-cellinfiltration in PCa in the context of regional LN tumorinfiltration.
Despite the overall validity of the data produced bymultispectral imaging, some limitations should be men-tioned. There was some degree of crosstalk betweenfluorophores with overlapping emission spectra, that is,FoxP3 Opal 690/PD-1 Opal 650 and AE1/3 Opal 620. Thisproblem was circumvented by phenotyping cells based ontheir cellular morphology as well as marker expression.Finally, our study suffers the key risk of undersampling dueto tumor heterogeneity. Nonetheless, the fact that ourimmune signature was validated in an independent cohortprovides confidence to our working model.
While the transcriptomic analysis was performed onprostate biopsy materials, we have carefully selected thebiopsy cores from the respective index lesions that wereincorporated in the TMA; thus data from transcriptomicanalysis are relevant to observations from the mIF experi-ment. Furthermore, candidate genes identified to bedifferentially expressed were further studied at the proteinlevel (including the level of stromal collagen or fibronectinpresent) using the same TMA studied for mIF. In this way,data on candidate markers within the ECM can beinterpreted with confidence to tumor immune infiltrates.To date, no clear causality between ECM density andimmune exclusion has been established in PCa. Indeed, wedid not find a clear relationship between expression of ECMproteins and CD4 effector status. The efficacy of single-agent immunotherapies in PCa have so far been unsuccess-ful [32]. Our data suggest that stratification of PCa tumorsbased on tumor microenvironment warrants furtherinvestigations. Finally, the discovery cohort was selectedto include similar number of patients with and withoutnodal metastasis. As a result of such biased nature, we havenot included this cohort in patient outcome analysis. Futureevaluation of CD4 effector cell density in additional clinicalcohorts is required.
5. Conclusions
Decreased T-cell infiltrates in the primary tumor (particu-larly CD4 effector cells) are associated with a higher risk ofLN metastasis. Future evaluation of CD4-based assays on
PCa diagnostic biopsy materials may improve selection ofat-risk patients for treatment of LN metastasis.
Author contributions: Hing Y. Leung had full access to all the data in thestudy and takes responsibility for the integrity of the data and theaccuracy of the data analysis.
Study concept and design: Ntala, Salmond, Carlin, Le Quesne, Blomme,Goodyear, Kruithof-de Julio, Thalmann, Jamaspishvili, Berman, Roberts,Ahmad, Leung.Acquisition of data: Ntala, Salmond, Officer, Teodosio, McGhee, Powley,Jamaspishvili, Berman, Leung.Analysis and interpretation of data: Ntala, Salji, Salmond, Officer, Teodosio,McGhee, Powley, Jamaspishvili, Berman, Leung.Drafting of the manuscript: Ntala, Salji, Blomme, Le Quesne, Goodyear,Leung.Critical revision of the manuscript for important intellectual content: Carlin,Salmond, Kruithof-de Julio, Thalmann, Jamaspishvili, Berman, Roberts,Ahmad.Statistical analysis: Ntala, Salji.Obtaining funding: Ntala, Carlin, Le Quesne, Thalmann, Berman, Leung.Administrative, technical, or material support: None.Supervision: None.Other: None.
Financial disclosures: Hing Y. Leung certifies that all conflicts of interest,including specific financial interests and relationships and affiliationsrelevant to the subject matter or materials discussed in the manuscript(eg, employment/affiliation, grants or funding, consultancies, honoraria,stock ownership or options, expert testimony, royalties, or patents filed,received, or pending), are the following: None.
Funding/Support and role of the sponsor: CRUK (A22904, A17196,A19661, A23983).
Appendix A. Supplementary data
Supplementary material related to this article can befound, in the online version, at doi:https://doi.org/10.1016/j.euros.2021.05.001.
References
[1] Rawla P. Epidemiology of prostate cancer. World J Oncol2019;10:63–89.
[2] Angell H, Galon J. From the immune contexture to the Immuno-score: the role of prognostic and predictive immune markers incancer. Curr Opin Immunol 2013;25:261–7.
[3] Galon J, Mlecnik B, Bindea G, et al. Towards the introduction of the’Immunoscore’ in the classification of malignant tumours. J Pathol2014;232:199–209.
[4] Mezheyeuski A, Bergsland CH, Backman M, et al. Multispectralimaging for quantitative and compartment-specific immune infil-trates reveals distinct immune profiles that classify lung cancerpatients. J Pathol 2018;244:421–31.
[5] Carstens JL, Correa de Sampaio P, Yang D, et al. Spatial computationof intratumoral T cells correlates with survival of patients withpancreatic cancer. Nat Commun 2017;8:15095.
[6] Brown JR, Wimberly H, Lannin DR, Nixon C, Rimm DL, Bossuyt V.Multiplexed quantitative analysis of CD3, CD8, and CD20 predictsresponse to neoadjuvant chemotherapy in breast cancer. Clin Can-cer Res 2014;20:5995–6005.

E U R O P E A N U R O L O G Y O P E N S C I E N C E 2 9 ( 2 0 2 1 ) 1 9 – 2 9 29
[7] Geissler K, Fornara P, Lautenschlager C, Holzhausen HJ, Seliger B,Riemann D. Immune signature of tumor infiltrating immune cells inrenal cancer. Oncoimmunology 2015;4:e985082.
[8] Fridman WH, Pagès F, Sautès-Fridman C, Galon J. The immunecontexture in human tumours: impact on clinical outcome. NatRev Cancer 2012;12:298–306.
[9] Huang W, Hennrick K, Drew S. A colorful future of quantitativepathology: validation of Vectra technology using chromogenicmultiplexed immunohistochemistry and prostate tissue microar-rays. Hum Pathol 2013;44:29–38.
[10] Toth ZE, Mezey E. Simultaneous visualization of multiple antigenswith tyramide signal amplification using antibodies from the samespecies. J Histochem Cytochem 2007;55:545–54.
[11] Stack EC, Wang C, Roman KA, Hoyt CC. Multiplexed immunohis-tochemistry, imaging, and quantitation: a review, with an assess-ment of tyramide signal amplification, multispectral imaging andmultiplex analysis. Methods 2014;70:46–58.
[12] Gollapudi K, Galet C, Grogan T, et al. Association between tumor-associated macrophage infiltration, high grade prostate cancer, andbiochemical recurrence after radical prostatectomy. Am J CancerRes 2013;3:523–9.
[13] Cao J, Liu J, Xu R, Zhu X, Zhao X, Qian BZ. Prognostic role of tumour-associated macrophages and macrophage scavenger receptor 1 inprostate cancer: a systematic review and meta-analysis. Oncotarget2017;8:83261–9.
[14] Ness N, Andersen S, Valkov A, et al. Infiltration of CD8+ lymphocytesis an independent prognostic factor of biochemical failure-freesurvival in prostate cancer. Prostate 2014;74:1452–61.
[15] Flammiger A, Bayer F, Cirugeda-Kuhnert A, et al. Intratumoral T butnot B lymphocytes are related to clinical outcome in prostatecancer. Acta Pathol Microbiol Immunol Scand 2012;120:901–8.
[16] McArdle PA, Canna K, McMillan DC, McNicol AM, Campbell R,Underwood MA. The relationship between T-lymphocyte subsetinfiltration and survival in patients with prostate cancer. Br J Cancer2004;91:541–3.
[17] Gopalan A, Leversha MA, Satagopan JM, et al. TMPRSS2-ERG genefusion is not associated with outcome in patients treated by pros-tatectomy. Cancer Res 2009;69:1400–6.
[18] Demichelis F, Fall K, Perner S, et al. TMPRSS2:ERG gene fusionassociated with lethal prostate cancer in a watchful waiting cohort.Oncogene 2007;26:4596–9.
[19] Lotan TL, Gurel B, Sutcliffe S, et al. PTEN protein loss by immuno-staining: analytic validation and prognostic indicator for a high risk
surgical cohort of prostate cancer patients. Clin Cancer Res2011;17:6563–73.
[20] Lotan TL, Wei W, Morais CL, et al. PTEN loss as determined byclinical-grade immunohistochemistry assay is associated withworse recurrence-free survival in prostate cancer. Eur Urol Focus2016;2:180–8.
[21] Lu P, Weaver VM, Werb Z. The extracellular matrix: a dynamic nichein cancer progression. J Cell Biol 2012;196:395–406.
[22] Peranzoni E, Rivas-Caicedo A, Bougherara H, Salmon H, DonnadieuE. Positive and negative influence of the matrix architecture onantitumor immune surveillance. Cell Mol Life Sci 2013;70:4431–48.
[23] Briganti A, Larcher A, Abdollah F, et al. Updated nomogrampredicting lymph node invasion in patients with prostate cancerundergoing extended pelvic lymph node dissection: theessential importance of percentage of positive cores. Eur Urol2012;61:480–7.
[24] Amin MB, Edge S, Greene F, et al., editors.AJCC cancer stagingmanual. ed. 8. Springer; 2017.
[25] Peng Z, Skoog L, Hellborg H, et al. An expression signature atdiagnosis to estimate prostate cancer patients’ overall survival.Prostate Cancer Prostatic Dis 2014;17:81–90.
[26] Wakabayashi O, Yamazaki K, Oizumi S, et al. CD4+ T cells in cancerstroma, not CD8+ T cells in cancer cell nests, are associated withfavorable prognosis in human non-small cell lung cancers. CancerSci 2003;94:1003–9.
[27] Bevan MJ. Helping the CD8(+) T-cell response. Nat Rev Immunol2004;4:595–602.
[28] Jiang H, Hegde S, DeNardo DG. Tumor-associated fibrosis as aregulator of tumor immunity and response to immunotherapy.Cancer Immunol Immunother 2017;66:1037–48.
[29] Salmon H, Franciszkiewicz K, Damotte D, et al. Matrix architecturedefines the preferential localization and migration of T cells into thestroma of human lung tumors. J Clin Invest 2012;122:899–910.
[30] Hartmann N, Giese NA, Giese T, et al. Prevailing role of contactguidance in intrastromal T-cell trapping in human pancreatic can-cer. Clin Cancer Res 2014;20:3422–33.
[31] Bougherara H, Mansuet-Lupo A, Alifano M, et al. Real-time imagingof resident T cells in human lung and ovarian carcinomas revealshow different tumor microenvironments control T lymphocytemigration. Front Immunol 2015;6:500.
[32] Topalian SL, Hodi FS, Brahmer JR, et al. Safety, activity, and immunecorrelates of anti-PD-1 antibody in cancer. N Engl J Med2012;366:2443–54.