analysis of power and dimensions of european tractors · steyr 4055 kompakt s; 4085, 4105 kompakt;...
TRANSCRIPT
Abstract— The tractor is an important machine for every
European farmer. It is typically propelled by a Diesel-engine,
while pure electric and hybrid drives gain interest. Only a few
international manufacturers are manufacturing the enormous
scope of tractor-models available on the European market. To save
costs, several platform models have been established. They are
labelled and sold under various brands. Therefore, 117 tractor
models have been analyzed that were available on the Austrian
market until the end of 2013. The aim was to identify if there are
correlations of technical data (e.g. power and vehicle mass). Some
additional values have been derived from them. It could be shown,
that large tractors are equipped with relatively small sized tires.
Large tractors generate higher pressure and shear stress in the
contact area than small ones. A factor for the tire diameter was
developed to obtain equal pressure and shear stress.
Keywords agricultural tractors; power; tire; dimensions
I. INTRODUCTION
A tractor is an important machine for every European farmer that is used to accomplish a wide variety of applications and implements. Low production- and operation-costs are essential for its user, as well as for the manufacturer to be successful on the market. Consequently, tractor-manufacturers are developing tractor-platform models [1]. The diverse global requirements refer to different engine power, gearbox, PTO speeds, IT-levels, and exhaust-gas systems [2]. The power of new tractor models increases steadily, as does their mass. Therefore, it is interesting to compare data from tractors of different sizes.
II. MATERIAL AND METHOD
Relevant data of tractors which were available on the Austrian market until the end of 2013 (Table I) have been collected by RAMMEL [3] at the Francisco Josephinum in Wieselburg (Austria). The analyzed tractors represent about 88 % of the newly registered tractors in Austria in 2013 [4]. The data have been collected from online databases and brochures. Own measurements have not been executed. The power values considered different test codes [5, 6]. Furthermore, relevant values have been calculated from the collected data:
𝑐𝑚 =𝐻∙𝑛
30(1)
𝑃𝑙𝑡 =𝑃𝑛𝑜𝑚
𝑉𝐻(2)
𝐺𝑃 =𝐺
𝑃𝑛𝑜𝑚(3)
𝑝𝑖 =120∙𝑃𝑛𝑜𝑚
𝑉𝐻∙𝑛(4)
Herein the mean piston velocity is cm (in m/s), the piston stroke H (in m), the rated engine speed n (in rpm), the relative engine power Plt (in kW/cm³), the nominal engine power Pnom (in kW), the displacement VH (in cm³), the weight per power GP (in kg/kW), the weight G (in kg), and the mean piston pressure pi (in Pa).
TABLE I. ANALYZED TRACTOR MODELS
Brand Model type
Fendt
207, 209, 211 Vario; 309, 311, 313 Vario; 411, 413, 415
Vario; 512, 514, 516 Vario; 716, 720, 724 Vario; 822, 826, 828 Vario; 927, 933, 939 Vario
Claas 210, 230, Elios; 310, 340 Axos; 410, 430 Arion; 530, 550
Arion; 620, 650 Arion
John
Deere
5080, 5090 G; 5070, 5100 M; 5080, 5100 R; 6115, 6140,
6170 M;
6105, 6150, 6210 R; 7200, 7230, 7280 R; 8260, 8310, 8360 R
Lindner 64, 74, 84ep, 94 Geotrac;
104, 114ep, 124, 134ep Geotrac
Steyr
4055 Kompakt S; 4085, 4105 Kompakt; 4095, 4115
Multi;
4130, 6140 Profi; 4130 Profi-CVT; 6130, 6185, 6230 CVT
Case 55 C, 75 C Farmall; 110, 130, 140 Maxxum;
130, 185, 230 Puma CVX; 235, 290, 340 Magnum
Valtra 83, 93 A; 113, 143, 163 N; 132, 172, 202 T Versu; 232,
292, 352 S
Deutz-
Fahr
310, 320 Agroplus; 410, 420 Agroplus; 5100, 5110, 5120,
5130 TTV; 6150.4, 6160, 6190 TTV; 7210, 7230, 7250 TTV
Massey-
Ferguson
3660 F; 5608, 5610 MF; 6612, 6615 Dyna-4;
6614, 6616 Dyna-6; 7614, 7619, 7626 MF
III. RESULTS & DISCUSSION
A. Power related data
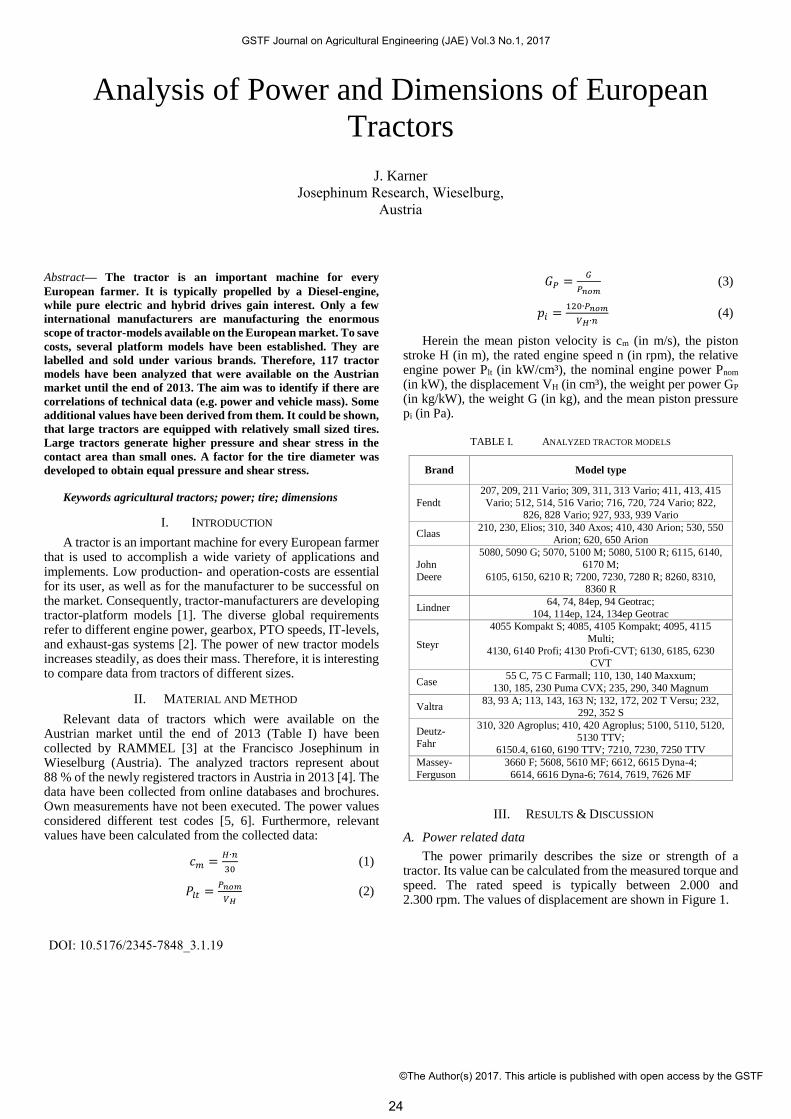
The power primarily describes the size or strength of atractor. Its value can be calculated from the measured torque and speed. The rated speed is typically between 2.000 and 2.300 rpm. The values of displacement are shown in Figure 1.
Analysis of Power and Dimensions of European
Tractors
J. Karner
Josephinum Research, Wieselburg, Austria
GSTF Journal on Agricultural Engineering (JAE) Vol.3 No.1, 2017
©The Author(s) 2017. This article is published with open access by the GSTF
DOI: 10.5176/2345-7848_3.1.19
24
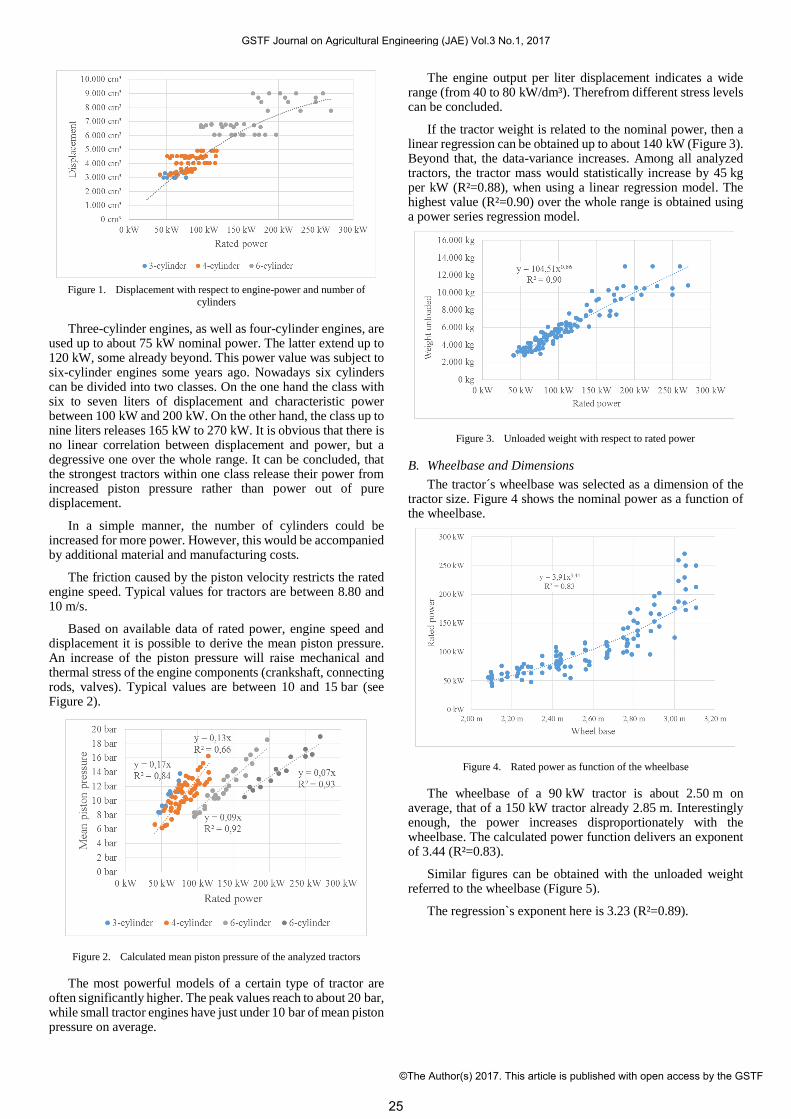
Figure 1. Displacement with respect to engine-power and number of
cylinders
Three-cylinder engines, as well as four-cylinder engines, are used up to about 75 kW nominal power. The latter extend up to 120 kW, some already beyond. This power value was subject to six-cylinder engines some years ago. Nowadays six cylinders can be divided into two classes. On the one hand the class with six to seven liters of displacement and characteristic power between 100 kW and 200 kW. On the other hand, the class up to nine liters releases 165 kW to 270 kW. It is obvious that there is no linear correlation between displacement and power, but a degressive one over the whole range. It can be concluded, that the strongest tractors within one class release their power from increased piston pressure rather than power out of pure displacement.
In a simple manner, the number of cylinders could be increased for more power. However, this would be accompanied by additional material and manufacturing costs.
The friction caused by the piston velocity restricts the rated engine speed. Typical values for tractors are between 8.80 and 10 m/s.
Based on available data of rated power, engine speed and displacement it is possible to derive the mean piston pressure. An increase of the piston pressure will raise mechanical and thermal stress of the engine components (crankshaft, connecting rods, valves). Typical values are between 10 and 15 bar (see Figure 2).
Figure 2. Calculated mean piston pressure of the analyzed tractors
The most powerful models of a certain type of tractor are often significantly higher. The peak values reach to about 20 bar, while small tractor engines have just under 10 bar of mean piston pressure on average.
The engine output per liter displacement indicates a wide range (from 40 to 80 kW/dm³). Therefrom different stress levels can be concluded.
If the tractor weight is related to the nominal power, then a linear regression can be obtained up to about 140 kW (Figure 3). Beyond that, the data-variance increases. Among all analyzed tractors, the tractor mass would statistically increase by 45 kg per kW (R²=0.88), when using a linear regression model. The highest value (R²=0.90) over the whole range is obtained using a power series regression model.
Figure 3. Unloaded weight with respect to rated power
B. Wheelbase and Dimensions
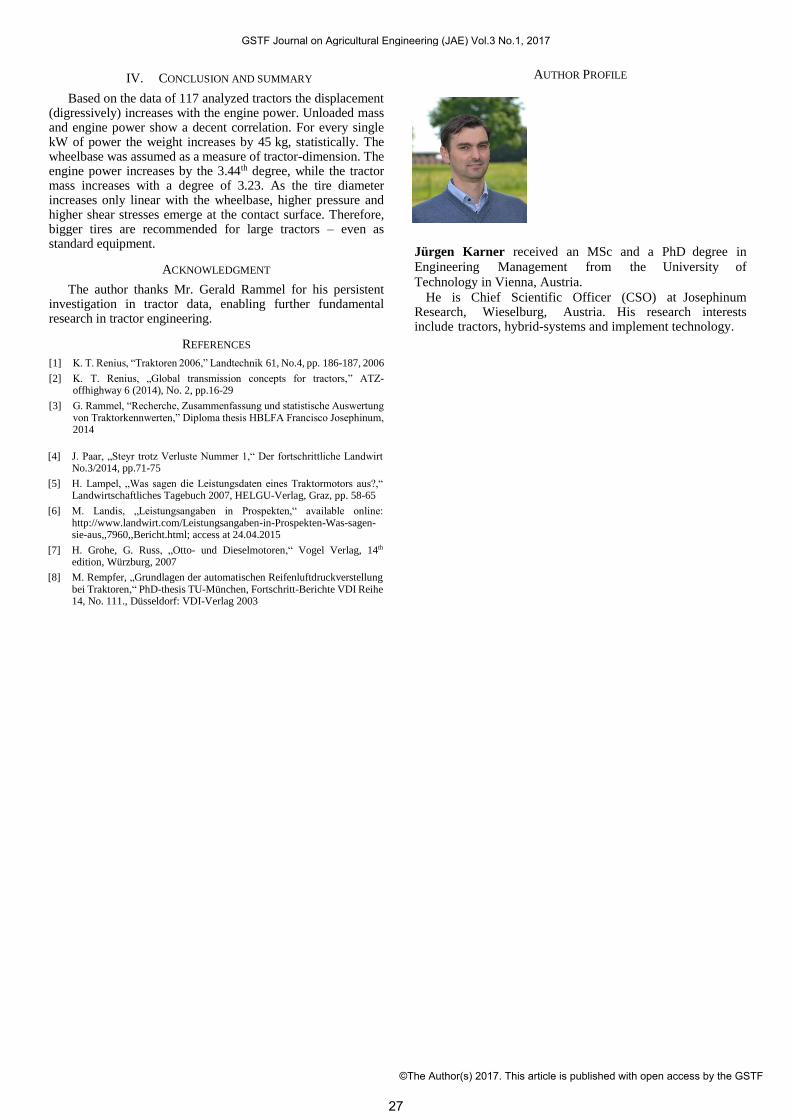
The tractor´s wheelbase was selected as a dimension of the tractor size. Figure 4 shows the nominal power as a function of the wheelbase.
Figure 4. Rated power as function of the wheelbase
The wheelbase of a 90 kW tractor is about 2.50 m on average, that of a 150 kW tractor already 2.85 m. Interestingly enough, the power increases disproportionately with the wheelbase. The calculated power function delivers an exponent of 3.44 (R²=0.83).
Similar figures can be obtained with the unloaded weight referred to the wheelbase (Figure 5).
The regression`s exponent here is 3.23 (R²=0.89).
GSTF Journal on Agricultural Engineering (JAE) Vol.3 No.1, 2017
©The Author(s) 2017. This article is published with open access by the GSTF
25
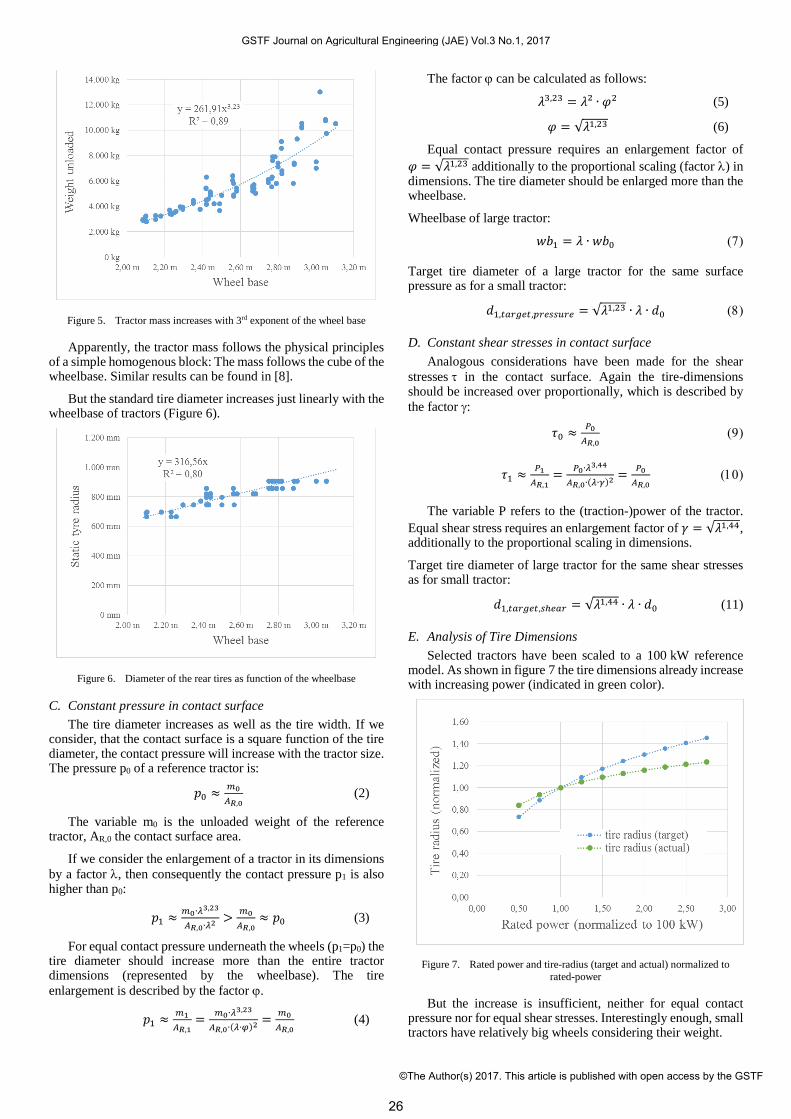
Figure 5. Tractor mass increases with 3rd exponent of the wheel base
Apparently, the tractor mass follows the physical principles of a simple homogenous block: The mass follows the cube of the wheelbase. Similar results can be found in [8].
But the standard tire diameter increases just linearly with the wheelbase of tractors (Figure 6).
Figure 6. Diameter of the rear tires as function of the wheelbase
C. Constant pressure in contact surface
The tire diameter increases as well as the tire width. If we consider, that the contact surface is a square function of the tire diameter, the contact pressure will increase with the tractor size. The pressure p0 of a reference tractor is:
𝑝0 ≈𝑚0
𝐴𝑅,0 (2)
The variable m0 is the unloaded weight of the reference tractor, AR,0 the contact surface area.
If we consider the enlargement of a tractor in its dimensions
by a factor , then consequently the contact pressure p1 is also higher than p0:
𝑝1 ≈𝑚0∙𝜆
3,23
𝐴𝑅,0∙𝜆2 >
𝑚0
𝐴𝑅,0≈ 𝑝0 (3)
For equal contact pressure underneath the wheels (p1=p0) the tire diameter should increase more than the entire tractor dimensions (represented by the wheelbase). The tire
enlargement is described by the factor .
𝑝1 ≈𝑚1
𝐴𝑅,1=
𝑚0∙𝜆3,23
𝐴𝑅,0∙(𝜆∙𝜑)2 =
𝑚0
𝐴𝑅,0 (4)
The factor can be calculated as follows:
𝜆3,23 = 𝜆² ∙ 𝜑2 (5)
𝜑 = √𝜆1,23 (6)
Equal contact pressure requires an enlargement factor of
𝜑 = √𝜆1,23 additionally to the proportional scaling (factor ) in dimensions. The tire diameter should be enlarged more than the wheelbase.
Wheelbase of large tractor:
𝑤𝑏1 = 𝜆 ∙ 𝑤𝑏0
Target tire diameter of a large tractor for the same surface pressure as for a small tractor:
𝑑1,𝑡𝑎𝑟𝑔𝑒𝑡,𝑝𝑟𝑒𝑠𝑠𝑢𝑟𝑒 = √𝜆1,23 ∙ 𝜆 ∙ 𝑑0
D. Constant shear stresses in contact surface
Analogous considerations have been made for the shear
stresses in the contact surface. Again the tire-dimensions should be increased over proportionally, which is described by
the factor :
𝜏0 ≈𝑃0
𝐴𝑅,0
𝜏1 ≈𝑃1
𝐴𝑅,1=
𝑃0∙𝜆3,44
𝐴𝑅,0∙(𝜆∙𝛾)2 =
𝑃0
𝐴𝑅,0
The variable P refers to the (traction-)power of the tractor.
Equal shear stress requires an enlargement factor of 𝛾 = √𝜆1,44, additionally to the proportional scaling in dimensions.
Target tire diameter of large tractor for the same shear stresses as for small tractor:
𝑑1,𝑡𝑎𝑟𝑔𝑒𝑡,𝑠ℎ𝑒𝑎𝑟 = √𝜆1,44 ∙ 𝜆 ∙ 𝑑0 (11)
E. Analysis of Tire Dimensions
Selected tractors have been scaled to a 100 kW reference model. As shown in figure 7 the tire dimensions already increase with increasing power (indicated in green color).
Figure 7. Rated power and tire-radius (target and actual) normalized to
rated-power
But the increase is insufficient, neither for equal contact pressure nor for equal shear stresses. Interestingly enough, small tractors have relatively big wheels considering their weight.
GSTF Journal on Agricultural Engineering (JAE) Vol.3 No.1, 2017
©The Author(s) 2017. This article is published with open access by the GSTF
26
IV. CONCLUSION AND SUMMARY
Based on the data of 117 analyzed tractors the displacement (digressively) increases with the engine power. Unloaded mass and engine power show a decent correlation. For every single kW of power the weight increases by 45 kg, statistically. The wheelbase was assumed as a measure of tractor-dimension. The engine power increases by the 3.44th degree, while the tractor mass increases with a degree of 3.23. As the tire diameter increases only linear with the wheelbase, higher pressure and higher shear stresses emerge at the contact surface. Therefore, bigger tires are recommended for large tractors – even as standard equipment.
ACKNOWLEDGMENT
The author thanks Mr. Gerald Rammel for his persistent investigation in tractor data, enabling further fundamental research in tractor engineering.
REFERENCES
[1] K. T. Renius, “Traktoren 2006,” Landtechnik 61, No.4, pp. 186-187, 2006
[2] K. T. Renius, „Global transmission concepts for tractors,” ATZ-offhighway 6 (2014), No. 2, pp.16-29
[3] G. Rammel, “Recherche, Zusammenfassung und statistische Auswertung von Traktorkennwerten,” Diploma thesis HBLFA Francisco Josephinum, 2014
[4] J. Paar, „Steyr trotz Verluste Nummer 1,“ Der fortschrittliche LandwirtNo.3/2014, pp.71-75
[5] H. Lampel, „Was sagen die Leistungsdaten eines Traktormotors aus?,“ Landwirtschaftliches Tagebuch 2007, HELGU-Verlag, Graz, pp. 58-65
[6] M. Landis, „Leistungsangaben in Prospekten,“ available online: http://www.landwirt.com/Leistungsangaben-in-Prospekten-Was-sagen-sie-aus,,7960,,Bericht.html; access at 24.04.2015
[7] H. Grohe, G. Russ, „Otto- und Dieselmotoren,“ Vogel Verlag, 14th
edition, Würzburg, 2007
[8] M. Rempfer, „Grundlagen der automatischen Reifenluftdruckverstellung bei Traktoren,“ PhD-thesis TU-München, Fortschritt-Berichte VDI Reihe 14, No. 111., Düsseldorf: VDI-Verlag 2003
AUTHOR PROFILE
Jürgen Karner received an MSc and a PhD degree in
Engineering Management from the University of
Technology in Vienna, Austria.
He is Chief Scientific Officer (CSO) at Josephinum Research, Wieselburg, Austria. His research interests include tractors, hybrid-systems and implement technology.
GSTF Journal on Agricultural Engineering (JAE) Vol.3 No.1, 2017
©The Author(s) 2017. This article is published with open access by the GSTF
27