analysis of poverty determinant in west java province
TRANSCRIPT

Working Paper in Economics and BusinessVolume IV No. 03/2014
Analysis of Poverty Determinant in West Java Province
Sartika Djamaluddin
September 2014
Institute of Economics and Social ResearchFaculty of Economics, Universitas Indonesia
Working Paper in Economics and BusinessChief Editor: Hera SusantiEditors: Djoni Hartono, Beta Y. Gitaharie, Femmy Roeslan, Riatu M. QibthiyyahSetting: Rus’an Nasrudin
Copyright c©2014, Department of EconomicsDepartment of Economics Building 2nd FloorDepokWest Java, Indonesia 16424Telp. +62-21-78886252Email: [email protected]: http://econ.fe.ui.ac.id/workingpage

Contents
Contents 3
List of Tables 4
List of Figures 5
1 Introduction 1
2 Research Framework 3
3 Illustration of Impoverished Households in West Java 4
4 Data & Research Methods 84.1 Data . . . . . . . . . . . . . . . . . . . . . . . . . . . . . . . . . . . . . . . . . . . 84.2 Model . . . . . . . . . . . . . . . . . . . . . . . . . . . . . . . . . . . . . . . . . . . 8
5 Outcome of Research 105.1 Demographic Variables . . . . . . . . . . . . . . . . . . . . . . . . . . . . . . . . . . 105.2 Economic Variables . . . . . . . . . . . . . . . . . . . . . . . . . . . . . . . . . . . . 105.3 Social Variables . . . . . . . . . . . . . . . . . . . . . . . . . . . . . . . . . . . . . 125.4 Regional/Area Variables . . . . . . . . . . . . . . . . . . . . . . . . . . . . . . . . . 12
6 Characteristics of Inter-Area Poverty 13
7 Conclusion 14
8 References 14

List of Tables
1 Gender of Head of Impoverished Households in West Java . . . . . . . . . . . . . . 52 Age of Head of Impoverished Households in West Java . . . . . . . . . . . . . . . . 53 Size of Impoverished Households . . . . . . . . . . . . . . . . . . . . . . . . . . . . 64 Number of Impoverished Households by Home Ownership . . . . . . . . . . . . . . 65 Types of Assets Owned by Impoverished Households . . . . . . . . . . . . . . . . . 76 Educational Participation of Impoverished Households . . . . . . . . . . . . . . . . 77 Symptoms/Medical Conditions Reported in the Past Month . . . . . . . . . . . . . 88 Employed Impoverished Households . . . . . . . . . . . . . . . . . . . . . . . . . . 89 Insurance Financing/Healthcare Insurance of Impoverished Households . . . . . . . 910 Result of Estimation of Logistic Regression Model at Province Level . . . . . . . . 1111 Result of Estimation of Logistic Regression Model at Regency Level . . . . . . . . 15

List of Figures
1 Poverty Level in Regencies and Cities in West Java . . . . . . . . . . . . . . . . . . 3
Analysis of Poverty Determinant in West Java Province
Sartika Djamaluddina,∗
aDepartment of Economics
Abstract
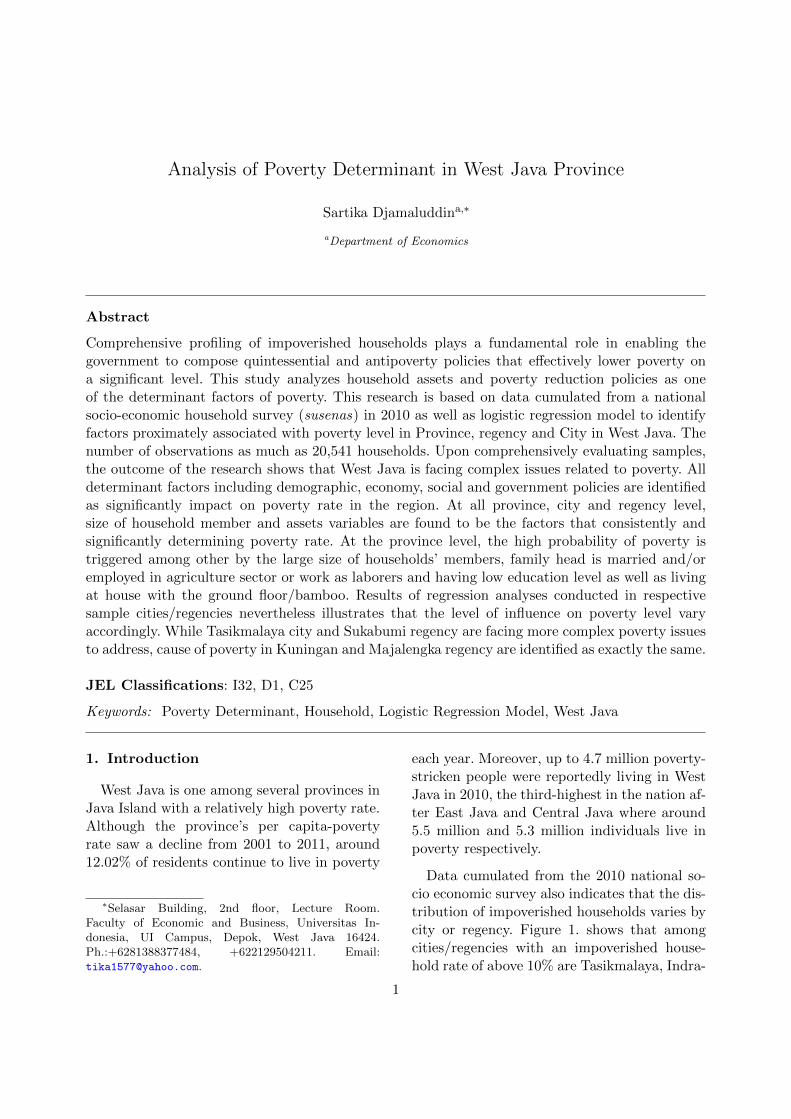
Comprehensive profiling of impoverished households plays a fundamental role in enabling thegovernment to compose quintessential and antipoverty policies that effectively lower poverty ona significant level. This study analyzes household assets and poverty reduction policies as oneof the determinant factors of poverty. This research is based on data cumulated from a nationalsocio-economic household survey (susenas) in 2010 as well as logistic regression model to identifyfactors proximately associated with poverty level in Province, regency and City in West Java. Thenumber of observations as much as 20,541 households. Upon comprehensively evaluating samples,the outcome of the research shows that West Java is facing complex issues related to poverty. Alldeterminant factors including demographic, economy, social and government policies are identifiedas significantly impact on poverty rate in the region. At all province, city and regency level,size of household member and assets variables are found to be the factors that consistently andsignificantly determining poverty rate. At the province level, the high probability of poverty istriggered among other by the large size of households’ members, family head is married and/oremployed in agriculture sector or work as laborers and having low education level as well as livingat house with the ground floor/bamboo. Results of regression analyses conducted in respectivesample cities/regencies nevertheless illustrates that the level of influence on poverty level varyaccordingly. While Tasikmalaya city and Sukabumi regency are facing more complex poverty issuesto address, cause of poverty in Kuningan and Majalengka regency are identified as exactly the same.
JEL Classifications: I32, D1, C25
Keywords: Poverty Determinant, Household, Logistic Regression Model, West Java
1. Introduction
West Java is one among several provinces inJava Island with a relatively high poverty rate.Although the province’s per capita-povertyrate saw a decline from 2001 to 2011, around12.02% of residents continue to live in poverty
∗Selasar Building, 2nd floor, Lecture Room.Faculty of Economic and Business, Universitas In-donesia, UI Campus, Depok, West Java 16424.Ph.:+6281388377484, +622129504211. Email:[email protected].
each year. Moreover, up to 4.7 million poverty-stricken people were reportedly living in WestJava in 2010, the third-highest in the nation af-ter East Java and Central Java where around5.5 million and 5.3 million individuals live inpoverty respectively.
Data cumulated from the 2010 national so-cio economic survey also indicates that the dis-tribution of impoverished households varies bycity or regency. Figure 1. shows that amongcities/regencies with an impoverished house-hold rate of above 10% are Tasikmalaya, Indra-
1

Djamaluddin, S./Analysis of Poverty Determinant... 2
mayu, Kuningan, Cianjur, Cirebon and Ban-dung city. Tasikmalaya has the highest povertyrate. Simultaneously, among cities/regencies inWest Java with the lowest impoverished house-hold rates are Depok, Bandung city, Bekasi cityand Bekasi regency at 1.8%, 3.1%, 4.1% and4.4% respectively.
The characteristics of households and indi-viduals residing in any one household are alsodeterminants of poverty level, as backed by thefact that low education and healthcare house-holds are presented with limited job oppor-tunities. Because such jobs are typically low-paying, individuals in the household will en-counter challenges in achieving an adequatestandard of living. Meanwhile, a large house-hold population will also exacerbate burdensborne by the head of household. In such house-holds, higher income is required to uphold orsustain an adequate standard of living. More-over, a household with no or limited-valued as-sets do not have sustenance to depend on assupplementary income to attain an adequatestandard of living. An individual’s incapabilityto meet the adequate standard of living distin-guishes that particular individual or householdas impoverished. Poverty is also gender-based –research conducted by the International LaborOrganization (ILO) 2004, denotes that womenare more likely to fall into poverty as com-pared to their male counterparts. Among rea-sons for this is that women are often employedas farmers in low-output agricultural fields, re-ceive lower wages compared to men, do nothave guaranteed rights over land that theyown, are lowly educated, have limited accessto healthcare and bear the burden of overseeingthe daily affairs of their respective households.
Conditions surrounding an area are also de-terminants of poverty. Isolated areas are gen-erally more prone to poverty as households insuch areas do not possess the required infras-tructures to effectively propel economic activ-ity, consequently limiting job opportunities and
lowering wages. Meanwhile, government poli-cies also play a significant role in counteringpoverty – apart from assistance programs, so-cial protection programs for families and com-munity empowerment programs, the govern-ment also extends assistance to empower mi-cro, small and medium enterprises (UMKM)which often encounters difficulty in accessing fi-nancial services due to failure in meeting bank-ing terms and conditions. The government is animportant source in providing financial assis-tance and opening financial services to fortifythe economy and expedite creation of new jobsin various fields as ultimate means of counter-ing poverty.
Facilities such as electrical infrastructures,roads, bridges, water pipes, land distribution,access to public facilities (e.g. distance toschools and hospitals), social structure and so-cial capital are also determinants of povertylevel. Limited access to electrical networks willconsequently interfere with activities and im-pact education, healthcare and social aspectsin an impoverished household. Poor road condi-tions will also impact distribution of goods andeconomic activities, both of which will in turnaffect productivity in an impoverished house-hold.
An array of studies has also been con-ducted to expose determinants of poverty.Geda Mwabu and Kimenyi (2001) investigateddeterminants of poverty in Kenya and foundpoverty to be substantially inclined to educa-tion, household population and agricultural ac-tivity. The study was carried out by assess-ing household data in 1994, binomial regres-sion model and logit polychotomous. Similarly,Mok, Gan and Sanyal (2007) investigated de-terminants of poverty in Malaysia and iden-tified human capital as a significant factor inreducing the probability of poverty. Simultane-ously, the study also found migrant laborers tobe likelier to fall into poverty and that house-hold size, race and religion are also importantdeterminants of poverty in the country. The

Djamaluddin, S./Analysis of Poverty Determinant... 3
Figure 1: Poverty Level in Regencies and Cities in West Java
study involves 2,403 households in the city andwas carried out from 2004 to 2005.
Haughton & Khandker (2009) attributespoverty to four primary aspects – character-istics of an area, society, household and indi-vidual. Area-level characteristics such as isola-tion, natural resources, weather, natural disas-ters, local governance and income are determi-nants of poverty. Society-level characteristicsthat determine poverty are broken down intoinfrastructure (roads, water and electricity),services (healthcare and education), relations(capital) and social aspects. Meanwhile, resi-dential and individual-level characteristics suchas household size, household dependence ratio,gender of the households head, assets, type andstatus of employment are also determinantsof poverty. Moreover, the household size andcharacteristics of family members also differbetween impoverished and non-impoverishedhouseholds. Gibson (1999) in Haughton &Khandker (2009) explained that the 1934–1994 Cambodian Socio-Economic Survey indi-cates that impoverished households are gener-ally made up of large families with an aver-age of 6–7 family members in a household. Onthe opposite end of the spectrum, the richesthouseholds consist of around 4–5 members in ahousehold.
Afandi (2011) from Pariaman, Padang foundhouseholds with more than 4 members, withless than 8 meters2 of land per capita, witha head of household below 35 years of age,which have taken up a business loan and/orwith a head of household employed in sec-tors other than the agricultural and industrialsector more likely to fall into poverty. Hay-ati (2012) exposed geographical location andan addition of household member as high-riskpoverty factors in cities and regencies in Ban-ten. Sari (2014) found assets, employment and
the number of dependents in a household asthe primary poverty determinant in Bonang,Demak.
The researches above are based on data,specifically information on the characteristicsof households, individuals, area and govern-ment policies, cumulated from the 2010 na-tional socio economic survey involving residen-tial households in West Java province. Unlikeprevious studies, the study takes into accountgovernment programs such business loan pro-gram as one among several factors which aresignificantly correlated to poverty level. Logis-tic regression model to analyze factors that arestrongly correlated to and are strong factors ofpoverty is also utilized.
2. Research Framework
Analyses conducted to identify poverty de-terminants neither serve to analyze nor arbi-trate the cause(s) of poverty. Variables dis-tinguishged based on economic theory are ac-knowledged as factors that affect poverty level.Such factors, or factors identified as povertydeterminants, are determined based on eco-nomic theory. Empirical modelling consecu-tively serves to test out theory. In this re-search, household, individual and area-levelcharacteristics are evaluated as determinantsof poverty level, the two latter of which coversdemocraphic, economic as well as social factors.Area-level characteristics comprise of local fac-tors and public business loaning policies.
Data is divided into two categories which aredata cumulated as a whole from West Java anddata of respective cities and regencies in theprovince. Regression analysis as well as datafrom West Java serves the purpose of identi-fying the prevalent cause(s) of poverty in theprovince. An analysis using both sets of datawill also be conducted to exclusively identify
Djamaluddin, S./Analysis of Poverty Determinant... 4
the cause(s) of poverty in a specific city or re-gency in West Java. A second analysis will alsobe carried out as the poverty level in respec-tive cities and regencies in West Java will likelyvary. While the first analysis will more likelyaccomodate the interests of the central govern-nment, the second analysis will more likely ben-efit the local government.
Poverty criteria refers to the poverty line es-tablished by the local Central Statistics Bu-reau (BPS) in any one city or regency. House-holds with a per capita monthly income be-low the poverty line are classified as impov-erished. The poverty line itself is determinedbased on minimum household expense whichesrimates the approximate earnings of a house-hold. The hypothesis of this research is that theprobabibillity of poverty are relatively high inhouseholds retaining the following characteris-tics; households with a female head, with morethan 3 married family members, with mem-bers working in the agricultural sector, withno assets and/or with members working as anemployee and not a laborer. Households withsocial-level characteristics such as low educa-tion, illness spanning to over 6 months andhouseholds with earthen or bamboo floors arealso at high-risk of falling into poverty. Syn-chronously, regional/area-level characteristicssuch as living in a city and receiving businessloans are also low-risk poverty factors.
3. Illustration of Impoverished House-holds in West Java
The 2010 national socio-economic surveystates that up to 945,172 or 9% of house-holds in 17 provinces and 9 cities in West Javalive under the poverty line. With poverty lev-els of up to 12%, Tasikmalaya, Indramayu,Majalengka and Kuningan possess the high-est impoverished household percentage in WestJava. Meanwhile, among cities/regencies withthe lowest impoverished household rates areDepok, Bandung city, Bekasi city and Bekasiregency at below 5% respectively. The average
poverty level in other areas span between 5%to below 11%.
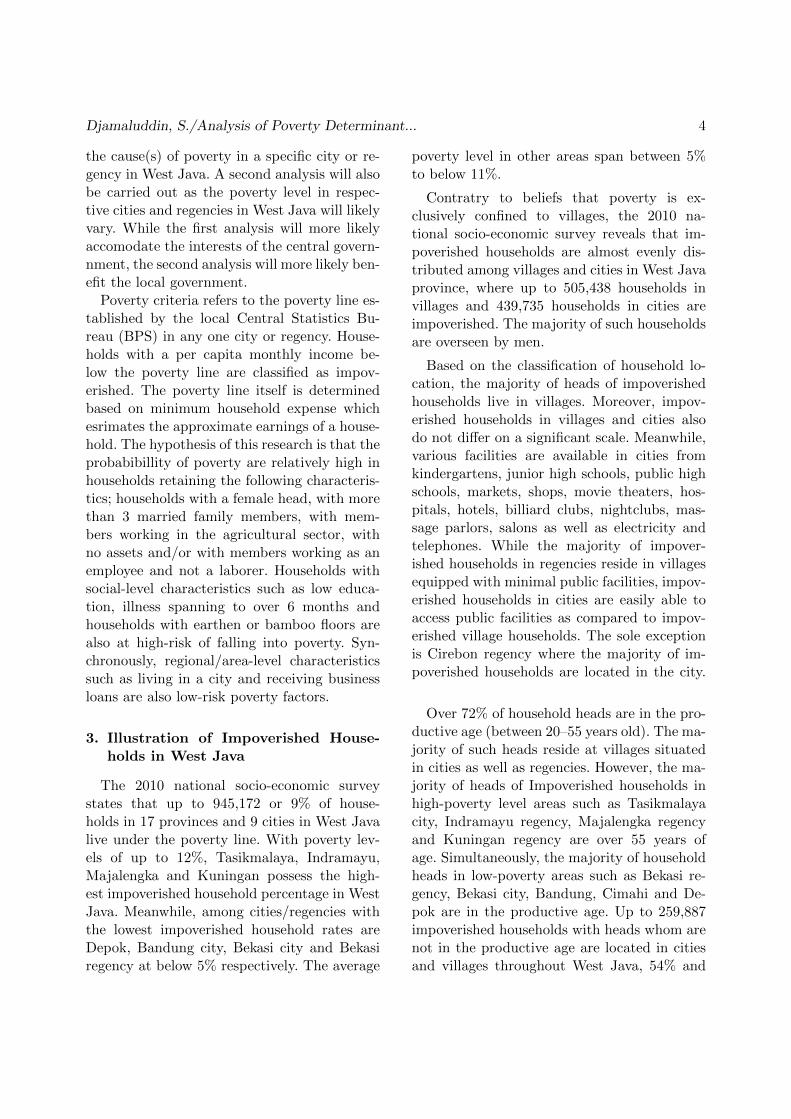
Contratry to beliefs that poverty is ex-clusively confined to villages, the 2010 na-tional socio-economic survey reveals that im-poverished households are almost evenly dis-tributed among villages and cities in West Javaprovince, where up to 505,438 households invillages and 439,735 households in cities areimpoverished. The majority of such householdsare overseen by men.
Based on the classification of household lo-cation, the majority of heads of impoverishedhouseholds live in villages. Moreover, impov-erished households in villages and cities alsodo not differ on a significant scale. Meanwhile,various facilities are available in cities fromkindergartens, junior high schools, public highschools, markets, shops, movie theaters, hos-pitals, hotels, billiard clubs, nightclubs, mas-sage parlors, salons as well as electricity andtelephones. While the majority of impover-ished households in regencies reside in villagesequipped with minimal public facilities, impov-erished households in cities are easily able toaccess public facilities as compared to impov-erished village households. The sole exceptionis Cirebon regency where the majority of im-poverished households are located in the city.
Over 72% of household heads are in the pro-ductive age (between 20–55 years old). The ma-jority of such heads reside at villages situatedin cities as well as regencies. However, the ma-jority of heads of Impoverished households inhigh-poverty level areas such as Tasikmalayacity, Indramayu regency, Majalengka regencyand Kuningan regency are over 55 years ofage. Simultaneously, the majority of householdheads in low-poverty areas such as Bekasi re-gency, Bekasi city, Bandung, Cimahi and De-pok are in the productive age. Up to 259,887impoverished households with heads whom arenot in the productive age are located in citiesand villages throughout West Java, 54% and
Djamaluddin, S./Analysis of Poverty Determinant... 5
Table 1: Gender of Head of Impoverished Households in West Java
Gender Village City Total
Female 50,37 41,485 91,855Male 455,068 398,25 853,318Total 505,438 439,735 945,173
Source: 2010 national socio-economic survey
Table 2: Age of Head of Impoverished Households in West Java
Age Village City Total
< 20 715 71520–< 35 79,699 79,271 158,9735–< 45 153,365 132,351 285,71545–< 55 131,358 108,654 240,013> 55 141,015 118,743 259,759
Total 505,438 439,734 945,172
46% of which are located in cillages and citiesrespectively.
Impoverished households disbursed through-out cities and villages tend to consist of manymembers. Around 60% of impoverished house-holds comprise of 3–5 members. Simultane-ously, an approximate 29% and 4.2% of im-poverished households comprise of 6–8 and 9or more members respectively. Household sizereflects the extent of economic burden borneby the head of households. The majority of im-poverished households in clusters 1, 2 and 3comprise of 3–5 members, with the exceptionof Bekasi and Depok where the majority of im-poverished households comprise of 6–8 mem-bers.
Data from the 2010 national socio-economicsurvey also reveals that 82.6% of impover-ished households own their own homes and thatthe majority of homeowners reside in villages.Meanwhile, 72.6% of the remaining 163,809 im-poverished households that do not own theirown homes reside in cities, a fact which can beclearly observed in many cities and regenciesin West Java. In Bandung, a large percentageof impoverished households are not homeown-ers. Meanwhile in Bekasi, there are roughly thesame number of impoverished households thatown their own homes and do not own their ownhomes respectively.
At 62.4%, a large percentage of impoverishedhouseholds do not own assets. Merely 355,142households own assets that are mainly com-prised of refrigerators, gas cylinders amount-ing to 12 kilograms or more and/or boats.Impoverished households frequently rely onassistance from others to purchase food aswell as non-food items. While 15% of impov-erished households borrow money from rela-tives, 22.67%, 12.7% and 4.4% borrow fromneighbors, use up their savings and borrowfrom creditors respectively. The remaining per-centage acquires loans from banks, coopera-tive banks or pawn loans. 382 households alsorely on other sources to make ends meet. Im-poverished households which depend on othersources (outside jobs) are mainly located in Bo-gor, Sukabuni, Cianjur, Bandung and Tasik-malaya.
The educational participation rates of im-poverished households is relatively low. Datafrom the 2010 national socio-economic surveyindicates that 9% of household heads have noschooling experience whatsoever. The remain-ing 91% of household heads are no longer inschool. 9.8% of impoverished households areunable to read or write the latin alphabet.Moreover, impoverished households seldom in-teract with technology. The majority of impov-erished household members are also unable to

Djamaluddin, S./Analysis of Poverty Determinant... 6
Table 3: Size of Impoverished Households
Household Members Village City Total
≤ 2 46,23 20,532 66,7623–5 324,819 238,152 562,9716–8 124,022 151,539 275,5619–12 9,921 25,764 35,685>12 445 3,748 4,193
Total 505,438 439,734 945,172
Table 4: Number of Impoverished Households by Home Ownership
Home Ownership Status Village City Total
Privately Owned 460,538 320,825 781,363Others 44,900.2 118,909 163,809
Total 505,438 439,734 945,172
access the intenet. Merely 0.48% of impover-ished household members have accessed the in-ternet in the past three months.
93% of heads of impoverished householdswho have schooling experience are also lowlyeducated. The highest education level that waspursued or is currently being pursued by isbasic elementary or junior high school educa-tion or equivalent. A substantial percentage ofsuch individuals deliberately chose to end theirschooling. Around 26% of impoverished house-holds also do not hold elementary school certi-fication.
Lowly educated households are disbursedevenly throughout cities and regencies. In De-pok, the percentage of lowly and highly edu-cated households are essentially equivalent. Arelatively large number of impoverished house-holds in Depok therefore holds more than a ba-sic educational certificate.
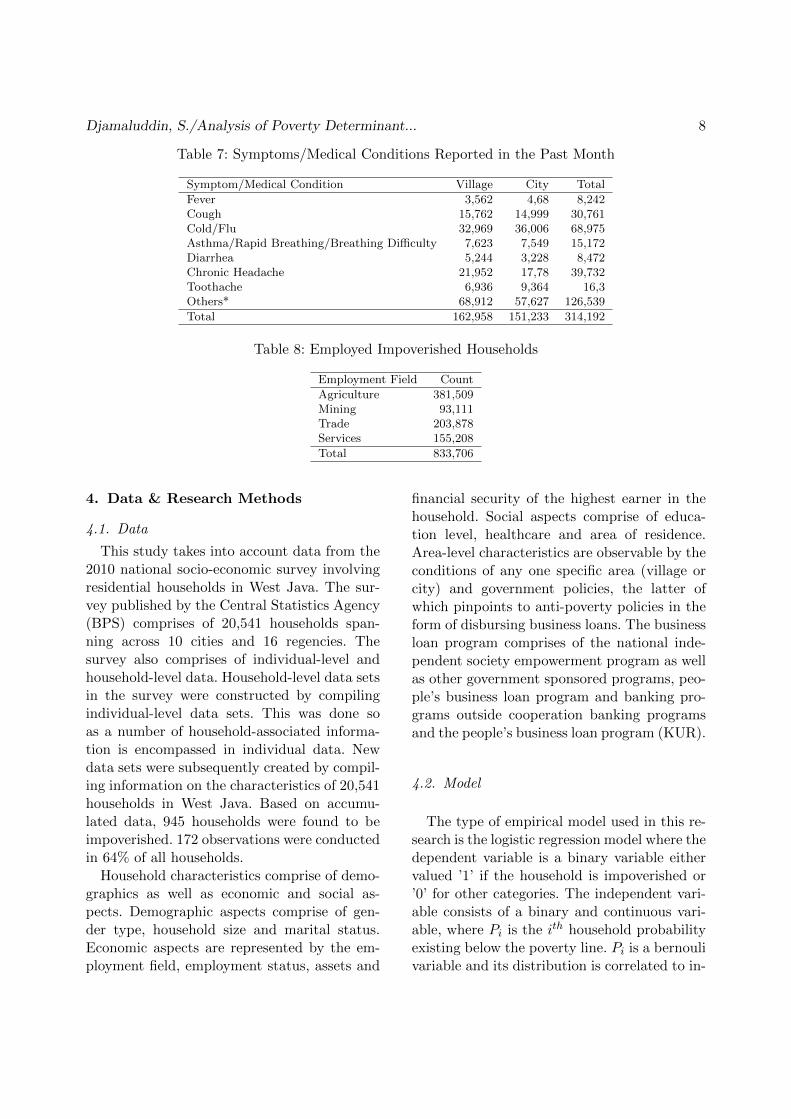
As many as 314,192 or 33.2% of heads ofimpoverished households were sick in the pastmonth. The majority of symptoms and med-ical conditions reported, including accidents,measles, ear discharge and jaundice, are consid-ered severe. Among other frequently reportedailments are cough, cold or flu (influenza) andchronic headaches. Despite this, merely 43.7%of impoverished households seek medical atten-tion to recover.
Medical conditions and sickness are found toimpact the daily activities in a household. Thework and school of 55.3% of household headswere affected by medical conditions and sick-ness. Despite this, not all households chooseto go to the doctor and merely 88.5% ofhouseholds sought medical attention to recover.Meanwhile, 44.67% of households claiming thatillness do not impact their activities choose todisregard medical treatment. This is likely dueto economic demands obliging households tocontinue working.
833,706 impoverished households are cur-rently employed in four fields which are agricul-ture, mining, trade and services. Agriculture-related jobs comprise of rice and vegetablefarming as well as jobs in the horticulture,plantation, fishing, cattle farming, forestry andother plantation-associated sectors.
Meanwhile, mining-related jobs revolvearound mining and excavation, the processingindustry as well as the electricity and gas sec-tor. In the trade sector, jobs are correlated toconstruction/development, trade and the hos-pitality and food industry. Services-orientedjobs include transportation and warehousing,information and construction, insurance andfinancing as well as healthcare and educationalservices. The trade and agricultural sectorare the primary recruiters of members of

Djamaluddin, S./Analysis of Poverty Determinant... 7
Table 5: Types of Assets Owned by Impoverished Households
Type of Asset Count
Bicycle 154,046Motorcycle 122,049Boat 2,242.37Motor Boat 462Refrigerator 58,122.4Gas Cylinder (≥ 12kg) 18.220,20Others 590,03
Total 945,172
Table 6: Educational Participation of Impoverished Households
Educational Participation Village City Total
No/Have Yet to Gain Schooling Experience 54,117 32.749 86,865Active in School - - -No Longer in School 451,321 406,986 858,307
Total 505,438 439,734 945,172
impoverished households.
Up to 11.8% of impoverished households arealso unemployed. The daily activities of mem-bers of such households include managing dailyaffairs in the household, exercising, attendingcourses and picnics and social activities suchas participating in organizations and doing so-cial work. The percentage of unemployed andimpoverished households is also higher in high-poverty level cities such as Majalengka regencyas well as Sukabumi and Cimahi. Meanwhile,the majority of impoverished households in re-gencies work for the agricultural sector. Onthe other end of the spectrum, impoverishedhouseholds in cities tend to work for the ser-vices, construction and trade sector as con-cluded based on observations made at Bogor,Sukabumi, Cirebon and Bekasi. The employ-ment status of employed impoverished house-holds is broken down into freelancers (34.5%),self-employed (22.5%), workers/employee/staff(20.5%) and employers with unpaid workers(20%).
With regard to paying off medical bills, onlya small percentage of impoverished householdshave access to insurance. Over 50% of impov-erished households have yet to receive insur-ance coverage. Furthermore, 35.7% of impov-
erished households are registered members ofthe healthcare insurance for the poor (JPKMM), healthcare card (kartu sehat), health-care insurance for poor families (JPK Gakin),poverty card (kartu miskin) and social healthinsurance program. 1.8%, 0.65% and 0.58%of impoverished households receive health-care insurance from jamsostek (social secu-rity program), other healthcare insurance pro-grams and healthcare insurance for civil ser-vants/veterans/pensioners respectively.
Compared to the allocation of business loansto non-poor households, loan provided to theimpoverished household is still very small. Ofa total 996,877 households receiving impover-ished business credit, 96.3% of them are classi-fied as non-poor households and the remaining3.67% is considered as improverished house-holds. Sumedang, Tasikmalaya, Sukabumi andGarut are identified as regencies that distributemore loans for impoverished households. At thecity level, most business loans recipients areidentified living in Tasikmalaya, Bandung andBanjar.
Djamaluddin, S./Analysis of Poverty Determinant... 8
Table 7: Symptoms/Medical Conditions Reported in the Past Month
Symptom/Medical Condition Village City Total
Fever 3,562 4,68 8,242Cough 15,762 14,999 30,761Cold/Flu 32,969 36,006 68,975Asthma/Rapid Breathing/Breathing Difficulty 7,623 7,549 15,172Diarrhea 5,244 3,228 8,472Chronic Headache 21,952 17,78 39,732Toothache 6,936 9,364 16,3Others* 68,912 57,627 126,539
Total 162,958 151,233 314,192
Table 8: Employed Impoverished Households
Employment Field Count
Agriculture 381,509Mining 93,111Trade 203,878Services 155,208
Total 833,706
4. Data & Research Methods
4.1. Data
This study takes into account data from the2010 national socio-economic survey involvingresidential households in West Java. The sur-vey published by the Central Statistics Agency(BPS) comprises of 20,541 households span-ning across 10 cities and 16 regencies. Thesurvey also comprises of individual-level andhousehold-level data. Household-level data setsin the survey were constructed by compilingindividual-level data sets. This was done soas a number of household-associated informa-tion is encompassed in individual data. Newdata sets were subsequently created by compil-ing information on the characteristics of 20,541households in West Java. Based on accumu-lated data, 945 households were found to beimpoverished. 172 observations were conductedin 64% of all households.
Household characteristics comprise of demo-graphics as well as economic and social as-pects. Demographic aspects comprise of gen-der type, household size and marital status.Economic aspects are represented by the em-ployment field, employment status, assets and
financial security of the highest earner in thehousehold. Social aspects comprise of educa-tion level, healthcare and area of residence.Area-level characteristics are observable by theconditions of any one specific area (village orcity) and government policies, the latter ofwhich pinpoints to anti-poverty policies in theform of disbursing business loans. The businessloan program comprises of the national inde-pendent society empowerment program as wellas other government sponsored programs, peo-ple’s business loan program and banking pro-grams outside cooperation banking programsand the people’s business loan program (KUR).
4.2. Model
The type of empirical model used in this re-search is the logistic regression model where thedependent variable is a binary variable eithervalued ’1’ if the household is impoverished or’0’ for other categories. The independent vari-able consists of a binary and continuous vari-able, where Pi is the ith household probabilityexisting below the poverty line. Pi is a bernoulivariable and its distribution is correlated to in-

Djamaluddin, S./Analysis of Poverty Determinant... 9
Table 9: Insurance Financing/Healthcare Insurance of Impoverished Households
Insurance Financing/Healthcare Insurance Count
a. Healthcare Insurance for Civil Servants/Veterans/Pensioners 5,521.56b. Social Security Program - Healthcare Insurance (Jamsostek) 17,031.9c. Private Health Insurance 2,970.05d. Company Reimbursement 3,844.9e. Healthcare Insurance for the Poor (JPK MM) / Healthcare Card (Kartu Sehat) / 337,316
Healthcare Insurance for Poor Families (JPK Gakin) / Poverty Card (Kartu Miskin /Social Healthcare Insurance (Jamkesmas)
f. Healthcare Funding 3,722.47g. Other Healthcare Insurance Programs 6,175.37h. Others 568,59
Total 945,172
dependent vector X. Therefore:
Pi(X) =eα+βX
1 + eα+βX(1)
Similarity (1) is a cumulative logistic distri-bution function. The function above (1) is non-linear but can be lineated by re-writing thefunction:
Pi(1 − Pi)
= eα+βX (2)
The odd ratio, or Pi1−Pi
, is obtained from impov-erished households and explains the probabilityratio of impoverished versus non-impoverishedhouseholds. The similarity (2) can be re-written in its natural logarithm form as:
lnPi
1 − Pi= α+ ΣkβkXki (3)
This form (3) is also referred to as the logitmodel. ln Pi
(1−Pi)is a natural logarithm acquired
from the odd ratio of impoverished householdsbelow the poverty line. The similarity (3)is estimated using the maximum likelihoodmethod.
Demographic variablesMale = ’1’ if the household head isa man, ’0’ for othersHousehold size = Number of members in ahouseholdMarital status = ’1’ if the household head ismarried, ’0’ for others
Economic variablesAgriculture = ’1’ if the household works forthe horticulture, plantation, fishing, cattlefarming, forestry or plantation sector, ’0’ forothersLaborer/worker = ’1’ if the household mem-ber(s) is a laborer/worker, ’0’ for othersAsset = ’1’ if the household owns a bicycle,motorcycle, boat, motorboat, refrigerator or agas cylinder with a capacity of 12 kilograms orabove, ’0’ for others
Social variablesBasic education = ’1’ if the household eitherholds elementary school certification or do nothold an educational certificate, ’0’ for othersHealthcare = ’1’ if the household has soughtmedical attention in the past six months, ’0’for othersHome flooring = ’1’ if the household has eitherearthen or bamboo flooring, ’0’ for others
Regional/Area variablesArea of residence = ’1’ for city, ’0’ for othersLoan programs = ’1’ if the household acceptsbusiness loans from the people’s business(KUR) program and/or the national indepen-dent society empowerment program and/orother banking programs exclusive of theKUR program and other programs held bycooperation banks, ’0’ for others

Djamaluddin, S./Analysis of Poverty Determinant... 10
5. Outcome of Research
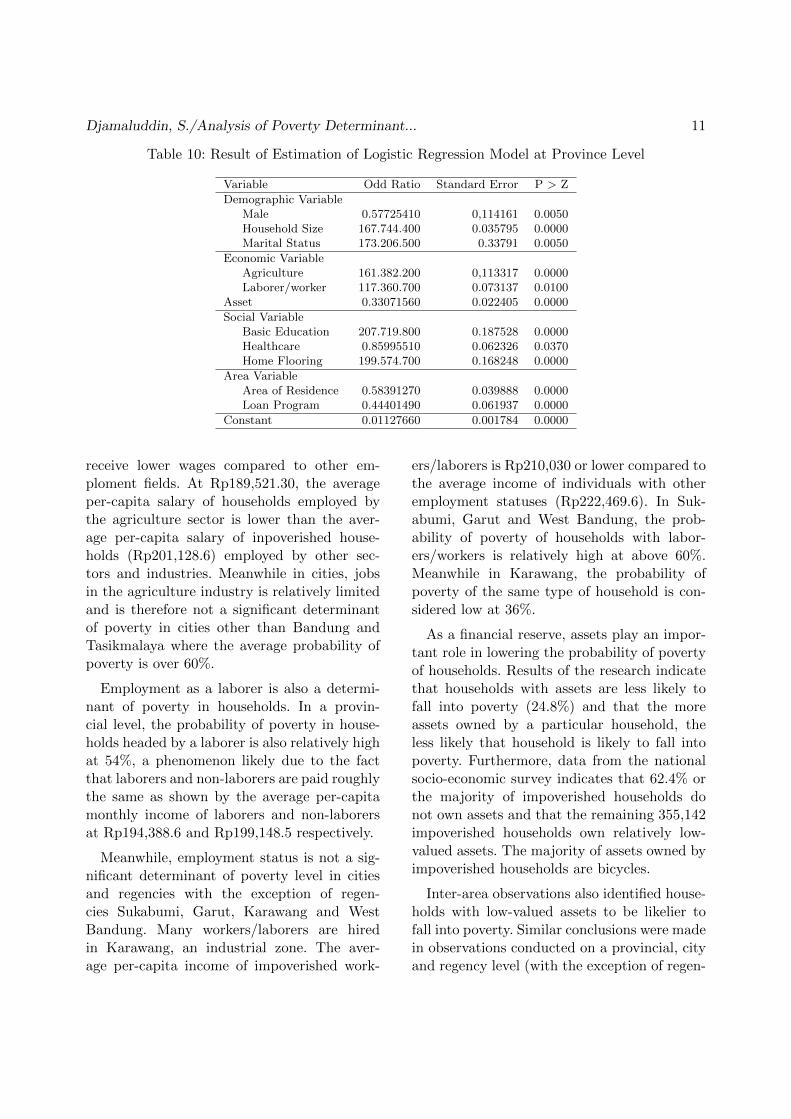
The research’s outcome is that the povertylevel in West Java is significantly influencedby demographic, economic and social factorsas well as area-level classification and govern-ment policies. The government’s ’rice for thepoor’ program is also presented as the most ef-fective approach in lowering poverty as the pro-gram’s benefits are directly enjoyed by impov-erished households. Other factors which signifi-cantly influence poverty level is household size,marital status, employment in the agriculturalsector, low education and household-level char-acteristics.
5.1. Demographic Variables
Provincial-level data identified men as theprimary breadwinners in impoverished house-holds. Data from the national socio-economicsurvey indicates that 90% of impoverishedhouseholds are headed by men with a mediansalary of Rp196,874. Meanwhile, results of theregression analysis indicate that a householdheaded by a man is only 36.5% at risk offalling into poverty. The research also identifiedwomen as relatively significant contributors to-ward household finances. Working female headsof households earn an average of Rp190,133 percapita.
Meanwhile, facts prove otherwise in the ma-jority (76.5%) of regencies and cities. In a re-gency and city level, having male householdheads do not impact household poverty (withthe exception of regencies Sukabumi, Ciamis,Purwakarta and Indramayu). Facts cumulatedalso shows that both men and women impactthe household in a relatively equal sense. Mean-while, male household heads in cities signifi-cantly impact the poverty level of households indifferent ways. In Bandung, households headedby males are highly vulnerable and are 89.8%likely to fall into poverty. In Cirebon, Cimahi,Tasikmalaya and Banjar, the probability ofpoverty of households headed by males is rela-tively low, or below 30%.
In conclusion, the probability of poverty in-creases as household size expands. This is be-cause households are required to meet higherbasic living requirements with every additionto the household. Furthermore, the probabilityof poverty in an average household (compris-ing of 5 members) is relatively high at 62.2%.Observations conducted in two regencies alsocame up with the same findings on the rela-tionship between household size and probabil-ity of poverty. In cities and regencies, house-hold size significantly impacts poverty with aprobability of poverty of over 60%. Meanwhile,marital status is not a significant determinantof poverty in all regencies with the exceptionof several regency and cities (Regency of Suk-abumi and Ciamis and City of Cimahi, Bogor,Tasikmalaya and Cirebon).
The conclusion above is in line with a dis-covery exposing the relatively high probabilityof poverty in married households (63.4%) asmarriage is associated with the addition of afamily member(s). Facts cumulated from citiesand regencies nevertheless indicate that mar-ital status does not influence probability ofpoverty. On a regency level, marriage is a sig-nificant influence of poverty in Sukabumi andCiamis where probability of poverty of marriedhouseholds is well over 80%. Simultaneously incities, marriage significantly influences povertyonly in Cirebon, Cimahi dan Tasikmalya whereprobability of poverty in married households isabove 70%.
5.2. Economic Variables
In line with the hypothesis, economic fac-tors significantly influence the probability ofpoverty of households. Merely 1,572 or 7.65%out of a total 20,451 impoverished householdsreceive a salary of Rp196,433 per capita. Em-ployment by the agriculture industry is alsoexposed as the most influential determinantof poverty level with a 61.7% probability ofpoverty percentage. This is so because house-holds employed by the agriculture industry
Djamaluddin, S./Analysis of Poverty Determinant... 11
Table 10: Result of Estimation of Logistic Regression Model at Province Level
Variable Odd Ratio Standard Error P > Z
Demographic VariableMale 0.57725410 0,114161 0.0050Household Size 167.744.400 0.035795 0.0000Marital Status 173.206.500 0.33791 0.0050
Economic VariableAgriculture 161.382.200 0,113317 0.0000Laborer/worker 117.360.700 0.073137 0.0100
Asset 0.33071560 0.022405 0.0000
Social VariableBasic Education 207.719.800 0.187528 0.0000Healthcare 0.85995510 0.062326 0.0370Home Flooring 199.574.700 0.168248 0.0000
Area VariableArea of Residence 0.58391270 0.039888 0.0000Loan Program 0.44401490 0.061937 0.0000
Constant 0.01127660 0.001784 0.0000
receive lower wages compared to other em-ploment fields. At Rp189,521.30, the averageper-capita salary of households employed bythe agriculture sector is lower than the aver-age per-capita salary of inpoverished house-holds (Rp201,128.6) employed by other sec-tors and industries. Meanwhile in cities, jobsin the agriculture industry is relatively limitedand is therefore not a significant determinantof poverty in cities other than Bandung andTasikmalaya where the average probability ofpoverty is over 60%.
Employment as a laborer is also a determi-nant of poverty in households. In a provin-cial level, the probability of poverty in house-holds headed by a laborer is also relatively highat 54%, a phenomenon likely due to the factthat laborers and non-laborers are paid roughlythe same as shown by the average per-capitamonthly income of laborers and non-laborersat Rp194,388.6 and Rp199,148.5 respectively.
Meanwhile, employment status is not a sig-nificant determinant of poverty level in citiesand regencies with the exception of regen-cies Sukabumi, Garut, Karawang and WestBandung. Many workers/laborers are hiredin Karawang, an industrial zone. The aver-age per-capita income of impoverished work-
ers/laborers is Rp210,030 or lower compared tothe average income of individuals with otheremployment statuses (Rp222,469.6). In Suk-abumi, Garut and West Bandung, the prob-ability of poverty of households with labor-ers/workers is relatively high at above 60%.Meanwhile in Karawang, the probability ofpoverty of the same type of household is con-sidered low at 36%.
As a financial reserve, assets play an impor-tant role in lowering the probability of povertyof households. Results of the research indicatethat households with assets are less likely tofall into poverty (24.8%) and that the moreassets owned by a particular household, theless likely that household is likely to fall intopoverty. Furthermore, data from the nationalsocio-economic survey indicates that 62.4% orthe majority of impoverished households donot own assets and that the remaining 355,142impoverished households own relatively low-valued assets. The majority of assets owned byimpoverished households are bicycles.
Inter-area observations also identified house-holds with low-valued assets to be likelier tofall into poverty. Similar conclusions were madein observations conducted on a provincial, cityand regency level (with the exception of regen-

Djamaluddin, S./Analysis of Poverty Determinant... 12
cies Cirebon and Indramayu). Simultaneously,the average probability of poverty for house-holds with assets is low (20%). Results are inline with the proposed hypothesis.
5.3. Social Variables
Education level also impacts the probabil-ity of poverty of households on a substantialscale. Outcome of the research indicates thatlowly educated households are 67.5% likely tofall into poverty, seeing that education playsan important role in raising employee value.A lowly educated household is not only lim-ited to certain jobs but will also be likely toearn a relatively low salary. Data from the 2010national socio-economic survey shows that atRp194,634, the average per-capita monthly in-come of lowly educated impoverished house-holds is lower than the per-capita income ofhouseholds holding an educational certifica-tion above the primary/elementary level atRp208,747 per month.
Furthermore, the impact of education levelon poverty varies among different cities and re-gencies. Data cumulated from the majority ofareas on a regency level indicates that low edu-cation does not influence the poverty level andthat merely 30% of areas reported of a highprobability poverty percentage (above 65%) inlowly educated households. Once again, resultsare in line with the proposed hypothesis. Mean-while, education level plays a significant rolein over 60% of cities. Lowly educated house-holds are found to be over 70% likely to fallinto poverty.
A healthy household head capable of work-ing optimally is also likelier to receive a higherincome. Meanwhile, the probability of povertyof households which sought medical attentionat least once in the past six months is 46%.The average per-capita monthly income of ahealthy impoverished household is Rp199,693or more or less the same as the average per-capita monthly income of households that seekmedical attention at least once each month or
year (Rp195,632), an interesting fact indicat-ing that impoverished households with differ-ent health conditions receive roughly the sameincome. This particular fact also reflects thatthe productivity of impoverished householdsremain relatively stagnant.
The impact of healthcare on poverty alsovaries on a provincial-level and city andregency-level. Bandung, Depok and Tasik-malaya are the only three cities where health-care is a significant determinant of poverty. InBandung, households that sought medical at-tention at least once in the past six months isonly 20% likely to fall in poverty, unlike Depokand Tasikmalaya where probability of povertyin households with the same circumstances aresignificantly high at over 60%. Results are inline with the proposed hypothesis. Meanwhileon a regency level, the probability of povertyof households that sought medical attention atleast once in the past six months in Sukabumi,Tasikmalaya and Karawang is relatively low.Simultaneously, the probability of poverty ofhouseholds that sought medical attention atleast once in the past six months in West Ban-dung regency is relatively high at 66.6%.
Data from the 2010 national socio-economicsurvey also indicates that 173,193 householdshave earthen or bamboo flooring and that thenumber of such households varies significantlyamong different cities and regencies. A no-ticeable relationship between area of residenceand poverty level was also observed at regen-cies Bandung, Garut, Indramayu, Subang, Pur-wakarta, Karawang, Bekasi and West Bandungwhere the average probability of poverty is rel-atively high at 75% (with exception of WestBandung at below 1%). The probability ofpoverty for the same variable in cities Suk-abumi and Tasikmalaya is also high at almost70%.
5.4. Regional/Area Variables
Cities generally offer many alternative jobsand job opportunities. It is hence an unsur-prising fact that the probability of poverty of
Djamaluddin, S./Analysis of Poverty Determinant... 13
households in cities is relatively low at 36.8%.Impoverished households working and livingin cities earn an average monthly per-capitasalary of Rp205,260, or higher than the aver-age monthly per-capita salary of impoverishedhouseholds in villages at Rp189,473.
The relationship between area classifica-tion and poverty is significant in all butfive regencies which are Sumedang, Subang,Karawang, Bekasi and West Bandung. Com-pared to households living in regencies areas,those living in city hve lower poverty proba-bilty rate of around 46%. Meanwhile, admin-istrative cities (kota administrasi) generally donot contain an area classified as a village. Con-sequently, the effect of classification of areas isnot reflected in this study.
Government policies play a relatively sig-nificant role in countering poverty. However,the level of influence proves to be differentfrom the proposed hypothesis. The probabilityof poverty of households that receive businessloans is relatively low at 30.7%, a fact which isin line with the proposed hypothesis. Researchalso indicates that 5.5% of impoverished house-holds and 10.6% of non-impoverished house-holds are recipients of business loans. In cities,however, business loans do not significantly in-fluence poverty and that business loans onlysignificantly impact poverty in regencies Bo-gor, Bandung, Indramayu, Subang and Pur-wakarta. The probability of poverty in house-holds that receive business loans is also rela-tively low at below 26%.
6. Characteristics of Inter-Area Poverty
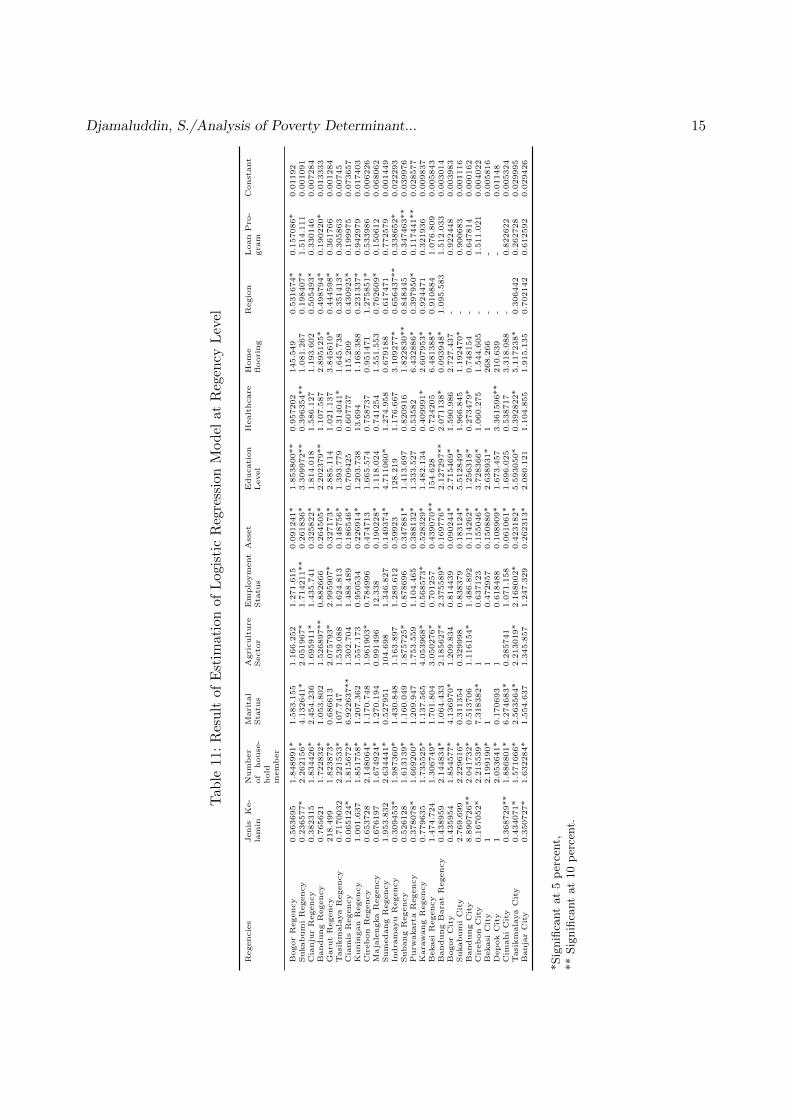
The inter-area poverty determinant analy-sis indicates that the characteristics of povertyvary among diferent areas. The dimenson andcomplexity of poverty in a regency level espe-cially vary. Compared to other regencies andcities, Sukabumi regency is facing a more com-plex poverty issues with at least 10 factors sub-stantially influence poverty in need to address.
The factors are identified as gender of house-hold heads, household size, marital status, em-ployment in the agricultural industry, employ-ment status as worker/laborer, asset, low edu-cation, healthcare, area classification and busi-ness loan. Among other regencies/cities with ahigh number of poverty determinants are re-gencies Bandung, Garut and West Bandungwith 7, 8 and 7 poverty determinants respec-tively. Poverty determinants in Bandung areidentified as household size, employment inthe agricultural industry, employment status asworkers/laborers, asset, low education, homeflooring, area classification and loan programs.Meanwhile, poverty determinants in Bandungand Garut are the same with the exception ofemployment status as workers/laborers whichis a poverty determinant in Garut but not inBandung.
Meanwhile, the characteristics of poverty inPurwakarta and Karawang vary from otherareas. The six poverty determinants in Pur-wakarta are identified as gender of householdhead, household size, assets, household-levelcharacteristics, area classification and loan pro-gram. Simultaneously in Karawang, povertydeterminants are identified as household size,employment in the agriculture industry, mar-ital status, asset, healthcare and household-level characteristics.
The problem of poverty is considered simplerin regencies Kuningan, Cirebon, Majalengkaand Sumedang. There are only three determi-nants of poverty were identified in each of thefour regencies, or household size, employmentfield and area characteristics in Cirebon. Thedeterminants of poverty in Kuningan and Ma-jalengka are the same – household size, assetsand area classification. Meanwhile, the deter-minants of poverty in regencies Subang andBekasi are roughly the same, with the excep-tion of business loans as a significant deter-miner of poverty in Subang but not Bekasi.Similarly, the determinants of poverty in re-gencies Majalengka and Subang are also more

Djamaluddin, S./Analysis of Poverty Determinant... 14
or less the same, with the difference being areaclassification which is a significant determinantin the former but not the latter.
The characteristics of poverty in Cianjur isroughly the same as that in Kuningan and Cire-bon, with the primary difference being employ-ment by the agriculture industry which is a sig-nificant poverty determinant in Cianjur but notCirebon.
Meanwhile on a city-level, the question ofpoverty is the most complex in Tasikmalayawhere 9 determinants of poverty were iden-tified. The determinants of poverty in Tasik-malaya are gender of household head, house-hold size, marital status, employment by theagriculture industry, employment status as aworker/laborer, asset, low education, health-care and home flooring.
5 and 6 poverty determinants were identifiedrespectively in Bandung and Cirebon and thatboth cities more or less have the same povertydeterminants with the difference being businessfield and healthcare as significant poverty de-terminants in Bandung but not Cirebon. Si-multaneously, marital status is also a signif-icant determinant of poverty in Cirebon butnot Bandung. The four poverty determinantsin both cities are gender of household heads,size, asset and low education.
Unlike the cities mentioned above, the ques-tion of poverty is relatively simpler in remain-ing cities. Three determinants of poverty areidentified in cities Bekasi, Depok and Banjar,with similar poverty determinants being house-hold size and asset. The difference is that loweduction, healthcare and asset is a significantdeterminant in Bekasi, Depok and Banjar re-spectively.
Meanwhile, the determinants of poverty inBanjar is also more or less the same as thatin Cimahi, with the difference being maritalstatus as a significant determinant of povertyin Cimahi but not in Banjar. Simultaneously,the determinants of poverty in Sukabumi is alsomore or less the same as that in Bekasi, with
the difference being household-level character-istics as a significant determinant of poverty inSukabumi but not in Bekasi.
7. Conclusion
The determinants of poverty vary amongdifferent cities and regencies in West Java.Based on observations to measure the signif-icance of each determinant of poverty con-ducted through the regression model, house-hold size and assets are the primary deter-minants of poverty in cities and regencies inWest Java. At province, city and regency level,the size of households members are identifiedas among the major factors which can causehigher probabilty of poverty. Meanwhile, own-ership of assets is the factor that causes lowprobability of poverty in regencies and cities.The problems of poverty is most complex inSukabumi regency and Tasikmalaya city where10 and 9 significant determinants of povertywere identified respectively. Several regenciesand cities also possed the same or similar typesof poverty determinants.
8. References
[1] Afandi, W. N. (2001). Identification of PovertyCharacteristics of Household in Padang PariamanRegency (Case study: Nagari Malai V Suku).Prodi Perencanaan Pembangunan, Program Pas-casarjana, Universitas Andalas. http://pasca.
unand.ac.id/id/wp-content/uploads/2011/09/
IDENTIFIKASI-KARAKTERISTIK-RUMAH-TANGGA-
MISKIN-DI-KABUPATEN-PADANG-PARIAMAN-STUDI-
KASUS-NAGARI-MALAI-V-SUKU.pdf
[2] Geda, A., de Jong, N., Mwabu, G., & Kimenyi,M. (2001). Determinants of Poverty in Kenya: AHousehold Level Analysis. ISS Working Paper Se-ries/General Series, 347, 1–20. Netherlands: Insti-tute of Social Studies. http://repub.eur.nl/pub/19095/wp347.pdf
[3] Haughton, J. H., & Khandker, S. R. (2009). Hand-book on Poverty and Inequality. World Bank Pub-lications.
[4] ILO. (2004). Jender dan Kemiskinan di Indone-sia, Seri Rekomendasi Kebijakan: Kerja Layakdan Penanggulangan Kemiskinan di Indonesia,
Djamaluddin, S./Analysis of Poverty Determinant... 15
Tab
le11
:R
esu
ltof
Est
imat
ion
ofL
ogis
tic
Reg
ress
ion
Mod
elat
Reg
ency
Lev
el
Regencie
sJenis
Ke-
lam
inN
um
ber
of
house
-hold
mem
ber
Mari
tal
Sta
tus
Agri
cult
ure
Secto
rE
mplo
ym
ent
Sta
tus
Ass
et
Educati
on
Level
Healt
hcare
Hom
efl
oori
ng
Regio
nL
oan
Pro
-gra
mC
onst
ant
Bogor
Regency
0.5
63695
1.8
48991*
1.5
83.1
55
1.1
66.2
52
1.2
71.6
15
0.0
91241*
1.8
53800**
0.9
57202
145.5
49
0.5
31674*
0.1
57086*
0.0
1192
Sukabum
iR
egency
0.2
36577*
2.2
62156*
4.1
32641*
2.0
51967*
1.7
14211**
0.2
61836*
3.3
09972**
0.3
96354**
1.0
81.2
67
0.1
98407*
1.5
14.1
11
0.0
01091
Cia
nju
rR
egency
0.3
82315
1.8
34426*
2.4
54.2
36
1.6
95911*
1.4
35.7
41
0.3
25822*
1.8
14.0
18
1.5
86.1
27
1.1
93.6
02
0.5
05493*
0.3
30146
0.0
07284
Bandung
Regency
0.7
65621
1.7
22832*
1.0
53.8
02
1.5
26897**
0.8
82666
0.2
64505*
2.2
02379**
1.1
07.5
87
2.8
95125*
0.4
98794*
0.1
90220*
0.0
13333
Garu
tR
egency
218.4
99
1.8
23873*
0.6
86613
2.0
75793*
2.9
95907*
0.3
27173*
2.8
85.1
14
1.0
21.1
37
3.8
45610*
0.4
44598*
0.3
61766
0.0
01284
Tasi
km
ala
ya
Regency
0.7
170032
2.2
21533*
107.7
47
1.5
39.0
88
1.6
24.8
13
0.1
48756*
1.3
93.7
79
0.3
14041*
1.6
45.7
38
0.3
51413*
0.3
05863
0.0
0745
Cia
mis
Regency
0.0
65124*
1.8
15672*
6.9
22637**
1.3
02.7
04
1.4
88.4
89
0.1
86546*
0.7
09425
0.6
07737
115.2
09
0.4
30925*
0.1
99975
0.0
73657
Kunin
gan
Regency
1.0
01.6
37
1.8
51758*
1.2
07.3
62
1.5
57.1
73
0.9
50534
0.2
26914*
1.2
03.7
38
13.6
94
1.1
68.3
88
0.2
31337*
0.9
42979
0.0
17403
Cir
eb
on
Regency
0.6
53728
2.1
48064*
1.1
70.7
48
1.9
61903*
0.7
84996
0.4
74713
1.6
65.5
74
0.7
58737
0.9
51471
1.2
75851*
0.5
33986
0.0
06226
Maja
lengka
Regency
0.6
76197
1.6
74924*
1.2
70.1
94
0.9
91496
12.3
38
0.1
90228*
1.1
18.0
24
0.7
41254
1.5
51.5
53
0.7
62609*
0.1
50612
0.0
68062
Sum
edang
Regency
1.9
53.8
32
2.6
34441*
0.5
27951
104.6
98
1.3
46.8
27
0.1
49374*
4.7
11060*
1.2
74.9
58
0.6
79188
0.6
17471
0.7
72579
0.0
01449
Indra
mayu
Regency
0.3
09453*
1.9
87360*
1.4
30.8
48
1.1
63.8
97
1.2
89.6
12
0.5
9923
128.2
19
1.1
76.6
67
3.1
09277*
0.6
56437**
0.3
38652*
0.0
22293
Subang
Regency
0.5
26128
1.6
13139*
1.1
60.0
49
1.8
75725*
0.8
78696
0.3
47881*
1.4
13.6
97
0.8
20916
1.8
22830**
0.8
48445
0.3
47463**
0.0
39976
Purw
akart
aR
egency
0.3
78078*
1.6
69200*
1.2
09.9
47
1.7
53.5
59
1.1
04.4
65
0.3
88132*
1.3
33.5
27
0.5
3582
6.4
32886*
0.3
97950*
0.1
17441**
0.0
28577
Kara
wang
Regency
0.7
79635
1.7
35525*
1.1
37.5
65
4.0
53968*
0.5
68573*
0.5
28329*
1.4
82.1
34
0.4
09991*
2.6
07953*
0.9
24471
0.3
21936
0.0
09837
Bekasi
Regency
1.4
74.7
24
1.3
06749*
1.7
01.8
04
3.0
50276*
0.7
01257
0.4
39070**
154.6
28
0.7
24205
6.4
81388*
0.9
10884
1.0
76.8
09
0.0
05843
Bandung
Bara
tR
egency
0.4
38959
2.1
44834*
1.0
64.4
33
2.1
85627*
2.3
75589*
0.1
69776*
2.1
27297**
2.0
71138*
0.0
93948*
1.0
95.5
83
1.5
12.0
33
0.0
03014
Bogor
Cit
y0.4
35954
1.8
54577*
4.1
36970*
1.2
09.8
34
0.8
14439
0.0
90244*
2.7
15469*
1.5
90.9
86
2.7
27.4
37
-0.9
22448
0.0
03983
Sukabum
iC
ity
2.7
69.6
99
2.2
29616*
0.3
11354
0.3
29998
0.8
38379
0.1
83124*
5.5
12849*
1.9
66.8
45
1.1
92470*
-0.9
00683
0.0
01116
Bandung
Cit
y8.8
90726**
2.0
41732*
0.5
13706
1.1
16154*
1.4
86.8
92
0.1
14262*
1.2
56318*
0.2
73479*
0.7
48154
-0.6
47814
0.0
00162
Cir
eb
on
Cit
y0.1
67052*
2.2
15539*
7.3
18382*
10.6
37123
0.1
55046*
3.7
28366*
1.0
60.2
75
1.5
44.6
05
-1.5
11.0
21
0.0
04022
Bekasi
Cit
y1
2.1
99190*
11
0.4
72957
0.1
50880*
2.6
38931*
1268.2
66
--
0.0
05816
Dep
ok
Cit
y1
2.0
53641*
0.1
70693
10.6
18488
0.1
08909*
1.6
73.4
57
3.3
61596**
210.6
39
--
0.0
1148
Cim
ahi
Cit
y0.3
68729**
1.8
86801*
6.2
74683*
0.2
85741
1.0
71.1
58
0.0
61061*
1.6
96.0
25
0.5
38717
3.3
18.0
88
-0.8
22622
0.0
05324
Tasi
km
ala
ya
Cit
y0.4
34071*
1.5
71666*
2.5
63564*
2.2
13019*
2.1
68002*
0.4
23182*
5.5
93050*
0.3
92822*
5.1
17238*
0.3
06442
0.2
62728
0.0
29995
Banja
rC
ity
0.3
50727*
1.6
32284*
1.5
54.6
37
1.3
45.8
57
1.2
47.3
29
0.2
62313*
2.0
80.1
21
1.1
04.8
55
1.9
15.1
35
0.7
02142
0.6
12592
0.0
29426
*Sig
nifi
cant
at
5p
erce
nt,
**
Sig
nifi
cant
at
10
per
cent.

Djamaluddin, S./Analysis of Poverty Determinant... 16
2003. Jakarta: Kantor Perburuhan Interna-sional – International Labour Organization.http://www.ilo.org/wcmsp5/groups/public/
---asia/---ro-bangkok/---ilo-jakarta/
documents/publication/wcms_125243.pdf
[5] Mok, T. Y., Gan, C., & Sanyal, A. (2007). TheDeterminants of Urban Household Poverty inMalaysia. Journal of Social Sciences, 3 (4), 190–196.
[6] Mukherjee, S., & Benson, T. (2003). The Determi-nants of Poverty in Malawi, 1998. World Develop-ment, 31 (2), 339–358.