analysis of policy measures to reduce ship emissions...
TRANSCRIPT

International Institute for Applied Systems Analysis Schlossplatz 1 A-2361 Laxenburg, Austria
Tel: +43 2236 807 0Fax: +43 2236 71313
E-mail: [email protected]: www.iiasa.ac.at
Analysis of Policy Measures to Reduce Ship Emissions in the
Context of the Revision of the National Emissions Ceilings Directive
Final Report
Janusz Cofala, Markus Amann, Chris Heyes, Fabian Wagner, Zbigniew Klimont, Max Posch, Wolfgang Schöpp
Leonor Tarasson, Jan Eiof Jonson, Chris Whall, Andrianna Stavrakaki
Submitted to the European Commission, DG Environment, Unit ENV/C1
Contract No 070501/2005/419589/MAR/C1
IIASA Contract No. 06-107
April 2007


Analysis of Policy Measures to Reduce Ship Emissions in the
Context of the Revision of the National Emissions Ceilings Directive
Draft Final Report
Janusz Cofala, Markus Amann, Chris Heyes, Fabian Wagner, Zbigniew Klimont, Max Posch, Wolfgang Schöpp
International Institute for Applied Systems Analysis (IIASA)
Leonor Tarasson Jan Eiof Jonson
Norwegian Meteorological Institute (MET.NO)
Chris Whall Andrianna Stavrakaki
Entec UK Limited
Submitted to the European Commission, DG Environment, Unit ENV/C1
Contract No 070501/2005/419589/MAR/C1
IIASA Contract No. 06-107
April 2007
This paper reports on work of the International Institute for Applied Systems Analysis and has received only limited review. Views or opinions expressed in this report do not necessarily represent those of the Institute, its National Member Organizations, or other organizations sponsoring the work.


v
Abstract Maritime activities constitute a significant fraction of anthropogenic emissions of air pollutants in Europe. In 2000, SO2 and NOx emissions from international maritime shipping in Europe amounted to approximately 30 percent of the land-based emissions in the EU-25. While legislation is in force to control emission from international shipping, the expected increase in the volume of ship movements will compensate the positive environmental impacts of these measures and will lead to a further growth in ship emissions. Under business-as-usual assumptions, by 2020 emissions from maritime activities would come close to the projected baseline emission levels from land-based sources, and surpass the target levels established by the European Commission in its Thematic Strategy on Air Pollution for land-based sources.
This anticipated increase in ship emissions will counteract the envisaged benefits of the costly efforts to control the remaining emissions from land-based sources in Europe. While at present emissions from ships are responsible for 10 to 20 percent of sulphur deposition in coastal areas, their contribution is expected for 2020 to increase to more than 30 percent in large areas in Europe, and up to 50 percent in coastal areas.
Technologies exist to reduce emissions from shipping beyond what is currently legally required. The study has identified a set of emission control measures that are technically available and that could – if fully applied – reduce by 2020 80 percent of the SO2 emissions from international shipping, and almost 90 percent of the NOx emissions. Total costs of these measures are estimated at 5.5 billion €/yr. For comparison, the costs of the measures proposed by the Thematic Strategy amount to 7.1 billion €/yr.
The study has explored several packages of measures that could reduce emissions at lower costs. These include combinations of seawater sulphur scrubbing, lower sulphur content in residual oil, humid air engines for new built ships, slide valves retrofitting in existing ship engines, as well as the use of selective catalytic reduction (SCR). Marginal costs of these measures are well below the costs of the measures for land-based sources that have been proposed by the Thematic Strategy.
To judge the cost-effectiveness of such measures against those for land-based sources, the analysis considered the impacts that emission reductions from shipping have on human health and natural environment. That analysis included the distance between the location of emissions from shipping and the receptor areas.
The study examined potential contribution of four emission scenarios from shipping to achieving air quality targets from the EU Thematic Strategy on Air Pollution. Cost-optimal emission reductions and control costs by national emission sources were determined and compared with costs of reducing emissions from maritime shipping. Analysis clearly demonstrates that limiting air pollution from shipping reduces the necessity to further control emissions from land-based sources and provides important cost savings in achieving air quality targets in Europe.

vi
vii
Glossary of terms used in this report CAFE Clean Air For Europe Programme CLE Current legislation CO2 Carbon dioxide EMEP European Monitoring and Evaluation Programme Entec Entec UK Limited EU European Union GAINS Greenhouse gas - Air pollution Interactions and Synergies model GW Gigawatt IIASA International Institute for Applied Systems Analysis IMO International Maritime Organization IPPC Integrated Pollution Prevention and Control kt kilotons = 103 tons MET.NO Norwegian Meteorological Institute Mt megatons = 106
tons N2O Nitrous oxides NEC National Emission Ceilings NH3 Ammonia NOx Nitrogen oxides O3 Ozone PJ Petajoule = 1015 joule
PM10 Fine particles with an aerodynamic diameter of less than 10 µm PM2.5 Fine particles with an aerodynamic diameter of less than 2.5 µm RAINS Regional Air Pollution Information and Simulation model SECA Sulphur Emissions Control Area SO2 Sulphur dioxide SOMO35 Sum of excess of daily maximum 8-h means over the cut-off of 35 ppb
calculated for all days in a year TREMOVE Transport Model UNECE United Nations Economic Commission for Europe VOC Volatile organic compounds

ix
Table of Contents
1 INTRODUCTION ..................................................................................... 1
2 OBJECTIVES AND SCOPE OF THE STUDY ........................................ 3
3 EMISSION INVENTORY ......................................................................... 5
3.1 Methodology .................................................................................................................................5
3.2 Coverage .......................................................................................................................................6
3.3 Estimates of total ship emissions.................................................................................................9
3.4 Emissions in the 12-mile zone territorial seas..........................................................................12
3.5 Emissions from national sea traffic ..........................................................................................14
4 EMISSION SCENARIOS....................................................................... 16
4.1 Activity data................................................................................................................................16
4.2 Emission control technologies and their costs..........................................................................17
4.3 Emission control scenarios ........................................................................................................20
4.4 Resulting emissions ....................................................................................................................22
4.5 Emission control costs................................................................................................................25
5 ATMOSPHERIC DISPERSION OF SHIP EMISSIONS......................... 29
5.1 Model description.......................................................................................................................29
5.2 Source receptor calculations for ship traffic............................................................................29
5.3 Model results ..............................................................................................................................31 5.3.1 Ground-level ozone .................................................................................................................31 5.3.2 Acid deposition........................................................................................................................34
6 HEALTH AND ENVIRONMENTAL IMPACTS ...................................... 39
6.1 Health impacts of fine particulate matter ................................................................................39
6.2 Premature mortality attributable to ground-level ozone........................................................43
6.3 Protection of ecosystems against acidification.........................................................................44 6.3.1 Forests ......................................................................................................................................45 6.3.2 Semi-natural vegetation..........................................................................................................47 6.3.3 Freshwater ecosystems ...........................................................................................................48 6.3.4 All ecosystems..........................................................................................................................49

x
6.4 Protection of ecosystems against eutrophication .....................................................................50
7 EFFECTS OF CONTROLLING EMISSIONS FROM SHIPPING ON LEAST-COST EMISSION REDUCTIONS FROM NATIONAL SOURCES...... 53
8 SUMMARY AND CONCLUSIONS........................................................ 60
Appendices (available as a separate document)

1
1 Introduction Ships release a significant fraction of the total anthropogenic emissions of air pollutants. In the year 2000, emissions from international shipping in the seas surrounding the territory of the European Union (i.e., Baltic, North Sea, Northeast Atlantic, and Mediterranean Sea) amounted to 20 to 30 percent of the sulphur dioxide (SO2) and nitrogen oxides (NOx) emissions from land-based sources in the EU. While EU air quality legislation will lead to a decline of land-based emissions in the future, ship emissions, without additional emission control measures, are poised to grow further as a consequence of steadily increasing transport volumes.
Health and environmental impacts of air pollutants are critically determined by the proximity of the emission sources to sensitive receptor sites. This means that, compared to land-based sources, at least some of the maritime emissions have less health and environmental impacts since they are released sometimes far from populated areas or sensitive ecosystems. However, in harbour cities ship emissions are in many cases a dominant source of urban pollution and need to be addressed when compliance with EU air quality limit values for fine particulate matter is an issue. Furthermore, as for all other sources, also emissions from ships are transported in the atmosphere over several hundreds of kilometres, and thus can contribute to air quality problems on land, even if they are emitted on the sea. This pathway is especially relevant for deposition of sulphur and nitrogen compounds, which cause acidification of natural ecosystems and freshwater bodies and threaten biodiversity through excessive nitrogen input.
The anticipated increase in ship emissions will counteract the envisaged benefits of the costly efforts to control the remaining emissions from land-based sources in Europe. Technologies exist to reduce emissions from shipping more than what is currently legally required. Costs for some of these options are low compared with the costs of measures to further reduce emissions from land-based sources.
Sensitivity analyses performed within the Clean Air for Europe (CAFE) Programme have suggested that for the environmental targets of the Thematic Strategy on Air Pollution it might be more cost-efficient to reduce emissions from shipping beyond current legislation instead of implementing costly measures on stationary land-based sources. Following on from the Thematic Strategy, the European Commission develops a legislative proposal to revise the national emissions ceilings directive 2001/81/EC (NECD). While the NEC directive does not include emissions from international shipping, their contribution to the environmental problems and their potential role in cost-effective approaches for improving European air quality requires attention.
Recently the European Union developed a strategy for reducing the atmospheric emissions from maritime transport. It sets out a series of actions to reduce the impact of maritime transport on acidification, ground level ozone, eutrophication, health, climate change and ozone depletion. One result of the strategy was an amendment to the Sulphur Content of Certain Liquid Fuels Directive (1999/32/EC) – Directive 2005/33/EC (OJ L 191/59, 2005), which is linked to Annex VI of the Marine Pollution Convention, MARPOL 73/78, of the International Maritime Organisation (IMO). Annex VI (Air Pollution) of the Marine Pollution Convention (MARPOL)

2
came into force in May 2005 when the requisite number of flag states and shipping tonnage ratified its provisions. Following the entry into force of Annex VI, several Member States have submitted a request to the International Maritime Organization (IMO) for changes to ship emissions standards. These proposals will be discussed in due course and will need to be fully justified if they are to be adopted by the IMO. Moreover, the Council of Ministers has concluded that the Community should adopt its own measures to reduce NOx emissions from EU-flagged ships if progress is not forthcoming at the IMO.
This situation calls for a more systematic assessment of the possible measures to reduce atmospheric emissions from maritime sources. This report examines the possible development of future ship emissions for a range of emission control scenarios, examines their costs and discusses their environmental impacts. Although the analysis concentrates on international shipping, emissions from national navigation (and national fishing) are included in national emissions estimates. The analysis uses the integrated assessment framework of the RAINS/GAINS model (compare Amann et al., 2004 and Klaassen et al., 2005).
The remainder of the report is organized as follows: Section 2 presents the objectives and the scope of the study in more detail. Section 3 describes the methodology and assumptions used for preparation of emission inventory for the base year (2000) and reviews the resulting emission estimates. Section 4 presents emission projections from shipping up to 2020. Assumptions on the development of sea transport activities and on the emission control measures analyzed in each scenario are summarized, and the resulting emissions and emission control costs are discussed. Section 5 outlines the use of the EMEP model to derive information on the dispersion characteristics of air pollutants from shipping. Section 6 presents environmental impact indicators for each of the scenarios. Section 7 discusses potential contribution of ship measures to cost-efficient achievement of air quality objectives of the EU Thematic Strategy on Air Pollution (CEC, 2005). Major findings from the study and conclusions can be found in Section 7.

3
2 Objectives and scope of the study This study explores the potential for measures to control NOx, SO2, and primary PM2.5
emissions from international shipping in the European sea areas. It estimates current emissions from different vessel categories in the various sea regions, projects emissions into the future for a range of alternative assumptions about the implementation of emission control measures, and assesses the environmental impacts of the different emission control scenarios.
The study entails the following three core elements:
• Compilation and update of ship emission inventories;
• Development of source-receptor (SR) relationships of atmospheric transport of pollution;
• Analysis of policy scenarios to control ship emissions.
The study covers five sea regions:
• the Baltic Sea,
• the North Sea (with the English Channel),
• the Mediterranean Sea,
• the Black sea and
• the North East Atlantic Ocean.
In each of these sea regions, potential measures are studied in terms of their cost-efficiency for
• EU-flagged ships vs. non-EU flagged ships,
• vessel types [cargo, passenger ships (ferries)],
• shipping movements within the 12-mile limit zone from shore vs. shipping movements beyond the 12-mile limit zone.
This report results from a joint effort of three institutions: Entec UK Limited, the Norwegian Meteorological Institute (MET.NO), and the International Institute for Applied Systems Analysis (IIASA). The individual teams had shared the responsibilities as follows:
• Entec UK Limited (Entec) prepared gridded emission inventories of air pollutants for each sea region and vessel type and developed emission and cost characteristics of the available control technologies.
• MET.NO applied its EMEP Eulerian dispersion model to perform calculations of atmospheric transport of air pollutants, so that pollution transfer coefficients could be derived.
• IIASA extended its RAINS/GAINS integrated assessment model to include detailed information on shipping into its calculation framework, developed pollution control scenarios and assessed their environmental impacts and costs.

4
In order to maintain consistency in modelling assumptions and approaches and to ensure comparability with the analysis performed in connection with the revision of the NEC directive, the same methodology for integrated assessment modelling as applied for the NEC analysis has been used by the project team. IIASA has extended its calculation framework to accommodate a more detailed representation of the sources of maritime emissions. MET.NO used its EMEP unified model to provide source-receptor relationships for the new source categories. Both the modelling tools and the project teams are the same as in the analysis for the revision of the NECD. The work under this project draws heavily on the results of previous studies performed by Entec (Whall et al., 2002) and its follow-up (Entec, 2005a-d). In addition, for this project Entec’s databases were updated to include the most up-to date information on the distribution of emission sources and on emission control costs. With these refinements the analysis of this report is expected to improve the quality of modelling emissions from shipping and thereby strengthen the NECD analysis, and provide background material for the analysis undertaken for the IMO process.

5
3 Emission inventory As an important input to the other work elements, an updated inventory of the emissions of marine activities has been developed by Entec. This inventory is based on earlier estimates of emissions from ship movements between ports of the European Community that were compiled by Entec in 2002 and 2005 (Entec 2002, 2005a,b). The current inventory refined the earlier work through more detailed spatial resolution of emissions in the various sea areas distinguishing national and international emissions, emissions by flag state and emissions within the 12-mile territorial waters.
3.1 Methodology The inventory estimates emissions in a ‘bottom-up’ way on the basis of kilometres travelled by individual vessels and uses weighted emission factors for each vessel type as opposed to fuel based emission factors. The underlying vessel movement data for the year 2000 were provided by Lloyds Marine Intelligence Unit (LMIU) and data on vessel characteristics by Lloyds Register Fairplay.
With this approach, the inventory was not originally designed to estimate fuel consumption data, which is a type of data required by the RAINS model. To enable separate fuel consumption estimates of residual oil and marine distillates to be made from total emissions, an assumption has been made that approximately 90 percent of fuel consumption is residual oil and that approximately 10 percent is marine distillate. Available databases and other statistics do not enable the actual split in fuel consumption for ships in European waters to be estimated to a high degree of accuracy. With these assumptions, fuel consumption estimates were derived from the calculated NOx emissions and aggregated NOx emission factors, for residual oil and marine distillates (Table 3.1).

6
Table 3.1: Fuel consumption for international shipping in 2000 by sea region, zone and vessel type [PJ]
Ship category Baltic Sea Black Sea Remaining NE Atlantic
Flag Fuel1) <12-mile >12-mile <12-mile >12-mile <12-mile >12-mile
Cargo - EU RO 16.7 61.9 2.7 18.2 7.9 112.9 Cargo - EU MD 1.9 6.9 0.3 2.0 0.9 12.6 Ferry - EU RO 0.4 1.1 0.0 0.2 0.2 2.3 Ferry - EU MD 0.0 0.1 0.0 0.0 0.0 0.3 Cargo - Non EU RO 13.3 44.4 2.5 17.0 13.4 225.6 Cargo - Non EU MD 1.5 4.9 0.3 1.9 1.5 25.1 Ferry - Non EU RO 0.1 0.5 0.0 0.1 0.1 0.6 Ferry - Non EU MD 0.0 0.1 0.0 0.0 0.0 0.1 Total 33.9 119.7 5.8 39.6 24.0 379.3
Ship category Mediterranean Sea North Sea Total European seas Flag Fuel1 <12-mile >12-mile <12-mile >12-mile <12-mile >12-mile Cargo - EU RO 22.6 294.8 19.5 119.7 69.5 607.5 Cargo - EU MD 2.5 32.8 2.2 13.3 7.7 67.5 Ferry - EU RO 6.5 34.5 0.9 5.7 7.9 43.8 Ferry - EU MD 0.7 3.8 0.1 0.6 0.9 4.9 Cargo - Non EU RO 24.9 394.1 27.0 150.9 81.1 831.9 Cargo - Non EU MD 2.8 43.8 3.0 16.8 9.0 92.4 Ferry - Non EU RO 0.7 6.9 0.2 1.6 1.2 9.7 Ferry - Non EU MD 0.1 0.8 0.0 0.2 0.1 1.1 Total 60.9 811.4 52.8 308.8 177.4 1658.9
1 Fuel types: RO – residual oil; MD – marine diesel.
3.2 Coverage
The gridded emissions inventory distinguishes for each grid cell in the EMEP domain emissions from
• passenger and • cargo ships,
distinguishing • national and • international ships (by flag)
and emissions (by flag) • within the 12-mile territorial waters • and outside this zone.

7
The inventory covers the following pollutants:
• sulphur dioxide (SO2),
• nitrogen oxides (NOx),
• total hydrocarbons (HC)1,
• primary particulate matter (PM), and
• carbon dioxide (CO2).
Emissions were estimated on the basis of vessel movement data and the underlying vessel emission factors as specified in Entec (2005b-d). For estimating sulphur emissions, sulphur contents in residual oil (RO) of 2.7 percent and for marine distillates (MD) of 0.2 percent have been assumed.
For pollutants that are necessary for the computations of the chemical transport model calculations with the EMEP Unified model, gridded inventories have been compiled for
• coarse primary particulate matter (PM10-PM2.5) PMcoarse,
• fine primary particulate matter (PM2.5),
• non-methane volatile organic compounds (NMVOC), and
• carbon monoxide (CO).
The inventories of these pollutants were derived in the following way:
• For CO emissions, a constant ratio of 0.24 percent of CO2 has been assumed (consistent with the CORINAIR emission factors).
• NMVOC was assumed to be amount to 99 percent of HC.
• PM2.5 was assumed to be equivalent to 90 percent of total PM, consistent with the CORINAIR emission factors.
• PMcoarse (all particles with a diameter between 2.5 and 10µm) was assumed to be equivalent to 5 percent of total PM. This is consistent with the CORINAIR emission factors.
The inventory distinguishes the following five sea areas:
• North Sea,
• Black Sea,
• Mediterranean Sea,
• Baltic Sea,
• Atlantic Ocean (North-East part, within the EMEP domain).
1 These are exhaust emissions only, i.e., they do not include VOC emitted during loading, unloading and
gas-freeing of petro-chemical vessels. Loading and unloading emissions were quantified in a separate study for the EC available at http://www.europa.eu.int/comm/environment/air/pdf/vocloading.pdf

8
The earlier Entec and EMEP inventories of ship emissions studies applied slightly different definitions of sea areas. Entec’s study for the EC included a requirement to separately identify emissions for the English Channel and Irish Sea, whereas the EMEP inventory includes the English Channel within either the North Sea or the North-East Atlantic, while the Irish Sea is included with the North-East Atlantic. Definitions also differed for the North-East Atlantic, which Entec had previously subdivided into two categories (North-East Atlantic and Rest of EMEP Area).
Table 3.2 lists the countries that are explicitly distinguished in this inventory. These include the 27 EU countries and the tow candidate countries (Croatia and Turkey). All other countries form the Non-EU group.
Furthermore, the inventory estimates emissions for two vessel types: • cargo vessels and • passenger vessels (ferries).
Further consideration has been given to emissions from smaller vessels as described below.
National movements are defined as movements between ports of the same country (e.g., UK to UK). Where national emissions are presented by vessel flag, this represents all combinations of national emissions under that particular flag state (e.g., Belgium flagged vessels on any domestic routes, which may include UK to UK, Belgium to Belgium, France to France, etc). Emissions from inland waterways are not included in the disaggregated dataset.
International movements are defined as movements between ports of different countries (e.g., UK to France). Where international emissions are presented by vessel flag, this represents all combinations of international emissions under that particular flag state (i.e., Belgium flagged vessels on any international routes which may include UK to France, Belgium to Spain, Italy to North America, etc).
The LMIU ship movement database includes all vessels above 500 gross registered tonnes (GRT). Smaller vessels, which are not routinely included in the movement database, were assumed to be operating closer to land and using lower sulphur marine fuels as opposed to heavy fuel oil. The fuel consumption for the range 100-500 GRT is estimated to be less than eight percent of the total estimated consumption for >100 GRT (Endresen et al., 2003). On the basis of uncertainties over the movements of smaller vessels and in line with the scope of this study, a top-down approach has been adopted by assuming that an additional 10 percent of emissions in the 12-mile zones are attributable to vessels <500 GRT. Therefore, gridded emissions estimated for larger vessels in each of the 50 km x 50 km grid cells that include the 12-mile zone have been multiplied by a factor of 1.1.
When interpreting the results of the emissions assessment, the issues concerning uncertainty presented in Appendix E of Entec’s 2005 Task 1 report should be considered.

9
Table 3.2: EU27 and candidate countries.
Reference Country code Country name 1 AUT Austria (EU) 2 BEL Belgium (EU) 3 DNK Denmark (EU) 4 FIN Finland (EU) 5 FRA France (EU) 6 GER Germany (EU) 7 GRC Greece (EU) 8 IRL Ireland (EU) 9 ITA Italy (EU) 10 LUX Luxembourg (EU) 11 NLD Netherlands (EU) 12 PRT Portugal (EU) 13 ESP Spain (EU) 14 SWE Sweden (EU) 15 GBR United Kingdom (EU) 16 CYP Cyprus (EU) 17 CZE Czech Republic (EU) 18 EST Estonia (EU) 19 HUN Hungary (EU) 20 LVA Latvia (EU) 21 LTU Lithuania (EU) 22 MLT Malta (EU) 23 POL Poland (EU) 24 SVK Slovakia (EU) 25 SVN Slovenia (EU) 26 BGR Bulgaria (EU) 27 ROM Romania (EU) 28 TUR Turkey (Candidate) 29 CRO Croatia (Candidate)
3.3 Estimates of total ship emissions The emission inventory provides estimates of air pollutant emissions for the various sea regions, distinguishing international and national movements. The inventory is disaggregated on the basis of vessel flags.
The spatial distribution of emissions within each sea region has been estimated based on ship movement data along the various routes and on information about the main engine power of the ships, assuming that the main engine power represents a good proxy for total kW power and the associated emissions. Data on main engine power were further categorised by sea area, vessel type (cargo or passenger) and movement type (national or international) to enable emissions to be calculated for the various categories.

10
The inventory is summarized in Table 3.3 (for larger vessels only) and Table 3.4 for all vessels. Smaller vessels add between two and six percent to total emissions in each sea region, depending on the share of the 12-mile zone in the sea area. This estimate assumes that smaller vessels are predominantly part of national fleets and are not involved in international trade. More detailed data are presented in the appendices. Appendix A presents national and international emissions disaggregated by the 12-mile zones of each EU country. Emissions by sea area, vessel flag (EU or Non-EU), movement type (at sea, manoeuvring, at berth) and vessel type (cargo or passenger) are presented in Appendix B. Spatial distribution of emissions from international shipping in the year 2000 is shown in Figure 3.1 and Figure 3.2.
Table 3.3: Emissions from larger vessels (>500 GRT) by sea region for the year 2000, in kilotons/year.
Sea area CO2 SO2 NOx HC PMtotal North Sea 29664 496 693 25 59 Black Sea 3721 62 86 3 7 Mediterranean 75484 1251 1781 61 151 Baltic Sea 12727 212 299 10 24 NE Atlantic 31109 522 764 26 67 Total 152705 2543 3623 125 308
Table 3.4: Emissions from all vessels by sea region for the year 2000, in kilotons/year.
Sea area CO2 SO2 NOx HC PMtotal North Sea 30878 516 720 26 61 Black Sea 3852 65 89 3 8 Mediterranean 77140 1278 1818 62 154 Baltic Sea 13447 224 315 11 26 NE Atlantic 31673 532 777 26 68 Total 156989 2615 3719 129 316

11
Figure 3.1: Spatial distribution of SO2 emissions from international shipping in the year 2000
Figure 3.2: Spatial distribution of NOx emissions from international shipping in the year 2000

12
3.4 Emissions in the 12-mile zone territorial seas Ship emissions have also been estimated for the 12-mile coastal zones by apportioning a share of the emissions of the coastal 50*50 km EMEP grid cells. It is assumed that the share of emissions in the 12-mile zones is proportional to the area that the 12-mile zone constitutes in a coastal 50*50 km grid cell. This assumption may tend to underestimate actual emissions in these zones, because national coastal shipping might use routes closer to the coast lines. Results are presented in Table 3.5. Spatial distribution of the emissions is shown in Figure 3.3 and Figure 3.4.
Table 3.5: Emissions of vessels >500 GRT in the 12-mile zones in the year 2000 (kilotons)
CO2 SO2 NOx HC PMtotal Austria 0 0 0 0 0 Belgium 753.1 12.6 15.4 0.6 1.3 Bulgaria 112.4 1.9 2.4 0.1 0.2 Croatia 317.4 5.1 6.7 0.2 0.5 Cyprus 182 3 3.6 0.1 0.3 Czech Republic 0 0 0 0 0 Denmark 3247.3 54.3 77.1 2.7 6.4 Estonia 400.6 6.7 9 0.3 0.7 Finland 573 9.6 12.2 0.5 1 France 2692.9 44.2 58.2 2.3 4.9 Germany 2187.2 36.6 49.4 1.8 4.1 Greece 3942.5 64.3 86.8 3.1 7 Hungary 0 0 0 0 0 Ireland 329.6 5.6 7.1 0.2 0.6 Italy 3516 56.8 71.2 3 5.8 Latvia 241.8 4 5.1 0.2 0.4 Lithuania 74 1.2 1.5 0.1 0.1 Luxembourg 0 0 0 0 0 Malta 159 2.7 3.3 0.1 0.3 Netherlands 2197.5 36.8 47.8 1.9 4.2 Poland 225.8 3.8 4.7 0.2 0.4 Portugal 490.9 8.2 10.5 0.4 0.9 Romania 166.9 2.8 3.5 0.1 0.4 Slovakia 0 0 0 0 0 Slovenia 55.7 0.9 1.1 0 0.1 Spain 3393.6 56.8 75.1 2.9 6.5 Sweden 1344.8 22.5 29.5 1.2 2.5 Turkey 2155.8 36 47.6 1.8 4.2 UK 5999.4 100.4 133.0 5.1 11.7 Total 34759 577 761 29 65

13
Appendix A presents the estimated emissions within the 12-mile zones of each EU country, further disaggregated into national and international movements. Table A.1 presents the results excluding the estimated emissions from smaller vessels. On average, national emissions account for approximately 24 percent of total emissions in the 12-mile zones.
Figure 3.3: SO2 emissions from international ship traffic within the 12-mile zone for all flags, in kilotons
Figure 3.4: NOx emissions from international ship traffic within the 12-mile zone for all flags, in kilotons

14
3.5 Emissions from national sea traffic The inventory also estimates emissions from national sea traffic, which comprises ship movements between two ports of the same country. The estimates are based on activity data developed by Entec in its 2005 study. Table 3.6 compares the Entec estimates with inventory data reported by Member States to EMEP2. It has not been within the scope of this study to investigate the methods used by Member States to estimate their national emissions. Therefore, discrepancies between these two datasets cannot be explained with the current information.
Compared to the estimate of total ship emissions, assessments of the emissions from national shipping are burdened with additional uncertainties owing to differences in sectoral aggregations used by individual countries. In some cases even different institutions within the same country use different definitions and aggregations. Particularly large uncertainties emerge for estimates for the candidate countries and the non-EU countries. However, emissions from national shipping constitute a relatively small portion of total maritime emissions (7-10 percent for SO2 and PM, 12-14 percent for NOx).
2 According to CORINAIR (2004) national sea traffic is defined as all national ship transport including
ferries and fishing, for all ships of more than 100 gross tonnes, irrespective of flag, between ports in the same country, within the EMEP area. This means that, e.g., Danish traffic to east Greenland is included as national shipping in UNECE reports, but not the traffic to west Greenland. Military vessels should be included if data are available.

15
Table 3.6: Emissions from national sea traffic in the EU and Candidate countries for the year 2000, in kilotons. The Entec estimates exclude emissions from smaller vessels.
Country Entec estimates Estimates reported in the national emission inventories
SO2 NOX PM2.5 PM10 SO2 NOX PM2.5 PM10 Austria 0.0 0.0 0.0 0.0 0.0 0.0 0.0 0.0 Belgium 0.6 0.7 0.1 0.1 2.1 6.4 0.9 1.0 Bulgaria 0.1 0.1 0.0 0.0 2.6 12.9 0.2 0.3 Croatia 0.3 0.4 0.0 0.0 0.0 0.0 0.0 0.0 Cyprus 0.1 0.1 0.0 0.0 0.0 0.0 0.0 0.0 Czech Republic 0.0 0.0 0.0 0.0 0.0 0.0 0.0 0.0 Denmark 3.8 4.7 0.4 0.4 2.6 17.6 0.5 0.5 Estonia 0.1 0.1 0.0 0.0 0.1 0.3 0.0 0.0 Finland 7.4 10.1 0.8 0.8 0.8 7.7 0.3 0.3 France 15.3 20.2 1.4 1.4 9.9 27.8 1.9 2.0 Germany 6.2 7.8 0.6 0.6 0.0 0.0 0.0 0.0 Greece 13.5 16.9 1.3 1.4 22.3 40.4 1.6 1.7 Hungary 0.0 0.0 0.0 0.0 0.0 0.0 0.0 0.0 Ireland 1.3 1.6 0.1 0.1 1.4 1.0 0.1 0.1 Italy 102.0 135.8 9.2 9.7 60.9 89.1 4.4 4.6 Latvia 0.3 0.3 0.0 0.0 0.1 0.6 0.0 0.0 Lithuania 0.0 0.0 0.0 0.0 0.0 0.0 0.0 0.0 Luxembourg 0.0 0.0 0.0 0.0 0.0 0.0 0.0 0.0 Malta 0.3 0.3 0.0 0.0 0.0 0.0 0.0 0.0 Netherlands 2.8 3.3 0.3 0.3 0.9 16.1 0.3 0.3 Poland 0.6 0.8 0.1 0.1 1.0 2.7 0.2 0.2 Portugal 2.9 4.3 0.3 0.3 3.0 5.0 0.3 0.3 Romania 0.5 0.7 0.1 0.1 7.4 31.2 0.8 0.8 Slovakia 0.0 0.0 0.0 0.0 0.0 0.0 0.0 0.0 Slovenia 0.0 0.0 0.0 0.0 0.0 0.0 0.0 0.0 Spain 40.2 54.0 4.2 4.4 26.5 50.5 2.0 2.1 Sweden 6.8 9.0 0.7 0.7 3.0 49.6 1.2 1.3 Turkey 17.7 22.8 1.8 1.9 4.3 5.0 0.4 0.4 UK 39.3 49.9 4.1 4.3 20.1 54.6 1.2 1.3 TOTAL 262 344 25 27 169 419 16 17

16
4 Emission scenarios On the basis of disaggregated emissions and activity data provided by Entec, IIASA has implemented new source categories into the RAINS/GAINS framework that describe more detailed sea regions, vessel types and their flags. Work concentrated on international shipping, since national shipping is already included in the national inventories and in the national emission projections prepared for the revision of the NEC directive (Amann et al., 2007). A detailed description of the RAINS and GAINS models is provided in Amann et al., 2004 and Klaassen et al., 2005.
4.1 Activity data Projections of future shipping activities distinguish the following dimensions:
• The EMEP sea areas,
• within / outside the 12-mile zones,
• EU / non-EU flagged vessels,
• passenger / cargo vessels,
• marine distillates / residual fuel oil,
• international / national shipping.
For the emission projections in this study, the development of future shipping activities follow the assumptions of the TREMOVE European transport model (de Ceuster, 2006), which suggest for the baseline case annual growth rates of 2.5 percent for cargo vessels and 3.9 percent for passenger vessels. TREMOVE assumes constant fuel economy for international shipping in the projection period. In addition, the emission projections assume constant shares between the activities in- and outside the 12-mile zones, between the flag types of vessels, and apply the same growth rates to international shipping activities across all sea regions.
Growth rates for shipping activities assumed in this report are rather at the low end of a range of projections considered by other studies. For instance, the IMO GHG study (Skjolskvik et al., 2000) assumes 3 percent per year average growth rate between 2000 and 2030. Study by Corbett et al, 2007 comes up with 4.1 percent per year growth in the same period for the Base case scenario. Historic and projected development of major indices for shipping activities according to various sources is shown in Figure 4.1.

17
Figure 4.1: Global indices for seaborne trade, ship energy/fuel demand, and installed power. Source: Corbett et al., 2007.
4.2 Emission control technologies and their costs Future emissions are critically influenced by the application of emission control measures. For this purpose, the RAINS model distinguishes a set of emission control measures (Table 4.1) and their reduction efficiencies in relation to the reference emission factors that represent pre-MARPOL conditions. Input data have been prepared by Entec (Entec, 2005b).
Table 4.2 lists the estimated technical potentials for application of the emission control measures beyond what is anticipated to occur under the “current legislation” baseline scenario. These application potentials relate to the technical feasibility as opposed to potentials derived from cost-effectiveness, political or economic considerations. Furthermore, the applicability estimates do not take into account potential limitations related to other pollutants that are co-released by a control technique or limitations related to supply capacities. More detailed information on NOx abatement techniques and sea water scrubbing is given in Entec (2005c,d). Details of abatement cost data for specific control techniques are summarised in Table 4.3 and Table 4.4.
0
0.5
1
1.5
2
2.5
1950 1960 1970 1980 1990 2000 2010 2020 2030
Seaborne Trade (tons) Seaborne Trade (ton-miles)OECD HFO Int'l Sales Seaborne Trade (trend since 1985)World Marine Fuel (Eyring, 2005) Installed Power-This work
Extrapolating trends since ~1980-85 depending on data source

18
Table 4.1: Emission control technologies and their reduction efficiencies compared to the pre-MARPOL 2000 conditions
% emissions reduction (-) / increase (+) per vessel Measure SO2 NOX PM VOC
Basic internal engine modifications (IEM) for 2-stroke slow speed only
0% -20% 0% 0%
Advanced internal engine modifications 0% -30% 0% 0% Direct water injection 0% -50% 0% 0% Humid air motors 0% -70% 0% 0% Exhaust gas recirculation 1 -93% -35% >-63% 2 ± 3 Selective catalytic reduction (2.7% residual oil) 0% -90% 0% 0% Sea water scrubbing -75% 0% -25% 4 ± Fuel switching 2.7->1.5% S residual oil fuel -44% ± -18% ± Fuel switching 2.7->0.5% S residual oil fuel -81% ± -20% 5 ± Low S marine diesel 0.5->0.1 % S -80% ± ± ± 1 Assumed switch from 2.7 percent sulphur RO to MD for technical reasons. 2 US EPA 2003 outlines that a switch from 2.7 percent sulphur RO to 0.3 percent MD reduces PM by 63 percent.
The PM reduction to 0.1 percent MD will therefore be slightly higher than 63 percent. 3 ± no or not conclusive information available. 4 MES measured sludge production from the Pride of Kent as 0.2 g/kWh and particles suspended in overboard water
as 0.05g/kWh. Based on a PM emission factor of 0.8 g/kWh in the exhaust for the type of auxiliary engine used in MES’s trials, the PM removal rate by the EcoSilencer® can be approximated as around 31 percent. However, since this calculation assumed that all sludge consists of particulates, and that the suspended solids in the scrubber inflow is negligible, the actual removal rate is likely to be lower than 31 percent. A conservative estimate of 25 percent PM reductions was therefore chosen.
5 Conservative figure. It is estimated that PM removal will be more than 18 percent but is likely to be significantly less than the 63 percent (US EPA 2003) reported for a switch to 0.3 percent MD. Switching to a 0.5 percent S distillate fuel (MD) may give PM reductions towards the high end of this emission reduction range.
Table 4.2: Technically viable implementation rates beyond business-as-usual.
Existing vessels New vessels Measure
2010 2015 2020 2010 2015 2020
Basic IEM (slide valves, 2-stroke slow speed only)
33% 33% 33% 0% 0% 0%
Advanced IEM Up to 100%1 Up to 100% Up to 100% 100% 100% 100% Direct water injection >99% >99% >99% >99% >99% >99% Humid air motors 100% 100% 100% 100% 100% 100% Exhaust gas recirculation 100% 100% 100% 100% 100% 100% Selective catalytic reduction 99% 99% 99% 99% 99% 99% Sea water scrubbing 100% 100% 100% 100% 100% 100%
1 Scope for retrofitting advanced IEM must be further investigated. Retrofitting of the advanced IEM studied in this report may not be applicable to all engine types, and needs to be analysed on a case by case basis.

19
Table 4.3: Technological emission control measures and costs
Technology Annualised capital investment [€/MWh] (for an average ship)1
Average operating and maintenance costs
[€/MWh]1
Average cost effectiveness
[€/t NOx (or SO2 for SWS)2]
Basic IEM (slide valves, 2-stroke slow speed only) 0.03 0.0 9 Advanced IEM 0.2 0.0 40 Direct water injection 0.6 2.1 363 Humid air motors - New build 2.2 0.2 225 Humid air motors – Retrofit 2.8 0.2 279 Selective catalytic reduction – Residual oil outside ECA - New build 1.0 6.9 580 Selective catalytic reduction – Residual oil outside ECA – Retrofit 1.7 6.9 631 Selective catalytic reduction – Residual oil inside ECA - New build 1.0 4.9 435 Selective catalytic reduction – Residual oil inside ECA – Retrofit 1.7 4.9 487 Selective catalytic reduction - Marine distillates – New build 1.0 3.6 506 Selective catalytic reduction - Marine distillates – Retrofit 1.7 3.6 584 Sea water scrubbing - New build (SO2) 2.4 0.5 347 Sea water scrubbing - Retrofit (SO2) 3.9 0.5 531
1 Capital costs (Euro/vessel) and operating costs (€/MWh) for small, medium and large vessels are taken from Entec 2005c,d. A weighted value was derived for an average vessel based on the proportion of total installed engine capacity.
2 Cost effectiveness for engines using marine distillates assumes that the raw gas (unabated) emission factors are 33 percent lower than for engines fuelled with residual oil.
Notes: – The estimates of cost-effectiveness for these measures are subject to 30–40 percent uncertainty range compared to
the best estimate figures that are quoted, as reported in Entec, 2005c – Calculated with a discount rate of four percent.

20
Table 4.4: Costs for low sulphur fuels (switching from 2.7 percent sulphur content)
Sulphur content
Scenario Price premium [€/ton]2
€/t SO2 abated1 Removal efficiency per
vessel 1.5% MARPOL (for SECAs) 9 360 44% 1.5%
EU Directive (for SECAs & all ferries operating from and to an EU port)
14
581
44%
1.5% %S all residual marine fuel 19 783 44% 0.5% %S all residual marine fuel 39 879 81% 0.2%
%S MD (Switching from RO to MD)
110
2200
93%
0.1%
%S MD (Switching from RO to MD)
130
2500
96%
1 The estimates of cost-effectiveness for this measure are considered to be subject to an approximate 50 percent uncertainty range.
2 Data for switching to 1.5 percent and 0.5 percent have been derived from CONCAWE, 2006. Data are for the “Complying with S limits while meeting the demand” case. Values adjusted for four percent discount rate and 20 year economic life. CONCAWE warns that heavy investments necessary to desulphurize residual oil down to 0.5 percent S might cause problems with availability of that fuel because European refineries might decide to change their profile and produce higher market value middle distillates instead of residual oil. Availability constraints have not been considered in this report.
4.3 Emission control scenarios Based on information described in Sections 4.1 and 4.2 and after discussions with representatives of the European Commission, DG Environment, alternative emission control scenarios for shipping have been prepared by IIASA. Sections 4.4. and 4.5 of this report present results for the year 2020. Emissions and control costs for interim years (2005 to 2015) are presented in appendices. The scenarios feature combinations of emission and fuel standards for different ship categories and sea regions/zones. The analyzed scenarios are characterized in Table 4.5.
The analysis starts with the “Baseline” scenario, which outlines the effects of “Current legislation” on emissions from shipping. At the other end the “Maximum technically feasible reductions” (MTFR) scenario quantifies emissions, environmental effects and costs of implementing the best available control technology on international shipping. To explore the range between these two extreme benchmark cases, several scenarios with different ambition levels have been analyzed. In addition, the study analyzes cost-efficiency of some of these scenarios in achieving air quality targets defined by the Thematic Strategy (CEC, 2005) – compare Section 7.

21
Table 4.5: Legislation considered in the emission scenarios for international shipping Pollutant Measures
Baseline SO2 Sulphur content as in the EU Marine Fuel Directive (OJ L 191/59, 2005): 1.5 percent S in
residual oil for all ships in SECA (North Sea and Baltic Sea); 1.5 percent S fuel all passenger ships in other sea regions surrounding the European Union; 0.1 percent S fuel at berth in ports
NOx MARPOL NOx standards for ships built since 2000
Ambition level 1 – EU ships SO2 As in the baseline NOx Slide valve retrofit on all slow-speed engines pre-2000 1 Internal engine modifications for all new engines post-2010
Ambition level 2 – EU ships SO2 0.5 percent S in residual oil or scrubbing equivalent (2g SO2/kWh) in SECA, and for
passenger vessels everywhere 2 NOx Slide valve retrofit on all slow-speed engines pre-2000 Humid air motors for all new engines post-2010
Ambition level 1 – all ships SO2 As in the baseline NOx Slide valve retrofit on all slow-speed engines pre-2000 Internal engine modifications for all new engines post-2010
Ambition level 2 – all ships SO2 0.5 percent S in residual oil or scrubbing equivalent (2g SO2/kWh) in SECA, and for
passenger vessels everywhere. Cargo vessels as in the baseline NOx Slide valve retrofit on all slow-speed engines pre-2000 Humid air motors for all new engines post-2010
Ambition level 2 – all ships plus sulphur measures in 12-mile zones SO2 0.5 percent S in residual oil or scrubbing equivalent in SECA, and for passenger vessels
everywhere. 1.5 percent S fuel for cargo vessels within the 12-mile zone in other sea regions NOx Slide valve retrofit on all slow-speed engines pre-2000 Humid Air Motors for all new engines post-2010
Ambition level 3 – all ships SO2 Passenger and cargo ships:
SECA – 1.0 percent S in residual oil from 2010, 0.5 percent or scrubbing equivalent from 2015. Other sea regions - as in the baseline but 0.5 percent or scrubbing equivalent from 2020
NOx Pre-2010 vessels: 15 percent reduction above baseline level through available retrofit measures. Post-2010 vessels: 50 percent reduction above baseline level.
Ambition level 4 – all ships SO2 As ambition level 3 NOx Pre-2010 vessels: 15 percent reduction above baseline level through available retrofit measures.
Post-2010 vessels: Selective catalytic reduction (SCR) technology
Maximum technically feasible reduction SO2 0.5 percent S fuel for all ships in all EU seas, 0.1 percent at berth. NOx SCR on all ships (retrofit & new build). 1 Later engines already have these installed. 2 Penetration rate of seawater scrubbing was limited in all scenarios to 25 percent. This is due to uncertainties
regarding the pace of implementation of that technology. Thus in all scenarios with stringent sulphur controls remaining ships (75 percent of total) use 0.5 percent residual fuel oil.
22
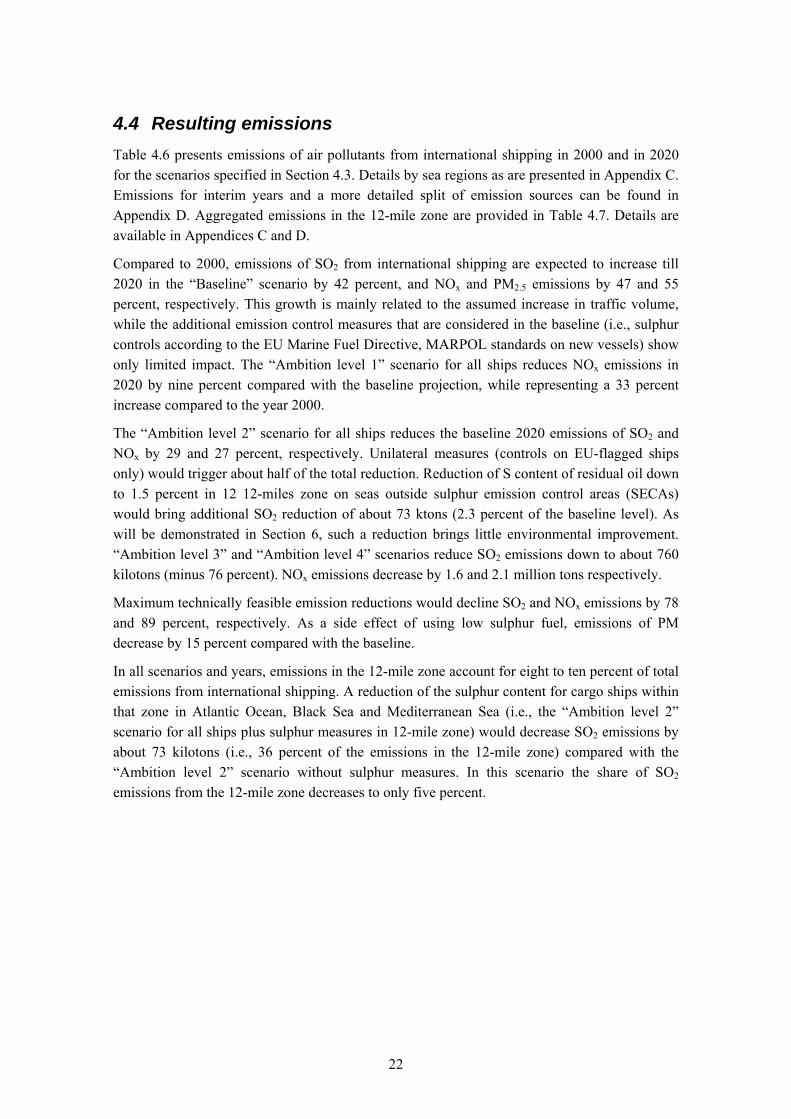
4.4 Resulting emissions Table 4.6 presents emissions of air pollutants from international shipping in 2000 and in 2020 for the scenarios specified in Section 4.3. Details by sea regions as are presented in Appendix C. Emissions for interim years and a more detailed split of emission sources can be found in Appendix D. Aggregated emissions in the 12-mile zone are provided in Table 4.7. Details are available in Appendices C and D.
Compared to 2000, emissions of SO2 from international shipping are expected to increase till 2020 in the “Baseline” scenario by 42 percent, and NOx and PM2.5 emissions by 47 and 55 percent, respectively. This growth is mainly related to the assumed increase in traffic volume, while the additional emission control measures that are considered in the baseline (i.e., sulphur controls according to the EU Marine Fuel Directive, MARPOL standards on new vessels) show only limited impact. The “Ambition level 1” scenario for all ships reduces NOx emissions in 2020 by nine percent compared with the baseline projection, while representing a 33 percent increase compared to the year 2000.
The “Ambition level 2” scenario for all ships reduces the baseline 2020 emissions of SO2 and NOx by 29 and 27 percent, respectively. Unilateral measures (controls on EU-flagged ships only) would trigger about half of the total reduction. Reduction of S content of residual oil down to 1.5 percent in 12 12-miles zone on seas outside sulphur emission control areas (SECAs) would bring additional SO2 reduction of about 73 ktons (2.3 percent of the baseline level). As will be demonstrated in Section 6, such a reduction brings little environmental improvement. “Ambition level 3” and “Ambition level 4” scenarios reduce SO2 emissions down to about 760 kilotons (minus 76 percent). NOx emissions decrease by 1.6 and 2.1 million tons respectively.
Maximum technically feasible emission reductions would decline SO2 and NOx emissions by 78 and 89 percent, respectively. As a side effect of using low sulphur fuel, emissions of PM
decrease by 15 percent compared with the baseline.
In all scenarios and years, emissions in the 12-mile zone account for eight to ten percent of total emissions from international shipping. A reduction of the sulphur content for cargo ships within that zone in Atlantic Ocean, Black Sea and Mediterranean Sea (i.e., the “Ambition level 2” scenario for all ships plus sulphur measures in 12-mile zone) would decrease SO2 emissions by about 73 kilotons (i.e., 36 percent of the emissions in the 12-mile zone) compared with the “Ambition level 2” scenario without sulphur measures. In this scenario the share of SO2 emissions from the 12-mile zone decreases to only five percent.

23
Tabl
e 4.
6: T
otal
em
issi
ons o
f air
pollu
tant
s fro
m in
tern
atio
nal s
hipp
ing
in 2
000
and
in 2
020
in a
ll se
a re
gion
s [ki
loto
ns]
2020
- a
mbi
tion
leve
l
Po
lluta
nt
Ves
sel
type
20
00
Bas
elin
e Le
vel 1
EU
sh
ips
Leve
l 2 E
U
ship
s Le
vel 1
all
ship
s Le
vel 2
all
ship
s Le
vel 2
all
+ S
mea
s. in
12
mile
s zon
e
Leve
l 3 a
ll sh
ips
Leve
l 4 a
ll sh
ips
Max
. tec
hn.
feas
ible
re
duct
ion
Fe
rry
85.3
10
1.7
101.
7 48
.5
101.
7 37
.3
37.3
37
.3
37.3
34
.3
SO2
Car
go
2164
.8
3084
.1
3084
.1
2913
.8
3084
.1
2729
.4
2656
.6
721.
0 72
1.0
663.
9
Tota
l 22
50.1
31
85.8
31
85.8
29
62.2
31
85.8
27
66.6
26
93.9
75
8.2
758.
2 69
8.2
Fe
rry
123.
8 24
6.4
227.
9 19
2.6
224.
0 18
1.2
181.
2 16
7.9
137.
8 27
.0
NO
x C
argo
31
70.9
45
82.0
44
01.8
40
48.8
41
58.9
33
30.1
33
30.1
30
43.9
25
94.0
52
3.2
To
tal
3294
.7
4828
.4
4629
.7
4241
.4
4382
.9
3511
.3
3511
.3
3211
.8
2731
.8
550.
2
Ferr
y 9.
6 17
.0
17.0
16
.7
17.0
16
.6
16.6
16
.6
16.6
16
.6
PM2.
5 C
argo
24
4.5
379.
4 37
9.4
378.
4 37
9.4
377.
2 37
3.9
320.
9 32
0.9
320.
9
Tota
l 25
4.2
396.
4 39
6.4
395.
0 39
6.4
393.
8 39
0.5
337.
5 33
7.5
337.
5 Ta
ble
4.7:
Em
issi
ons o
f air
pollu
tant
s fro
m in
tern
atio
nal s
hipp
ing
in th
e 12
-mile
zon
es, a
ll se
a re
gion
s [ki
loto
ns]
2020
- a
mbi
tion
leve
l
Po
lluta
nt
Ves
sel
type
20
00
Bas
elin
e Le
vel 1
EU
sh
ips
Leve
l 2 E
U
ship
s Le
vel 1
all
ship
s Le
vel 2
all
ship
s Le
vel 2
all
+ S
mea
s. in
12
mile
s zon
e
Leve
l 3 a
ll sh
ips
Leve
l 4 a
ll sh
ips
Max
. tec
hn.
feas
ible
re
duct
ion
Fe
rry
12.4
14
.7
14.7
6.
6 14
.7
5.4
5.4
5.4
5.4
5.0
SO2
Car
go
203.
8 25
7.9
257.
9 23
0.0
257.
9 19
8.9
126.
1 68
.0
68.0
62
.6
To
tal
216.
1 27
2.6
272.
6 23
6.6
272.
6 20
4.3
131.
5 73
.4
73.4
67
.6
Fe
rry
18.0
35
.8
33.0
27
.6
32.6
26
.4
26.4
24
.4
20.1
3.
9 N
Ox
Car
go
302.
3 43
7.3
418.
6 38
2.1
396.
8 31
7.8
317.
8 29
0.6
254.
3 49
.9
To
tal
320.
3 47
3.1
451.
6 40
9.6
429.
4 34
4.2
344.
2 31
5.0
274.
4 53
.8
Fe
rry
1.4
2.5
2.5
2.4
2.5
2.4
2.4
2.4
2.4
2.4
PM2.
5 C
argo
23
.1
34.3
34
.3
34.1
34
.3
33.9
30
.6
30.3
30
.3
30.3
Tota
l 24
.5
36.8
36
.8
36.6
36
.8
36.4
33
.1
32.7
32
.7
32.7
24
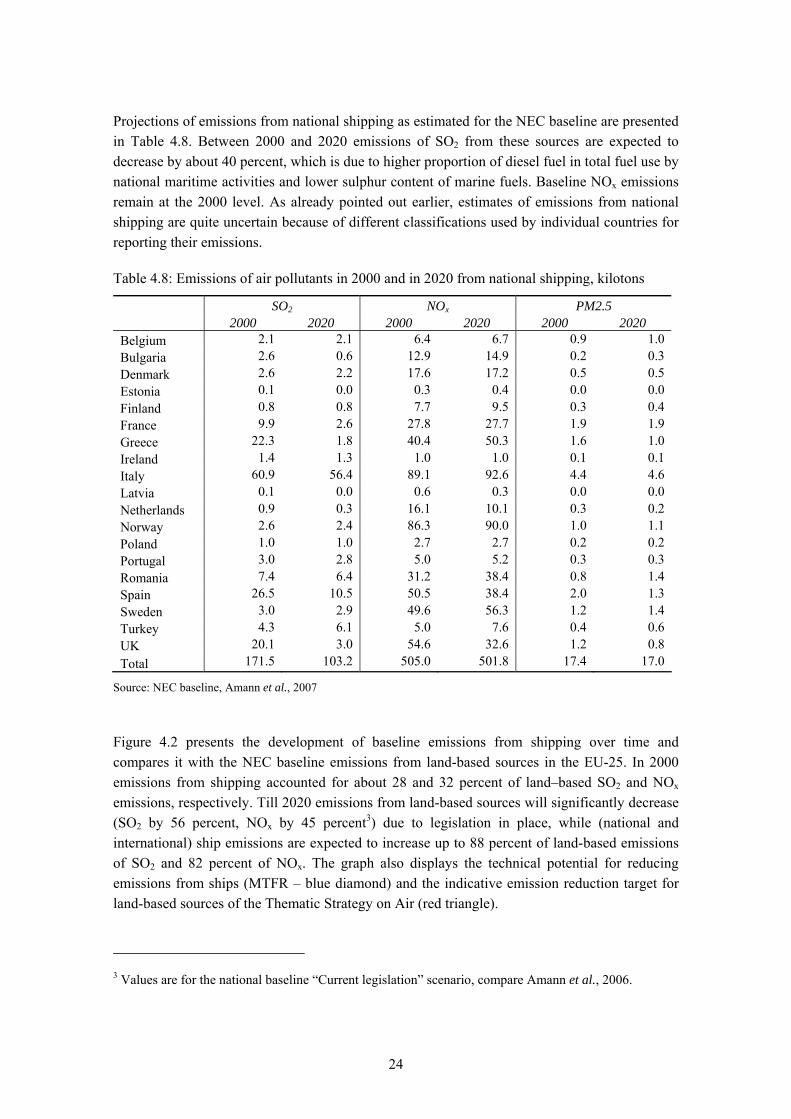
Projections of emissions from national shipping as estimated for the NEC baseline are presented in Table 4.8. Between 2000 and 2020 emissions of SO2 from these sources are expected to decrease by about 40 percent, which is due to higher proportion of diesel fuel in total fuel use by national maritime activities and lower sulphur content of marine fuels. Baseline NOx emissions remain at the 2000 level. As already pointed out earlier, estimates of emissions from national shipping are quite uncertain because of different classifications used by individual countries for reporting their emissions.
Table 4.8: Emissions of air pollutants in 2000 and in 2020 from national shipping, kilotons
SO2 NOx PM2.5 2000 2020 2000 2020 2000 2020 Belgium 2.1 2.1 6.4 6.7 0.9 1.0 Bulgaria 2.6 0.6 12.9 14.9 0.2 0.3 Denmark 2.6 2.2 17.6 17.2 0.5 0.5 Estonia 0.1 0.0 0.3 0.4 0.0 0.0 Finland 0.8 0.8 7.7 9.5 0.3 0.4 France 9.9 2.6 27.8 27.7 1.9 1.9 Greece 22.3 1.8 40.4 50.3 1.6 1.0 Ireland 1.4 1.3 1.0 1.0 0.1 0.1 Italy 60.9 56.4 89.1 92.6 4.4 4.6 Latvia 0.1 0.0 0.6 0.3 0.0 0.0 Netherlands 0.9 0.3 16.1 10.1 0.3 0.2 Norway 2.6 2.4 86.3 90.0 1.0 1.1 Poland 1.0 1.0 2.7 2.7 0.2 0.2 Portugal 3.0 2.8 5.0 5.2 0.3 0.3 Romania 7.4 6.4 31.2 38.4 0.8 1.4 Spain 26.5 10.5 50.5 38.4 2.0 1.3 Sweden 3.0 2.9 49.6 56.3 1.2 1.4 Turkey 4.3 6.1 5.0 7.6 0.4 0.6 UK 20.1 3.0 54.6 32.6 1.2 0.8 Total 171.5 103.2 505.0 501.8 17.4 17.0
Source: NEC baseline, Amann et al., 2007
Figure 4.2 presents the development of baseline emissions from shipping over time and compares it with the NEC baseline emissions from land-based sources in the EU-25. In 2000 emissions from shipping accounted for about 28 and 32 percent of land–based SO2 and NOx emissions, respectively. Till 2020 emissions from land-based sources will significantly decrease (SO2 by 56 percent, NOx by 45 percent3) due to legislation in place, while (national and international) ship emissions are expected to increase up to 88 percent of land-based emissions of SO2 and 82 percent of NOx. The graph also displays the technical potential for reducing emissions from ships (MTFR – blue diamond) and the indicative emission reduction target for land-based sources of the Thematic Strategy on Air (red triangle).
3 Values are for the national baseline “Current legislation” scenario, compare Amann et al., 2006.

25
0
2
4
6
8
10
12
2000 2005 2010 2015 2020
milli
on to
ns N
Ox
0
2
4
6
8
10
2000 2005 2010 2015 2020
mill
ion
tons
SO
2
Land-based sources Target of Thematic StrategyInternational shipping - baseline International shipping - Max. Feas. Red. (MTFR)National shipping - baseline
Figure 4.2: Emissions of sulphur dioxide (left panel) and nitrogen oxides (right panel) from shipping (baseline scenario) compared with the emissions from land-based sources in the EU25, million tons.
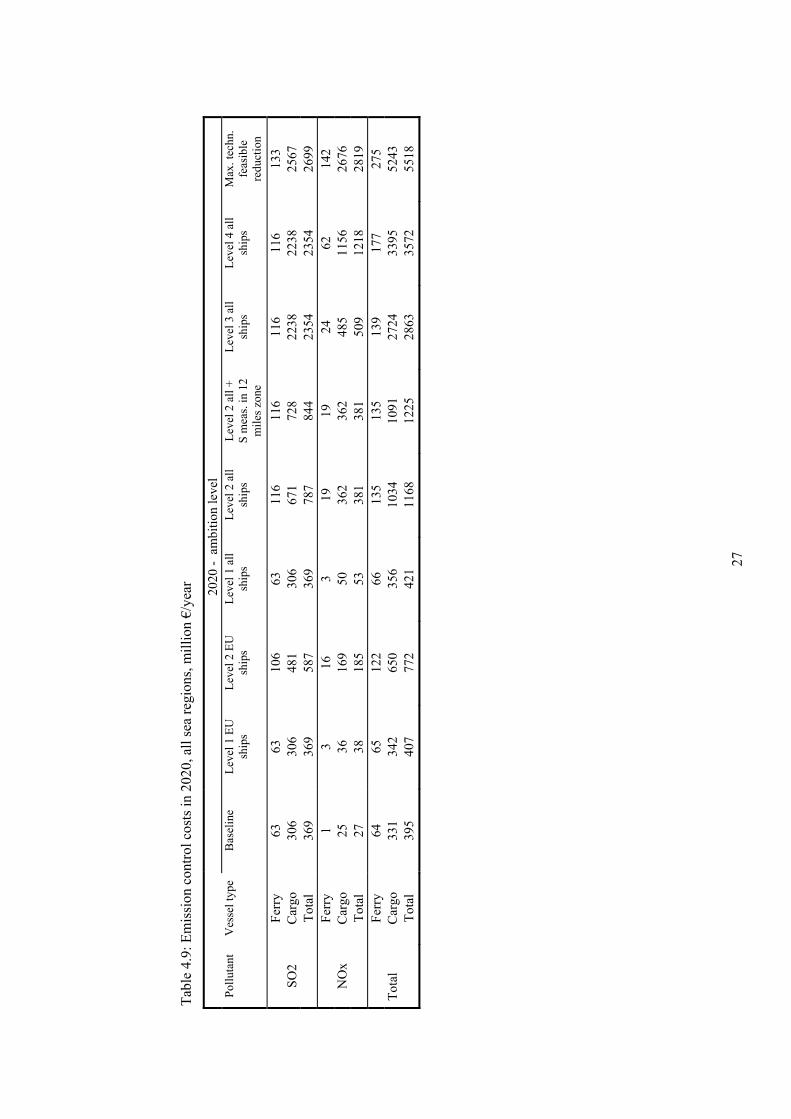
4.5 Emission control costs Table 4.9 presents the costs of the various emission scenarios for all sea regions. Details can be found in the appendices. Compared with the “Baseline” case, the “Ambition level 1” scenarios cause an increase in costs of less than 30 million €/year. Costs (on top of the baseline costs) of the “Ambition level 2” scenarios range from about 380 million €/year (for the EU-vessels only case) to 830 million €/yr (for the “all ships with sulphur measures in the 12 miles zone” case). Since “Ambition level 3” and “Ambition level 4” scenarios assume adoption of more stringent options to reduce sulphur and nitrogen oxides, their incremental costs (compared with the Baseline) are higher – 2.5 and 3.2 billion €/a respectively. In the “Maximum technically feasible reduction” (MTFR) scenario costs increase to 5.5 billion €/yr (5.1 billion €/a above the baseline). It needs to be stressed that the MTFR scenario assumes sulphur reduction through the use of low sulphur residual oil. If seawater scrubbing were applied on all ships instead of using fuel with 0.5 percent S content, costs of sulphur control could be halved, although SO2
emissions were reduced by 72 percent instead of 79 percent compared to the baseline case.
Figure 4.3 and Figure 4.4 compare marginal costs of reducing emissions from shipping with the marginal costs of the sectoral measures at the land-based sources in the EU-25 that have been proposed in the Thematic Strategy on Air Pollution. The analysis is based on the results of the CAFE project (Amann et al., 2005). To achieve the environmental targets of the Thematic Strategy, SO2 and NOx emissions need to be reduced by 1.1 and 0.85 million tons below the CAFE baseline projection, respectively. In a cost-optimal solution, these reductions involve

26
sectoral measures with marginal costs ranging from a couple of hundreds Euro per ton (of SO2 or NOx) to more than five thousand Euro per ton, depending on the country. Unit costs of SO2 control for shipping range between 450 and 550 €/t for seawater scrubbing and 800 to 900 €/t for low sulphur residual oil. However, the marginal cost of a step from seawater scrubbing for newer vessels and 1.5 percent S for old (pre-2000) vessels to 0.5 percent residual oil is higher than 3000 €/t. For NOx, marginal costs range from less than 40 €/t for internal engine modifications, over approximately 500 €/t for humid air motors up to 1200 to 1800 €/t /ton for SCR on new ships, depending on sulphur control policies in a given sea region. Costs of retrofitting existing ships with SCR are typically less than 10 percent higher than the costs for new built vessels.
The cost-efficiency of a specific measure depends heavily on the spatial proximity of the emission source to the environmental receptor. Thus, the marginal abatement costs need to be compared in relation to the environmental impact of the source, taking into account atmospheric transport and dispersion processes. Effects of reducing emissions from shipping on cost-efficient achievement of environmental targets from the Thematic Strategy are discussed in Section 7.
27
Tabl
e 4.
9: E
mis
sion
con
trol c
osts
in 2
020,
all
sea
regi
ons,
mill
ion
€/ye
ar
20
20 -
am
bitio
n le
vel
Pollu
tant
V
esse
l typ
e B
asel
ine
Leve
l 1 E
U
ship
s Le
vel 2
EU
sh
ips
Leve
l 1 a
ll sh
ips
Leve
l 2 a
ll sh
ips
Leve
l 2 a
ll +
S m
eas.
in 1
2 m
iles z
one
Leve
l 3 a
ll sh
ips
Leve
l 4 a
ll sh
ips
Max
. tec
hn.
feas
ible
re
duct
ion
Fe
rry
63
63
106
63
116
116
116
116
133
SO2
Car
go
306
306
481
306
671
728
2238
22
38
2567
Tota
l 36
9 36
9 58
7 36
9 78
7 84
4 23
54
2354
26
99
Fe
rry
1 3
16
3 19
19
24
62
14
2 N
Ox
Car
go
25
36
169
50
362
362
485
1156
26
76
To
tal
27
38
185
53
381
381
509
1218
28
19
Fe
rry
64
65
122
66
135
135
139
177
275
Tota
l C
argo
33
1 34
2 65
0 35
6 10
34
1091
27
24
3395
52
43
To
tal
395
407
772
421
1168
12
25
2863
35
72
5518

28
0
1000
2000
3000
4000
5000
0 500 1000 1500 2000 2500 3000 3500
Emission removal potential, ktons SO2
Mar
gina
l cos
t, €/
t SO
2
Measures proposed in the Themaric Strategy for land based sourcesAvailable measures for international shipping
Seawater scrubbing post-2010
Seawater scrubbing2000 -2010
0.5 % S Residual oil
1.5 % S Residual oilpre-2000
Figure 4.3: SO2 reductions and marginal costs of the measures proposed in the Thematic Strategy for land-based sources and for the measures identified in this report for international shipping in the year 2020. While this graph illustrates the potentials and costs, the cost-effectiveness of emission controls can only be judged from a full integrated analysis including atmospheric dispersion characteristics of the emissions and their environmental impacts.
0
1000
2000
3000
4000
5000
0 500 1000 1500 2000 2500 3000 3500 4000 4500Emission removal potential, ktons NOx
Mar
gina
l cos
t, €/
t NO
x
Measures proposed in the Thematic Strategy for land-based sourcesAvailable measures for international shipping
Internal engine modif.
Humid air motor new
SCR inside ECA new retrofit
Humid air motor retrofit
SCR outside ECA new retrofit
Figure 4.4: NOx reductions and marginal costs of the measures proposed in the Thematic Strategy for land-based sources and for the measures identified in this report for international shipping in the year 2020. While this graph illustrates the potentials and costs, the cost-effectiveness of emission controls can only be judged from a full integrated analysis including atmospheric dispersion characteristics of the emissions and their environmental impacts.

29
5 Atmospheric dispersion of ship emissions
5.1 Model description The EMEP unified model has been used for this study to compute the atmospheric dispersion of ship emissions. The EMEP model is a multi-layer atmospheric dispersion model for simulating the long-range transport of air pollution over several years. The EMEP model has 20 vertical layers in σ-coordinates. The present version has been run on the 50*50 km2 horizontal resolution in the EMEP polar stereographic grid. The model is described in Simpson et al. (2003) with updates in Fagerli et al. (2004). A more condensed model description is also available in Jonson et al. (2006). This version of the model uses meteorological data from a dedicated version of the operational HIRLAM model (High Resolution Limited Area Model) maintained and verified at MET.NO.
The present version of the EMEP unified model includes 70 species and approximately 140 chemical reactions. The model parameterisation of dry deposition enables the calculation of ozone fluxes to vegetation. The model use flexible boundary conditions provided either by observations or modelled results from global air pollution models. In these model runs lateral boundary concentrations are based on measurements as described in Simpson et al. (2003) and Fagerli et al. (2004). For ozone an additional 4.5 ppb of ozone is added to the lateral boundary concentrations as tropospheric ozone levels are expected to increase in the northern hemisphere. The EMEP Unified model has been extensively reviewed (UNECE, 2004) and evaluated against measurements (EMEP, 2005, 2006; Jonson et al, 2006).
The emission inventory developed by this study is fully harmonized with the official EMEP grid system, i.e., the model domain used in the calculations in this project matches exactly the official EMEP domain. Emissions from national shipping are not accounted under international activities, since they are included in the emission inventories reported by the individual parties to the Convention on Long Range Transport to UNECE.
5.2 Source receptor calculations for ship traffic
To enable an integrated assessment of the cost-effectiveness of emission control measures for ships, the EMEP Eulerian atmospheric dispersion model has been used to derive source-receptor relationships that describe the atmospheric dispersion of ship emissions. For this purpose, a number of model calculations have been conducted in which ship emissions from the various categories have been sequentially permutated. The resulting changes in air quality indicators (concentration and deposition over the entire model domain), together with the causative changes in emissions, allowed the construction of reduced-form source-receptor relationships. Next, these relationships were used for the cost-effectiveness analysis in the RAINS/GAINS model.
The model calculations have been carried out for the chemical regime of year 2020 with emissions from international ship traffic are analysed separately for the following categories:

30
• International shipping emissions within the 12-mile zone
• International shipping from EU flags
• International shipping from Non EU flags
• Emissions from international ferries in the Mediterranean Sea.
Computations have been carried out for each class by reducing the contributions from the individual sources by 15 percent for each of the five sea areas (Baltic Sea, Black Sea, Mediterranean Sea, North Sea, and Remaining North-East Atlantic Ocean). Three groups of emissions have been considered (SO2, NOx + PM, and VOC + CO), and conditions of five meteorological years have been analysed (1996, 1997, 1998, 2000 and 2003). In total, 240 source-receptor model runs have been made. Based on these calculations IIASA has fully integrated the source-receptor relationships for shipping with those for land-based sources. These relations were used in the analysis described in Sections 6 and 7 of this report.
The current analysis does not include emissions from smaller vessels (below 500 GRT). While this is not expected to cause major distortions of the overall dispersion pattern of ship emissions, this simplification might cause certain inaccuracies for the emissions with the 12-mile zones, where most of the smaller ships are likely to operate. However, to judge the overall robustness of the current approach, it is important to remember that, for reasons of consistency with the Europe-wide assessment of land-based and marine emissions, the atmospheric dispersions calculations employ the 50x50 km2 regional scale version of the EMEP model. Obviously, since the 12-mile zone is actually much smaller, such a resolution is too coarse to determine the actual impact of these sources in coastal areas in great spatial detail, so that this approach can in any case only deliver an initial estimate. However, the numerical diffusion effects from such a simplified approach are to a certain extend compensated by the underestimation of emissions in the 12-mile zones that has been discussed in the preceding chapter. In summary, the overall results could therefore be considered as a valid indication of the order of magnitude of the actual impact of the contribution from the 12-mile zone shipping emissions.

31
5.3 Model results
The EMEP model has been run for the base year 2000 and for 240 emission control cases perturbating the expected baseline emission for the year 2020. Calculations included meteorological conditions of five years (1996, 1997, 1998, 2000 and 2003). As examples for the model output, Sections 5.3.1 and 5.3.2 present the spatial distribution of selected indicators for ground-level ozone and sulphur deposition calculated with 5-years average meteorological conditions.
5.3.1 Ground-level ozone
Figure 5.1 demonstrates the spatial distribution of the SOMO35 indicator across Europe for the baseline situation in 2020. Figure 5.2 to Figure 5.6 display the contributions made by ships with EU flags in the various sea regions to the SOMO35 levels that are anticipated for the 2020 baseline scenario. It should be mentioned that emissions from EU ships constitute about half of total ship emissions. Similar calculations have been carried out for ferries, and for ships in the 12-mile zones.
Figure 5.1: The SOMO35 indicator for health impacts of ozone for the year 2020 in ppb.days

32
Figure 5.2: Percentage contribution to the SOMO35 ozone health indicator from NOx emissions from EU flagged international shipping in the Baltic Sea for the baseline emissions of the year 2020
Figure 5.3: Percentage contribution to the SOMO35 ozone health indicator from NOx emissions from EU flagged international shipping in the North Sea for the baseline emissions of the year 2020

33
Figure 5.4: Percentage contribution to the SOMO35 ozone health indicator from NOx emissions from EU flagged international shipping in the Atlantic Ocean for the baseline emissions of the year 2020
Figure 5.5: Percentage contribution to the SOMO35 ozone health indicator from NOx emissions from EU flagged international shipping the Mediterranean Sea for the baseline emissions of the year 2020

34
Figure 5.6: Percentage contribution to the SOMO35 ozone health indicator from NOx emissions from EU flagged international shipping the Black Sea for the baseline emissions of the year 2020
5.3.2 Acid deposition
Figure 5.7 to Figure 5.13 display the contributions made by ships with EU flags in the various sea regions to the dry sulphur deposition that are anticipated for the 2020 baseline scenario. Emissions from EU ships constitute about half of total ship emissions. Similar calculations have been carried out for ferries, for ships in the 12-mile zones, for wet deposition of sulphur and for nitrogen deposition. These model results provide the basis for the development of source-receptor relationships for the cost-effectiveness analysis with the RAINS/GAINS model.

35
Figure 5.7: Dry deposition of sulphur from EU flagged international shipping (in mg Sm-2) for the baseline emissions in 2020
Figure 5.8: Percentage contribution made by EU flagged international shipping in the Baltic Sea to the dry deposition of sulphur (in mg Sm-2) for the baseline emissions in 2020
36
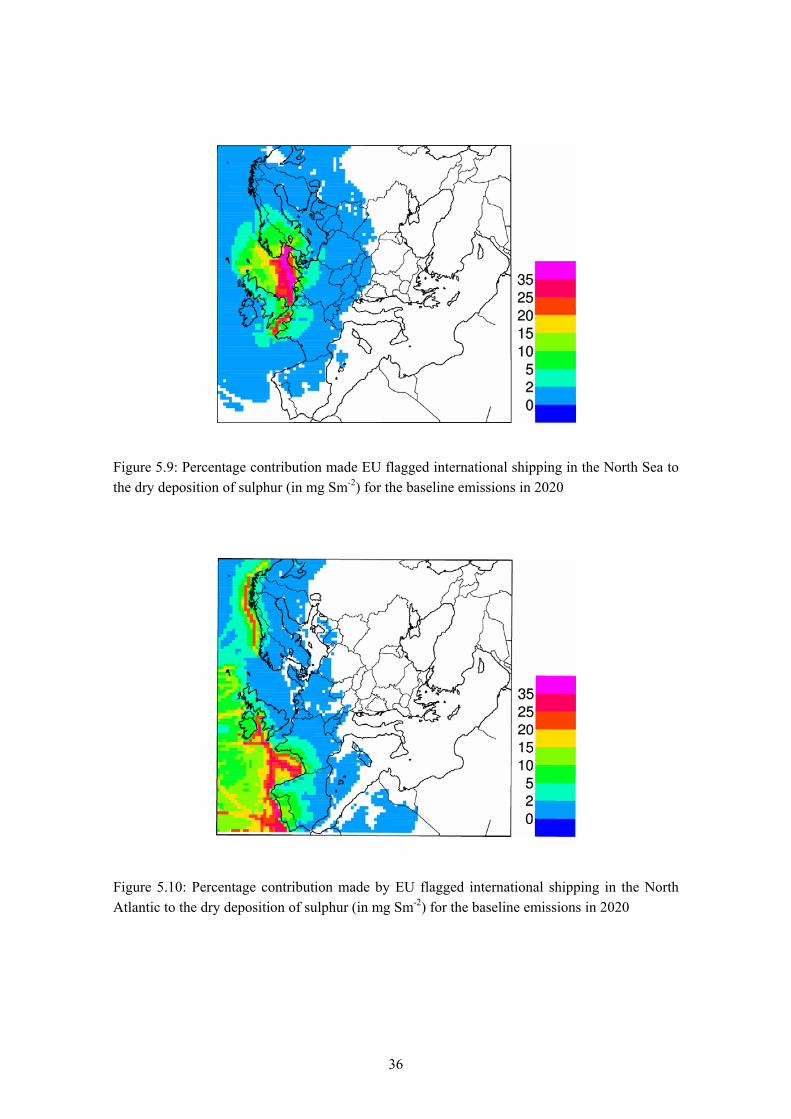
Figure 5.9: Percentage contribution made EU flagged international shipping in the North Sea to the dry deposition of sulphur (in mg Sm-2) for the baseline emissions in 2020
Figure 5.10: Percentage contribution made by EU flagged international shipping in the North Atlantic to the dry deposition of sulphur (in mg Sm-2) for the baseline emissions in 2020

37
Figure 5.11: Percentage contribution made by EU flagged international shipping in the Mediterranean Sea to the dry deposition of sulphur (in mg Sm-2) for the baseline emissions in 2020
Figure 5.12: Percentage contribution made by EU flagged international shipping in the Black Sea to the dry deposition of sulphur (in mg Sm-2) for the baseline emissions in 2020

38
Analysis suggests that, at present, emissions from ships are responsible for 10 to 20 percent of sulphur deposition in coastal areas. Until 2020 their contribution is expected to increase to more than 30 percent in large areas along the coast in Europe. In many coastal areas, ships will be responsible for more than 50 percent of sulphur deposition (Figure 5.13). Emission controls on shipping will bring down the depositions to much lower levels.
Figure 5.13: Percent of sulphur deposition originating from international shipping in 2000 (upper left panel) and for the “Baseline” scenario in 2020 (upper right panel). Lower panels show the situation in 2020 for the “Ambition level 2” and the “Maximum technically feasible reduction” scenarios. Values calculated with average transfer coefficients for five meteorological years (1996, 1997, 1998, 2000 and 2003)

39
6 Health and environmental impacts This section provides an assessment of the health and environmental impacts of the shipping scenarios for the year 2020. The assessment is based on average transfer coefficients calculated for five meteorological years (1996, 1997, 1998, 2000 and 2003). The assessment of ecosystems protection against acidification and eutrophication employs the database on critical loads as approved by the UNECE Working Group on Effects in August 2006 and is consistent with the data set used for the NEC analysis. Impact indicators presented in this section use the “National Baseline Current Legislation” scenario for land-based sources (compare Amann et al., 2007). This scenario includes – for stationary sources – current international and national (if stricter) emission and fuel standards. For transport it includes the effects of the implementation of Euro 5 and 6 emission standards on cars and light-duty trucks but does not take into account Euro VI standards for heavy-duty trucks and buses. All indicators are for the situation when the measures are applied to all vessels, independent of which flag.
6.1 Health impacts of fine particulate matter In this section a loss in statistical life expectancy attributable to anthropogenic emissions of PM2.5 is used as a health impact indicator. The value of that indicator is highly country- and scenario-specific (compare Table 6.1 and Table 6.2). An improvement is expected for the baseline situation between 2000–2020 (decrease of the EU-27 average loss of life expectancy from 8.0 to 5.2 months). Improvements for the “Ambition level 1” scenario are low (0.5 percent of the baseline value for EU27). For the “Ambition level 2” scenario it increases to 3.1 percent. Implementation of low sulphur residual oil (1.5 percent S) in the 12 miles zone in Atlantic Ocean, Mediterranean Sea and in the Black Sea brings little improvement (additional 0.2 percentage points). In the “Ambition level 3” and “Ambition level 4”scenarios the average loss of life expectancy is lower by 6.5 to 6.9 percent with 10 percent or more improvement for Cyprus, Denmark, Greece, Ireland, Italy, Malta, Portugal, Spain, Sweden, and the UK. The “Maximum technically feasible reduction” (MTFR) measures applied to international shipping achieve an overall EU-27 reduction of nine percent compared to the NEC baseline.
Figure 6.1 shows the spatial distribution of the loss life expectancy indicator for the baseline situation in 2020 and the improvements for selected scenarios. For scenarios with stringent controls large improvements (more than 20 percent, with values up to 50 percent for selected grids) are expected along the coastal zones.

40
Table 6.1: Loss in statistical life expectancy attributable to the human exposure to fine particulate matter (PM2.5) originating from anthropogenic emission sources in 2000, 2020 Baseline and maximum technically feasible reduction scenario from shipping (months)
2020
2000 National and
shipping baselines Nat. baseline, max. technically
feasible reduction from shipping Austria 7.77 4.87 4.68 -3.8% Belgium 12.17 8.54 7.76 -9.2% Bulgaria 8.23 4.97 4.74 -4.7% Cyprus 4.39 2.91 2.41 -17.3% Czech Rep. 9.63 6.05 5.84 -3.6% Denmark 6.61 4.63 3.77 -18.6% Estonia 4.82 3.78 3.53 -6.7% Finland 2.94 2.17 2.01 -7.2% France 7.60 4.51 4.06 -10.1% Germany 9.34 6.16 5.68 -7.8% Greece 7.69 4.32 3.84 -11.0% Hungary 11.05 7.17 6.94 -3.2% Ireland 3.81 2.28 1.86 -18.3% Italy 8.11 5.06 4.47 -11.5% Latvia 5.88 4.41 4.17 -5.4% Lithuania 5.68 4.27 3.99 -6.5% Luxembourg 9.15 5.84 5.42 -7.1% Malta 6.15 4.93 3.30 -33.1% Netherlands 11.51 8.31 7.41 -10.8% Poland 10.00 6.81 6.55 -3.9% Portugal 5.79 3.44 2.93 -15.0% Romania 8.86 6.21 5.99 -3.6% Slovakia 9.43 6.23 6.04 -3.0% Slovenia 8.37 5.45 5.12 -5.9% Spain 4.80 2.79 2.28 -18.3% Sweden 3.40 2.48 2.15 -13.2% UK 6.71 4.19 3.63 -13.4% EU-27 8.02 5.18 4.71 -9.0% Croatia 8.49 5.50 5.15 -6.4% Turkey Norway 2.53 1.70 1.54 -9.8% Switzerland 6.17 3.63 3.43 -5.6%

41
Table 6.2: Change in loss in statistical life expectancy attributable to the human exposure to fine particulate matter (PM2.5) originating from anthropogenic emission sources, percentage of 2020 Baseline
2020 - ambition level
Level 1 all ships
Level 2 all ships
Level 2 all + S meas. in
12 miles zone Level 3 all ships
Level 4 all ships
Austria -0.2% -1.4% -1.5% -2.7% -2.8% Belgium -0.7% -4.4% -4.5% -5.6% -6.1% Bulgaria -0.4% -1.4% -1.6% -3.8% -4.0% Cyprus -0.2% -1.4% -2.4% -15.6% -15.9% Czech Rep. -0.3% -1.6% -1.7% -2.3% -2.5% Denmark -1.5% -9.7% -9.8% -11.2% -12.1% Estonia -0.3% -4.7% -4.7% -5.2% -5.3% Finland -0.4% -5.1% -5.1% -5.8% -6.0% France -0.6% -3.4% -3.6% -7.3% -7.7% Germany -0.6% -3.7% -3.7% -4.8% -5.2% Greece -0.2% -1.1% -2.1% -10.5% -10.6% Hungary -0.3% -1.2% -1.2% -2.3% -2.4% Ireland -1.2% -5.2% -5.9% -12.3% -13.3% Italy -0.3% -1.7% -2.1% -9.9% -10.1% Latvia -0.3% -3.3% -3.3% -3.8% -4.0% Lithuania -0.5% -3.6% -3.6% -4.2% -4.5% Luxembourg -0.6% -3.3% -3.3% -4.5% -4.9% Malta 0.0% -1.6% -3.4% -32.4% -32.4% Netherlands -0.8% -5.7% -5.8% -6.9% -7.5% Poland -0.3% -1.9% -2.0% -2.5% -2.7% Portugal -0.2% -1.0% -1.9% -13.9% -14.1% Romania -0.5% -1.4% -1.5% -2.7% -2.8% Slovakia -0.2% -1.3% -1.3% -2.1% -2.2% Slovenia -0.3% -1.5% -1.8% -4.4% -4.7% Spain -0.3% -1.7% -2.4% -16.9% -17.1% Sweden -0.9% -8.3% -8.4% -9.5% -9.9% UK -0.9% -5.7% -5.9% -9.0% -9.6% EU-27 -0.5% -3.1% -3.3% -6.5% -6.9% Croatia -0.2% -1.3% -1.5% -5.3% -5.4% Turkey Norway -0.6% -6.1% -6.2% -7.7% -7.9% Switzerland -0.4% -2.0% -2.1% -4.0% -4.3%

42
Figure 6.1: Loss of life expectancy (months) due to anthropogenic sources of PM2.5 for the “Baseline” scenario in 2020 (upper left panel) and percentage improvement from the baseline for the “Ambition level 2” (upper right panel), “Ambition level 4” (lower left panel) and MTFR scenario of emissions from international shipping (lower right panel)

43
6.2 Premature mortality attributable to ground-level ozone Table 6.3 and Table 6.4 provide estimates of the number of cases of premature deaths attributable to the human exposure to ground-level ozone. This analysis of health impacts suggests that the “Ambition level 2” shipping scenarios achieve a reduction in the number of cases of premature deaths of about 1.9 percent of the estimated value for the NEC baseline scenario for 2020 for the EU-27 as a whole. For “Ambition level 3” and “Ambition level 4” cases the reductions are higher (2.3 and 2.8 percent). Reduction achievable with the MTFR measures is five percent.
Table 6.3: Number of cases of premature deaths attributable to the human exposure to ground-level ozone in 2000, 2020 baseline and maximum technically feasible reduction scenario from shipping.
2020
2000 National and
shipping baselines Nat. baseline, max. technically
feasible reduction from shipping Austria 397 320 308 -3.7% Belgium 320 371 353 -4.9% Bulgaria 482 439 412 -6.1% Cyprus 29 27 25 -6.5% Czech Rep. 514 432 414 -4.2% Denmark 159 163 155 -5.1% Estonia 18 20 18 -8.7% Finland 41 49 44 -9.6% France 2397 2110 1997 -5.3% Germany 3743 3268 3179 -2.7% Greece 567 529 491 -7.2% Hungary 735 598 575 -3.9% Ireland 57 83 77 -7.0% Italy 4179 3620 3394 -6.2% Latvia 46 46 42 -9.3% Lithuania 74 68 62 -8.3% Luxembourg 27 26 25 -5.5% Malta 23 21 20 -6.3% Netherlands 342 364 347 -4.6% Poland 1347 1121 1065 -5.0% Portugal 396 479 447 -6.8% Romania 1061 968 918 -5.1% Slovakia 234 196 187 -4.5% Slovenia 105 85 81 -5.5% Spain 1755 1681 1590 -5.4% Sweden 164 172 161 -6.5% UK 1083 1768 1685 -4.7% EU-27 20295 19025 18071 -5.0%
Croatia 303 253 238 -5.8% Turkey 1544 1707 1528 -10.5% Norway 64 84 81 -4.4% Switzerland 355 274 264 -3.5%

44
Table 6.4: Number of cases of premature deaths attributable to the human exposure to ground-level ozone, percentage change from the baseline scenario.
2020 - ambition level
Level 1 all ships
Level 2 all ships
Level 2 all +S meas. in
12 miles zone Level 3 all ships
Level 4 all ships
Austria -0.5% -1.4% -1.4% -1.7% -2.1% Belgium -0.7% -1.8% -1.8% -2.2% -2.7% Bulgaria -1.1% -2.9% -2.9% -3.3% -3.8% Cyprus -0.8% -2.2% -2.2% -2.6% -3.4% Czech Rep. -0.6% -1.6% -1.6% -1.9% -2.3% Denmark -0.9% -2.4% -2.4% -2.6% -3.1% Estonia -1.3% -3.4% -3.4% -4.0% -4.7% Finland -1.3% -3.7% -3.7% -4.3% -5.1% France -0.7% -2.0% -2.0% -2.3% -2.9% Germany -0.4% -1.1% -1.1% -1.3% -1.6% Greece -1.2% -3.1% -3.1% -3.5% -4.3% Hungary -0.6% -1.6% -1.6% -1.8% -2.2% Ireland -0.9% -2.4% -2.4% -2.9% -3.7% Italy -0.7% -2.3% -2.3% -2.7% -3.4% Latvia -1.3% -3.5% -3.5% -4.1% -4.8% Lithuania -1.1% -3.1% -3.1% -3.6% -4.3% Luxembourg -0.8% -2.2% -2.2% -2.5% -3.1% Malta -0.8% -2.3% -2.3% -2.7% -3.5% Netherlands -0.6% -1.8% -1.8% -2.1% -2.6% Poland -0.7% -1.9% -1.9% -2.3% -2.7% Portugal -0.8% -2.4% -2.4% -2.8% -3.6% Romania -1.0% -2.6% -2.6% -2.8% -3.3% Slovakia -0.6% -1.8% -1.8% -2.1% -2.5% Slovenia -0.7% -2.1% -2.1% -2.4% -3.0% Spain -0.7% -2.0% -2.0% -2.4% -3.0% Sweden -1.1% -2.9% -2.9% -3.3% -3.8% UK -0.6% -1.7% -1.7% -2.0% -2.5% EU-27 -0.7% -1.9% -1.9% -2.3% -2.8%
Croatia -0.7% -2.1% -2.1% -2.5% -3.1% Turkey -1.3% -3.8% -3.8% -4.4% -5.6% Norway -0.8% -2.0% -2.0% -2.2% -2.6% Switzerland -0.5% -1.4% -1.4% -1.6% -2.0%
6.3 Protection of ecosystems against acidification Table 6.5 to Table 6.10 provide estimates of the protection of ecosystems against acidification for forests, semi-natural vegetation, freshwater catchments and all ecosystems, respectively.

45
Whereas in the “Ambition level 1” scenario the improvements are moderate (3.4 percent for forests, 0.9 percent for semi-natural vegetation and 0.3 percent for freshwaters) the “Ambition level 2” scenarios bring an improvement of 14 percent (forests), 6 to 7 percent (semi-natural ecosystems), and 13 to 14 percent (freshwaters). Corresponding values for the MTFR scenario are: 28 percent (forests), 24 percent (semi-natural vegetation) and 24 percent (water). Generally, the relative benefit is seen to be higher in central and northern Europe (compare Figure 6.2).
6.3.1 Forests
Table 6.5: Forest area with acid deposition above critical loads for acidification in 2000, 2020 baseline and maximum technically feasible reduction scenario from shipping, km2.
2020
2000
National and shipping
baselines
Nat. baseline, max. technically feasible reduction
from shipping Austria 373 0 0 Belgium 4591 1651 1181 -28.5% Bulgaria 0 0 0 Cyprus 0 0 0 Czech Rep. 9158 4766 4503 -5.5% Denmark 1200 72 10 -86.1% Estonia 0 0 0 Finland 6115 2682 1732 -35.4% France 19649 11047 6521 -41.0% Germany 62491 32055 28140 -12.2% Greece 943 252 170 -32.5% Hungary 50 0 0 Ireland 1695 640 420 -34.4% Italy 0 0 0 Latvia 538 0 0 Lithuania 13219 9456 8588 -9.2% Luxembourg 272 170 170 0.0% Malta Netherlands 5106 4997 4880 -2.3% Poland 53034 22901 18498 -19.2% Portugal 3345 1044 850 -18.6% Romania 3516 176 160 -9.1% Slovakia 4707 1943 1840 -5.3% Slovenia 647 2 2 0.0% Spain 900 100 75 -25.0% Sweden 58438 20282 5062 -75.0% UK 9424 3588 2375 -33.8% EU-27 259412 117824 85178 -27.7%
Croatia 351 0 0 Turkey

46
Norway 2789 424 123 -71.0% Switzerland 1899 656 595 -9.3% Table 6.6: Forest area with acid deposition above critical loads for acidification, percentage change from 2020 baseline. Calculated using ecosystem-specific deposition with the critical loads database of 2006
2020 - ambition level
Level 1 all ships
Level 2 all ships
Level 2 all +S meas. in
12 miles zone Level 3 all ships
Level 4 all ships
Austria Belgium -5.6% -17.4% -17.4% -19.7% -20.9% Bulgaria Cyprus Czech Rep. -0.9% -2.9% -2.9% -3.7% -3.7% Denmark -19.4% -65.3% -65.3% -68.1% -73.6% Estonia Finland -5.8% -21.9% -21.9% -22.7% -22.7% France -5.8% -11.9% -11.9% -32.4% -32.5% Germany -1.0% -5.7% -5.8% -7.3% -7.9% Greece 0.0% -18.3% -18.3% -32.5% -32.5% Hungary Ireland -1.9% -7.7% -10.0% -25.2% -26.9% Italy Latvia Lithuania -0.1% -3.9% -3.9% -4.4% -4.9% Luxembourg 0.0% 0.0% 0.0% 0.0% 0.0% Malta Netherlands -0.2% -1.4% -1.4% -1.5% -1.6% Poland -2.8% -9.8% -9.8% -12.2% -13.1% Portugal 0.0% -0.7% -0.7% -2.5% -6.9% Romania -5.1% -5.1% -5.1% -8.0% -8.0% Slovakia -0.4% -1.6% -1.7% -3.2% -3.6% Slovenia 0.0% 0.0% 0.0% 0.0% 0.0% Spain 0.0% 0.0% 0.0% -25.0% -25.0% Sweden -9.5% -44.6% -44.7% -50.9% -55.2% UK -3.7% -14.6% -15.1% -20.0% -21.9% EU-27 -3.4% -14.1% -14.2% -18.5% -19.8%
Croatia Turkey Norway -12.0% -41.5% -41.5% -41.5% -71.0% Switzerland 0.0% 0.0% 0.0% 0.0% -2.4%

47
6.3.2 Semi-natural vegetation
Table 6.7: Semi-natural ecosystems with acid deposition above critical loads for acidification in 2000, 2020 baseline and maximum technically feasible reduction scenario from shipping. Calculated using ecosystem-specific deposition with the critical loads database of 2006
2020
2000 National and
shipping baselines Nat. baseline, max. technically
feasible reduction from shipping Belgium 402 186 155 -16.7% France 4037 2507 1987 -20.7% Germany 760 264 188 -28.8% Ireland 297 6 0 -100.0% Netherlands 1098 981 914 -6.8% UK 15251 3873 2701 -30.3% EU-27 21845 7817 5946 -23.9%
Table 6.8: Semi-natural ecosystems with acid deposition above critical loads for acidification, percentage change from 2020 baseline.
2020 - ambition level
Level 1 all ships
Level 2 all ships
Level 2 all +S meas. in
12 miles zone Level 3 all ships
Level 4 all ships
Belgium 0.0% -12.9% -12.9% -13.4% -13.4% France 0.0% 0.0% 0.0% -13.7% -13.7% Germany -1.1% -8.0% -8.0% -16.3% -20.1% Ireland -33.3% -66.7% -66.7% -100.0% -100.0% Netherlands 0.0% -5.0% -5.1% -5.8% -6.0% UK -1.7% -10.4% -12.0% -17.2% -19.3% EU-27 -0.9% -6.4% -7.2% -14.6% -15.8%

48
6.3.3 Freshwater ecosystems
Table 6.9: Freshwater ecosystems with acid deposition above critical loads for acidification in 2020 baseline and maximum technically feasible reduction scenario from shipping. Calculated using grid-average deposition with the critical loads database of 2006. Values in km2.
2020
2000 National and
shipping baselines Nat. baseline, max. technically
feasible reduction from shipping Finland 91 21 17 -19.0% Sweden 36812 20735 15820 -23.7% UK 650 252 199 -21.0% EU-27 37553 21009 16036 -23.7%
Norway 67597 41319 29705 -28.1% Switzerland 131 92 81 -12.0%
Table 6.10: Freshwater ecosystems with acid deposition above critical loads in 2020, percentage change from 2020 baseline
2020 - ambition level
Level 1 all ships
Level 2 all ships
Level 2 all +S meas. in
12 miles zone Level 3 all ships
Level 4 all ships
Finland 0.0% 0.0% 0.0% -9.5% -9.5% Sweden -0.3% -13.5% -14.4% -14.5% -16.1% UK -0.4% -6.7% -7.1% -17.9% -19.0% EU-27 -0.3% -13.4% -14.4% -14.6% -16.2%
Norway -2.1% -14.4% -14.4% -17.8% -19.5% Switzerland 0.0% 0.0% 0.0% -5.4% -5.4%

49
6.3.4 All ecosystems
Figure 6.2: Total ecosystems area with acid deposition above critical loads for acidification in 2020 – “Baseline” case (in km2 per grid – upper left panel) and percentage improvement from the baseline for the “Ambition level 2” (upper right panel), “Ambition level 4” (lower left panel) and MTFR scenarios of emissions from international shipping (lower right panel)
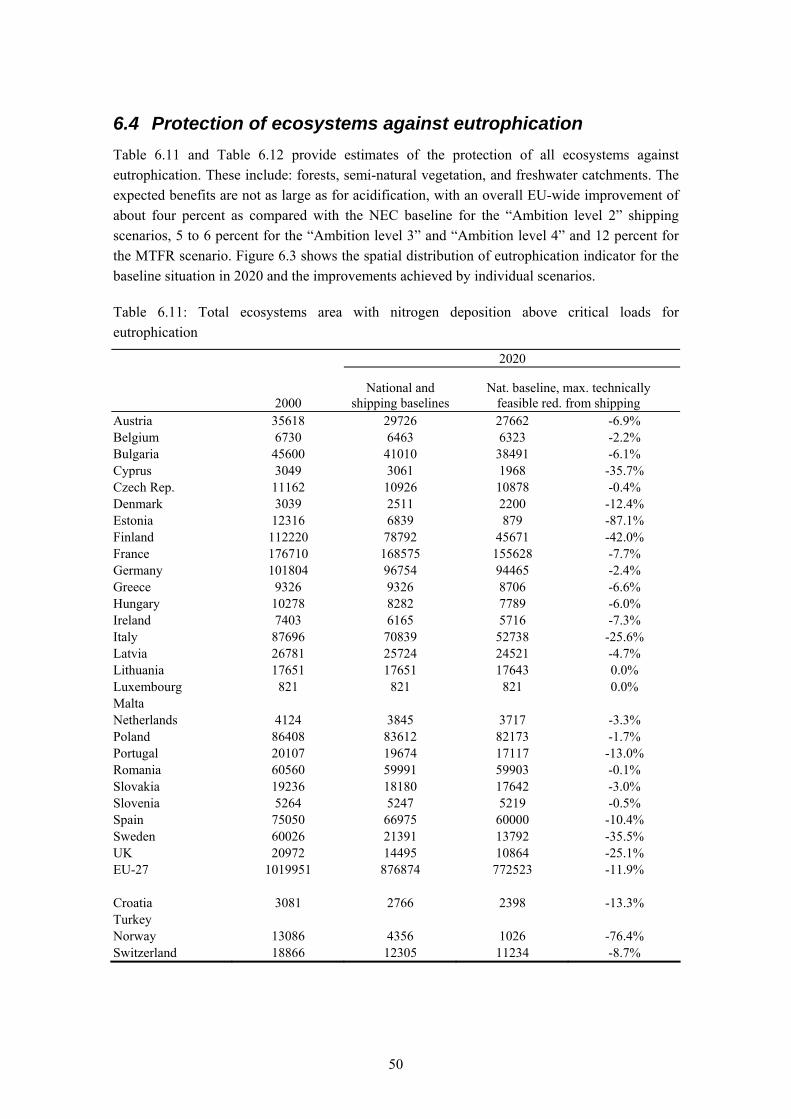
50
6.4 Protection of ecosystems against eutrophication Table 6.11 and Table 6.12 provide estimates of the protection of all ecosystems against eutrophication. These include: forests, semi-natural vegetation, and freshwater catchments. The expected benefits are not as large as for acidification, with an overall EU-wide improvement of about four percent as compared with the NEC baseline for the “Ambition level 2” shipping scenarios, 5 to 6 percent for the “Ambition level 3” and “Ambition level 4” and 12 percent for the MTFR scenario. Figure 6.3 shows the spatial distribution of eutrophication indicator for the baseline situation in 2020 and the improvements achieved by individual scenarios.
Table 6.11: Total ecosystems area with nitrogen deposition above critical loads for eutrophication
2020
2000 National and
shipping baselines Nat. baseline, max. technically
feasible red. from shipping Austria 35618 29726 27662 -6.9% Belgium 6730 6463 6323 -2.2% Bulgaria 45600 41010 38491 -6.1% Cyprus 3049 3061 1968 -35.7% Czech Rep. 11162 10926 10878 -0.4% Denmark 3039 2511 2200 -12.4% Estonia 12316 6839 879 -87.1% Finland 112220 78792 45671 -42.0% France 176710 168575 155628 -7.7% Germany 101804 96754 94465 -2.4% Greece 9326 9326 8706 -6.6% Hungary 10278 8282 7789 -6.0% Ireland 7403 6165 5716 -7.3% Italy 87696 70839 52738 -25.6% Latvia 26781 25724 24521 -4.7% Lithuania 17651 17651 17643 0.0% Luxembourg 821 821 821 0.0% Malta Netherlands 4124 3845 3717 -3.3% Poland 86408 83612 82173 -1.7% Portugal 20107 19674 17117 -13.0% Romania 60560 59991 59903 -0.1% Slovakia 19236 18180 17642 -3.0% Slovenia 5264 5247 5219 -0.5% Spain 75050 66975 60000 -10.4% Sweden 60026 21391 13792 -35.5% UK 20972 14495 10864 -25.1% EU-27 1019951 876874 772523 -11.9%
Croatia 3081 2766 2398 -13.3% Turkey Norway 13086 4356 1026 -76.4% Switzerland 18866 12305 11234 -8.7%

51
Table 6.12: Total ecosystems area with nitrogen deposition above critical loads for eutrophication, percentage change from 2020 baseline.
2020 - ambition level
Level 1 all ships
Level 2 all ships
Level 2 all + S meas. in
12 miles zone Level 3 all ships
Level 4 all ships
Austria -1.4% -3.4% -3.4% -3.9% -5.0% Belgium -0.4% -0.5% -0.5% -0.5% -0.5% Bulgaria -2.4% -5.7% -5.7% -6.0% -6.0% Cyprus -2.5% -13.8% -13.8% -16.4% -21.4% Czech Rep. 0.0% -0.2% -0.2% -0.2% -0.4% Denmark -0.9% -2.8% -2.8% -3.7% -4.7% Estonia -2.7% -23.4% -23.4% -40.6% -54.6% Finland -5.7% -19.4% -19.4% -21.3% -24.2% France -0.2% -1.7% -1.7% -2.9% -3.6% Germany -0.2% -0.6% -0.6% -0.8% -1.0% Greece 0.0% 0.0% 0.0% 0.0% 0.0% Hungary -0.1% -2.9% -2.9% -3.2% -3.3% Ireland -1.0% -2.6% -2.6% -3.3% -4.3% Italy -2.0% -4.0% -4.0% -7.3% -9.9% Latvia 0.0% -0.2% -0.2% -0.2% -0.2% Lithuania 0.0% 0.0% 0.0% 0.0% 0.0% Luxembourg 0.0% 0.0% 0.0% 0.0% 0.0% Malta Netherlands -0.3% -1.1% -1.1% -1.5% -1.8% Poland -0.1% -0.2% -0.2% -0.3% -0.5% Portugal -0.2% -0.6% -0.6% -0.8% -1.8% Romania 0.0% -0.1% -0.1% -0.1% -0.1% Slovakia -0.4% -1.0% -1.0% -1.2% -1.5% Slovenia 0.0% 0.0% 0.0% 0.0% 0.0% Spain -0.9% -3.9% -3.9% -4.6% -5.6% Sweden -5.9% -14.7% -14.7% -15.6% -17.4% UK -4.1% -7.5% -7.5% -8.8% -12.3% EU-27 -1.2% -4.0% -4.0% -5.0% -6.0%
Croatia -3.0% -10.4% -10.4% -11.6% -11.7% Turkey Norway 0.0% -33.5% -33.5% -33.5% -56.6% Switzerland -1.1% -1.4% -1.4% -2.4% -2.6%

52
Figure 6.3: Ecosystems area (km2) with nitrogen deposition above critical loads for eutrophication in 2020 – “Baseline” case (upper left panel) and percentage improvement from the baseline for the “Ambition level 2” (upper right panel), “Ambition level 4” (lower left panel) and the MTFR scenario of emissions from international shipping (lower right panel)
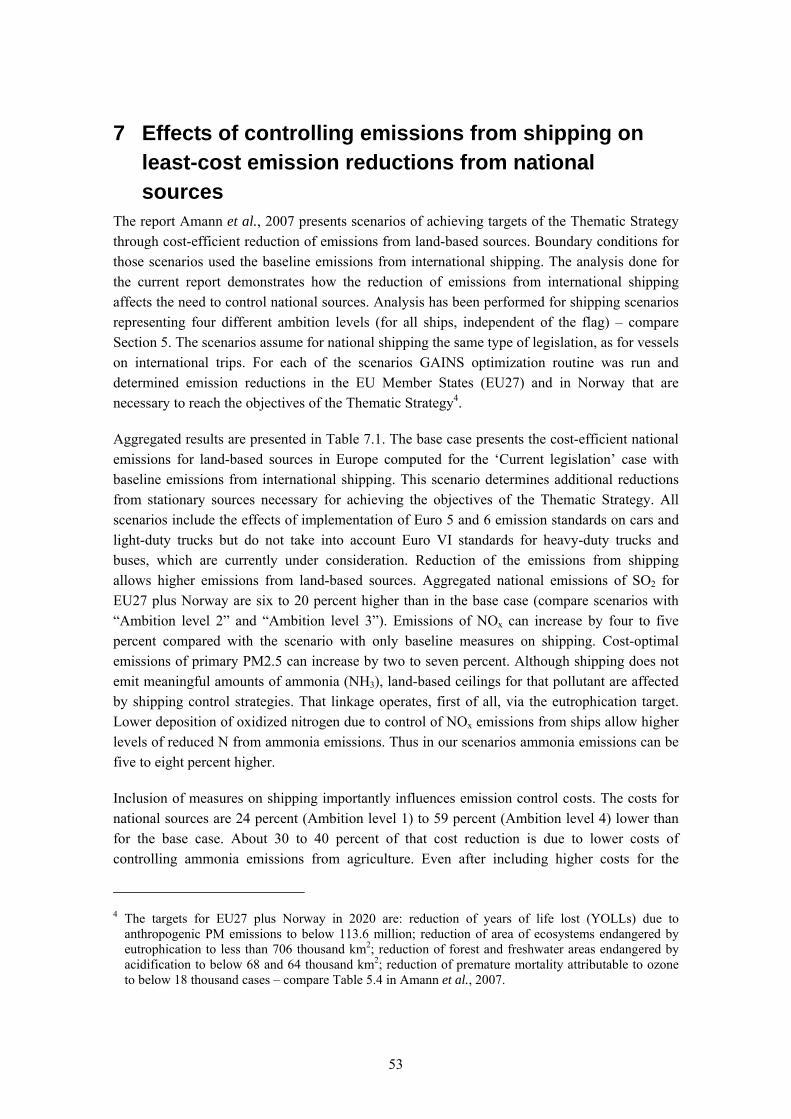
53
7 Effects of controlling emissions from shipping on least-cost emission reductions from national sources
The report Amann et al., 2007 presents scenarios of achieving targets of the Thematic Strategy through cost-efficient reduction of emissions from land-based sources. Boundary conditions for those scenarios used the baseline emissions from international shipping. The analysis done for the current report demonstrates how the reduction of emissions from international shipping affects the need to control national sources. Analysis has been performed for shipping scenarios representing four different ambition levels (for all ships, independent of the flag) – compare Section 5. The scenarios assume for national shipping the same type of legislation, as for vessels on international trips. For each of the scenarios GAINS optimization routine was run and determined emission reductions in the EU Member States (EU27) and in Norway that are necessary to reach the objectives of the Thematic Strategy4.
Aggregated results are presented in Table 7.1. The base case presents the cost-efficient national emissions for land-based sources in Europe computed for the ‘Current legislation’ case with baseline emissions from international shipping. This scenario determines additional reductions from stationary sources necessary for achieving the objectives of the Thematic Strategy. All scenarios include the effects of implementation of Euro 5 and 6 emission standards on cars and light-duty trucks but do not take into account Euro VI standards for heavy-duty trucks and buses, which are currently under consideration. Reduction of the emissions from shipping allows higher emissions from land-based sources. Aggregated national emissions of SO2 for EU27 plus Norway are six to 20 percent higher than in the base case (compare scenarios with “Ambition level 2” and “Ambition level 3”). Emissions of NOx can increase by four to five percent compared with the scenario with only baseline measures on shipping. Cost-optimal emissions of primary PM2.5 can increase by two to seven percent. Although shipping does not emit meaningful amounts of ammonia (NH3), land-based ceilings for that pollutant are affected by shipping control strategies. That linkage operates, first of all, via the eutrophication target. Lower deposition of oxidized nitrogen due to control of NOx emissions from ships allow higher levels of reduced N from ammonia emissions. Thus in our scenarios ammonia emissions can be five to eight percent higher.
Inclusion of measures on shipping importantly influences emission control costs. The costs for national sources are 24 percent (Ambition level 1) to 59 percent (Ambition level 4) lower than for the base case. About 30 to 40 percent of that cost reduction is due to lower costs of controlling ammonia emissions from agriculture. Even after including higher costs for the
4 The targets for EU27 plus Norway in 2020 are: reduction of years of life lost (YOLLs) due to
anthropogenic PM emissions to below 113.6 million; reduction of area of ecosystems endangered by eutrophication to less than 706 thousand km2; reduction of forest and freshwater areas endangered by acidification to below 68 and 64 thousand km2; reduction of premature mortality attributable to ozone to below 18 thousand cases – compare Table 5.4 in Amann et al., 2007.
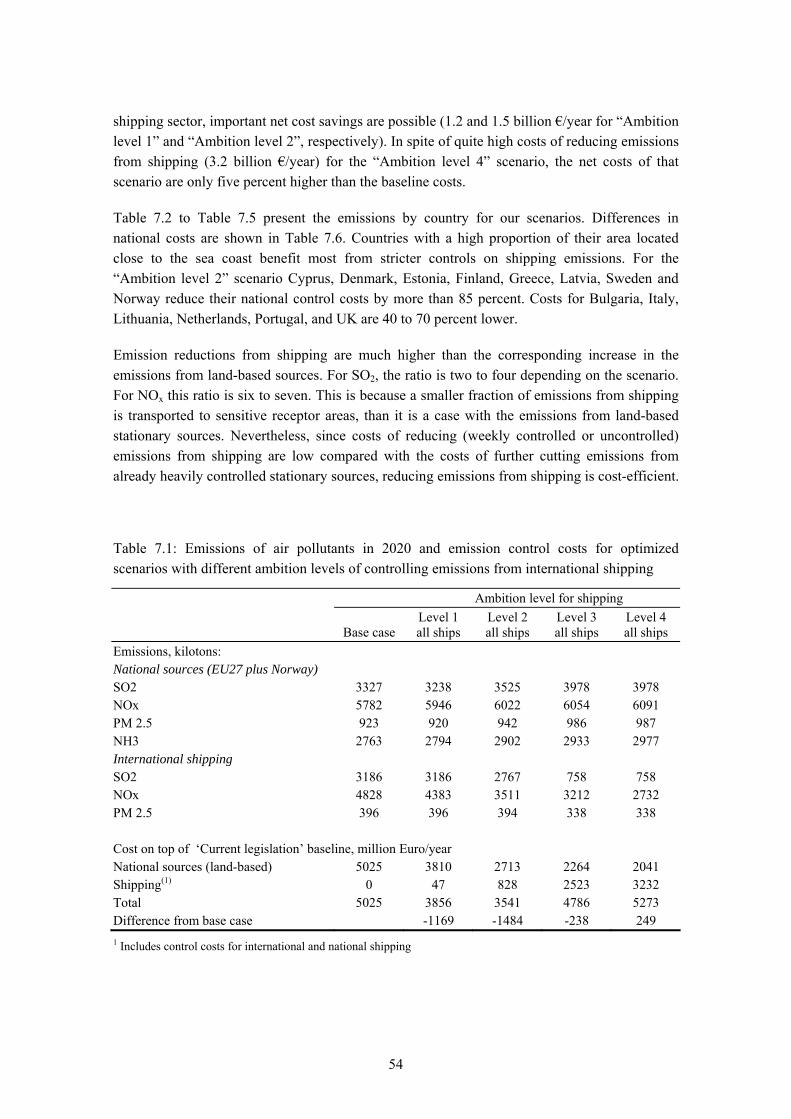
54
shipping sector, important net cost savings are possible (1.2 and 1.5 billion €/year for “Ambition level 1” and “Ambition level 2”, respectively). In spite of quite high costs of reducing emissions from shipping (3.2 billion €/year) for the “Ambition level 4” scenario, the net costs of that scenario are only five percent higher than the baseline costs.
Table 7.2 to Table 7.5 present the emissions by country for our scenarios. Differences in national costs are shown in Table 7.6. Countries with a high proportion of their area located close to the sea coast benefit most from stricter controls on shipping emissions. For the “Ambition level 2” scenario Cyprus, Denmark, Estonia, Finland, Greece, Latvia, Sweden and Norway reduce their national control costs by more than 85 percent. Costs for Bulgaria, Italy, Lithuania, Netherlands, Portugal, and UK are 40 to 70 percent lower.
Emission reductions from shipping are much higher than the corresponding increase in the emissions from land-based sources. For SO2, the ratio is two to four depending on the scenario. For NOx this ratio is six to seven. This is because a smaller fraction of emissions from shipping is transported to sensitive receptor areas, than it is a case with the emissions from land-based stationary sources. Nevertheless, since costs of reducing (weekly controlled or uncontrolled) emissions from shipping are low compared with the costs of further cutting emissions from already heavily controlled stationary sources, reducing emissions from shipping is cost-efficient.
Table 7.1: Emissions of air pollutants in 2020 and emission control costs for optimized scenarios with different ambition levels of controlling emissions from international shipping
Ambition level for shipping
Base case Level 1 all ships
Level 2 all ships
Level 3 all ships
Level 4 all ships
Emissions, kilotons: National sources (EU27 plus Norway) SO2 3327 3238 3525 3978 3978 NOx 5782 5946 6022 6054 6091 PM 2.5 923 920 942 986 987 NH3 2763 2794 2902 2933 2977 International shipping SO2 3186 3186 2767 758 758 NOx 4828 4383 3511 3212 2732 PM 2.5 396 396 394 338 338
Cost on top of ‘Current legislation’ baseline, million Euro/year National sources (land-based) 5025 3810 2713 2264 2041 Shipping(1) 0 47 828 2523 3232 Total 5025 3856 3541 4786 5273 Difference from base case -1169 -1484 -238 249 1 Includes control costs for international and national shipping

55
Table 7.2: Optimized SO2 emissions from national sources for shipping scenarios with different ambition levels
Ambition level for shipping
Base case Level 1 all ships
Level 2 all ships
Level 3 all ships
Level 4 all ships
Austria 20 20 20 20 20 Belgium 72 71 72 74 74 Bulgaria 111 111 111 115 115 Cyprus 8 8 8 8 8 Czech Rep. 142 141 142 157 157 Denmark 20 19 21 21 21 Estonia 48 48 48 48 48 Finland 59 59 59 59 59 France 342 339 346 435 435 Germany 420 411 420 426 426 Greece 83 83 83 83 83 Hungary 39 39 45 55 55 Ireland 36 36 36 36 36 Italy 266 266 326 339 339 Latvia 15 15 19 19 19 Lithuania 39 38 39 39 39 Luxembourg 2 2 2 2 2 Malta 8 4 8 8 8 Netherlands 73 73 73 77 77 Poland 551 551 621 855 855 Portugal 75 75 81 86 86 Romania 123 104 133 137 137 Slovakia 58 56 68 81 81 Slovenia 17 17 19 22 22 Spain 398 346 420 446 446 Sweden 41 41 41 41 41 UK 239 239 239 264 264 EU-27 3301 3212 3499 3952 3952 Croatia 62 62 62 62 62 Turkey 911 911 910 910 910 Norway 26 26 26 26 26 Switzerland 18 18 18 18 18

56
Table 7.3: Optimized NOx emissions from national sources for shipping scenarios with different ambition levels
Ambition level for shipping
Base case Level 1 all ships
Level 2 all ships
Level 3 all ships
Level 4 all ships
Austria 119 120 119 119 122 Belgium 168 170 173 174 174 Bulgaria 74 73 79 81 82 Cyprus 10 14 15 15 15 Czech Rep. 145 149 156 156 158 Denmark 92 96 102 102 102 Estonia 14 18 21 23 23 Finland 99 113 123 125 125 France 658 672 691 691 691 Germany 711 746 761 765 765 Greece 167 171 169 171 172 Hungary 79 83 87 87 87 Ireland 64 66 69 69 69 Italy 721 721 713 713 713 Latvia 24 26 29 30 30 Lithuania 27 31 33 33 33 Luxembourg 15 15 15 15 15 Malta 5 5 5 5 5 Netherlands 206 222 220 220 220 Poland 351 366 366 378 393 Portugal 129 133 136 136 138 Romania 200 195 189 189 197 Slovakia 56 60 61 61 61 Slovenia 33 33 33 33 33 Spain 677 671 664 665 666 Sweden 132 138 135 135 135 UK 660 696 727 728 732 EU-27 5633 5803 5892 5921 5958 Croatia 53 53 53 53 53 Turkey 731 730 728 728 728 Norway 149 143 130 133 133 Switzerland 49 49 49 49 49
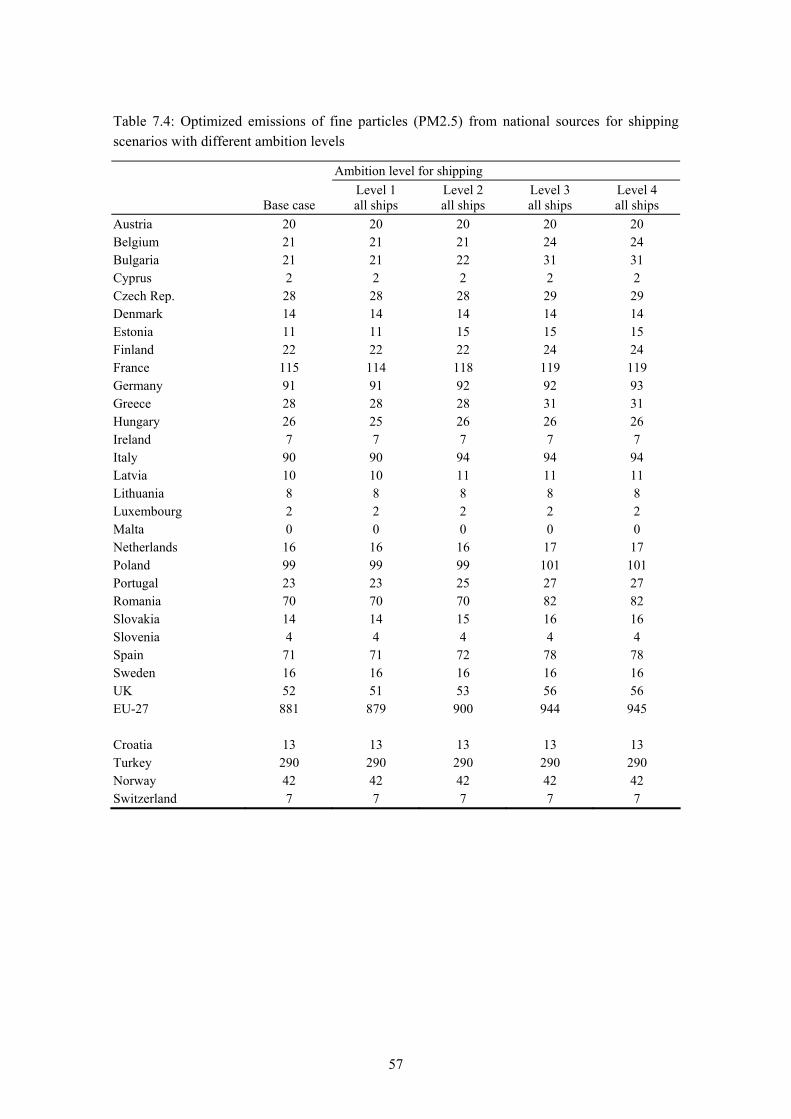
57
Table 7.4: Optimized emissions of fine particles (PM2.5) from national sources for shipping scenarios with different ambition levels
Ambition level for shipping
Base case Level 1 all ships
Level 2 all ships
Level 3 all ships
Level 4 all ships
Austria 20 20 20 20 20 Belgium 21 21 21 24 24 Bulgaria 21 21 22 31 31 Cyprus 2 2 2 2 2 Czech Rep. 28 28 28 29 29 Denmark 14 14 14 14 14 Estonia 11 11 15 15 15 Finland 22 22 22 24 24 France 115 114 118 119 119 Germany 91 91 92 92 93 Greece 28 28 28 31 31 Hungary 26 25 26 26 26 Ireland 7 7 7 7 7 Italy 90 90 94 94 94 Latvia 10 10 11 11 11 Lithuania 8 8 8 8 8 Luxembourg 2 2 2 2 2 Malta 0 0 0 0 0 Netherlands 16 16 16 17 17 Poland 99 99 99 101 101 Portugal 23 23 25 27 27 Romania 70 70 70 82 82 Slovakia 14 14 15 16 16 Slovenia 4 4 4 4 4 Spain 71 71 72 78 78 Sweden 16 16 16 16 16 UK 52 51 53 56 56 EU-27 881 879 900 944 945 Croatia 13 13 13 13 13 Turkey 290 290 290 290 290 Norway 42 42 42 42 42 Switzerland 7 7 7 7 7

58
Table 7.5: Optimized emissions of ammonia (NH3) from national sources for shipping scenarios with different ambition levels
Ambition level for shipping
Base case Level 1 all ships
Level 2 all ships
Level 3 all ships
Level 4 all ships
Austria 41 41 40 40 39 Belgium 74 74 74 75 75 Bulgaria 57 58 59 59 60 Cyprus 5 6 7 7 7 Czech Rep. 62 60 60 60 60 Denmark 47 51 53 53 53 Estonia 7 8 10 11 11 Finland 27 26 29 30 30 France 462 464 474 479 487 Germany 384 379 383 385 387 Greece 36 39 45 46 46 Hungary 61 61 61 61 61 Ireland 86 87 88 89 90 Italy 287 294 311 316 325 Latvia 9 11 12 12 12 Lithuania 28 30 31 31 32 Luxembourg 5 5 5 5 5 Malta 3 3 3 3 3 Netherlands 123 122 124 125 126 Poland 239 237 243 243 244 Portugal 50 52 57 58 61 Romania 113 113 115 116 115 Slovakia 26 25 25 24 24 Slovenia 14 14 15 15 15 Spain 250 260 279 285 296 Sweden 38 44 50 50 50 UK 214 216 229 235 243 EU-27 2750 2779 2881 2912 2956 Croatia 32 32 32 32 32 Turkey 491 491 491 491 491 Norway 13 15 21 21 21 Switzerland 41 41 41 41 41

59
Table 7.6: Emission control costs by country for optimized scenarios meeting Thematic Strategy objectives for shipping scenarios with different ambition levels
Ambition level for shipping
Base case Level 1 all ships
Level 2 all ships
Level 3 all ships
Level 4 all ships
Austria 94 101 115 121 125 Belgium 113 102 69 56 48 Bulgaria 64 55 35 25 21 Cyprus 19 6 0 0 0 Czech Rep. 122 120 102 93 90 Denmark 119 36 11 11 11 Estonia 37 10 1 0 0 Finland 89 41 3 1 1 France 667 597 481 411 387 Germany 614 494 394 362 342 Greece 87 34 11 8 8 Hungary 68 56 43 38 38 Ireland 105 94 74 68 58 Italy 346 316 203 177 145 Latvia 35 11 3 2 2 Lithuania 85 55 42 38 33 Luxembourg 9 8 10 10 10 Malta 0 1 0 0 0 Netherlands 190 76 66 53 49 Poland 398 357 285 138 115 Portugal 89 71 41 33 25 Romania 205 209 182 167 160 Slovakia 50 44 34 30 31 Slovenia 29 28 24 22 21 Spain 541 500 354 311 262 Sweden 187 40 9 8 8 UK 526 315 163 124 97 EU-27 4886 3778 2757 2309 2087 Croatia Turkey 0 4 8 8 8 Norway 139 48 2 1 1 Switzerland 0 0 0 0 0

60
8 Summary and conclusions
Maritime activities constitute a significant fraction of anthropogenic emissions of air pollutants in Europe. It is estimated for the year 2000 that SO2 and NOx emissions from international maritime shipping in Europe amounted to approximately 30 percent of the land-based emissions in the EU-25. About 20 percent of these ship emissions are released within the 12-mile zones near to the coast line. The vast majority (approximately 95 percent) of emissions is released from larger vessels (>500 GRT). For these larger vessels, roughly 95 percent of SO2 and emissions are estimated to be released from cargo ships. About 45 percent of the sea emissions in the region originate from ships with EU flags. Approximately five percent of SO2 emissions are emitted at berth.
Because of concerns about harmful impacts of air pollution, the European Union has established a comprehensive legal framework to control air quality in their Member States. A wide body of legislation demands stringent emission control measures for land-based sources. As a consequence, land-based emissions in the EU Member States are expected to decline in the coming years. The baseline projections for the revision of the National Emission Ceilings (NEC) directive suggests that current EU legislation for land-based sources would lead by 2020 to a reduction of SO2 emissions in the EU27 by more than 60 percent compared to the year 2000, and for NOx emissions by more than 40 percent. Based on an analysis of the costs and benefits of further measures, the European Commission has proposed in its Thematic Strategy on Air Pollution more stringent environmental objectives that imply for the year 2020 emission control measures that bring down SO2 emissions by 81 percent and NOx emission by 61 percent.
Whilst measures are in force to address emissions from international shipping, the expected increase in the volume of ship movements will outweigh the positive environmental impacts of these measures and will lead to a further growth in ship emissions overall. Under business-as-usual assumptions, SO2 emissions from international shipping are computed to increase by more than 40 percent between 2000 and 2020, NOx emissions by 47 percent and PM2.5 emissions by 56 percent. Under these conditions, emissions from maritime activities would by 2020 come close to the projected baseline emission levels for land-based sources, and surpass the target levels established by the European Commission in its Thematic Strategy on Air Pollution for land based sources, in particular for SO2 by a factor of two.
Health and environmental impacts of air pollutants are critically determined by the proximity of the emission sources to sensitive receptor sites. This means that, compared to land-based sources, at least some of the maritime emissions have less health and environmental impacts since they are released sometimes far from populated areas or sensitive ecosystems. However, in harbour cities ship emissions are in many cases a dominant source of urban pollution and need to be addressed when compliance with EU air quality limit values for fine particulate matter is an issue. Furthermore, as for all other sources, emissions from ships are transported in the atmosphere over several hundreds of kilometres, and thus can contribute to air quality problems on land, even if they are emitted on the sea. This pathway is especially relevant for

61
deposition of sulphur and nitrogen compounds, which cause acidification of natural ecosystems and freshwater bodies and threaten biodiversity through excessive nitrogen input.
Scientific models are used routinely to describe the atmospheric transport of pollution. These models estimate that for many parts of Europe a significant fraction of sulphur compounds deposited on land originate from ship emissions. While at present emissions from ships are responsible for 10 to 20 percent of sulphur deposition in coastal areas, their contribution is expected to increase to more than 30 percent in large areas in Europe by 2020, especially in the UK, Ireland, Sweden, Denmark, France, Germany, Netherlands, Belgium, Spain, Italy and Greece. In many coastal areas, ships will be responsible for more than 50 percent of sulphur deposition.
The anticipated increase in ship emissions will counteract the envisaged benefits of the costly efforts to control the remaining emissions from land-based sources in Europe. Technologies exist to reduce emissions from shipping beyond what is currently legally required.
This study has identified a set of emission control measures that are technically available which could – if fully applied to all ships on European seas (the MTFR scenario) – reduce some 80 percent of the SO2 emissions from international shipping and almost 90 percent of the NOx
emissions by 2020. Costs of these measures are estimated at 5.5 billion €/yr (5.1 billion €/year above the baseline). For comparison, the costs of the measures proposed by the Thematic Strategy amount to 7.1 billion €/yr. in 2020 and thereafter.
The study has explored four specific packages of measures with different ambition levels that could reduce emissions at lower costs:
− “Ambition level 1” package includes measures to reduce NOx emissions through internal engine modifications for all newly built ships after 2010 and retrofitting the slow-speed engines of existing (pre-2000) vessels through slide valves modification. This would reduce in 2020 total NOx emissions from international shipping by approximately 10 percent compared to the baseline case, which however still leaves a 33 percent increase compared to the year 2000. Costs for these measure are estimated at less than 30 million €/yr.
− “Ambition level 2” set of measures includes the use of residual oil with a maximum sulphur content of 0.5 percent (or seawater scrubbing resulting in equivalent emissions) in the North Sea and Baltic, slide valve retrofits for existing slow-speed engines and humid air motors for all newly built vessels (post-2010). This would, in 2020, reduce SO2 emissions by 14 percent compared to the baseline and NOx emissions by 28 percent. In total, implementation of this package involves costs of 770 million €/yr in addition to the baseline costs. A variant of this package (Ambition level 2 with sulphur measures) assumes strengthening the requirements for SO2 controls by imposing a 1.5 percent limit on the sulphur content of heavy fuel oil for cargo ships within the 12-mile zones (unless stricter regulations are foreseen for the North Sea and Baltic). This would reduce SO2 emissions by 73 kt further (i.e., 2.3 percent of the baseline emissions) and increase costs by about 60 million €/yr.

62
− “Ambition level 3” package explores the reduction of the S content of residual oil to 0.5 percent until 2020, and a 15 percent reduction of emissions of NOx from existing vessels combined with 50 percent reduction for new (post-2010) vessels. The extra cost of that package is 2.5 billion €/year.
− Finally, the “Ambition level 4” package simulates the effects of implementing (in addition to “Ambition level 3” measures) selective catalytic reduction technology (SCR) on all post-2010 ships. In this case the costs above the baseline increase to 3.2 billion €/year.
A comparison of these options with the candidate measures indicated in the Thematic Strategy for stationary sources reveals that these technical measures for marine sources could reduce approximately three times more SO2 emissions and seven times more NOx than what has been proposed for land-based sources. For SO2, approximately 80 percent of this potential (i.e., excluding the option for 0.5 percent sulphur in residual oil) can be achieved at marginal costs that are below 15 percent of the highest marginal costs of the measures proposed for land-based sources. For NOx, this low-cost potential comprises about 70 percent of the technical potential considered in this report.
However, any analysis of the cost-effectiveness must consider the impact that emission reductions from the different sources have on human health and environmental effects. A crucial factor in such an assessment is the proximity of the location of emissions to the receptor areas that need to be protected against pollution. As outlined by the emission inventory, approximately 80 percent of ship emissions in the model domain are emitted outside the 12-mile zone. Consequently, the cost-effectiveness of measures for ships relative to land-based measures cannot be judged from marginal abatement costs only, but needs to take into account atmospheric dispersion characteristics too.
To meet this requirement, the RAINS/GAINS integrated assessment framework was used to derive environmental impact indicators for the shipping scenarios. In this context particularly interesting are scenarios with “Ambition level 2” and “Ambition level 3”, where a decrease of negative impacts can be achieved at moderate costs. For instance, emission controls according to the “Ambition level 2” scenario reduce the loss in life expectancy of the European population by 3.1 percent (0.17 months) beyond the baseline case. This constitutes approximately 13 percent of the environmental improvement proposed by the Thematic Strategy. This scenario also achieves a 14 percent improvement of acidification indicator. Corresponding numbers for the “Ambition level 3” scenario are: 6.5 percent reduction in loss of life expectancy and a 19 percent reduction in forest area endangered by acidification.
Simulations performed with the RAINS/GAINS model demonstrate that the reduction of emissions from international shipping can substantially lower the costs of additional controls for land-based sources necessary to achieve the Thematic Strategy targets. For three out of four packages considered net cost savings are achieved, even after inclusion of higher cost for shipping sector. The highest cost savings have been identified for the “Ambition level 2” package, where the net costs are reduced by nearly 1.5 billion €/a.

63
References Amann, M., Asman W., Bertok I., Cofala, J., Heyes, C., Klimont, Z., R., Posch, M. and Schöpp,
W. (2007)., Cost-optimized reductions of air pollutant emissions in the EU Member states to meet the environmental targets of the Thematic Strategy on Air Pollution. NEC Sceanrio Analysis Report No. 3. International Institute for Applied Systems Analysis (IIASA), Laxenburg, Austria.
Amann, M., Bertok I., Cofala, J., Heyes, C., Klimont, Posch, M. Schöpp, W. and Wagner F. (2006), Baseline Scenarios for the Revision of the NEC Emission Ceilings Directive. Part 1: emission projections. NEC Scenario Analysis Report Nr.1. International Institute for Applied Systems Analysis (IIASA), Laxenburg, Austria, http://www.iiasa.ac.at/rains/CAFE_files/NEC-BL-p1-v21.pdf.
Amann, M., Bertok, I., Cabala, R., Cofala, J., Heyes, C., Gyarfas, F., Klimont, Z., Schöpp, W. and Wagner, F. (2005), Analysis for the final CAFE scenario. CAFE Report No. 6. International Institute for Applied Systems Analysis (IIASA), http://www.iiasa.ac.at/rains/CAFE_files/CAFE-D3.pdf.
Amann, M., Cofala, J., Heyes, C., Klimont, Z., Mechler, R., Posch, M. and Schöpp, W. (2004), The RAINS model. Documentation of the model approach prepared for the RAINS review. International Institute for Applied Systems Analysis (IIASA), Laxenburg, Austria, www.iiasa.ac.at/rains/review/index.html.
CEC (2005), Communication from the Commission to the Council and the European Parliament on a Thematic Strategy on Air Pollution. SEC(2005) 1132. Commission of the European Communities, Brussels, http://eur-lex.europa.eu/LexUriServ/site/en/ com/2005/com2005_0446en01.pdf.
CONCAWE (2006). Techno-economic Analysis of the Impact of the Reduction of Sulphur Content of Residual Marine Fuels in Europe. Concawe Report Nr.2/06., Brussels.
Corbett J.J., Firestone J., Wang Ch. (2007), Estimation, validation and forecasts of regional commercial marine vessel inventories. Final report. Report prepared for the California Air Resources Board and the California Environmental Protection Agency and for the Commission for Environmental Cooperation of North America. University of Delaware, Newark, Delaware, USA, http://www.arb.ca.gov/research/seca/jcfinal.pdf.
De Ceuster G., van Herbruggen B., Logghe S. (2006), TREMOVE - description of model and baseline version 2.41. Report for the European Commission, DG ENV. Chapter VI – The maritime model. Service Contract B4-3040/2002/342069/MAR/C.1. Transport & Mobility Leuven, Leuven, Belgium.
EMEP (2006), EMEP Status Report 1/06. Transboundary acidification, eutrophication and ground level ozone in Europe since 19990 to 2004, Joint MSC-W & CCE & icp-forest & icp-m&m & etc/acc Report.
EMEP (2005), EMEP Status Report 1/05. Transboundary acidification, eutrophication and ground level ozone in Europe 10 2003, Joint MSC-W & CCC & CIAM Report.
Endresen O. et al. (2003), 'Emission from international sea transportation and environmental impact', Journal of Geophysical Research, Vol. 108, No. D17, 4560, doi: 10.1029/2002JD002898,2003 (ACH 14 - p.1-22).
Entec (2005a), European Commission Directorate General Environment Service Contract on Ship Emissions: Assignment, Abatement and Market-based Instruments. Task 1 -

64
Preliminary Assignment of Ship Emissions to European Countries. Final Report Entec UK Limited, August 2005.
Entec (2005b), European Commission Service Contract on Ship Emissions: Assignment, Abatement and Market-based Instruments. Task 2 – General Report, Final Report, Entec UK Limited, August 2005.
Entec (2005c), European Commission Service Contract on Ship Emissions: Assignment, Abatement and Market-based Instruments. Task 2b – NOx Abatement, Final Report, Entec UK Limited, August 2005.
Entec (2005d), European Commission Service Contract on Ship Emissions: Assignment, Abatement and Market-based Instruments. Task 2c – SO2 Abatement, Final Report, Entec UK Limited, August 2005.
Fagerli, H., Simpson, D. and Tsyro, S. (2004), Unified EMEP model: Updates, in: Transboundary Acidification and Eutrophication and Ground Level Ozone in Europe. EMEP/MSC-W Status Report 1.
Jonson, J.E., Simpson, D., Fagerli, H. and Solberg, S. (2006), Can we explain the trends in European ozone levels? Atmos. Chem. Phys, 6, pp 1–16.
Klaassen G., Berglund Ch., Wagner F. (2005), The GAINS Model for Greenhouse Gases - Version 1.0: Carbon Dioxide (CO2). Interim Report IR-05-53. International Institute for Applied Systems Analysis (IIASA), Laxenburg, Austria.
OJ L 191/59 (2005), Directive 2005/33/EC of the European Parliament and of the Council on the sulphur content of marine fuels. Official Journal of the European Union.
Simpson, D., Fagerli, H., Jonson, J.E., Tsyro, S., Wind, P. And Tuovinen, J.P. (2003), Transboundary Acidification and Eutrophication and Ground Level Ozone in Europe. Unified EMEP Model Description. EMEP/MSC-W Status Report 1, Part I.
Skjolskvik, K.O., et al. (2000), Study of Greenhouse Gas Emissions from Ships (MPEC 45/8 Report to International Maritime Organization on the outcome of the IMO Study on Greenhouse Gas emissions from Ships). MARTINEK Sintef Group, Carnegie Mellon University, Center for Economic Analysis, and Det Norske Veritas, Trondheim, Norway.
UNECE (2004), Review of the Unified EMEP Model, Task Force on Measurements and Modelling, Review of the Unified EMEP Model. Summary Report and Conclusions of the workshop, prepared by the Chairman in collaboration with the secretariat EB.AIR/GE.1/204/6.
US EPA (2003), Final Regulatory Support Document: Control of Emissions from New Marine Compression Ignition Engines at or Above 30 liters per Cylinder,January 2003, EPA420-R-03-004, at pp. 2-5.
Whall, C., Cooper, D., Archer, K., Twigger, L., Thurston, N., Ockwell, D., McIntyre and Ritchie, A. (2002), Quantification of emissions from ships associated with ship movements between ports in the European Community. Final Report. Entec UK Limited.