analysis of fuel reliability / fuel failure causes and...
TRANSCRIPT

1
ANALYSIS OF FUEL RELIABILITY / FUEL FAILURE CAUSES AND
MITIGATION
Workshop on “Modelling and Quality Control for Advanced and Innovative Fuel Technologies”
14-25 November 2005The Abdu Salam International Centre for Theoretical
Physics, Trieste, ItalyPresented by V. Onufriev - consultant

2
CONTENTS
• Evaluation of fuel failure rates (slides 3-15)• Consequences of fuel failures for utilities (16)• Utilities policies-water chemistry modernization (17-21)• Distribution of fuel failure causes/mitigation (22-31)• Some cases of “mass” fuel failures (32-36)• Difference between fuel failure rates in WWER-440s of
different design (37-39)• Phenomena limiting LWR fuel reliability at high
burnups (40-42)• IAEA activities in the area of fuel reliability analysis
(43-44)

3
Types of fuel operation damages • Fuel failures – damage to fuel rod (FR) cladding, either
with fuel washout into coolant or only with gas untightness. In both cases fission products enter the cooling circuit from leaking FRs. They are discussed in this report.
• There are other damages to fuel assembly and its components, e.g. spacer grids (SGs), guide tubes (GTs), etc. These damages may limit fuel safety margins (e.g. Incomplete Control Rod Insertion because of fuel bundle including GTs bow and strong interaction of dropping control rod with inner surface of GT), but are not resulted in activity release. They are out of the scope of this report.

4
Evaluation of LWR fuel failure rates (1)• Number of leaky fuel assemblies (FAs) / fuel rods (FRs) is defined by
sipping in combination with fuel inspection and post-irradiation examination (PIE)
• Methodology to calculate fuel failure rate was provided in the IAEA Technical Report Series 388 (1998) “Review of Fuel Failures in Water Cooled Reactors”
• R ≈ r x D/N, where:R is an annual rod failure rate (leaky rods/rods in core);N is the number of rods in core for all operating reactors during that
year;D is a number of leaking FAs in a year andr is the average number of leaking FRs per leaking FA, agreed as 1.1
for BWRs and WWER-440s and 1.3 for PWRs and WWER-1000s

5
Evaluation of LWR fuel failure rates (2)
• Another methodology to calculate fuel failure rate was also provided in the IAEA TRS 388 and appears as the number of failed FAs per year and 1 GWe installed capacity. Data for calculation and comparison with methodology (slide 4) are given in Table 1 (slide 5). With these figures a given number of failed FAs per GWe and year can be transformed by the following approximation:
• R ≈ b x r x A, where:R is an annual rod failure rate (leaky rods/rods in core);b is the average electric power per rod (GWe/rods in a
core), see Table1;A is the annual number of leaking FAs per GWe

6
Evaluation of LWR fuel failure rates (3) Table 1. World averages of inserted fuel per GWe
installed capacity as of 31 Dec. 2004
1.42.42.2Average GWe per 105 FRs
2.58.63.8Number of FRs in operation (106)
2.45.71.4Average GWe per 1000 FAs
15.136.058.2Number of FAs in operation
35.9204.782.6Installed capacity, GWe
5321493Number of units in operation
WWERPWRBWRCharacteristics/Reactor Type

7
Evaluation of LWR fuel failure rates (4)• Both methodologies do not take into account differences in load
factor and burnup, but provide, at least, good indication and direction when analyzing changes in failure rates because of changes in fuel design, materials, operation conditions and implementation of remedies. Depending on detalization of input data, difference between results calculated using both methodologies might reach 5-10 %.
• At present more and more specialists/organizations give preference to express fuel failure rates in ppm. 1 ppm means 1 failed rod per 106 rods in core per year. 1ppm is a value that has already been reached at the group of some Japanese plants. But for the whole nuclear community it is a value to that it is striving for.
• Consideration of average fuel failure rates may be of limited relevance for individual plants, but can be a valuable means of comparing the industry-wide fuel reliability. TRS 388 introduced regional (e.g. Europe, Japan, USA) and world average fuel failure rates in 1987-1994 (see Fig. 1 below):
• 1) There is tendency for rate’s decreasing• 2) Rates are basically in the range of 10-40 ppm• 3) Usually sharp divergences are due to new phenomena

8
Evaluation of LWR fuel failure rates (5)-Fig. 1

9
Evaluation of LWR fuel failure rates (6)Table 2. Estimated world average FR failure rates
in 1991-1994 (TRS 388).Next slides present fuel failure statistics for several countries with
significant nuclear electricity share (USA-slide 10, France-11, Germany-12, Spain-13 and also for all operating WWERs-14) for the
wider time spanincluding 2004
2.42.01.5Exposed fuel in kg UO2 per GWe
1.61.20.5Failed rods per GWe
2.32.91.1Failed rods per 105 rods
WWERPWRBWRAverage annual FR failure rates / Reactor type

10
Fig. 2. Trend in US Fuel Failure Rate (EPRI report to the 2005 Conference on LWR Fuel Performance)

11
BASIC DESIGN DEPARTMENTNUCLEAR FUEL BRANCH
FUEL FAILURE R AT E IN O PE RAT IO N
0,00
0,50
1,00
1,50
2,00
1979 1980 1981 1982 1983 1984 1985 1986 1987 1988 1989 1990 1991 1992 1993 1994 1995 1996 1997 1998 1999 2000 2001 2002 2003 2004
Fuel
failu
re ra
te %
12 ft Fuel14 ft FuelAverage
FIG. 3. Total failure rate: 0.27 % ( 1.02 x 10 -5 ), French report to the 2005 IAEA TWGFPT meeting

12
FIG. 4 Evolution of the discharge burnup ofFRAMATOME ANP GmbH PWR+BWR fuel assemblies and the Annual fuel rod failure rate (H.-P. Fuchs, report to the IAEA TWGFT
Meeting, April 2005)
0
10
20
30
40
50
60
70
80
90
100
1979
1980
1981
1982
1983
1984
1985
1986
1987
1988
1989
1990
1991
1992
1993
1994
1995
1996
1997
1998
1999
2000
2001
2002
2003
2004
Year
Ann
ual f
uel r
od fa
ilure
rate
[*10
E-5]
0
5
10
15
20
25
30
35
40
45
50
Dis
char
ge b
urnu
p(G
Wd/
t)
BWR
PWR
BWR
PWR

13
FIG. 5 Fuel rod failures in Spain
data from fuel manufactured by ENUSA, only- presented by J.M. Alonso Pacheco at the IAEA TWGFPT Meeting, April 2005
0
2
4
6
8
10
12
14
16
1995 1996 1997 1998 1999 2000 2001 2002 2003 2004
totaltotal known

14
FIG. 6 Fuel rod failure rates for all WWER reactors operating in Russia and other countries during last several years (V. Novikov, report to the IAEA TWGFPT
Meeting, April 2005)

15
Evaluation of LWR fuel failure rates (6)Table 3. Estimated world average FR failure rates
in 1995-2004Evaluation of fuel failure rates was done by lecturer using data from
TRS 388, graphs above plus data from Sweden presented at the IAEA 2005 TWGFPT meeting; *- rate for WWER-440 of V-213 and V-230
designs and WWER-1000; ** - for WWERs without WWER-440 of V-230 design ; Japanese data (rates are lower usually in Japan) were not
taken into account. In brackets there are data on world average fuel failures rates in 1991-94, see Table 2 above.
2.5*/1.0**(not applicab.)
1.8 (2.9)1.3 (1.1)Failed rods per 105 rods
WWERPWRBWRAverage annual FR failure rates / Reactor type

16
Consequences of fuel failures for utilities
• Fuel failures usually do not impact directly reactor safety. However, they may increase dose rates, especially in case of fuel washout.
• Fuel failures are very costly. It was mentioned in the EPRI report at the 2005 Conference on LWR Fuel Performance that “even a single BWR failed rod can cost to utility more than $ 1 mln. in outage time, fuel and power replacement costs. Failures affecting a larger portion of a reload, e.g. crud/corrosion failures, can easily run in the tens-of-millions of dollars”. This is why it is so important to keep fuel failure rate As Low As Reasonably Achievable (ALARA principle).
17
Utilities policies to maintain good fuel reliability at high burnup operation (1)
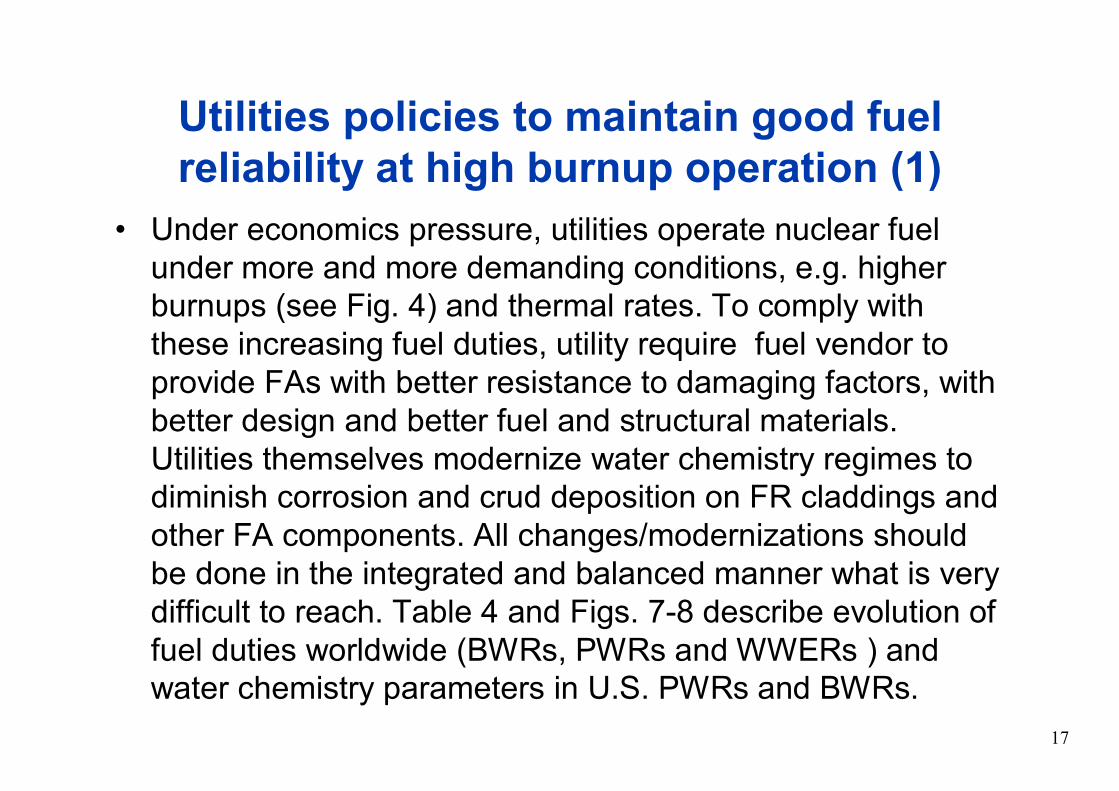
• Under economics pressure, utilities operate nuclear fuel under more and more demanding conditions, e.g. higher burnups (see Fig. 4) and thermal rates. To comply with these increasing fuel duties, utility require fuel vendor to provide FAs with better resistance to damaging factors, with better design and better fuel and structural materials. Utilities themselves modernize water chemistry regimes to diminish corrosion and crud deposition on FR claddings and other FA components. All changes/modernizations should be done in the integrated and balanced manner what is very difficult to reach. Table 4 and Figs. 7-8 describe evolution of fuel duties worldwide (BWRs, PWRs and WWERs ) and water chemistry parameters in U.S. PWRs and BWRs.

18
Table 4. Evolution of fuel duty parameters in water cooled power reactors (BWRs, PWRs and WWERs)
~31.71.51Relative radiation damage (dpa) to fuel and structural materials
~10653Fuel residence time, years
12-2412-2412-1811Fuel cycle length, months
~104.94.53.0Fuel enrichment, % U-235
~10048-504528-30Fuel discharge average burnup, GWd/tU
~2020**R. Yang, LWR Fuel Perf. Conf. 2005
~20102004-051970’sParameter/years

19
Water chemistry modifications and decontamination procedures
• Changes of water chemistry parameters illustrated at Figs 7-8 for U.S. PWRs and BWRs were and are typical in general for all park of PWRs/WWERs and BWRs worldwide. These changes were directed on diminishing corrosion/crud deposition on FRs in a core and on diminishing risk of stress-corrosion cracking of coolant circuit materials (adjustment of Electro-Chemical Potential (ECP).
• During outages, utilities conduct from time to time primary circuit decontamination to reduce dose rates for personnel during maintenance. If procedure and chemicals for decontamination were mistakenly selected, crud deposition may result in FR overheating and massive failures.

20
Fig. 7. Evolution of water chemistry in U.S. PWRs as response to BU increase (EPRI report at the
2005 Conf. on LWR Fuel Performance)

21
Fig. 8. Evolution of water chemistry in U.S. BWRs as response to BU increase (EPRI report at the 2005 Conf. on LWR Fuel
Performance)
22
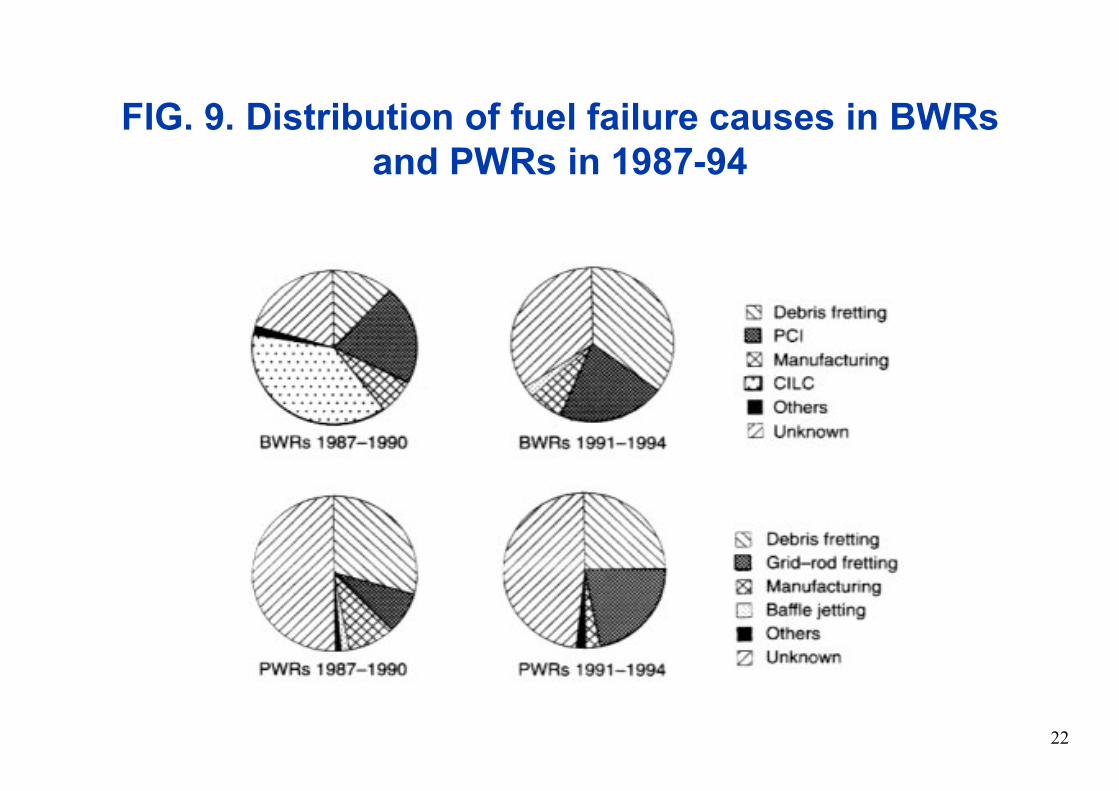
FIG. 9. Distribution of fuel failure causes in BWRsand PWRs in 1987-94

23
FIG. 10. Baffle Jetting in PWRs
This type of failure may happen in PWRs with the down-flow baffle barrel design. Fig. 10 shows two ways in which the joint between two
cire baffle plates can open and allow a high pressure jet of water to impringe on some of FRs. Such gaps are caused by stress in the
baffle plate assembly. Transverse coolant flow results in turbulence and vibration of the FR periphery row. The
appearance of the defect generally showed a long axial fretting worn and resulted in large axial split.

24
FIG. 11 Fuel Failure Causes in the US BWRs

25
FIG. 12 Example of tenacious crud and surface spallation (River Bend BWR, USA) – EPRI report to
the 2005 Conference on LWR Fuel Performance)

26
FIG. 13 Fuel Failure Causes in U.S. PWRs

27
0,000
0,002
0,004
0,006
0,008
1998 1999 2000 2001 2002 2003 2004
cause undeterminedcause core relatedcause fuel related
Annual Fuel Rod Failure Rate [%]
Year
FIG. 14 Framatome ANP GmbH PWR FuelOperational Reliability 1998-2004, status 12/2004
(H.-P. Fuchs, report to the IAEA TWGFT Meeting, April 2005)
28
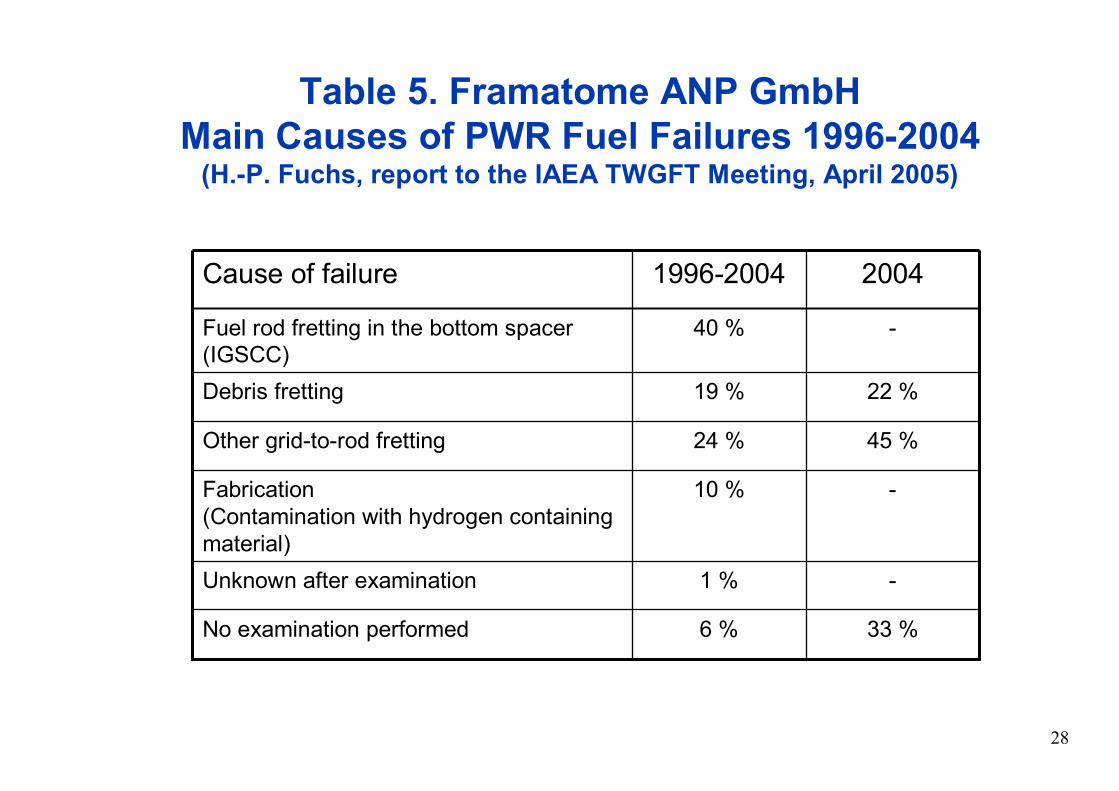
Table 5. Framatome ANP GmbHMain Causes of PWR Fuel Failures 1996-2004
(H.-P. Fuchs, report to the IAEA TWGFT Meeting, April 2005)
-40 %Fuel rod fretting in the bottom spacer (IGSCC)
33 %
-
-
45 %
22 %
2004
6 %
1 %
10 %
24 %
19 %
1996-2004
No examination performed
Unknown after examination
Fabrication (Contamination with hydrogen containing material)
Other grid-to-rod fretting
Debris fretting
Cause of failure

29
0,000
0,002
0,004
0,006
0,008
1998 1999 2000 2001 2002 2003 2004
cause undeterminedcause core relatedcause fuel related
Annual Fuel Rod Failure Rate [%]
Year
FIG. 15 Framatome ANP GmbH BWR FuelOperational Reliability 1998-2004, status 12/2004
(H.-P. Fuchs, report to the IAEA TWGFT Meeting, April 2005)

30
Table 6. Framatome ANP GmbHMain Causes of BWR Fuel Failures in 1996-2004
(H.-P. Fuchs, report to the IAEA TWGFT Meeting, April 2005)
-21 %Fabrication assumed
50 %5 %No examination performed
50 %11 %Unknown after examination
-8 %PCI (non-liner clad)
-55 %Debris fretting
20041996-2004Cause of failure

31
FIG. 16. Total Defective Fuel Assemblies status (up to end of 2004) and origins of the failures (French report to the
IAEA 2005 TWGFPT meeting)Non Identified
Causes59%
100%Failed F/A
Debris induced wear fretting 39.5%
Baffle Jetting 7.1%
Fretting at spacer grid 45.9%
Fabrication 7.5%
IdentifiedCauses41%
BASIC DESIGN DEPARTMENTNUCLEAR FUEL BRANCH

32
Fretting wear marks under SG, WWER-440, A. Smirnov, IAEA-TECDOC-1345

33
Debris related fretting damage to WWER-440 fuel rods, V. Chirkov, IAEA-TECDOC-1345

34
DEVELOPMENT OF THE FILTER CONCEPT FOR WWER-440 FAs
35
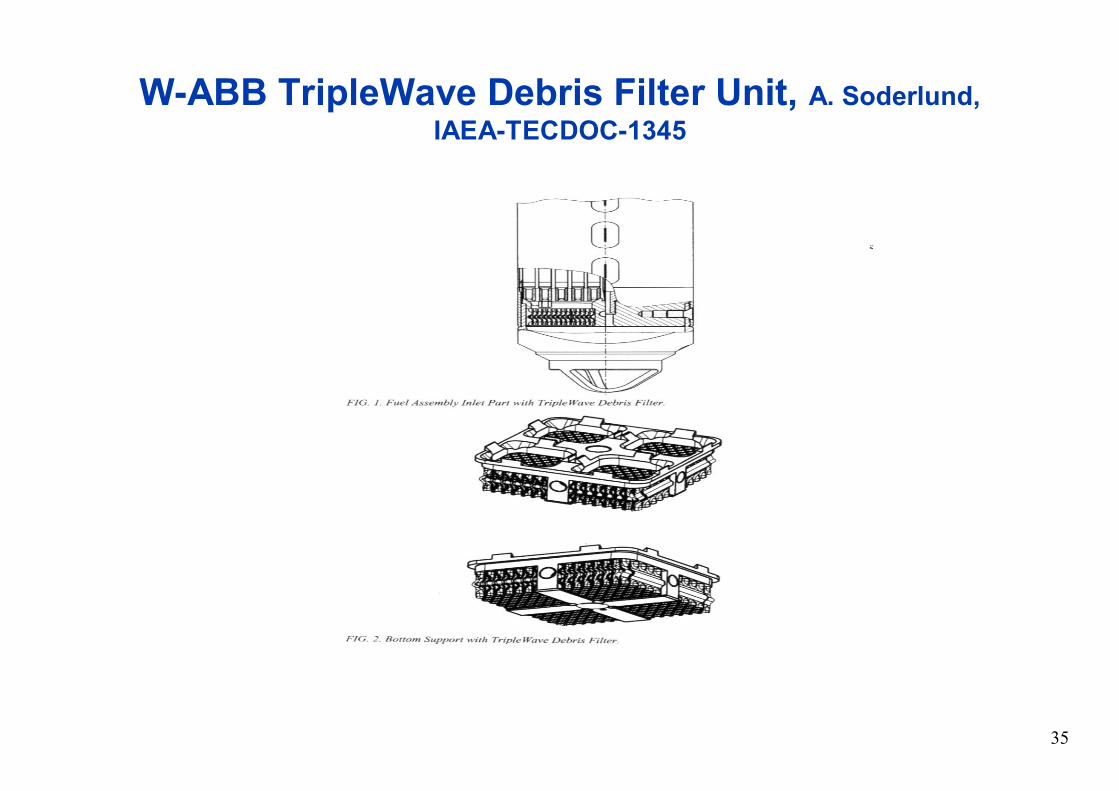
W-ABB TripleWave Debris Filter Unit, A. Soderlund, IAEA-TECDOC-1345
36
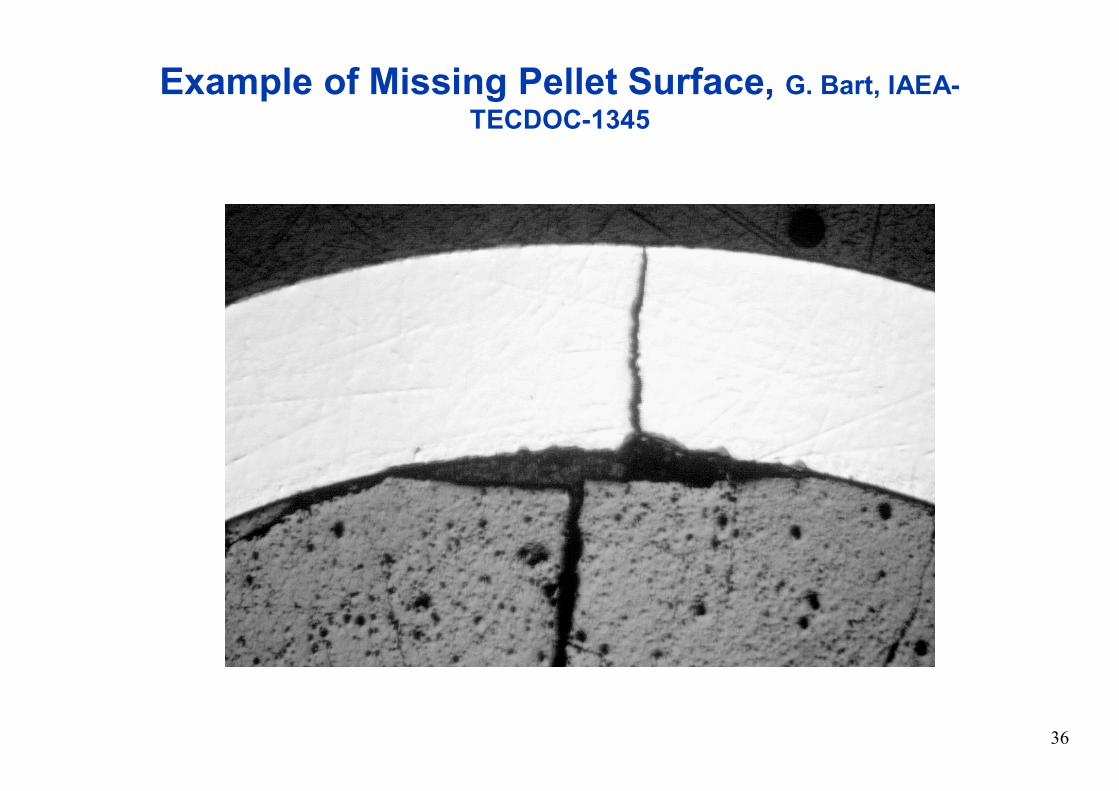
Example of Missing Pellet Surface, G. Bart, IAEA-TECDOC-1345

37
Example of Massive Hydride (Sun Burst), V. Likhanskii, IAEA-TECDOC-1345

38
Some cases of “mass” fuel failures in LWRs
8 FAs in Angra-1 PWR in 1997, Brazil: FR-SG fretting wear, vibration, inadequate spring mechanical properties
19 FRs in 10 FAs, North Anna-1 (USA) in 1998: FR-SG fretting wear, vibration in core periphery
44 FAs in German LWRs in 1995: FR-SG fretting wear, vibration, isolated cases
Several FAs with bimetallic springs in German reactors in 1995: Stress-Corrosion Cracking of Inconel springs пружин
3 FAs in Khmelnitski NPP, Ukraine in 1995: 50 ррм oxygen in primary circuit
7 FAs in Loviisa-2 NPP: corrosion crud deposition after decontamination in 1995

39
Fuel fretting damage at Angra-1, Cycle 4
Deflector VaneGrid side-strip
FuelRodFretting Marks
A1
Lower end plug of fuel rod A1 fretted away Slipped Fuel Rods

40
Case of “mass” fuel failure in PWR Cattenom-3 (EdF, France) in 2001(1)
• Grid-to-rod fretting due to fuel rod vibration remains as a significant cause of fuel failure and is responsible for one quarter of PWR fuel failures. Such failures were observed last year. 28 AFA 2G fuel assemblies developed 92 leaking fuel rods during cycle 8 of Cattenom 3 (a French nuclear plant). After the outage in early 2001, fuel examinations were performed and it was determined that the primary failures were caused by spacer grid fretting wear under the lower grid and then-secondary failure with big transversal cracks and significant activity release. Studies and hydraulic testing are still under way to fully understand the root cause.

41
Case of “mass” fuel failure in PWR Cattenom-3 (EdF, France) in 2001 (2)
• This grid-to-rod fretting is partially due to Cattenom 3 high cross flow causing rod vibration and partially to the long residence time of some of the fuel assemblies in the most demanding positions. Cattenom 3 is a 4- loop 14 foot core plant utilizing long (18 month) irradiation cycles with a load follow and frequency control operation. To guard against the vibration that led to fretting in Cattenom, Framatome-ANP design and manufacturing departments have devised a new assembly design with a second spacer grid at the bottom of the assembly to give it more stability. Loading these FAswill start in Fall 2002.

42
Possible FR failure mechanism in PWR Cattenom-3 (EdF) in 2001 (1)
• This might be secondary hydriding of PWR cladding with formation of transversal cracks of “sun burst”/blister type. The difference from long axial splits (observed sometimes in BWRs) is that their formation is not caused by power ramps and may happen at medium/low burnups and constant power. Sometimes reduction of power promotes water ingress in the primary defect (usually caused by debris fretting) and rather quick reaching the critical hydrogen concentration in the middle part of the FR and formation of transversal crack when going to nominal power.
• The cause of primary defect formation might be FR-SG fretting due to vibration in the area of the lower grid.

43
FIG. 17 Possible FR failure mechanism in PWR Cattenom-3 (EdF) in 2001 (2)

44
Scheme of Secondary Hydriding Damage in PWR Fuel Rod Based on PIE, Y.-S. Kim, IAEA-TECDOC-1345

45
Difference between fuel failure rates in WWER-440s of V-230 (old design) and V-213 (newer design) – (1)
FIG. 18. Rates (1.5 ppm in average) for WWER-440s of V-230 design in 1997-2001 (V. Chirkov, Report to the IAEA TM, Bratislava,
2002, IAEA-TECDOC-1345)
0.00E+00
1.00E-04
2.00E-04
3.00E-04
LEAK
ING
RAT
E
1997
1998
1999
2000
2001
NPP"Mochovce"-1
NPP"Mochov ce"-2
NPP"Bohunice"-3
NPP"Dukov any"-1
NPP"Dukov any"-2
NPP"Dukovany"-3
NPP"Paks"-1
NPP"Paks"-2
NPP"Paks"-3
NPP"Paks"-4
NPP"Bohunice"-4
NPP"Dukov any"-4
NPP"Lov iisa"-1
NPP"Loviisa"-2
R=L/NR - annual share of leakagesL - quantity of leaking fuel rods N - q-ty of fuel rods in the core * - considered on condition that: 1 leaking fuel rod for 1 leaking fuel assembly

46
Difference between fuel failure rates in WWER-440s of V-230 (old design) and V-213 (newer design) – (2)
FIG. 19. Rates for Bohunice NPP with Units 1-2 of V-230 design (80 ppm) and Units 3-4 of V-213 design (3 ppm) in 1986-2001
(М. Kacmar, Report to the IAEA TM, 2002, IAEA-TECDOC-1345)
1986
1988
1990
1992
1994
1996
1998
2000
Unit 3
Unit 10
1
2
3
4
5
Year
Unit 3 Unit 4Unit 1Unit 2
No.
of L
eaki
ng F
uel A
ssem
blie
s

47
Difference between fuel failure rates in WWER-440s of V-230 (old design) and V-213 (newer design) – (3)
(М. Kacmar, Report to the IAEA TM, 2002, IAEA-TECDOC-1345)
• Increasing of the assembly and rod average power in consequence dummy assemblies implementation in V-230 Units.• Different shape of V-230 basket bottom compare with V-213 Units.• Different fuel assembly flow rates at V-230 Units compared with V- 213 Units. Increased coolant flow at fuel assembles of V-230 Units.• Rigid connection of the basket with its bottom at Unit V-230
• Position next to 6th group of control assemblies increases probability of fuel damage.

48
Ringhals (PWR) approach to mitigation of fuel failures, T. Andersson,
Report to the IAEA TM, 2002, IAEA-TECDOC-1345)
•

49
Major fuel-related phenomena limiting LWR fuel reliability and safety margins at present operation conditions (1)
• LWR fuel corrosion and crud deposition:– Need to reduce cladding corrosion rate and– Optimization of water chemistry to reduce cladding deposition rate and
transport of corrosion products• Pellet-Cladding Interaction:
– Fission gas release (FGR), need to reduce FGR– Rim layer formation and growth; its impact is unclear– Fuel creep and plasticity-need to increase– Need to lower degradation rate of cladding mechanical properties (plasticity
and creep)– Need to increase cladding crack initiation period and lower crack propagation
rate

50
Major fuel-related phenomena limiting LWR fuel reliability and safety margins at present operation
conditions (2)• PWR / WWER fuel assembly mechanical stability at normal operation
conditions – Need to improve fuel assembly (FA) rigidity to decrease FA bow/twist
amplitude and maintain Rod Control Cluster Assembly (RCCA) drop time in allowed limits
• PWR / WWER fuel assembly mechanical stability at accident operation conditions – Need to improve modeling of FA and core lateral displacement/stability at
seismic loads– Need for experiments evaluating lateral displacements of highly burnt FAs/core
at seismic loads

51
What phenomena may limit reliability and safety margins of Advanced LWRs at BUs near 100 GWd/t U
• Too high pressure of fission products on cladding-high PCI• Too high radiation embrittlement of cladding, also because of
aggressive fission products-high PCI• Fuel column may loose plasticity-high PCI• Too high cladding corrosion rate• Too thick deposits on cladding, cooling violation • Increase of concentration of burnable absorbers in fuel may result in
raising fuel temperature• Shrinkage of fuel safety margins regarding accident conditions
(LOCA and RIA)• Insufficient FA stiffness is possible
52
IAEA activities in the area of fuel failure analysis
• Significant role of the Technical Working Group on Water Reactor Fuel Performance and Technology (TWGFPT)
• Technical Meeting on Fuel Failure in Normal Operation of Water Reactors: Experience, Mechanisms and Management in 1992 (Dimitrovgrad, Russian Federation)
• TRS 388 entitled “Review on Fuel Failures in Water Cooled Reactors” in 1998
• Report “Survey on Fuel Failures in Water Cooled Power Reactors in 1995-98 (CANDUs, BWRs, PWRs and WWERs)” in 2000
• Technical Meeting on Fuel Failure in Water Reactors: Causes and Mitigation in June 2002 (Bratislava, Slovakia)

53
IAEA activities in 2005-2006 directed on better understanding of mechanism of radiation damage of LWR
fuel and structural materials at high burnups
• Cladding water-side corrosion, crud deposition - start of FUWAC CRP (Water chemistry-corrosion at high burnup and in ageing plants)
• Cladding embrittlement – Delayed Hydrogen Cracking CRP • FGR and PCI (only part depending on fuel column) – Preparation of
monograph on UO2 in 2006-2007• Radiation embrittlement of cladding – publication of monograph on
Zr alloys in 2006 • FGR and PCI – finalization of FUMEX-II (fuel performance modeling)
CRP and start of FUMEX-III (fuel performance modeling at high burnup) CRP in 2006-2007. Preparation of monograph on UO2 in 2006-2007
• Mechanical stability of FAs - publication of TECDOC-1454 in 2005