analysis of financial results september 2020
TRANSCRIPT

Analysis of Financial Results
September 2020
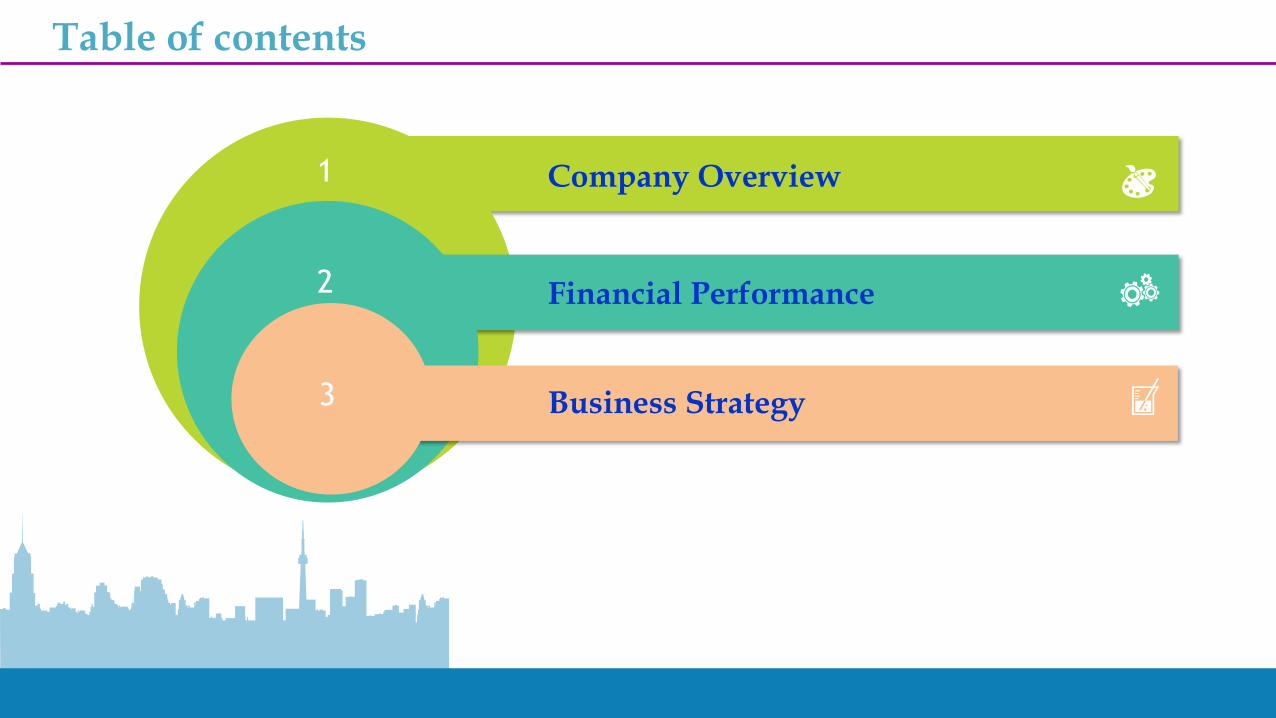
Table of contents
1 Company Overview
2 Financial Performance
Business Strategy3

Company Overview
Time tested Bank with over 96 years of banking history.
Pan-India footprint.
Robust technology and digital platforms.
Strong productivity & capital adequacy ratios.
Experienced management team & Professional Board.
Highest Standards of Corporate Governance.
Powered by KBL – VIKAAS for Total Transformation.
Consistent track record of profit since inception.
01
02
03
04
05
06
07
08

1924
1960-66
Incorporated on 18th February 1924 at Mangalore by Late B R Vyasarayachar & other leading members of the South Kanara Region
Took over Sringeri Sharada Bank Ltd, Chitaldurg Bank & Bank of Karnataka, Hubli.
Public issue of 45 lakh equity shares in October 1995 Became an authorised dealer of foreign exchange in 1977
1977-96
1997-2002 Implementation of “Finacle” CBS in 2000
2002-06
2007-11
2012-16
2017-20
Floated general insurance JV along with Allahabad Bank, Indian Overseas Bank, Dabur Investments and Sompo Japan Insurance. Launched CDSL-DP services at select branches . Rights issue in the ratio of 2:1 to raise ` 160 crs. Right issue in the ratio of 1:2. Bancassurance tie-up with MetLife. Maiden bonus issue in the ratio of 1:1
Right issue of ` 457.03 crore in the ratio of 2:5. Launched Online Trading facility. Maiden QIP aggregating ` 160.83 crs. Completion of 100% core banking
Completed 1:2 rights issue to raise ` 658.96 crs. Unveiled KBL – VISION 2020 & adopted Vision Statement. No. of branches crossed 500 & No. of ATMs crossed 1,000. Secured ISO 27001 : 2005 Certificate from NQA.. Launched ASBA facility
Digital journey for retail products Bonus issue in the ratio of 1:10 Successful migration to Fin10 Customer base crossed the milestone of 1 crore. Business turnover crossed the historic milestone of ` 1,00,000 crore. Formed Investor Relation Cell.
History

Evolution
Offers wide variety of banking products
` 127,028 Cr business turnover
First generation
private sector Bank
2,347 Outlets all over India
• Business Turnover of ` 1,27,028 crore as
on 30.09.2020.
• Networth of ` 6,476 crore as on
30.09.2020.
• 2,347 service outlets with 859 branches,
1 Extension Counter, 1,016 ATMs and 471
recyclers in 554 centres across India as on
30.09.2020. And, 37 e-Lobbies & 421 mini
e-Lobbies, all are having Recyclers.
• Offers wide variety of corporate and
retail banking products and services to
over 11 million customers.
• Incorporated in 1924, one of the oldest
time tested private sector Banks.
Digital loan initiatives & Tab Banking
for SB a/c opening launched

Pan-India footprint
28%
26%
23%
23%
Metro Urban Semi Urban Rural
Area wise distribution of Branches
25
21
2
5
21
7
16
8
3
538
21
7
52
8
1
7
9
50
10
4
20
1725
41
1
Has the strongest presence in South India with 676 branches
Top 5 States:Karnataka (538), Maharashtra (52), Tamilnadu (50), Andhra Pradesh (41), Telangana (25) 0
200
400
600
800
1000
1200
Sept '19 Mar '20 Sept '20
840 848 859
10841026 1016
420 454 471
Branches ATMs Recyclers

Pioneer in implementing
“Finacle” (CBS) amongst
the first generation
private sector banks
Implemented Lending Automation Processing System (LAPS) software for efficient life cycle management of loan accounts and improved monitoring.
Established Centralized Account Opening Cell for opening of CASA.
Implemented an Enterprise Level Fraud Risk Management System (ELFRMS) for effective, cyber fraud prevention across delivery channels.
Established DCOE for better TAT & risk management of loan process.
State-of-art IT set up
which has enabled
Anytime Anywhere
Banking through alternate
delivery channels such as
ATMs, VISA International
Debit Card, RUPAY Debit
Card, Internet Banking,
Mobile Banking, IMPS,
e-lobby etc.
Implemented ‘KBL-
Mobile Plus’ (Mobile
Banking) app, ‘BHIM
KBL UPI’ app on Unified
Payment Interface,
Cardless cash withdrawal,
switch on/off debit card
usage, enable/disable
international transactions,
etc. as additional facilities
for the convenience of
customers
Digital sanction of Home
loans, Personal loans, Car
loans, 2-wheeler loans &
MSME loans.
Opening of Savings
accounts with pre-activated
debit card, through Tab
provided to branches .
Digital sales of insurance
policies through Mobile
Banking and Internet
Banking platform.
Sales of Mutual Fund
products of all the AMCs in
a single platform
‘FISDOM’.
Robust technology and digital platforms
Strong technology platform
The existing “ISO 27001:2013” certificate encompassing the
Information Security Management System (ISMS) at the
Bank’s Data Centre, Near line Site [NLS] at Bengaluru and
Information Technology Department including the DR site
[IT & DR] at Head Office, Mangaluru, has been renewed by
AJA Registrars, UK, for a further period of three years up to
March 2022, reflecting the Bank’s continued commitment to
technology adoption.

8
Effective Risk management systems
2
3
4
1
5
Periodical monitoring & reviewing of risk profile of the bank.
Internal Credit Rating of all the borrowers: Credit exposure above INR 25 lakh are rated borrower-wise and
credit facilities below INR 25 lakh & all schematic advances including agri-credit proposals are rated under
‘Pool based approach’.
Continuous offsite surveillance of borrower accounts.
Effective ALM/mid office set up to monitor Liquidity risk/ Market risk on a continuous basis.
Enterprise level fraud risk management system to effectively control / prevent online suspicious transactions
done by customers & other digital channel transactions.
7
8
6 Effective Operational risk management by:
o building up a database of internal Loss data, near- miss cases and other Operational risk events, since Sept 2007.
o AML monitoring system to scrutinize the customer transactions to ensure compliance to the extant guidelines.
Moving towards migration to ‘Basel II advanced approaches’ under Credit, Market and Operational Risk and
also complied with the extant ‘Basel III’ guidelines of RBI.
Implemented a scientific Fund Transfer Pricing (FTP) & Customer Profitability Management System (CPMS)
to assess the performance of branches / products / portfolios / customers.
9 Centralized Payments and Reconciliation Cell (CPRC) to handle Reconciliation, Settlement and Disputes of all DigitalChannels transactions.

9
Financial strength of the Bank
Networth (` crs)
0
1000
2000
3000
4000
5000
6000
Sept '19 Mar '20 Sept '20
283 311 311
5,665 5,659 6,165
5,948 5,970 6,476
ReservesCapital

Highlights – Q2 FY21
KPAs Q2 FY 21 * Q2 FY 20 H1 FY 21 * H1 FY 20
Turnover 1,27,028 1,23,658 1,27,028 1,23,658
Asset size 83,389 80,166 83,389 80,166
Operating profit 500.34 413.43 1,177.38 763.44
Net profit 119.35 105.91 315.73 281.33
Return on Asset 0.56% 0.53% 0.75% 0.70%
Earning per Share (not annualized) 3.84 3.41 10.16 9.05
Return on Equity 7.45% 7.12% 10.15% 9.59%
Net Interest Income 574.87 498.72 1,109.99 993.31
Net Interest Margin 3.08% 2.82% 2.99% 2.80%
Gross NPA 3.97% 4.78% 3.97% 4.78%
Net NPA 2.21% 3.48% 2.21% 3.48%
Cost to Income 44.68% 46.41% 39.89% 48.28%
CRAR (Basel III) 13.08% 12.64% 13.08% 12.64%
(` crs)
3 Months 6 Months
* Data pertain to Consolidated balance sheet, as full fledged business of newly formed subsidiary is yet to be fully operationalized.

Return and Capital Adequacy Ratios
Return on Equity (%) (after tax) Return on Assets (%) (after tax)
Capital Adequacy (%) - Basel III
0.70%
0.53%
0.75%
0.00%
0.10%
0.20%
0.30%
0.40%
0.50%
0.60%
0.70%
0.80%
Sept '19 Mar '20 Sept '20
10.64 10.66 11.08
2.00 2.00 2.00
12.64 12.6613.08
0
2
4
6
8
10
12
14
Sept '19 Mar '20 Sept '20
Tier I Tier II Total CRAR
9.59%
7.35%
10.15%
0.00%
2.00%
4.00%
6.00%
8.00%
10.00%
12.00%
Sept '19 Mar '20 Sept '20

Productivity ratios
Operating Profit per employee (` lakh) * Operating Profit per branch (` lakh) *
Business per employee (` crs) Business per branch (` crs)
0
5
10
15
20
25
30
Sept '19 Mar '20 Sept '20
18.4419.48
27.99
0
50
100
150
200
250
300
Sept '19 Mar '20 Sept '20
181.77 195.37
274.13
0
5
10
15
20
Sept '19 Mar '20 Sept '20
14.93 15.14 15.10
0
50
100
150
200
Sept '19 Mar '20 Sept '20
147.2 151.8 147.9
* annualized

13
Financial Performance

Income & Profit - QuarterlyNet Income (` crs) Operating and Net Profit (` crs)
Net Interest Margins (%) Cost to Income Ratio (%)
499 529 575
273
407 330
771
936 905
0
100
200
300
400
500
600
700
800
900
1000
Sept '19 Mar '20 Sept '20
Net Interest Income Other Income Total Income
0
100
200
300
400
500
600
Sept '19 Mar '20 Sept '20
413 392
500
106
27119
Operating profit Net profit
2.82% 2.86%3.08%
0.00%
1.00%
2.00%
3.00%
4.00%
Sept '19 Mar '20 Sept '20
46.41%
58.17%
44.68%
0%
10%
20%
30%
40%
50%
60%
70%
Sept '19 Mar '20 Sept '20

15
Business size
Business Turnover (` crs)
0
20000
40000
60000
80000
100000
120000
Sept '19 Mar '20 Sept '20
70,190 71,785 72,929
53,468 56,964 54,099
123,658 128,749 127,028
AdvancesDeposits

Deposits
Deposits (` crs)
* Wholesale deposits = Purchase liability + Certificates of deposit + Interbank deposits
Cost of Deposits
Growth rate
11.2
4%
12.0
2%
9.8
7%
8.0
4%
5.9
2%
4.8
7%
10.5
6%
1.5
0% 3.9
0%
0%
2%
4%
6%
8%
10%
12%
14%
CASA deposit Retail deposit Total deposit
Sept '19 Mar '20 Sept '20
0%
1%
2%
3%
4%
5%
6%
7%
Sept '19 Mar '20 Sept '20
6.07% 6.01%5.54%
Sept '19 Mar '20 Sept '20
27.41% 28.91% 29.17%
72.47% 71.02% 70.79%
0.12% 0.07% 0.04%
CASA Retail Wholesale deposits *
70,190 71,785 72,929

4,366 4,438 4,457
6.22% 6.18% 6.11%
0
500
1000
1500
2000
2500
3000
3500
4000
4500
5000
0%
1%
2%
3%
4%
5%
6%
7%
Sept '19 Mar '20 Sept '20
Amount %
DepositsDeposits
NRI Deposits (` crs)
Domestic deposits93.89%
NRI deposits6.11%

Advances
Advances [Net] (` crs)Growth rate
11
.90
%
10.4
9%
-5.2
6% 7.0
0%
10.6
4%
11.4
4%
-11.2
6%
3.9
0%
8.5
3%
16
.52
%
1.1
8%
-20.00%
-15.00%
-10.00%
-5.00%
0.00%
5.00%
10.00%
15.00%
20.00%
Retail advances Mid Corporateadvances
Corporateadvances
Total Advances
Sept '19 Mar '20 Sept '20
Sept '19 Mar '20 Sept '20
46.39% 45.49% 49.52%
28.39% 28.71%32.53%
25.22% 25.80% 17.95%
Corporate (> 100 crore)
Mid Corporate (> 5 crore & upto 100 crore)
Retail (upto 5 crore)
53,468 56,964 54,099

AdvancesSegmentation of Gross Advances (Sept ‘20)
* However, this works out to 15.85% of the ANBC.
Agriculture *12.70%
Micro-Small Ent.21.23%
Medium Ent.3.65%
Large Ent.10.41%
Housing17.12%
Other Personal loans0.96%
Infra4.76%
NBFC **8.75%
CRE4.07%
LRD5.99%
Others10.36%
* NBFCs excluding Agri & MSMEs.

Advances
Trend on moratorium portfolio…
Quarter-on-quarter progress (both in terms of % of value and number of accounts) segment-wise:
Category
Mar'20 June'20 Sept'20
Number-wise (%)
O/s. Amount-wise (%)
Number-wise (%)
O/s. Amount-wise (%)
Number-wise (%)
O/s. Amount-wise (%)
Agri 4.77% 30.86% 22.35% 46.85% 5.61% 5.48%
Micro Small 66.52% 77.50% 70.11% 69.76% 17.63% 8.75%
Medium 70.27% 76.39% 76.09% 62.40% 10.72% 11.99%
Retail 31.31% 25.93% 47.04% 54.89% 4.34% 14.28%
Corporate 54.37% 38.53% 65.78% 38.82% 13.74% 11.79%
Grand Total 21.83% 42.81% 37.22% 51.15% 5.93% 11.40%

21
AdvancesExternal rating wise Credit Portfolio as of Sept ‘20
[ Figures in brackets – as of Sept ‘19]
RatingNo of
Borrowers
Balance O/s
(in cr)
% to GBC
Of which, NPA SMA2 borrowers availed Moratorium
no. of borrowers
Bal o/s (cr)
no. of borrowers
Bal o/s (cr)
no. of borrowers
Bal o/s (cr)
% share to Std. Adv. *
AAA19
(16)4,467
(5,365)8.10
(9.89)- - - - - - -
AA29
(36)2,859
(5,171)5.19
(9.53)- - - - 1 73 2.55
A42
(39)1,572
(1,641)2.85
(3.03)- - - - 4 283 17.99
BBB78
(79)2,198
(2,120)3.99
(3.91)- - - - 9 196 8.92
BB50
(90)1,005
(1,555)1.82
(2.87)-
(4)-
(110)- - 4 97 9.66
B13
(42)428
(793)0.78
(1.46)-
(2)-
(85)- - - - -
C1
(1)6
(27)0.01
(0.05)-
(1)-
(27)- - - - -
D9
(28)586
(1,125)1.06
(2.07)4
(13)371
(606)- - 3 130 60.59
Total241
(331)13,121
(17,798)23.79
(32.82)4
(20)371
(828)- - 21 779 6.11
Gross Bank Credit: ` 55,142 crore (prev.yr: ` 54,234 crore). * Under respective rating category

22
AdvancesExternal rating wise NBFC Portfolio as of Sept ‘20
RatingNo of
Borrowers
Balance O/s
(in cr)
% to GBC
Of which, NPA SMA2 borrowers availed Moratorium
no. of borrowers
Bal o/s (cr)
no. of borrowers
Bal o/s (cr)
no. of borrowers
Bal o/s (cr)
% share to Std. Adv. *
AAA 14 2,881 5.22 - - - - - - -
AA 17 2,113 3.83 - - - - - - -
A 14 343 0.62 - - - - - - -
BBB 3 30 0.05 - - - - - - -
BB 1 14 0.02 - - - - - - -
B - - - - - - - - - -
C - - - - - - - - - -
D 2 149 0.27 2 149 - - - - -
Unrated 3 27 0.05 1 23 - - - - -
Total 54 5,557 10.08 3 172 - - - - -
* Under respective rating category

23
Advances
External rating wise Top 50 borrowers as of Sept ‘20
RatingNo of
Borrowers
Balance O/s
(in cr)
% to GBC
Of which, NPA SMA2 borrowers availed Moratorium
no. of borrowers
Bal o/s (cr)
no. of borrowers
Bal o/s (cr)
no. of borrowers
Bal o/s (cr)
% share to Std. Adv. *
AAA 13 4,188 7.60 - - - - - - -
AA 9 2,030 3.68 - - - - - - -
A 6 583 1.06 - - - - 1 85 14.67
BBB 8 832 1.51 - - - - 1 36 4.51
BB 2 116 0.21 - - - - - - -
B 1 303 0.55 - - - - - - -
C - - - - - - - - - -
D 2 250 0.45 2 250 - - - - -
Unrated 9 1,117 2.03 - - - - - - -
Total 50 9,418 17.08 2 250 - - 2 123 1.31
* Under respective rating category
Advances
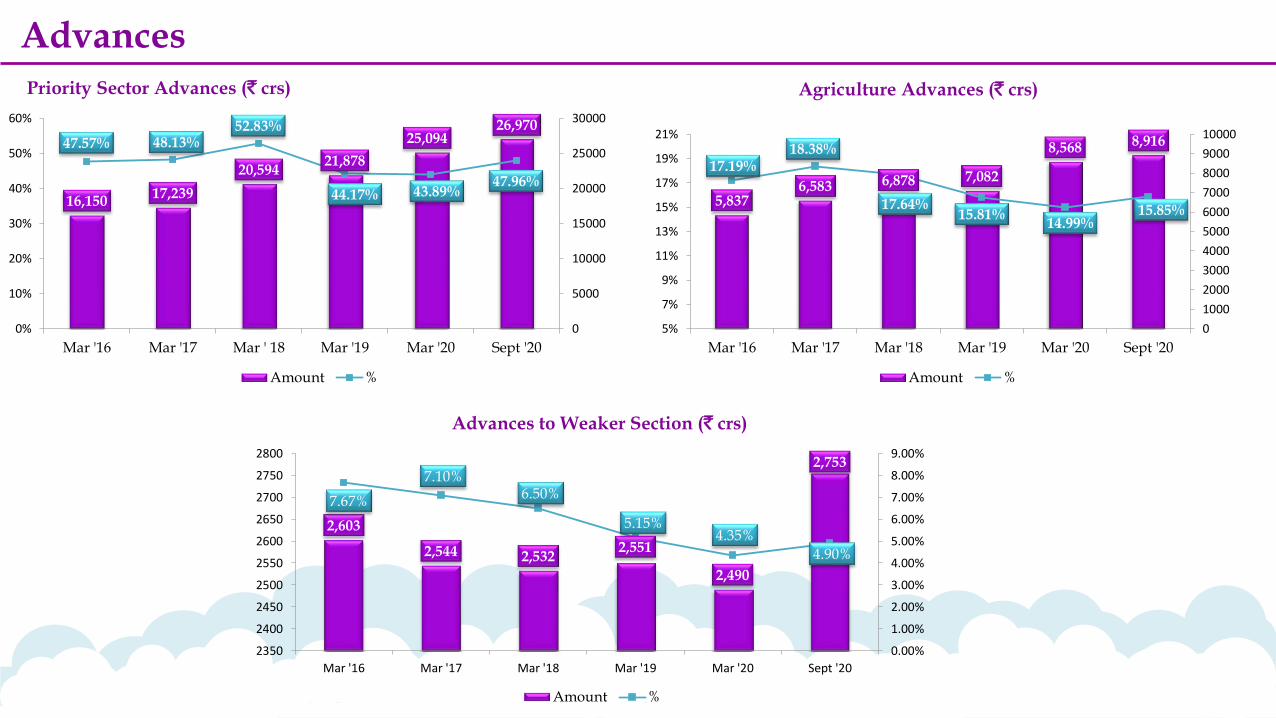
Priority Sector Advances (` crs) Agriculture Advances (` crs)
Advances to Weaker Section (` crs)
16,15017,239
20,59421,878
25,09426,970
47.57% 48.13%52.83%
44.17% 43.89%47.96%
0%
10%
20%
30%
40%
50%
60%
0
5000
10000
15000
20000
25000
30000
Mar '16 Mar '17 Mar ' 18 Mar '19 Mar '20 Sept '20
Amount %
5,8376,583 6,878 7,082
8,568 8,916
17.19%18.38%
17.64%15.81%
14.99%15.85%
5%
7%
9%
11%
13%
15%
17%
19%
21%
0
1000
2000
3000
4000
5000
6000
7000
8000
9000
10000
Mar '16 Mar '17 Mar '18 Mar '19 Mar '20 Sept '20
Amount %
2,603
2,544 2,5322,551
2,490
2,753
7.67%
7.10%6.50%
5.15%4.35%
4.90%
2350
2400
2450
2500
2550
2600
2650
2700
2750
2800
0.00%
1.00%
2.00%
3.00%
4.00%
5.00%
6.00%
7.00%
8.00%
9.00%
Mar '16 Mar '17 Mar '18 Mar '19 Mar '20 Sept '20
Amount %

Credit Deposit ratio (%)
Yield on Advances & Interest Spread (%)
25
CD Ratio & Yield on Advances
0%
10%
20%
30%
40%
50%
60%
70%
80%
90%
100%
Sept '19 Mar '20 Sept '20
76.18% 79.35%74.18%
55.49%
64.09%
23.02%
CD Ratio
Incremental CD Ratio [Annual]
0%
2%
4%
6%
8%
10%
Sept '19 Mar '20 Sept '20
9.50% 9.47% 9.36%
3.43% 3.46% 3.82%
Yield on advances Interest spread

26
Asset QualityGross NPAs (` crs)
Net NPAs (` crs)
Restructured loans & related accounts
2,5
94
2,8
00
2,1
89
4.78%4.82%
3.97%
0
500
1000
1500
2000
2500
3000
0%
1%
2%
3%
4%
5%
6%
Sept '19 Mar '20 Sept '20
Gross NPA Gross NPA %
1,8
63
1,7
55
1,1
95
3.48% 3.08%
2.21%
0
200
400
600
800
1000
1200
1400
1600
1800
2000
0.00%
0.50%
1.00%
1.50%
2.00%
2.50%
3.00%
3.50%
4.00%
Sept '19 Mar '20 Sept '20
Net NPA Net NPA %
Sep
t '1
9
Ma
r '2
0
Sep
t' 2
0
453 489 524
33
48
121
70 1
23
87
Of which, NPA
Related a/cs
Restructured loans
486
537
645

Asset Quality
Composition of NPA Size wise NPA
27
Sub Standard
28.45%
Doubtful59.34%
Loss Assets12.21%
Upto Rs 1 Cr29.30%
Rs 1 Cr to Rs 5 Cr
20.73%
Rs 5 Cr to Rs 50 Cr
17.87%
Above Rs 50 Cr
32.10%
(3.12%)
(6.89%) (2.79%)
(4.94%)
Figures in brackets represents % share of NPA in respective category
Asset Quality
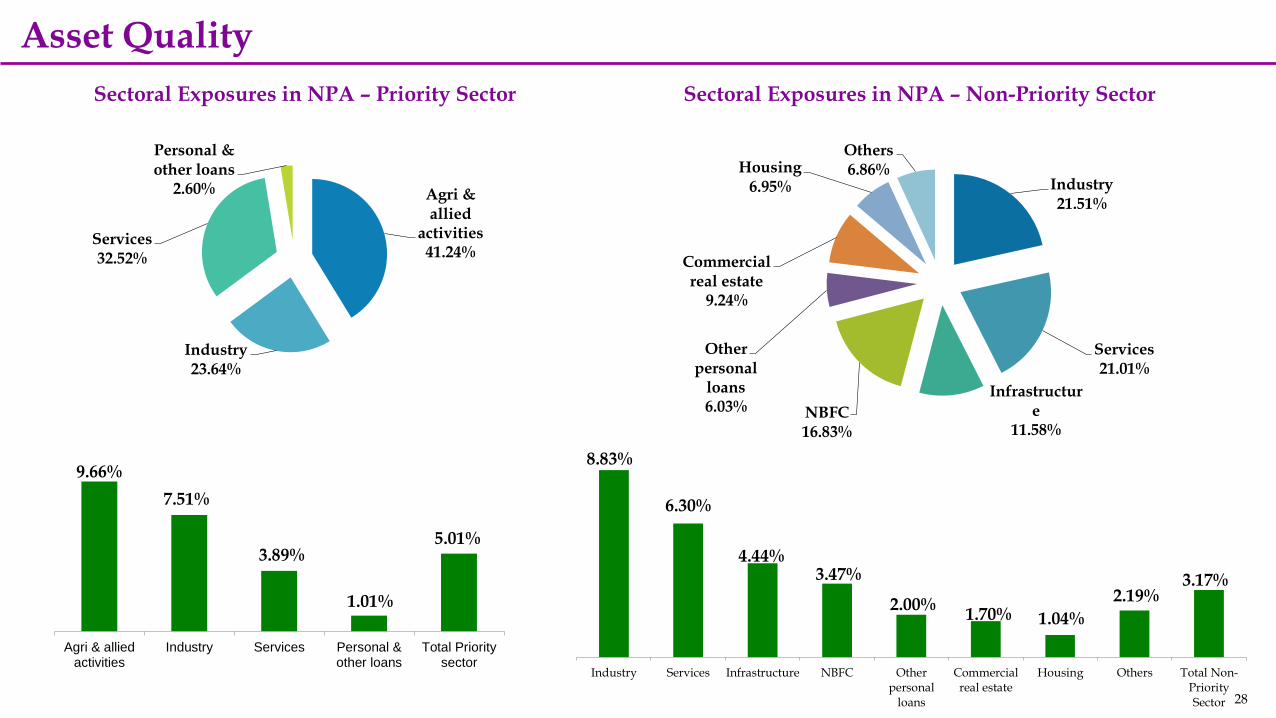
Sectoral Exposures in NPA – Priority Sector Sectoral Exposures in NPA – Non-Priority Sector
28
Agri & allied
activities41.24%
Industry 23.64%
Services32.52%
Personal & other loans
2.60% Industry21.51%
Services21.01%
Infrastructure
11.58%NBFC16.83%
Other personal
loans6.03%
Commercial real estate
9.24%
Housing6.95%
Others6.86%
9.66%
7.51%
3.89%
1.01%
5.01%
Agri & alliedactivities
Industry Services Personal &other loans
Total Prioritysector
8.83%
6.30%
4.44%3.47%
2.00%1.70% 1.04%
2.19%3.17%
Industry Services Infrastructure NBFC Otherpersonal
loans
Commercialreal estate
Housing Others Total Non-PrioritySector

29
Asset Quality
(` crs)FY18 FY19 Q1FY20 Q2FY20 Q3FY20 Q4FY20 FY20 Q1FY21 Q2FY21
Opening GNPA 1581.59 2376.07 2456.38 2437.53 2594.27 2777.46 2456.38 2799.93 2557.64
Addition 2119.87 1447.86 526.02 530.95 637.54 304.07 1998.58 166.84 2.21
Fresh slippages 2088.19 1415.43 525.98 494.80 606.55 304.07 1931.40 155.65 1.49
Slippages from existing NPA accounts 31.68 32.43 0.04 36.15 30.99 0.00 67.18 11.19 0.72
Reduction 1325.39 1367.55 544.87 374.21 454.35 281.60 1655.03 409.13 371.05
Recoveries 431.50 264.80 102.39 74.99 70.74 74.77 322.87 33.89 137.46
Upgradation 178.14 203.48 51.97 70.69 56.29 62.37 241.32 12.40 18.57
Write off 715.75 899.27 390.51 228.53 327.32 144.46 1090.84 362.84 215.02
Closing GNPA 2376.07 2456.38 2437.53 2594.27 2777.46 2799.93 2799.93 2557.64 2188.80
Technical write off Account (cumm) 706.16 1434.27 1760.68 1971.10 2284.07 2172.34 2172.34 2526.83 2674.46
Total GNPA (incl Technical write off) 3082.23 3890.65 4198.21 4565.37 5061.53 4972.27 4972.27 5084.47 4863.26
NPA Provision (cumm) 946.26 810.55 648.36 711.28 687.62 1017.31 1017.31 896.39 960.51
Total Provisions (incl Technical write off) 1652.42 2244.82 2409.04 2682.38 2971.69 3189.65 3189.65 3423.22 3634.97
Closing NNPA 1400.51 1616.71 1759.77 1863.11 2058.04 1755.01 1755.01 1630.65 1194.60
PCR (%) 41.06% 34.18% 27.80% 28.18% 25.90% 37.32% 37.32% 36.24% 45.42%
PCR (%) incl Technical write off 54.56% 58.45% 58.08% 59.19% 59.34% 64.70% 64.70% 67.93% 75.44%
GNPA % 4.92% 4.41% 4.55% 4.78% 4.99% 4.82% 4.82% 4.64% 3.97%
NNPA % 2.96% 2.95% 3.33% 3.48% 3.75% 3.08% 3.08% 3.01% 2.21%
30
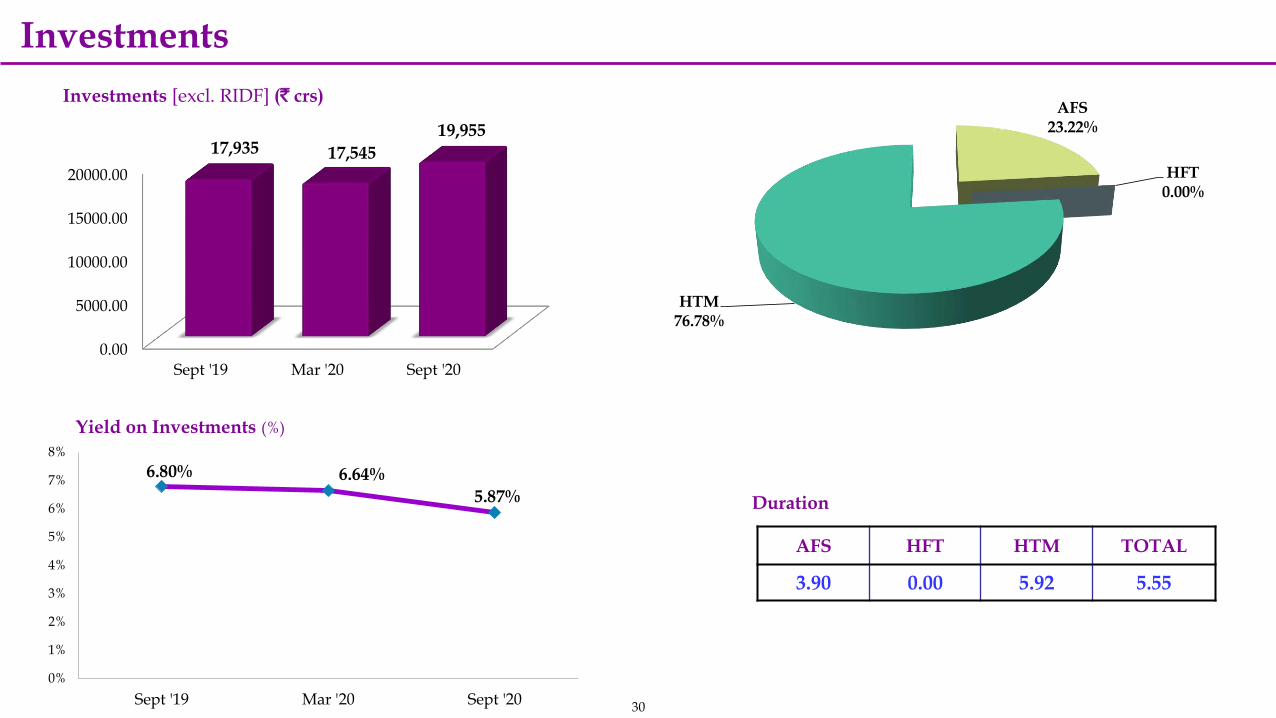
Investments
Investments [excl. RIDF] (` crs)
Yield on Investments (%)
AFS HFT HTM TOTAL
3.90 0.00 5.92 5.55
Duration
0.00
5000.00
10000.00
15000.00
20000.00
Sept '19 Mar '20 Sept '20
17,935 17,545
19,955
AFS23.22%
HFT0.00%
HTM76.78%
6.80% 6.64%
5.87%
0%
1%
2%
3%
4%
5%
6%
7%
8%
Sept '19 Mar '20 Sept '20

31
Deposits & Advances
` crs Sept-20 Mar-20 Sept-19
Total Deposits 72,929 71,785 70,190
CASA Deposits 21,275 20,752 19,243
Retail Deposits 51,629 50,980 50,864
Wholesale Deposits 26 54 83
Total Advances 54,099 56,964 53,468
Priority Sector Advances 26,970 25,094 22,748
Agri Advance 8,916 8,568 7,304
MSME Advances 13,716 12,345 10,380
Advances to Weaker Section 2,753 2,490 2,551
Growth based on y-o-y.

32
Income & Expenditure
` crs Sept-20[6 months]
Sept-19[6 months]
Mar-20[12 months]
Interest Income 3,219 3,214 6,475
Interest Expense 2,109 2,221 4,444
Net Interest Income 1,110 993 2,030
Fee Income 338 419 861
Treasury Income 511 63 400
Non-Interest Income 849 483 1,262
Total Income (Net of Interest Expense) 1,959 1,476 3,292
Operating Expenses 781 713 1,635
Operating Profit 1,177 763 1,657
Provision for loan losses in Adv. / losses in Invts. / Taxes / other 861 482 1,225
Net Profit 316 281 432
Growth based on y-o-y.

33
Interest Income & Interest Expenditure
` crs Sept-20[6 months]
Sept-19[6 months]
Mar-20[12 months]
Interest Income
Interest Income 3,219 3,214 6,475
Interest on Advances 2,593 2,568 5,156
Interest on Investments 551 576 1,160
Other interest 75 70 159
Yield on Advances 9.36% 9.50% 9.47%
Adjusted yield on Invts. 11.04% 7.80% 8.94%
Interest Expense
Interest Expense 2,109 2,221 4,444
Interest on Deposits 1,993 2,091 4,204
Other interest 116 130 240
Cost of Deposits 5.54% 6.07% 6.01%
Net Interest Income
Net Interest Income 1,110 993 2,030
Interest Spread in Lending 3.82% 3.43% 3.46%
Net Interest Margin on average earning assets 2.99% 2.80% 2.84%
Growth based on y-o-y.

Provisions
Provisions & Contingencies
34
Provision Coverage Ratio
NPA82.45%
Fair Value0.65%
Standard Advances
7.91%
Tax3.53%
Investments
5.93%Others-0.47%
69.0
5%
65.9
6%
79.0
6%
99.9
9%
51.1
5%
90.8
4%
54.9
4%
24.8
9%
58.8
8%
41.2
0%
95.3
9%
75.4
4%
0%
20%
40%
60%
80%
100%
120%
MSME Agri LargeEnt
NBFC Housing Infra PersonalLoans
CRE VehicleLoans
LRD Others Total

Sept '19 Mar '20 Sept '20
86.6
6%
87.4
7%
83.0
1%
3.80% 3.43% 6.62%
9.54% 9.10% 10.38%
RWA for Credit risk RWA for Market risk RWA for Operation risk
30.09.2020 31.03.2020 30.09.2019
Risk Weighted Assets 52194.16 52708.33 50276.98
Total Capital Fund (Basel III) 6824.82 6673.60 6356.38
Total Tier I Capital 5780.92 5619.43 5350.83
Paid up Equity Capital 310.88 310.88 282.62
Reserves under Tier I Cap. 5470.04 5308.55 5068.21
Eligible Tier II Capital 1043.89 1054.17 1005.54
General Provisions & Reserves 273.89 284.17 210.54
Subordinated Debt Fund 770.00 770.00 795.00
CRAR under Basel III 13.08% 12.66% 12.64%
CRAR Tier I Capital 11.08% 10.66% 10.64%
CRAR Tier II Capital 2.00% 2.00% 2.00%
RS IN CRS
Capital Adequacy
35
50,277 52,708
Risk Weighted Assets
52,194
0.00
50.00
100.00
150.00
200.00
250.00
Mar '18 Mar '19 Mar '20
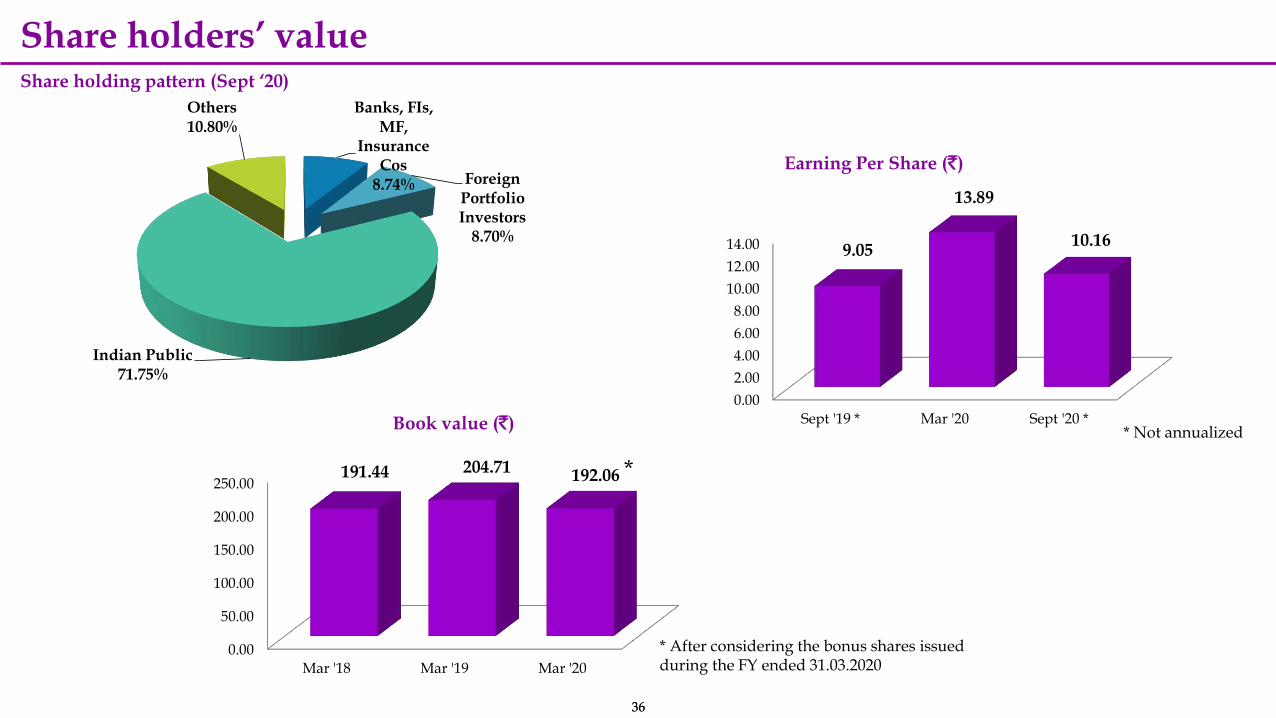
191.44 204.71 192.06
3636
Share holders’ value
Earning Per Share (`)
Book value (`)
Share holding pattern (Sept ‘20)
*
* After considering the bonus shares issued during the FY ended 31.03.2020
Banks, FIs, MF,
Insurance Cos
8.74% Foreign Portfolio Investors
8.70%
Indian Public71.75%
Others10.80%
0.00
2.00
4.00
6.00
8.00
10.00
12.00
14.00
Sept '19 * Mar '20 Sept '20 *
9.05
13.89
10.16
* Not annualized
37
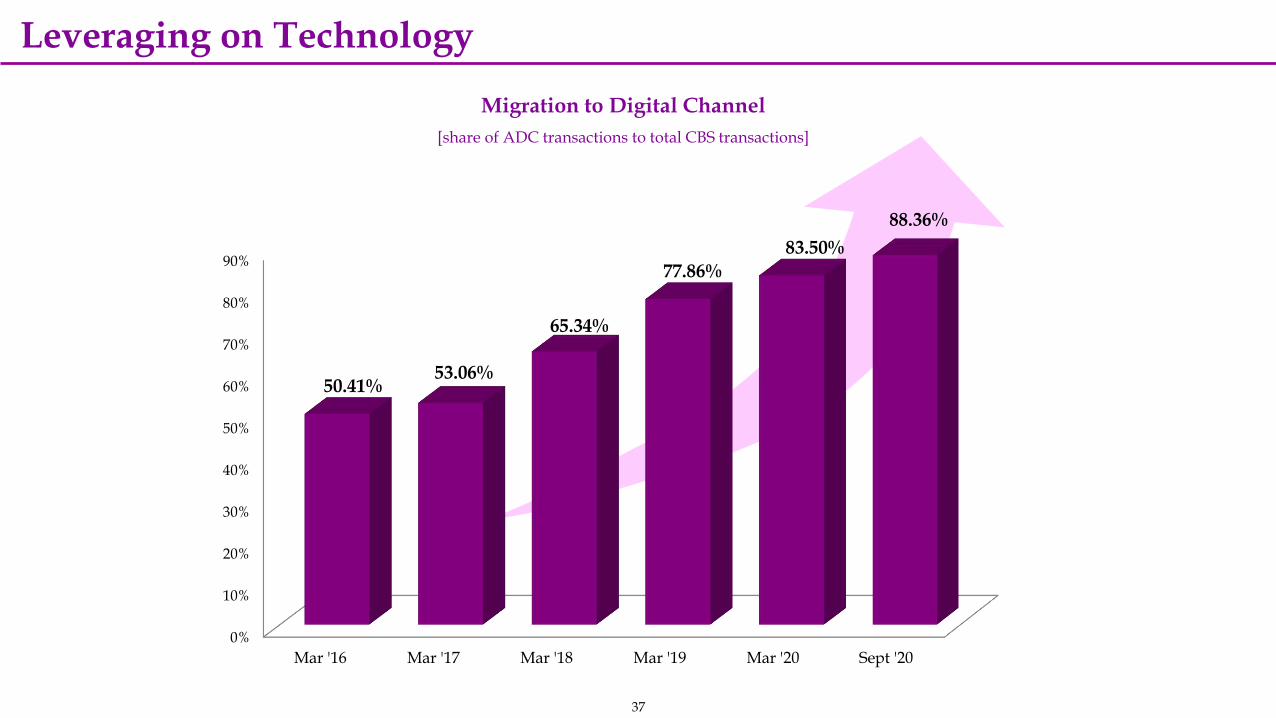
Leveraging on Technology
Migration to Digital Channel
[share of ADC transactions to total CBS transactions]
0%
10%
20%
30%
40%
50%
60%
70%
80%
90%
Mar '16 Mar '17 Mar '18 Mar '19 Mar '20 Sept '20
50.41%53.06%
65.34%
77.86%
83.50%
88.36%

1,7
72,9
02
605,7
60
709,4
02
837
,756
995,3
70
Sep-19 Dec-19 Mar-20 Jun-20 Sep-20
No.of Regd users (Thousands)
38
Mobile Banking
* The decrease in Mobile banking registered users count is on account of blockages of registered user ids in old mobile app as the said service is now stopped.
*
3577
3831
3975
30
48 4
,526
39
42 43
33
49
Sep-19 Dec-19 Mar-20 Jun-20 Sep-20
No. of Transactions (in 000’s)Avg. Transactions per day (in 000’s)
45
84
5088
5568
4,4
02 6
64
7
50
5561
48
72
Sep-19 Dec-19 Mar-20 Jun-20 Sep-20
Value of Transactions (in Cr)
Avg. value of Transactions per day (in Cr)

39
Deb
it c
ard
s P
en
etr
ati
on
Card
s U
sag
e
Debit Cards
Total ATM transactions by our Debit Card holders
42.0
7
43.3
2
45
.15
47
.75
49.2
1
77.23
82.26
83.9585.43
86.25
Sep-19 Dec-19 Mar-20 Jun-20 Sep-20
Total cards issued (Lakhs) Penetration (%)
104 92 109 88 78
114 119113
11596
Sep-19 Dec-19 Mar-20 Jun-20 Sep-20
Shared Network (VISA/NFS) (lakhs) KBL ATM (lakhs)
40
PO
S T
ran
sact
ion
sE
CO
M T
ran
sact
ion
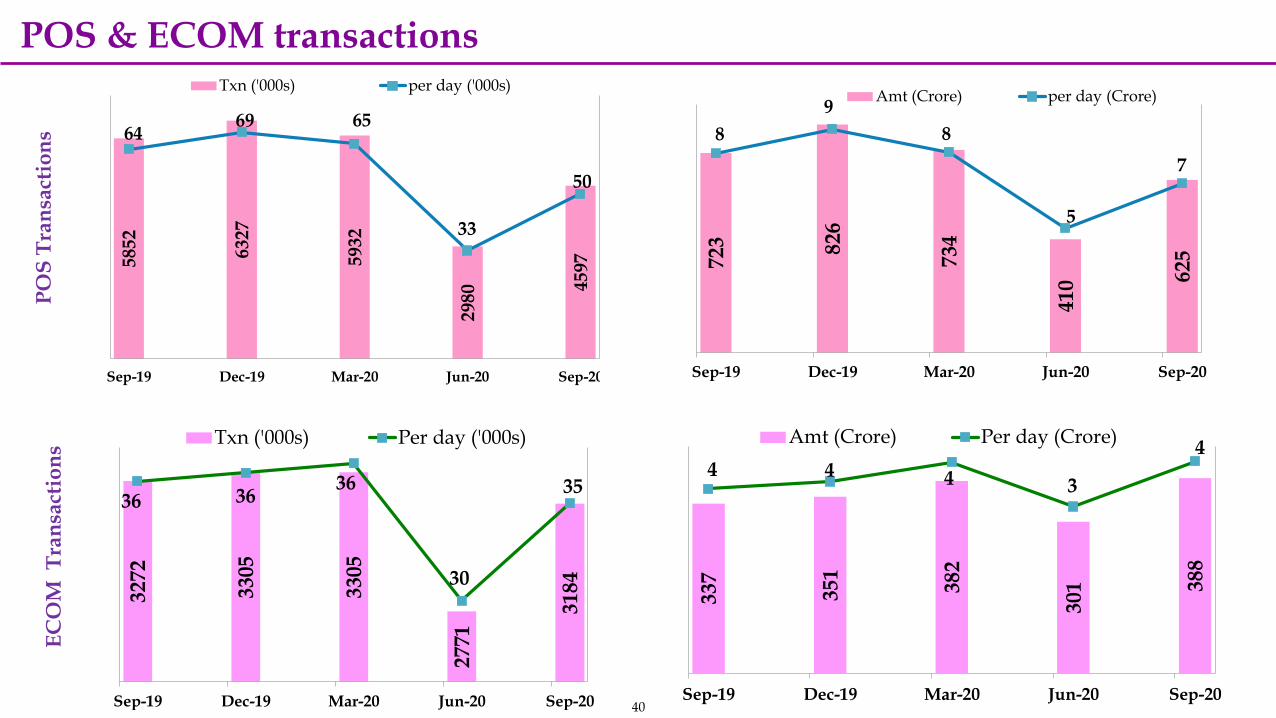
sPOS & ECOM transactions
5852
6327
5932
2980 4
597
6469 65
33
50
Sep-19 Dec-19 Mar-20 Jun-20 Sep-20
Txn ('000s) per day ('000s)
723 826
734
410 6
25
8
9
8
5
7
Sep-19 Dec-19 Mar-20 Jun-20 Sep-20
Amt (Crore) per day (Crore)
3272
3305
3305
2771
3184
36 3636
30
35
Sep-19 Dec-19 Mar-20 Jun-20 Sep-20
Txn ('000s) Per day ('000s)
337
351
382
30
1 388
4 4 4 3
4
Sep-19 Dec-19 Mar-20 Jun-20 Sep-20
Amt (Crore) Per day (Crore)

Corporate Social Responsibility
Handing over PPE Kits sponsored by the Bank toDakshina Kannada, Kodagu, Chickmagaluru & UdupiDistrict Administrations in the fight against COVID-19pandemic.
Handing over 1000numbers of Digitaloximeters sponsored bythe Bank to DakshinaKannada DistrictAdministration in thefight against COVID -19pandemic.
41
Handing over 100numbers of Traffic RainCoats sponsored by theBank to East (Kadri)Police Station,Mangaluru City.

As a part of Transformation journey,
Launched digital journeys, viz., ‘KBL Xpress Home Loan’,
‘KBL Xpress Cash Loan’, ‘KBL Xpress Car Loan’, ‘KBL Xpress
Easy Ride’, ‘KBL Xpress MSME’ & ‘KBL Home Connect’.
Launched Tab banking ‘KBL Xpress Account’ & & ‘KBL
Xpress SB’ for opening of SB accounts in select branches.
Initiated Doorstep banking for senior citizens of above 70
years & differently abled persons.
Launched “KBL FORCE” - an integrated Lead Management
System (LMS) and KBL-FORCE (LMS) Mobile App.
Verticalized Credit Dept. as “Sales vertical” and “Sanctions
vertical”.
Introduced Collection Management System.
Launched “KBL KOLLECT+” – a Collection tool, at Regional
Collection Hubs in all Regions.
Launched NPA Management tool – VASOOL SO-Ft .
Launched Monitoring Excellence Initiatives.
Implemented Employee Satisfaction and Career Development
System [ESCDS] and Key Result Area [KRA].
KBL-Vikaas – Bank’s Transformation Journey
Launched ‘KBL RISE’ – a Performance Management
System for employees.
Opened Bank’s first ‘Digi Branch’ at Bengaluru.
Established Digital Centre of Excellence (DCoE).
Established Contact Center.
Launched an institutional SB product KBL SB-TASC and
salary account schemes with 3 variants viz. KBL Salary
Executive, KBL Salary Prime & KBL Salary Classic.
Introduced Dealer tie up for Auto Loans in all Regions.
Launched a Mutual Fund platform ‘FISDOM’ to offer the
products of all the AMCs to our customers.
Introduced Risk based pricing for Retail Loans and
discount based on the security coverage for selected Retail
products.
Introduced Digital sales of insurance policies through
Mobile Banking and Internet Banking platform.
Participating in TReDS platform.
Launched OD facility against gold ornaments.

43
Business Strategy

A
B
Business Turnover of ` 1,40,000 crore.
To introduce following products & services:
Digitization journey for many more retail loan products,
Further strengthening of sales verticals,
Digital opening of CASA accounts in Web Portal.
Corporate Goal for 2020 -21
COther initiatives:
Fully operationalizing the wholly owned non-financial subsidiary –KBL Services Ltd.,
On-boarding 2nd vendor for Contact Centre activities.
Enhancement of existing Mobile Banking & Internet Banking features

Business Strategy
45
Digital Banking initiatives
Focusing on digital marketing of Bank’s products & services
Digital loan sanctions for HL, PL, Auto loans & other retail loans
Value addition to Bank’s existing Mobile Banking channel
Installation of self service kiosks Comprehensive IT and Digital
Strategy – Requirement of critical applications and IT infrastructure
Para banking activities
encompassing Insurance & Mutual Funds.
Partnering with an efficient call center handling companies for handling service calls for better customer service and handling sales and collection calls for marketing and credit monitoring.
Minimum space maximum business.
Credit augmentation
Focusing on MSME sector Focusing on mid-corporate & retail
sectors Flow based lending and an exclusive
personal loan product.
NPA & Stressed Assets management
Minimizing slippages and improving recovery management.
A comprehensive collection mechanism.
CASA deposits
Focusing on customer onboarding to increase CASA as well as cross selling
RSE approach to CASA marketing. SB account opening through TAB
banking, Web portal.

Thank You
WE EXPRESS OUR HEARTFELT GRATITUDE
TO ALL OUR STAKE HOLDERS FOR THEIR
TRUST & SUPPORT AND SOLICIT THEIR
CONTINUED PATRONAGE, AS WE
CONTINUE OUR JOURNEY WITH RENEWED DEDICATION &
COMMITMENT TO MAKE OUR BELOVED KARNATAKA BANK A
FINANCIAL POWER HOUSE.

Board of Directors
P Jayarama Bhat
Non Executive Chairman
47
Rammohan Rao Belle Bengaluru
Former MD & CEO, SBI Gen. Insu. Co. Ltd
U R Bhat
Mumbai
Investment Adviser & Columnist
Keshav Krishnarao Desai
Hubballi
Businessman
D. Surendra Kumar,
Shri Kshethra Dharmastala,
Dakshina Kannada
Educationist
Mahabaleshwara M S
Managing Director & CEO
Mrs Mythily Ramesh,
Bengaluru
IT Professional and Co-Founder & CEO of NextWealth
B R Ashok
Chartered Accountant
Partner in M/s. MSKC & Associates, Chartered Accountant, Chennai
Justice A V Chandrashekar
Bengaluru
Former Judge, High Court of Karnataka and former Judicial Member, Karnataka State Administrative Tribunal
Pradeep Kumar Panja
Bengaluru
Former MD (Corporate Banking), SBI

Disclaimer
This presentation has been prepared by Karnataka Bank (the “Bank”) solely for providing information about the Bank. This presentation is confidential and may not be copied or disseminated, in whole or part, in anymanner. This presentation has been prepared by the Bank based on information and data which the Bank considers reliable, but the Bank makes no representation or warranty or undertaking, express or implied,
whatsoever, and no reliance shall be placed on, the truth, accuracy, completeness, fairness, correctness and reasonableness of the contents of this presentation. This presentation has not been approved and will not be
reviewed or approved by any statutory or regulatory authority in India or by any Stock Exchange in India and may not comply with all the disclosure requirements prescribed thereof. This presentation may not be allinclusive and may not contain all of the information that you may consider material. No part of it should form the basis of or be relied upon in connection with any investment decision or any contract or commitment to
purchase or subscribe for any securities. Any liability in respect of the contents of, or any omission from, this presentation is expressly excluded. No representation or warranty, express or implied is made as to, and no
reliance should be placed on, the fairness, accuracy, completeness or correctness of such information or opinions contained herein. Neither the Bank nor any of its respective affiliates, advisers or representatives, shall haveany liability whatsoever (in negligence or otherwise) for any loss howsoever arising from any use of this presentation or its contents or otherwise arising in connection with this presentation. The information contained in
this presentation is only current as of its date. Certain statements made in this presentation may not be based on historical information or facts and may be “forward-looking statements”, including those relating to the
Bank’s general business plans and strategy, its future financial condition and growth prospects, and future developments in its industry and its competitive and regulatory environment. Actual results may differ from these
forward-looking statements due to a number of factors, including future changes or developments in the Bank’s business, its competitive environment, information technology and political, economic, legal and socialconditions in India and worldwide. Further, past performance is not necessarily indicative of future results. Given these risks, uncertainties and other factors, viewers of this presentation are cautioned not to place undue
reliance on these forward-looking statements. The Bank disclaims no obligation to update forward looking statements to reflect events or circumstances after the date thereof. This presentation is for general information
purposes only, without regard to any specific objectives, financial situations or informational needs of any particular person. This presentation and any information presented herein are not intended to be, offers to sell orsolicitation of offers to buy the Bank’s equity shares or any of its other securities and shall not constitute an offer, solicitation or sale in any jurisdiction in which such offer, solicitation or sale is unlawful. The Bank’s equity
shares have not been and will not be registered under the U.S. Securities Act 1993, as amended (the Securities Act”) or any securities laws in the United States and, as such, may not be offered or sold in the United States or
to, or for the benefit of, U.S. persons (as such term is defined in Regulation S under the Securities Act) absent registration or an exemption from the registration requirements of the Securities Act and applicable laws. Anyoffering of the equity shares made, if any, in the United States (or to U.S. persons) was made by means of a prospectus and private placement memorandum which contained detailed information about the Bank and its
management, as well as financial statements. The Bank may alter, modify or otherwise change in any manner the content of this presentation, without obligation to notify any person.
48