analysis of debris from helicopters from …analysis of debris from helicopters from the field...
TRANSCRIPT
ANALYSIS OF DEBRIS FROM HELICOPTERS FROM THE FIELD
INTERIM REPORT TFLRF No. 402
by Gary B. Bessee
U.S. Army TARDEC Fuels and Lubricants Research Facility Southwest Research Institute® (SwRI®)
San Antonio, TX
for U.S. Army TARDEC
Force Projection Technologies Warren, Michigan
Contract No. DAAE-07-99-C-L053 (WD49)
Approved for public release: distribution unlimited
January 2010
ADA

Disclaimers The findings in this report are not to be construed as an official Department of the Army position unless so designated by other authorized documents. Trade names cited in this report do not constitute an official endorsement or approval of the use of such commercial hardware or software.
DTIC Availability Notice Qualified requestors may obtain copies of this report from the Defense Technical Information Center, Attn: DTIC-OCC, 8725 John J. Kingman Road, Suite 0944, Fort Belvoir, Virginia 22060-6218.
Disposition Instructions Destroy this report when no longer needed. Do not return it to the originator.

ANALYSIS OF DEBRIS FROM HELICOPTERS FROM THE FIELD
INTERIM REPORT TFLRF No. 402
by Gary B. Bessee
U.S. Army TARDEC Fuels and Lubricants Research Facility
Southwest Research Institute® (SwRI®) San Antonio, TX
for U.S. Army TARDEC
Force Projection Technologies Warren, Michigan
Contract No. DAAE-07-99-C-L053 (WD49) SwRI® Project No. 03.03227.49
Approved for public release: distribution unlimited
January 2010 Approved by:
Steven D. Marty, P.E., Director Fuels and Lubricants Technology Department

iv
REPORT DOCUMENTATION PAGE Form Approved OMB No. 0704-0188
Public reporting burden for this collection of information is estimated to average 1 hour per response, including the time for reviewing instructions, searching existing data sources, gathering and maintaining the data needed, and completing and reviewing this collection of information. Send comments regarding this burden estimate or any other aspect of this collection of information, including suggestions for reducing this burden to Department of Defense, Washington Headquarters Services, Directorate for Information Operations and Reports (0704-0188), 1215 Jefferson Davis Highway, Suite 1204, Arlington, VA 22202-4302. Respondents should be aware that notwithstanding any other provision of law, no person shall be subject to any penalty for failing to comply with a collection of information if it does not display a currently valid OMB control number. PLEASE DO NOT RETURN YOUR FORM TO THE ABOVE ADDRESS.
1. REPORT DATE (DD-MM-YYYY) 31-01-2010
2. REPORT TYPE Final Interim Report
3. DATES COVERED (From - To) May 2008 – December 2009
4. TITLE AND SUBTITLE Analysis of Debris from Helicopters from the Field
5a. CONTRACT NUMBER DAAE07-99-C-L053
5b. GRANT NUMBER
5c. PROGRAM ELEMENT NUMBER
6. AUTHOR(S) Bessee, Gary B.
5d. PROJECT NUMBER SwRI 08.03227.49
5e. TASK NUMBER WD 49
5f. WORK UNIT NUMBER
7. PERFORMING ORGANIZATION NAME(S) AND ADDRESS(ES) 8. PERFORMING ORGANIZATION REPORT NUMBER
U.S. Army TARDEC Fuels and Lubricants Research Facility (SwRI®) Southwest Research Institute® P.O. Drawer 28510 San Antonio, TX 78228-0510
TFLRF No. 402
9. SPONSORING / MONITORING AGENCY NAME(S) AND ADDRESS(ES) 10. SPONSOR/MONITOR’S ACRONYM(S)
U.S. Army RDECOM
U.S. Army TARDEC 11. SPONSOR/MONITOR’S REPORT
Force Projection Technologies NUMBER(S)
Warren, MI 48397-5000
12. DISTRIBUTION / AVAILABILITY STATEMENT Approved for public release; distribution unlimited 13. SUPPLEMENTARY NOTES 14. ABSTRACT This program investigated helicopter operational field issues encountered by the U.S. Army Aviation Engineering Directorate. All of these field issues
involved contaminated fuel problems that created operational/flight safety issues. Two of the incidents involved plugged fuel filters that were directly
related to super absorbent polymer (SAP) migration from water absorbent monitors. The third incident also involved a plugged fuel filter, but this debris
was from an unknown, external source.
15. SUBJECT TERMS
Aviation Fuel, Fuel Debris, Super Absorbent Polymer (SAP), Fuel Delivery System
16. SECURITY CLASSIFICATION OF: 17. LIMITATION OF ABSTRACT
18. NUMBER OF PAGES
19a. NAME OF RESPONSIBLE PERSON
a. REPORT Unclassified
b. ABSTRACT Unclassified
c. THIS PAGE Unclassified
Unclassified
37
19b. TELEPHONE NUMBER (include area code)
Standard Form 298 (Rev. 8-98) Prescribed by ANSI Std. Z39.18

v
EXECUTIVE SUMMARY
This program investigated helicopter operational field issues encountered by the U.S. Army
Aviation Engineering Directorate. All of these field issues involved contaminated fuel problems
that created operational/flight safety issues. Two of the incidents involved plugged fuel filters
that were directly related to super absorbent polymer (SAP) migration from water absorbent
monitors. The third incident also involved a plugged fuel filter, but this debris was from an
unknown, external source.

vi
FOREWORD/ACKNOWLEDGMENTS
The U.S. Army TARDEC Fuel and Lubricants Research Facility (TFLRF) located at Southwest
Research Institute (SwRI), San Antonio, Texas, performed this work during the period of
January 2009 through September 2009 under Contract No. DAAE-07-99-C-L053. The U.S.
Army Tank-Automotive RD&E Center, Force Projection Technologies, Warren, Michigan
administered the project. Mr. Luis Villahermosa (AMSRD-TAR-D/MS110) served as the
TARDEC contracting officer’s technical representative. Mr. Matthew Boenker, Aviation and
Missile RE and E Center, Propulsion Division AMSRD-AMR-AE-P, Redstone Arsenal, AL
served as project technical monitor. The author would also like to recognize the contribution of
Dianna Barrera for her administrative and report-processing support.

vii
TABLE OF CONTENTS Section Page EXECUTIVE SUMMARY ........................................................................................................... V
FOREWORD/ACKNOWLEDGMENTS ..................................................................................... VI TABLE OF CONTENTS ............................................................................................................. VII LIST OF TABLES ..................................................................................................................... VIII LIST OF FIGURES ................................................................................................................... VIII ACRONYMS AND ABBREVIATIONS ...................................................................................... X
1.0 BACKGROUND AND OBJECTIVES ................................................................................. 1 2.0 FIELD ISSUE #1 ................................................................................................................... 1
2.1 Background ................................................................................................................... 1 2.2 Scope of Work .............................................................................................................. 2 2.3 Methodology ................................................................................................................. 2 2.4 Results ........................................................................................................................... 3 2.5 Field Issue #1 Conclusions ......................................................................................... 16
3.0 FIELD ISSUE #2 ................................................................................................................. 16 3.1 Objective ..................................................................................................................... 16 3.2 Methodology ............................................................................................................... 17 3.3 Field Issue #2 Conclusions ......................................................................................... 21
4.0 FIELD ISSUE #3 ................................................................................................................. 21 4.1 Objective ..................................................................................................................... 21 4.2 Methodology ............................................................................................................... 21 4.3 Field Issue #3 Conclusions ......................................................................................... 27

viii
LIST OF TABLES Table Page
Table 1. Elemental Analysis ................................................................................................................. ..13
Table 2. Gravimetric Analysis of Fuel Sample From 469. ................................................................... 18
Table 3. Elemental Analysis of Fuel Debris .......................................................................................... 21
Table 4. Elemental Analysis of Bladder and Jelly-like Debris ............................................................ 27
LIST OF FIGURES Figure Page Figure 1. #1 Engine .................................................................................................................................. 3
Figure 2. #2 Engine Filter, as Received .................................................................................................. 4
Figure 3. SEM Photos - #403 (500 µm) .................................................................................................. 5
Figure 4. SEM Photos - #403 (200 µm) .................................................................................................. 6
Figure 5. SEM Photos - #1 Engine Fine Debris (500 µm) .................................................................... 6
Figure 6. SEM Photos - #1 Engine Fine Debris (200 µm) .................................................................... 7
Figure 7. SEM Photos - #2 Engine Fine Debris (500 µm) .................................................................... 7
Figure 8. SEM Photos - #2 Engine Fine Debris (200 µm) .................................................................... 8
Figure 9. FTIR Spectrum - #403 ............................................................................................................ 8
Figure 10. FTIR Spectrum - #1 Engine Fine Debris ............................................................................... 9
Figure 11. FTIR Spectrum - #1 Engine Coarse Debris .......................................................................... 9
Figure 12. FTIR Spectrum - #2 Engine Fine Debris ............................................................................. 10
Figure 13. FTIR Spectrum - #2 Engine Coarse Debris ........................................................................ 10
Figure 14. Optical Photo - #1 Engine Coarse Debris (5.0 mm)............................................................ 11
Figure 15. Optical Photo - #1 Engine Coarse Debris (1.0 mm)............................................................ 11
Figure 16. Optical Photo - #2 Engine Coarse Debris (5.0 mm)............................................................ 12
Figure 17. Optical Photo - #2 Engine Coarse Debris (1.0 mm)............................................................ 12
Figure 18. Cut Away of New Water Absorbent Monitor ..................................................................... 13
Figure 19. Self-Sealing Fuel Bladder and Bladder Sealant .................................................................. 14
Figure 20. FTIR of Self-Sealing Material from Bladder ...................................................................... 14
Figure 21. FTIR of Bladder Sealing Material from Fuel Tank ........................................................... 15
Figure 22. #1 Main Filter (Photo Provided by Goodrich) .................................................................... 15
Figure 23. Filtered “Smudge” (Photo Provided by Goodrich) ............................................................ 16
Figure 24. Fuel Sample From 469 .......................................................................................................... 17

ix
LIST OF FIGURES (continued) Figure Page Figure 25. Debris From L/H Tank – 469 ............................................................................................... 18
Figure 26. Fuel Sample Debris, 50X ....................................................................................................... 19
Figure 27. Fuel Sample Debris, 100X ..................................................................................................... 19
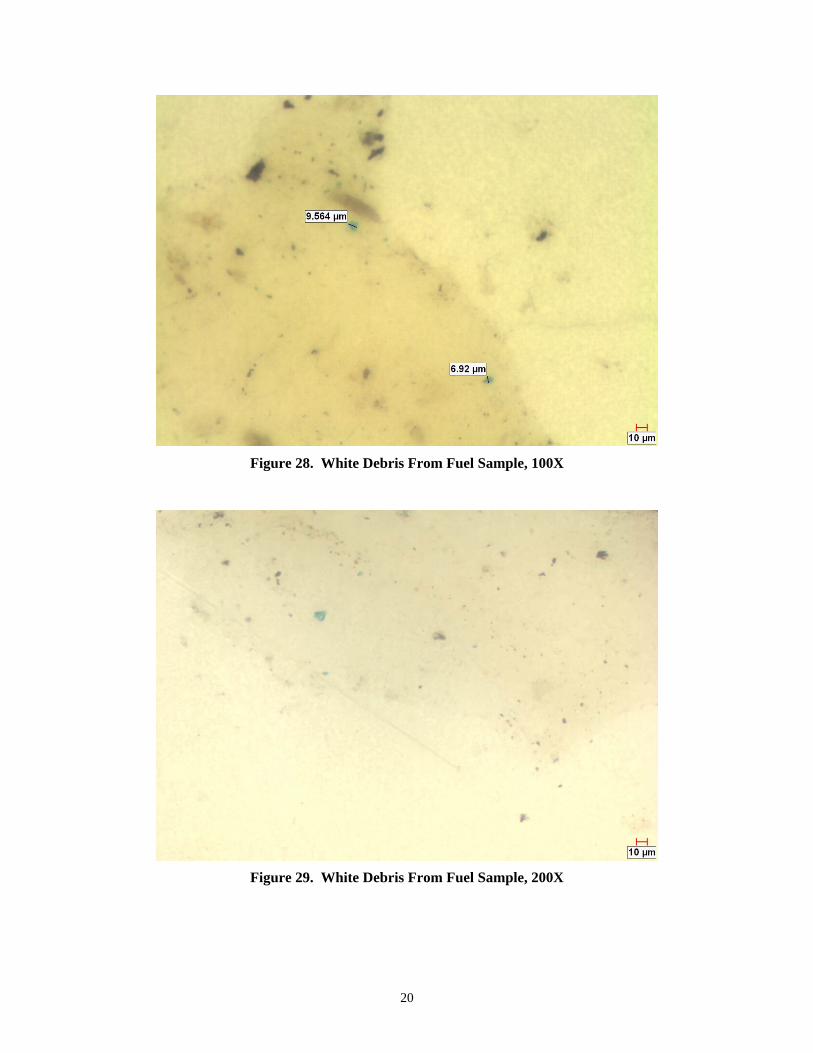
Figure 28. White Debris From Fuel Sample, 100X ............................................................................... 20
Figure 29. White Debris From Fuel Sample, 200X ............................................................................... 20
Figure 30. Helicopter Fuel Bladder ........................................................................................................ 22
Figure 31. Unknown Contaminant in Fuel Bladder ............................................................................. 22
Figure 32. Close up of Fuel Contaminant in Fuel Bladder .................................................................. 24
Figure 33. External View of Fuel Bladder ............................................................................................. 24
Figure 34. External View of the Degraded Fuel Bladder – View 1 ..................................................... 25
Figure 35. External View of the Degraded Fuel Bladder – View 2 ..................................................... 25
Figure 36. Fuel Debris Captured on Laboratory Membrane .............................................................. 26
Figure 37. Multiple Laboratory Membranes Containing Fuel Debris ............................................... 26
Figure 38. FTIR of Jelly-Like Debris ..................................................................................................... 27

x
ACRONYMS AND ABBREVIATIONS psi pounds per square inch rpm rotation(s) per minute SAE Society of Automotive Engineers SwRI® Southwest Research Institute® TACOM Tank and Automotive Command TAN Total Acid Number TARDEC Tank-Automotive RD&E Center TBN Total Base Number TFLRF TARDEC Fuel and Lubricants Research Facility TGA Thermo Gravimetric Analysis TWV Tactical Wheeled Vehicle WD Work Directive

1
1.0 BACKGROUND AND OBJECTIVES
The U.S. Army Aviation Engineering Directorate has experienced several contaminated fuel issues
that have resulted in crashes or operational issues. The objective of Work Directive 49 was to
analyze fuel, fuel and filter debris, aircraft fuel system components, and fuel delivery systems to
determine sources and causes of these issues.
2.0 FIELD ISSUE #1
A helicopter crash was investigated to resolve the cause of failure. The analysis in this effort
concentrated on identification of the debris and analysis of fuel filtration and elements.
The analysis for Field Issue #1 consisted of:
Perform engineering analysis to determine the composition of debris found in U.S. Army
helicopter Serial Number 92-00403 and on the fuel filters installed on the helicopter. The
U.S. Army Aviation Engineering Directorate provided the filters and the debris to be
analyzed.
Analysis was performed on the fuel supply system, the internal main fuel cell, and on the
fuel truck delivery filtration systems and elements—specifically, the fuel truck water
absorbent monitors.
2.1 Background
The aviation industry as a whole has had issues with media migration with water absorbent
monitors. For reasons not fully understood, the super absorbent polymer (SAP) migrates
downstream of the filter and has been shown to cause problems. In 2006, several U.S. Air Force
aircrafts had flame-outs during flight at Sheppard Air Force Base. The investigation by the U.S.
Air Force found SAP in the fuel controls, which was attributed to causing the problem. Single

2
element tests (SET) were performed at Southwest Research Institute® (SwRI®) to determine if
any media migration was occurring with the water absorbing monitors installed at Sheppard Air
Force Base. Four 6-inch diameter monitors were evaluated per a modified API/IP 1583 protocol.
The evaluations were conducted using the 50-ppm water challenge. All monitors captured the
water, but media migration was shown using particle counting, turbidity analysis, and SEM
analysis of debris captured downstream of the test monitors.
Both the government and the commercial aviation industry have performed research to determine
the extent of SAP migration, possible causes, and potential effects.
2.2 Scope of Work
The scope of work for Field Issue #1 was to identify the debris captured on various fuel filters
from aircraft MH-47E, A/C 92-00403.
2.3 Methodology
The fuel filters were back-flushed with iso-octane to remove the debris and then filtered through
0.8-m membranes to capture the debris. The following analyses were performed on the debris:
Copper Sulfate test
Elemental analysis by EDS
FTIR
Optical analysis
The copper sulfate test is used by the diaper industry to determine the distribution of SAP in the
diapers. An ion exchange process occurs between the copper in the copper sulfate and the metal
in the SAP. This ion exchange process will turn the SAP blue in color.

3
2.4 Results
Photos of the filters are shown in Figures 1 and 2.
Figure 1. #1 Engine

4
Figure 2. #2 Engine Filter, as Received
The preliminary results of the fuel filter analysis are as follows:
Optical photos of filter debris – Copper Sulfate Test (Figures 3–8)
FTIR spectra of filter debris (Figures 9–13)
Optical photos (Figures 14–17)
Optical photo – New water absorbent monitor (Figure 18)
Elemental Analysis (Table 1)
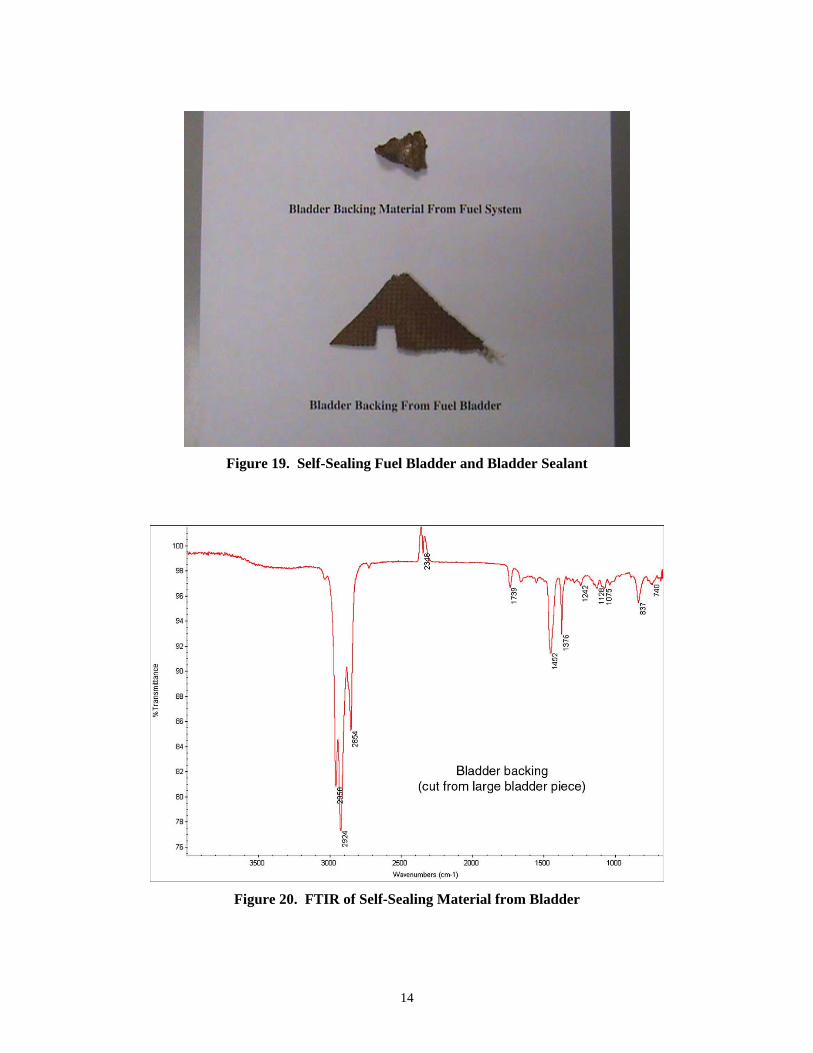
Optical photos of sealing fuel bladder material (Figures 19–21)
Optical pictures of plugged #1 Main Fuel Filter and “smudge” from fuel tank
(Figures 22–23)

5
The copper sulfate analysis did not yield the expected results. However, the elemental analysis
revealed copper and aluminum already in the fuel, which would complete the ion exchange
process and not allow the laboratory reaction to occur. By all other accounts, the evidence
collected to date suggests that a fuel monitor ruptured somewhere upstream in the system. The
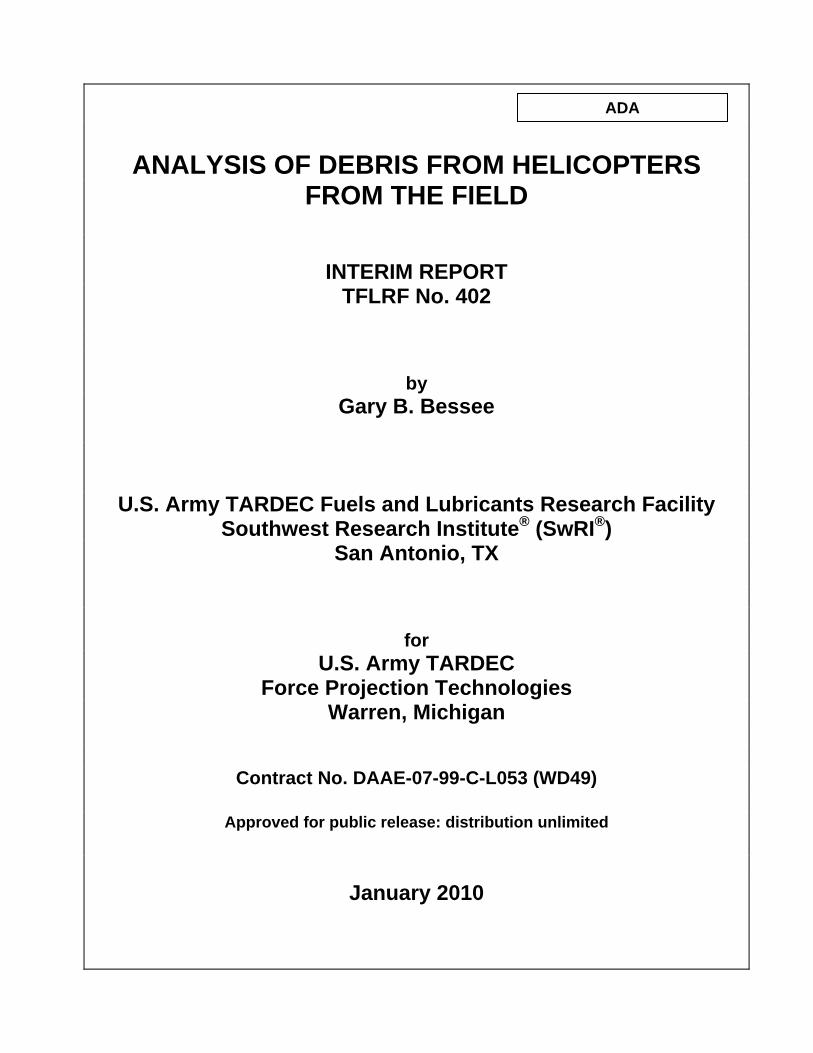
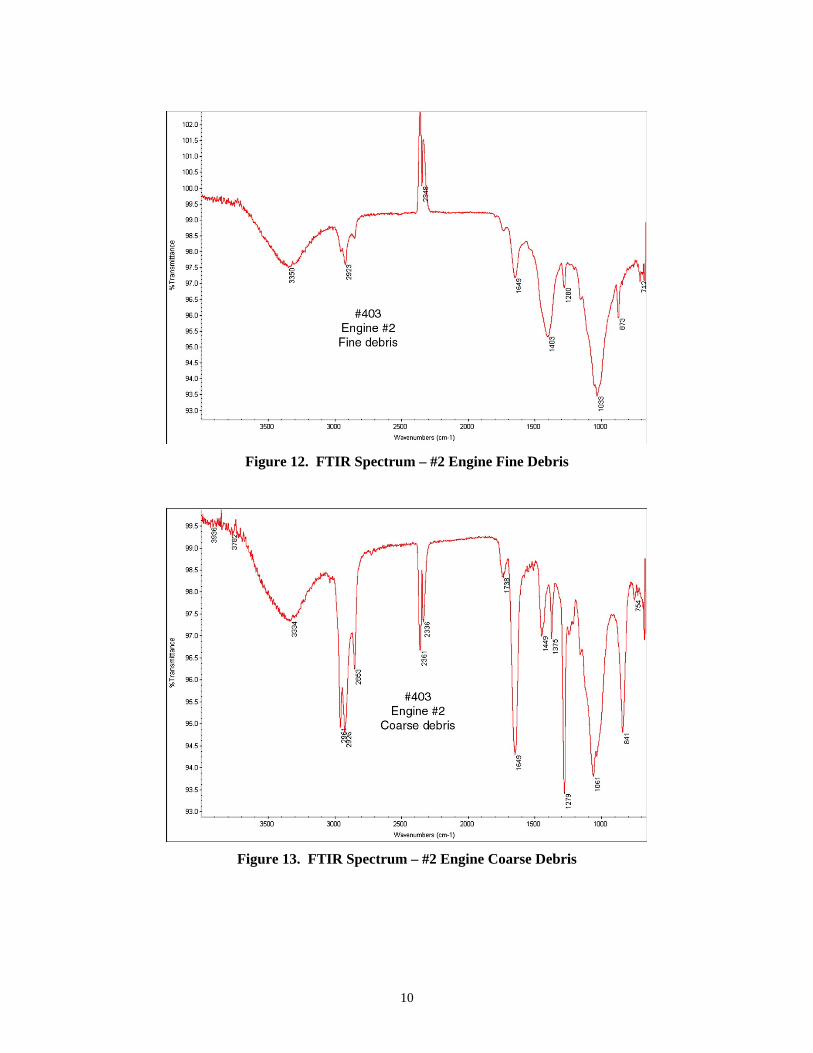
FTIR spectra of the fine debris shown in Figure 8 (#1 Engine) and Figure 10 (#2 Engine) show
characteristics that we typically associate with the presence of SAP. This evidence can be further
corroborated by the levels of sodium seen in the elemental analysis (Table 1). The optical photos
shown in Figures 16–17 are also confirming evidence, as they show various layers of material
that we believe belong to a specific manufacturer of fuel monitors. These layers can be compared
with the cut-away of the water absorbent monitor shown in Figure 18.
Figure 3. SEM Photos - #403 (500 µm)

6
Figure 4. SEM Photos - #403 (200 µm)
Figure 5. SEM Photos – #1 Engine Fine Debris (500 µm)

7
Figure 6. SEM Photos – #1 Engine Fine Debris (200 µm)
Figure 7. SEM Photos – #2 Engine Fine Debris (500 µm)

8
Figure 8. SEM Photos – #2 Engine Fine Debris (200 µm)
Figure 9. FTIR Spectrum – #403
9
Figure 10. FTIR Spectrum – #1 Engine Fine Debris
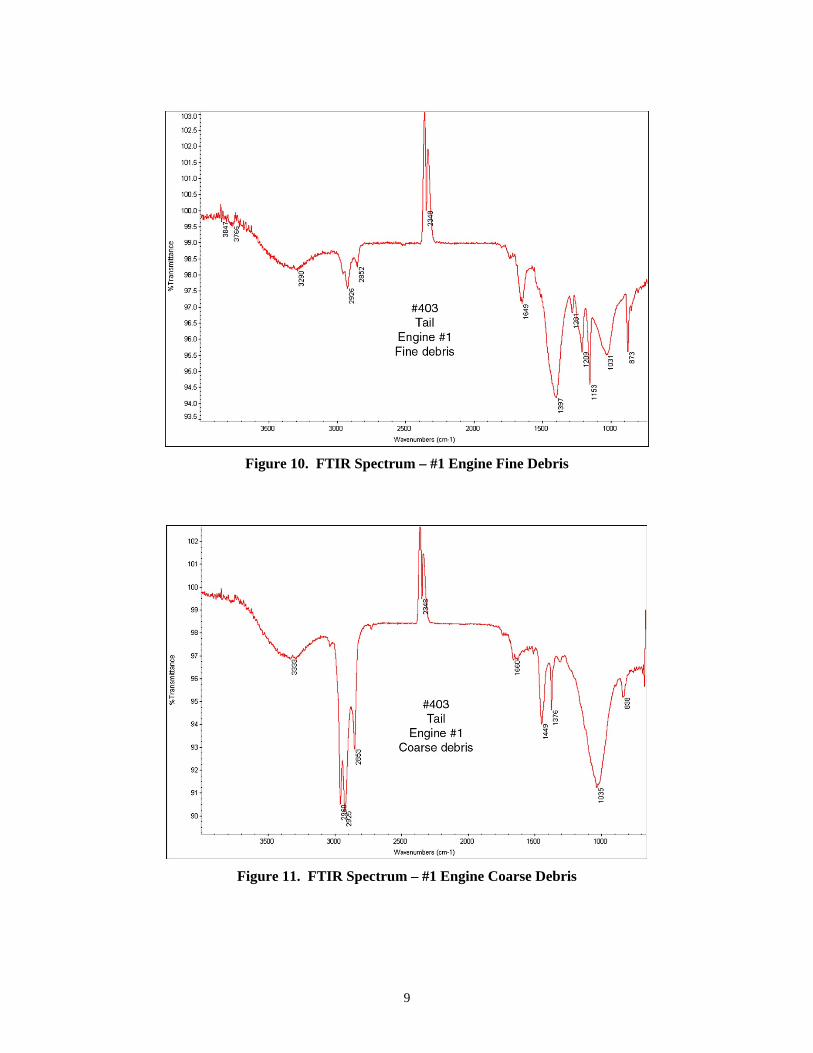
Figure 11. FTIR Spectrum – #1 Engine Coarse Debris
10
Figure 12. FTIR Spectrum – #2 Engine Fine Debris
Figure 13. FTIR Spectrum – #2 Engine Coarse Debris

11
Figure 14. Optical Photo – #1 Engine Coarse Debris (5.0 mm)
Figure 15. Optical Photo – #1 Engine Coarse Debris (1.0 mm)

12
Figure 16. Optical Photo – #2 Engine Coarse Debris (5.0 mm)
Figure 17. Optical Photo – #2 Engine Coarse Debris (1.0 mm)
Water Absorbent Monitor Media
Water Absorbent Monitor Media

13
Figure 18. Cut Away of New Water Absorbent Monitor
Table 1. Elemental Analysis
Element #403
#1 Engine Coarse Debris
#1 Engine Fine Debris
#2 Engine Coarse Debris
#2 Engine Fine Debris
wt% wt% wt% wt% wt% Na 11.31 11.68 4.57 14.84 11.09 Mg 3.65 20.48 2.65 5.31 2.55 Al 15.66 4.79 11.11 9.69 7.09 Si 27.37 32.58 17.16 44.92 36.28 P 0.6 2.70 0.56 — — S 3.41 13.03 2.17 3.85 1.45 Cl 7.08 2.96 2.83 3.02 2.21 K 3.18 2.48 1.43 3.15 2.34 Ca 6.51 2.50 47.65 2.97 25.59 Ti 2.11 — 3.63 0.85 1.21 Cr 0.45 — 0.58 — — Mn 0.26 — — — — Fe 3.64 — 5.03 — 3.16 Ni 0.53 — — — 0.10 Cu 10.63 — — — — Zn 3.6 3.09 — 7.06 2.47 Ba — 3.72 0.63 4.35 4.45
14
Figure 19. Self-Sealing Fuel Bladder and Bladder Sealant
Figure 20. FTIR of Self-Sealing Material from Bladder

15
Figure 21. FTIR of Bladder Sealing Material from Fuel Tank
Figure 22. #1 Main Filter (Photo Provided by Goodrich)

16
Figure 23. Filtered “Smudge” (Photo Provided by Goodrich)
2.5 Field Issue #1 Conclusions
Several fuel filters from aircraft MH-47E, A/C 92-00403 were analyzed to determine the
contamination products plugging the filters. The analyses included copper sulfate analysis,
elemental analysis by EDS, FTIR, and optical documentation. With the exception of the copper
sulfate test, all data indicates the contamination is not only SAP media migration but also that
water absorbent element or elements ruptured during operations either at Fort Campbell or
overseas. Goodrich found additional debris that was not SAP. Therefore, it appears two failure
mechanisms affected the filtration performance of this helicopter.
3.0 FIELD ISSUE #2 3.1 Objective The objective of the analysis for Field Issue #2 was to identify the debris provided by the U.S.
Army Aviation Engineering Directorate from 469.

17
3.2 Methodology A fuel sample and debris from the left hand tank from 469 were sent to SwRI for analysis
(Figures 24 and 25, respectively). The fuel arrived in a plastic bottle but was transferred to a
glass container to illustrate the floating debris in the fuel. Two 100-mL samples were filtered
through 0.8-m membranes, and the gravimetric results are shown in Table 2. The fuel sample
contained a large quantity of dark particles that appeared to be elastomeric or rubber. There were
also large white particles floating in the fuel. All the debris would eventually settle to the bottom
of the container. Upon completion of the gravimetric and elemental analysis, the membrane was
treated with copper sulfate to determine if SAP was present.
The debris from the left hand fuel tank was dried when received. When water was applied to the
debris, it had the consistency of SAP.
Figure 24. Fuel Sample From 469

18
Figure 25. Debris From L/H Tank – 469
Table 2. Gravimetric Analysis of Fuel Sample From 469
Fuel Sample Gravimetric Analysis, mg/100mL
Sample 1 1.3
Sample 2 1.7
Optical analysis of the debris revealed the size of the darker debris to be 1,000-m or larger
(Figures 26–27). Figures 28–29 illustrate the other debris from the supplied fuel sample. Small
blue particles can be seen in Figures 28–29. These particles reacted with the copper sulfate
solution that was applied to the membrane to determine if super absorbent polymer (SAP) was
present. A few positives were found indicating some SAP migration occurred. It is difficult
determine exactly what the white debris was, but it did look gelatinous and would plug a fuel
filter rapidly.
Elemental analysis of the captured debris is shown in Table 3. The bulk of the analysis revealed
metals that are most likely found in the fuel system along with silica and calcium that is most
likely dirt/sand.

19
Figure 26. Fuel Sample Debris, 50X
Figure 27. Fuel Sample Debris, 100X
20
Figure 28. White Debris From Fuel Sample, 100X
Figure 29. White Debris From Fuel Sample, 200X

21
Table 3. Elemental Analysis of Fuel Debris
Element Weight Percent Mg 25.55 Al 17.89 Si 9.60 S 13.42 Fe 30.26 Ni 2.04 Ca 1.24
Note: Results do not include elements with Z<11 (Na)
3.3 Field Issue #2 Conclusion
This fuel sample was heavily contaminated with black and white large particles. The black
particles appear to be part of the fuel tank or particles from a refueling hose. The white debris
shows indications there is SAP present. If the rest of the gelatinous material is not SAP, at this
time it is not known what it is. The material, however, would definitely plug fuel filters. One
possible explanation for the gelatinous debris not turning blue when treated with copper sulfate is
that the magnesium and/or aluminum have already reacted with the metal in the SAP. Therefore,
the copper would not react, and the polymer would not turn blue.
4.0 FIELD ISSUE #3
4.1 Objective
The objective of Field Issue #3 was to identify the contamination debris found in an internal
helicopter fuel bladder.
4.2 Methodology
A fuel sample and part of an internal helicopter fuel bladder were provided to SwRI to determine if
the “black” debris in the fuel was the bladder or other contamination. Figures 30 –35 illustrate the
bladder and the problems encountered in the field.

22
Figure 30. Helicopter Fuel Bladder
Figure 31. Unknown Contaminant in Fuel Bladder

24
Figure 32. Close up of Fuel Contaminant in Fuel Bladder
Figure 33. External View of Fuel Bladder

25
Figure 34. External View of the Degraded Fuel Bladder – View 1
Figure 35. External View of the Degraded Fuel Bladder – View 2

26
Approximately 100 mL of fuel was provided from the fuel bladder. The furnished fuel was filtered
through laboratory membranes to capture the dark particles, Figure 36. The debris plugged the
laboratory filters very quickly. Multiple membranes were required to filter all of the debris,
Figure 37.
Figure 36. Fuel Debris Captured on Laboratory Membrane
Figure 37. Multiple Laboratory Membranes Containing Fuel Debris

27
Elemental analysis of the bladder and jelly-like material was performed by EDS, Table 4. The
jelly-like debris did contain the dark particles shown in Figures 36 and 37. The jelly-like debris is
tacky and if left in the air, it will dry out.
Table 4. Elemental Analysis of Bladder and Jelly-Like Debris
Element Black Particles Jelly-Like Debris
Na 8.67 3.27 Mg 22.76 49.68 Al 0.83 6.79 Si 29.22 1.76 S 14.24 33.32 Cl 3.07 3.93 K 0.63 1.25 Ca 2.72 --- Fe 0.77 --- Zn 17.09 ---
Note: Results do not include elements with Z<11 (Na) FTIR analysis was performed on the jelly-like material with the spectrum shown in Figure 38.
Figure 38. FTIR of Jelly-Like Debris

28
The FTIR scan only shows carbon and hydrogen peaks.
4.3 Field Issue #3 Conclusions
The debris has the appearance and consistency of apple jelly which is typically cause by the
combination of water, fuel system icing inhibitor, and super absorbent polymer (SAP) from
water absorbent monitors. However, none of the analysis supports this conclusion. It appears that
this contaminant very well may have been dispensed into the bladder (Figures 31 and 32).
The elemental analysis suggests salt (NaCl) maybe present, and the sulfur is most likely from the
fuel. The high levels of magnesium are not typical and the source is not known without further
investigation. With the analysis that was completed on this debris, it is not known what it is or its
source.
The dark particles do not appear to have come from the fuel bladder, but from another source
such as o-rings or sealants.
It is recommended that further analysis of the internal surface of the bladder and support
structure be performed to determine failure mechanism and/or identify any corrosion activity.