radiation doses from flying through nuclear debris clouds · radiation doses from flying , ......
TRANSCRIPT
USAFSAM-TR-85-86
RADIATION DOSES FROM FLYING ,THROUGH NUCLEAR DEBRIS CLOUDS
O Peter M. Vanden Bosch, Second Lieutenant, USAF
*O1 Arthur Woodrum, Ph.D.
April 1986
MY3O01986
Final Report for Period 2 January - 10 January 1985
r Approved for public release; distribution Is unlimited.
TIC FILE CONUSAF SCHOOL OF AEROSPACE MEDICINEAerospace Medical Division (AFSC)Brooks Air Force Base, TX 78235-5301
. . . . .. ... .
NOTICES
This final report was submitted by personnel of the Radiation BiologyBranch, Radiation Sciences Division, USAF School of Aerospace Medicine,Aerospace Medical Division, AFSC, Brooks Air Force Base, Texas, under job order7757-04-42. Funding for the work of this report was provided by the RadiationSciences Division, USAF School of Aerospace Medicine, and by the Air ForceOffice of Scientific Research/AFSC, United States Air Force, under contract-"F49620-85-C-0013.-
When Government drawings, specifications, or other data are used for anypurpose other than in connection with a definitely Government-relatedprocurement, the United States Government Incurs no responsibility nor any Sr
obligation whatsoever. The fact that the Government may have formulated or inany way supplied the said drawings, specifications, or other data, is not to beregarded by implication, or otherwise in any manner construed, as licensing theholder, or any other person or corporation; or as conveying any rights orpermission to manufacture, use, or sell any patented invention that may in anyway be related thereto.
The Office of Public Affairs has reviewed this report, and it is releasableto the National Technical Information Service, where it will be available to thegeneral public, including foreign nationals.
This report has been reviewed and is approved for publication.
PETER M. VANDEN BOSCH, 2Lt, USAF DAVID H. WOOD, Lt Col, USAF, BSCProject Scientist Supervisor
DAVIS, Colonel, USAF, MC
,/O-r
,dd
1
. .- . . . k. . . .. - . . . ... . .. .•. . -: .: , .., . - .. . . : , , ,.," "' : , - ; -" " ' ' """g "/i" "" -" ' " """ " ' -' "" ' "':' '"-n ' " <'"' 2 ,N" :"-
UNCLASSIFIEDSCURITY CLASSIFICATION OF THIS PAGE '0 I / / 5- 2 '5 2
REPORT DOCUMENTATION PAGEla. REPORT SECURITY CLASSIFICATION lb. RESTRICTIVE MARKINGS
UNCLASSIFIED 0%
2a. SECURITY CLASSIFICATION AUTHORITY 3. DISTRIBUTION/ AVAILABILITY OF REPORTApproved for public release; distribution is
2b. DECLASSIFICATION I DOV GRADING SCHEDULE unlimited.
4. PERFORMING ORGANIZATION REPORT NUMBER(S) S. MONITORING ORGANIZATION REPORT NUMBER(S)USAFSAM-TR-85-86
6a. NAME OF PERFORMING ORGANIZATION 6b. OFFICE SYMBOL 7a. NAME OF MONITORING ORGANIZATIONUSAF School of (ff appikable)Aerospace Medicine USAFSAM/RZB
6c. ADDRESS (City, State, and ZIP Code) 7b ADDRESS (City, State, and ZIP Code)Aerospace Medical Division (AFSC)Brooks Air Force Base, TX 78235-5301
Ba. NAME OF FUNDING/SPONSORING 8b. OFFICE SYMBOL 9. PROCUREMENT INSTRUMENT IDENTIFICATION NUMBERORGANIZATION USAF School of (If appicable)
Aerospace Medicine USAFSAM/RZB
Sc. ADDRESS (City, State, and ZIP Code) 10. SOURCE OF FUNDING NUMBERSAerospace Medical Division (AFSC) PROGRAM PROJECT TASK 'WORK UNITBrooks Air Force Base, TX 78235-5301 ELEMENT NO. NO. NO. ACCESSION NO. t
62202F 7757 04 42
11. TITLE (Include Security Classification)RADIATION DOSES FROM FLYING THROUGH NUCLEAR DEBRIS CLOUDS
12. PERSONAL AUTHOR(S)Vanden Bosch, Peter M.; Woodrum, Arthur (Professor, Georgia Southern University).
13a. TYPE OF REPORT 13b. TIME COVERED 14. DATE OF REPORT (Year, nth, Day) S. PAGE COUNTFinal FROM 1/2/85 TO1/10/85 1986, Aprirl 21
16. SUPPLEMENTARY NOTATION
17. COSATI CODES 18. SUBJEJCT TERMS (Continue on reverse if necessary and identify by block number)FIELD GROUP SUB-GROUP Postfblast nuclear radiation; Radiation dosage; Nuclear15 06 weapon debris; Fallout prediction; Cloud penetration , -
9. ABSTRACT (Continue on reverse if necessary and identify by block number)Taboada et al. have recently developed a computer model to predict gamma-radiation doses toaircrews flying through nuclear debris clouds. Although the model has the advantages oftaking a large number of parameters into account and using the benchmark DELFIC code tomodel cloud dynamics, it takes up to 20 min for a single run on a mainframe computer. Re-sults from a number of runs have been generalized into empirical formulae. From these re-sults it is possible to estimate worst case gamma-radiation doses for complex scenariosusing a hand calculator. ..
2 0. DISTRIBUTION /AVAILABILITY OF ABSTRACT 21. ABSTRACT SECURITY CLASSIFICATION
MUNCLASSIFIEDAJNLIMITED 0 SAME AS RPT 03 OTIC USERS UNCLASSIFIED22a. NAME OF RESPONSIBLE INDIVIDUAL 22b. TELEPHONE (Include Area Code) 22c. OFFICE SYMBOLPeter M. Vanden Bosch, 2Lt, USAF (91P) 5%6-4416 USAFSAM/RZR
DD FORM i 473.84 MAR 83 APR edition may be used until exhausted. SECURITY CLASSIFICATION OF HIS PAGE"" All other editions are obsolete. UNC LASSIF I ED F
. >''
.. . .. . .. . .. . .. . .. . .. . .... . .. .o.'% ~ ,".
-. 1~ .7
TABLE OF CONTENTS
Page
*INTRODUCTION. .. .............................. 1
FLYTHROUGH MODEL. .. ............................ 1
CLIOUD DIMENSIONS. .. ............................ 2
DUST CLOUD CHARACTERISTICS .. ... ............. ......
DOSE AT THE END OF FLTHROUGH .. ........ ...............4
* ~POST FLYTHROUGH DOSE............................... .. .. . . .. . .. .. ........
CONCLUSIONS . . . .. .. . . . . . . .. . . ... . . . . . . . . .. 9
*ACKNOWLEDGMENTS. ... ............. .............. 11
REFERENCES .. .. ............. ............. ... 11
APPENDIX A:, CORRECTION FOR AIRCRAFT PARAMETERS .. ............ 13
-APPENDIX B: EVALUATION OF MODEL ASSUMPTIONS .. ... ............ 15
Figures
*Fig. b
* No.
1. Base and Top Heights of Cloud vs. Yield .. ......... .... 3
2. Radius of Cloud vs. Yield. ... ............. ...... 3
*3. Dose vs. Height for a 1 MT Yield. .. ........ ......... 5
* 4. Dose vs. Yield. .. ........ ............. .... 5
5. Dose vs. Time for a 10 MT Yield .. ......... ......... 6
6. Dose vs. Time Near Cloud Top .. ... ............. ... 7
7. Dose vs. Time Near Cloud Base. ... ............. ... 7
8. Rate Constant vs. Time Near Cloud Top .. ......... ...... 8
* 9. Rate Constant vs. Time Near Cloud Base..... .... .. .. .. .. ....
RADIATION DOSES FROM FLYINGTHROUGH NUCLEAR DEBRIS CLOUDS
INTRODUCTION
Estimates of radiation doses to aircrews flying through nuclear debrisclouds are of critical interest to USAF mission planners. The probabilityof such an event occurring is high following a nuclear attack. Since real dataare lacking, prediction must depend upon mathematical modeling of the cloudenvironment and flythrough.
Taboada et al. (1) recently developed a computer model which predicts dosesfrom flythroughs. The model, which will be called CASSIE in this report, isbased upon the dust environment model CASSANDRA (2), which in turn uses thebenchmark DELFIC (3) code as the basis of its cloud rise and fallout dynamics.The CASSIE model is user friendly; it supplies default values and descriptionsof parameters when requested and has all the input flexibilities of the DELFICand CASSANDRA codes.
The CASSIE model uses the CASSANDRA code to calculate the dust density atvarious points along the trajectory of an aircraft flying through a nucleardebris cloud. A gamma-radiation dose rate is calculated from the dust densitiesand integrated over time to obtain the total radiation dose that an aircrewwould experience.
The total radiation dose is assumed to originate from 2 sources: (1) theimmersion radiation dose, which is a result of the aircraft being immersed in aradioactive cloud, and (2) the onboard radiation dose, which results from radia-tion exposure of the aircrews to dust particles trapped inside the aircraft
cabin and filtering system. The immersion rate exists only while the aircraftis inside the radioactive debris cloud, whereas the onboard radiation is a con-tinuing hazard.
The purpose of this report is to use the CASSIE model to calculate theradiation doses to aircrewmembers for various conditions of flythrough. Due tothe long program running time, the model would have little use in an operationalsetting. The intent of this report is to supply results of the model in a formwhich will allow planners to estimate in advance realistic and worst case dosesfor flythrough scenarios.
FLYTHROUGH MODEL
* CASSIE provides for changing flight and aircraft parameters easily. Ascenario is needed which will allow an analysis of radiation dose dependence on
* height of flythrough, time of flight, and detonation yield. For the purposes of*" this report, the following flight scenario was used.
An aircraft flies from a point 40 km (24 mi) from ground zero on one side*of a detonation to 40 km on the opposite side, passing directly over ground
zero. The flight duration is 500 s, which corresponds to a velocity of 311knots. A height H is maintained throughout the flight and the aircraft passes
". ,%o -
-. . ._ ' " '. L ., , L, - .' . ',- ; .: ¢ .. . ¢ . I-
over ground zero at t seconds after detonation. This path is expressed in theform (-40 km, 0, H, t-250) - (40 km, 0, H, t 250).'
The aircraft parameters are chosen to resemble those of a KC-135 aircraft.The model approximates the cabin as a cylinder, chosen to be 32.05 m (107 ft) inlength and 2.74 m (9 ft) in radius. The filtration system is arbitrarily chosento allow 50% of the dust particles taken onboard to enter the cabin, with theremainder staying on the filter. Once aboard, the dust particles do not exit.The distance from the crewmembers to the filter is arbitrarily chosen to be 250cm (100 in.). The air-mass flow into the aircraft is 67.5 kg/min (150 lb/min).The dose received by .aircrewmembers will be dependent on the choice of theseparameters, which are discussed in Appendix A. If cloud penetration is unavoid-able, Figure 3 shows that it is most advantageous to fly through as high in thecloud as possible. This will allow the aircraft to be exposed to the lowestpossible dose within the cloud. A flythrough beneath the cloud may result in alower dose, but there is the danger of the aircraft encountering large parti-cles.
CLOUD DIMENSIONS
The size of the nuclear debris cloud depends on a number of factors. The
parameters used in the analysis include:
(1) A surface burst, with 50% of the available energy expended in fission.
(2) Ground zero at 670 m (2211 ft) above mean sea level.
(3) No wind.
(4) Soil type is siliceous.
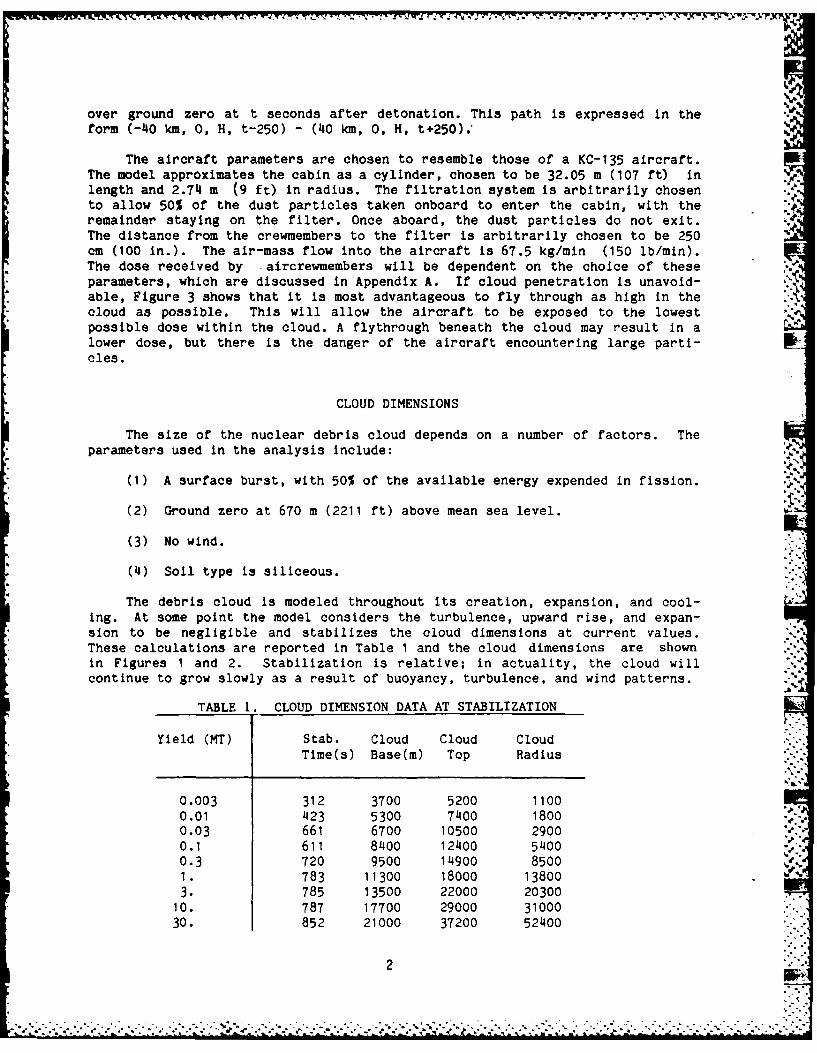
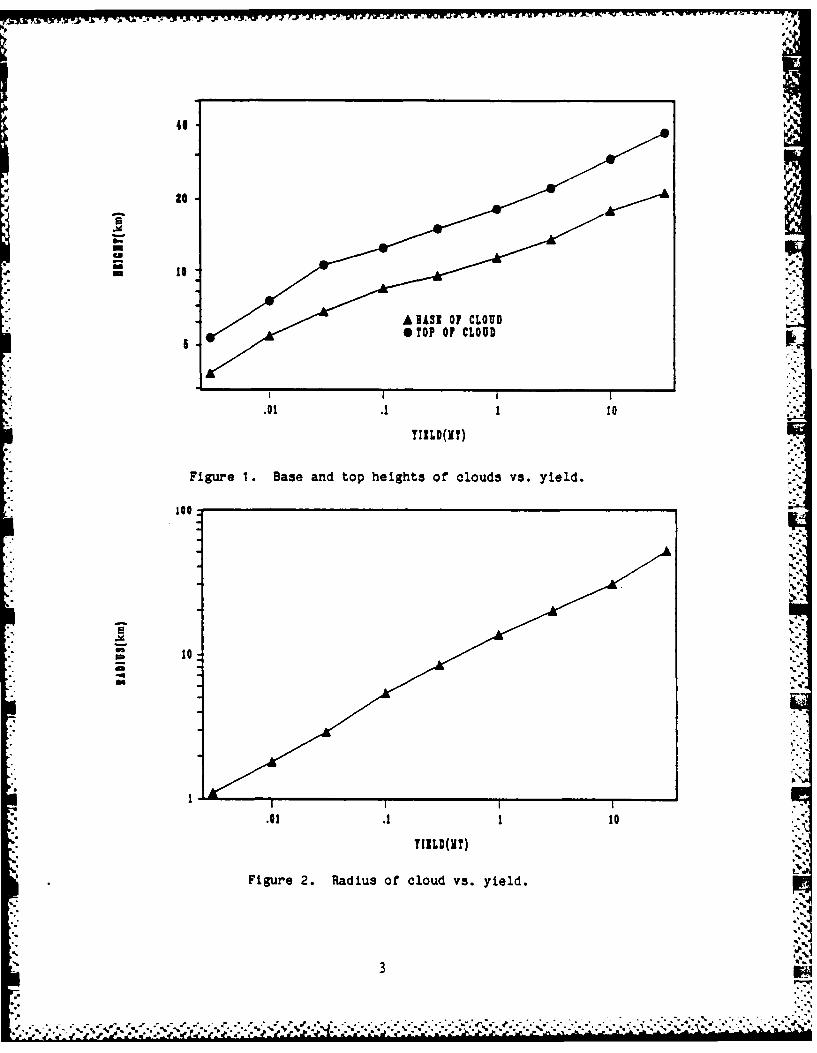
The debris cloud is modeled throughout its creation, expansion, and cool-ing. At some point the model considers the turbulence, upward rise, and expan-sion to be negligible and stabilizes the cloud dimensions at current values.These calculations are reported in Table 1 and the cloud dimensions are shownin Figures I and 2. Stabilization is relative; in actuality, the cloud willcontinue to grow slowly as a result of buoyancy, turbulence, and wind patterns.
TABLE 1. CLOUD DIMENSION DATA AT STABILIZATION
Yield (MT) Stab. Cloud Cloud CloudTime(s) Base(m) Top Radius
0.003 312 3700 5200 11000.01 423 5300 7400 18000.03 661 6700 10500 29000.1 611 8400 12400 54000.3 720 9500 14900 85001. 783 11300 18000 138003. 785 13500 22000 20300
10. 787 17700 29000 3100030. 852 21000 37200 52400
2
ZT V- -. ,r -- ~j I
40
20
.01 .1 1 10
TIILD(IT)
Figure 1. Base and top heights of clouds vs. yield.
100
*.01 .1 1 10
TIILD(MT)
Figure 2. Radius of cloud vs. yield.
-k - -!S
These calculations are based on the DELFIC and CASSANDRA portions of the16model. The cloud top and bottom heights agree well with values reported by '
Glasstone and Dolan (4). Cloud radii appear to be larger by as much as a factorof 1.4 than those reported. Part of the disagreement may be explained by theambiguous nature of the cloud dimensions. Part may be explained by the factthat DELFIC was intended as a ground fallout code, and ground fallout is rela-tively insensitive to cloud radius or base height choices (7). This is a draw-back since flythrough dose is approximately inversely proportional to cloud Kradius in this model.
DUST CLOUD CHARACTERISTICS
In the model, the mass of soil entrained by the burst is dependent on theheight of burst above ground, type of soil, and explosive yield. A log-normaldistribution of particle sizes is assumed, and the dust i partitioned into 100size classes. At initial time the soil burden is distributed uniformly through-out, the cloud. As the cloud grows with time, the soil debris will be loftedwith the cloud at a rate dependent on particle size. The gamma-radiation rateat each point in the cloud is proportional to the dust mass concentration atthat point. The latter assumption is considered in detail in Appendix B.
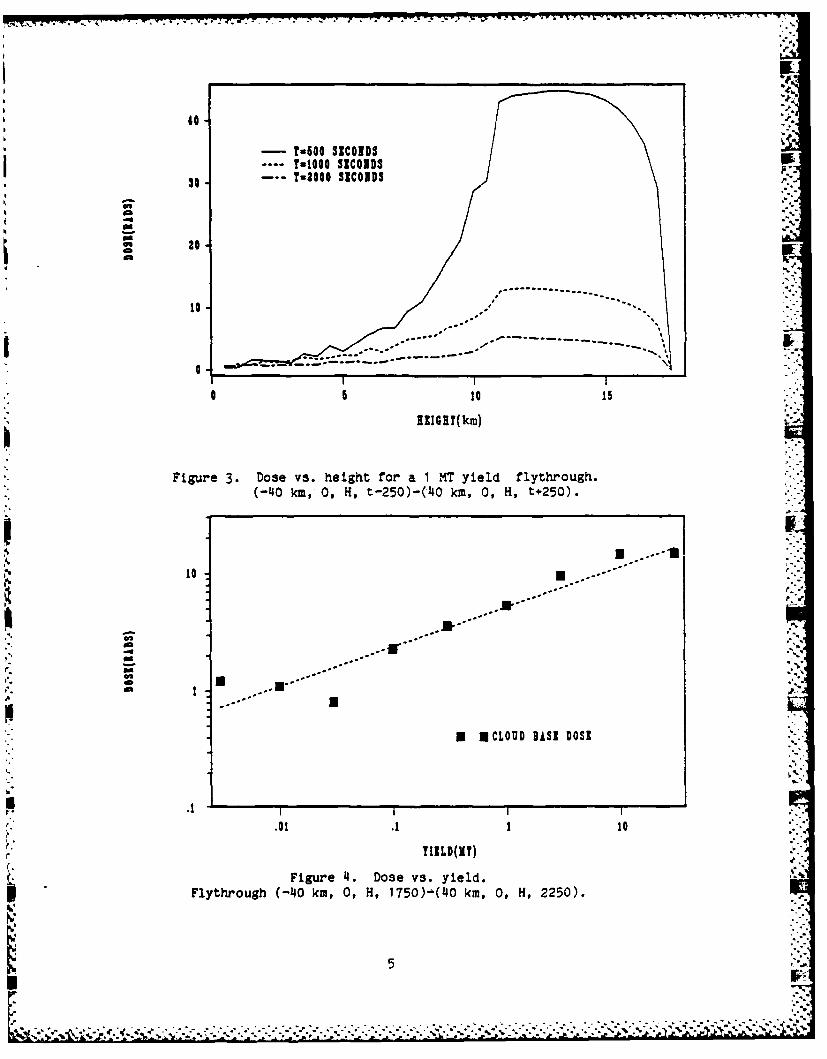
One way of looking at the vertical distribution of dust is to conduct fly-throughs at various heights. Figure 3 shows the dependence of total dose accu-mulated during the flythrough scenario as height is varied for 3 differenttimes. For T-500 s the flythrough starts 250 s and ends 750 s after burst. Theaircraft passes through the entire cloud (radius - 13.8 km (8.4 mi)) beforestabilization is reached at 783 s (Table 1). The dose is nearly constant forflythroughs passing through the cloud. As the aircraft flies at heights lowerthan the cloud base, the dose received is relatively much lower; only largeparticles have fallen out to those levels. At later times, the dust activityhas decayed as well as fallen. The dose received during flights below the cloudbase is relatively more substantial.
The flythrough at the cloud base receives the largest dose. In the follow-
ing analyses, this will be considered as the worst case scenario.
DOSE AT THE END OF FLYTHROUGH
The dose from a flythrough is strongly dependent on the time of flythroughand the yield of the detonation. Figure 4 shows the dose accumulated by the endof the flythrough at the cloud base vs. yield at 1000 s. Although the data onthis graph (Fig. 4) do not all lie on a straight line, the data with yieldsgreater than 0.1 MT strongly suggest a power relationship.
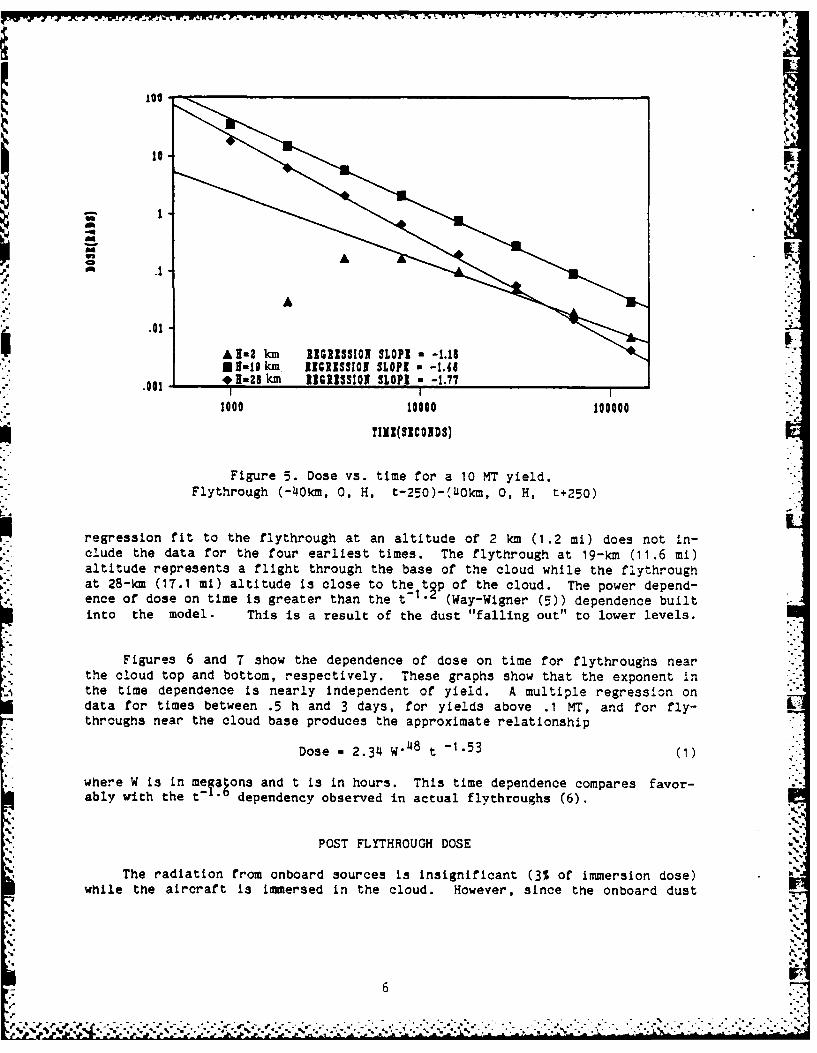
Figure 5 shows the dependence of dose at the end of flythrough on time offlythrough. The time plotted is the time after detonation that the aircraft
passes over ground zero. Regression lines to these data are also shown. The
. . . .. .. . ..... ........ .. -.-... ... .S, ,.-. ................... .... ........ .....,.-.......-..- -......... .......... ..... .... -..... .. . ., , .
-11~~+' 7 I_ 5
40
. TuSGO00 SICOIDS i-- 10O SECONDS
30 'T-oGo0 SICONDS .
20 -
10o
-- - - - - - - - - ---------
.= .,. . -----
0 5 t0 15
BIIGET(km)
Figure 3. Dose vs. height for a 1 MT yield flythrough.(-40 km, 0, H, t-250)-(40 km, 0, H, t+250).
!IL
..... .
Fiue4.Ds s.yed
0m ,,150 4 m 0 H, 2 .....
- "N
U U CLOUD BASKe DOStE"-
Fltog (0ki,,H, 15)(0k,0, H,25)
TIII.I) ". . . ~ .. .. . .
i 100
A k IGRISI$1 SLOPI - -1.18.0 1-10 km_ RIGRISSION SLOPI a -1.18m s-jg km RIGRISSIOI SLOPI - -1.48
.001 *,-28 km 1IIS3ION SLOPI n -1.77
1000 10000 100000
TIMI(SICONDS)
Figure 5. Dose vs. time for a 10 MT yield.Flythrough (-40km, 0, H, t-250)-(liOkm, 0, H, t+250)
regression fit to the flythrough at an altitude of 2 km (1.2 mi) does not in-elude the data for the four earliest times. The flythrough at 19-km (11.6 mi)altitude represents a flight through the base of the cloud while the flythroughat 28-km (17.1 mi) altitude is close to the tp of the cloud. The power depend-
a.. ence of dose on time is greater than the t-1 - (Way-Wigner (5)) dependence builtinto the model. This is a result of the dust "falling out" to lower levels.
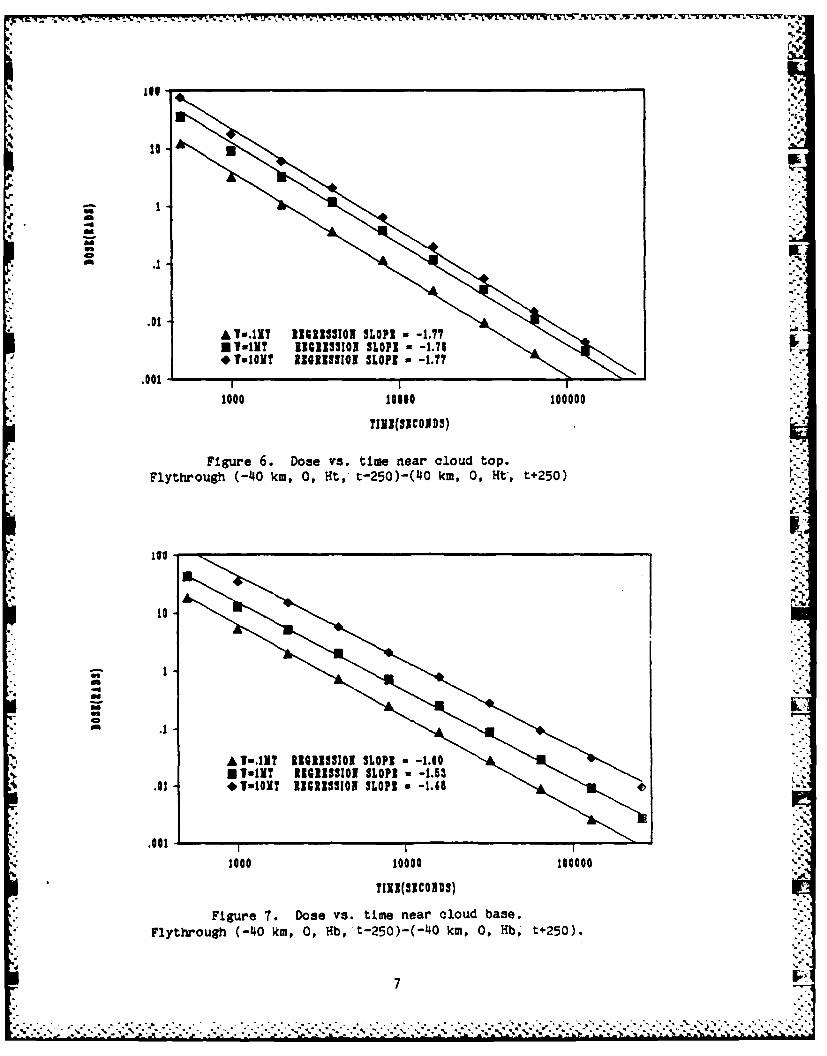
Figures 6 and 7 show the dependence of dose on time for flythroughs nearthe cloud top and bottom, respectively. These graphs show that the exponent inthe time dependence is nearly independent of yield. A multiple regression ondata for times between .5 h and 3 days, for yields above .1 MT, and for fly-throughs near the cloud base produces the approximate relationship
Dose - 2.34 W"48 t -1.53 (1)
where W is in mefa~ons and t is in hours. This time dependence compares favor-ably with the t- dependency observed in actual flythroughs (6).
POST FLYTHROUGH DOSE .'.
The radiation from onboard sources is insignificant (3% of immersion dose)while the aircraft is immersed in the cloud. However, since the onboard dust
6
Ail.
10 .1
A o1.01113113OP 173 VuINT 1191133101 310PI *-1.76
*TwIGIT 1191133101 SLOPI -1.77 -
1000 10000 100000
TI]NZ(SRCOJDS)
Figure 6. Dose vs. time near cloud top.Flythrough (-40 kmn, 0, Ht, t-250)-(40 kmn, 0, Ht", t+250)
IQ
.01 *iTi11 11411S3101 SLOPS -1.80
M T-NT 19113101 LOPI -1.5
.001 1-0?11110 LP -18
1000 10000 100000
T!RI(SICONDS)
Figure 7. Dose vs. time near cloud base.Flythrough (-40 kmn, 0, Kb, t-250)-(-40 kmn, 0, Hb, t+250).
- • .. . .. _._._
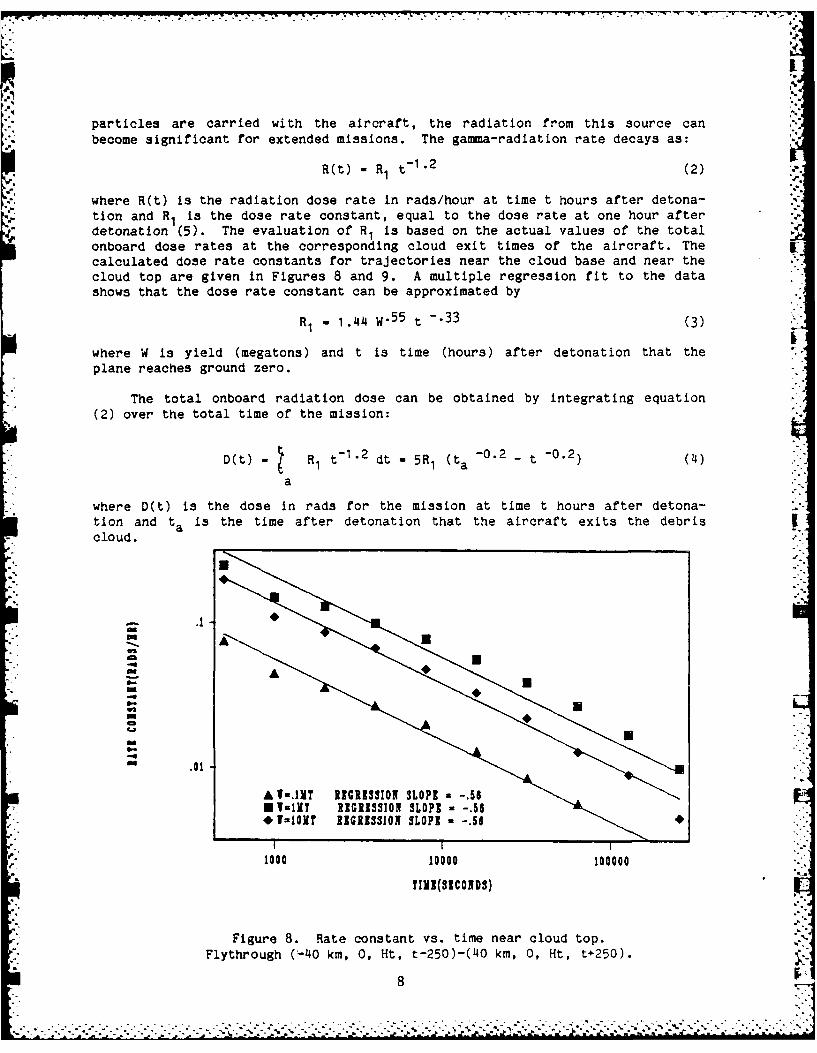
particles are carried with the aircraft, the radiation from this source can
become significant for extended missions. The gamma-radiation rate decays as:
R(t) = R t- 1 .2 (2) .
where R(t) is the radiation dose rate in rads/hour at time t hours after detona-
tion and RI is the dose rate constant, equal to the dose rate at one hour afterdetonation (5). The evaluation of RI is based on the actual values of the totalonboard dose rates at the corresponding cloud exit times of the aircraft. The Icalculated dose rate constants for trajectories near the cloud base and near the
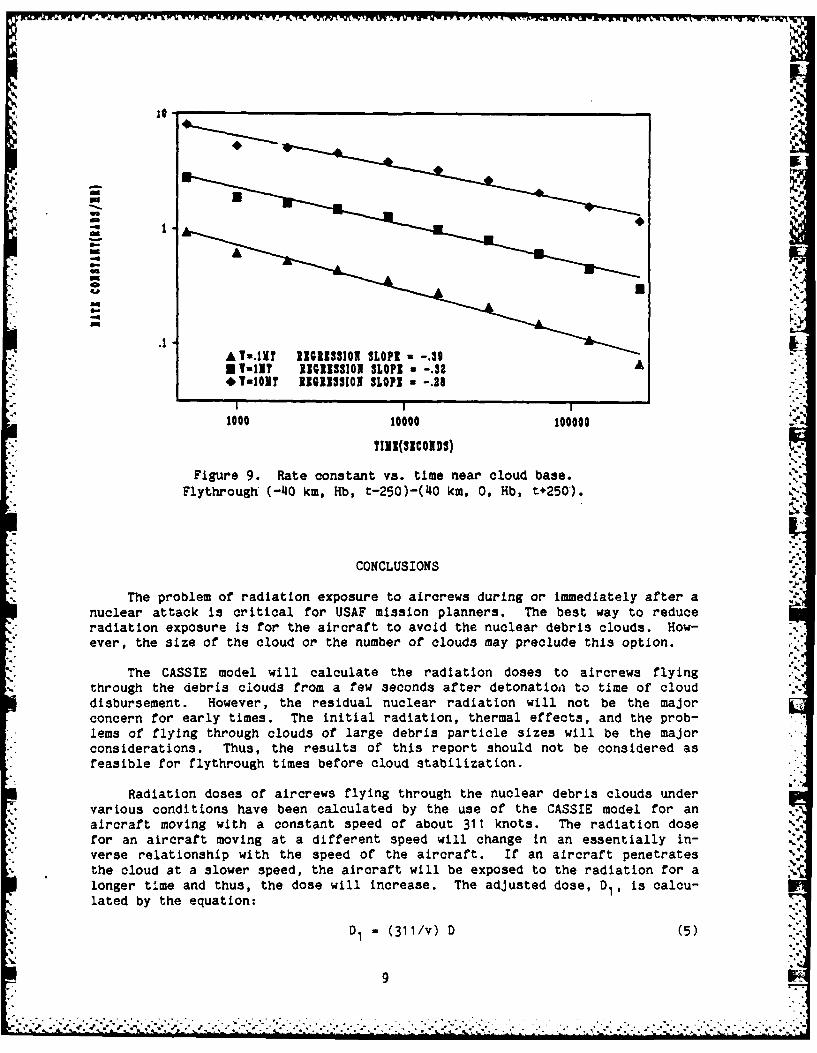
cloud top are given in Figures 8 and 9. A multiple regression fit to the datashows that the dose rate constant can be approximated by
R1 - 1.44 W- 5 5 t -- 33 (3)
where W is yield (megatons) and t is time (hours) after detonation that theplane reaches ground zero.
The total onboard radiation dose can be obtained by integrating equation(2) over the total time of the mission:
D(t) - RI t-1. 2 dt - 5R I (ta -0.2 - t (4)
a
where D(t) is the dose in rads for the mission at time t hours after detona-
tion and ta is the time after detonation that the aircraft exits the debriscloud.
- A
m
a..
A 1-3!1T ISCRISSION SOS -5M I-lifT ISREGISSION SOS -5* T=IOQXT ISIGRISS10N SLP•-5
I I
1000 0000100000
Figure 8. Rate constant vs. time near cloud top. ."Flythrough (-40 km, 0, Ht, t-250)-(40 km, 0, Ht, t+250). .
8
A Vu.IMT 1191133101 3LOPI -. 30. -, •i . 1 1| 11 3101 SLOPB-I -.32 A
7l4-101T 1191133101 SLOPI -. 28
100100 100
TIMI($|CONDS) .
Fiue9. Rate constant vs. time near cloud base.
Flythrougli (-40 km, Hb, t-250)-(40 km, 0, Hb, t+250').
CONCLUSIONS,.. l1
- !
The problem of radiation exposure to aircrews during or immediately after a ,
nuclear attack is critical for USAF mission planners. The best way to reduceradiation exposure is for the aircraft to avoid the nuclear debris clouds. How-ever, the size of the cloud or the number of clouds may preclude this option.
The CASSIE model will calculate the radiation doses to aircrews flyingthrough the debris clouds from a few seconds after detonation to time of clouddisbursement. However, the residual nuclear radiation will not be the majorconcern for early times. The initial radiation, thermal effects, and the prob-lems of flying through clouds of large debris particle sizes will be the majorconsiderations. Thus, the results of this report should not be considered asfeasible for flythrough times before cloud stabilization. ~
Radiation doses of aircrews flying through the nuclear debris clouds undervarious conditions have been calculated by the use of the CASSIE model for anaircraft moving with a constant speed of about 311 knots. The radiation dose
for an aircraft moving at a different speed will change in an essentially in-verse relationship with the speed of the aircraft. If an aircraft penetratesthe cloud at a slower speed, the aircraft will be exposed to the radiation for alonger time and thus, the dose will increase. The adjusted dose, DI, is calcu-lated by the equation:
4-"
D (1v
- -
. . : : . -. ... . .. ... .... ... , , . . .. . . . .. . , . ,. . .,"* i. " -.t "i -" " -' ' = ' ' " ' '' '' ' ' '" ' ' '' ' .-' ' "
4'4
where v is the actual speed of the aircraft in knots and D is the predicted
dose that the aircraft would have had if it traveled at a speed of 311 knots.The error introduced by this approximation is less than 6% for a range of speedsof 200 to 700 knots at a flythrough time of 1 h. For later times or for speeds R.
closer to 311 knots, this approximation is even better.
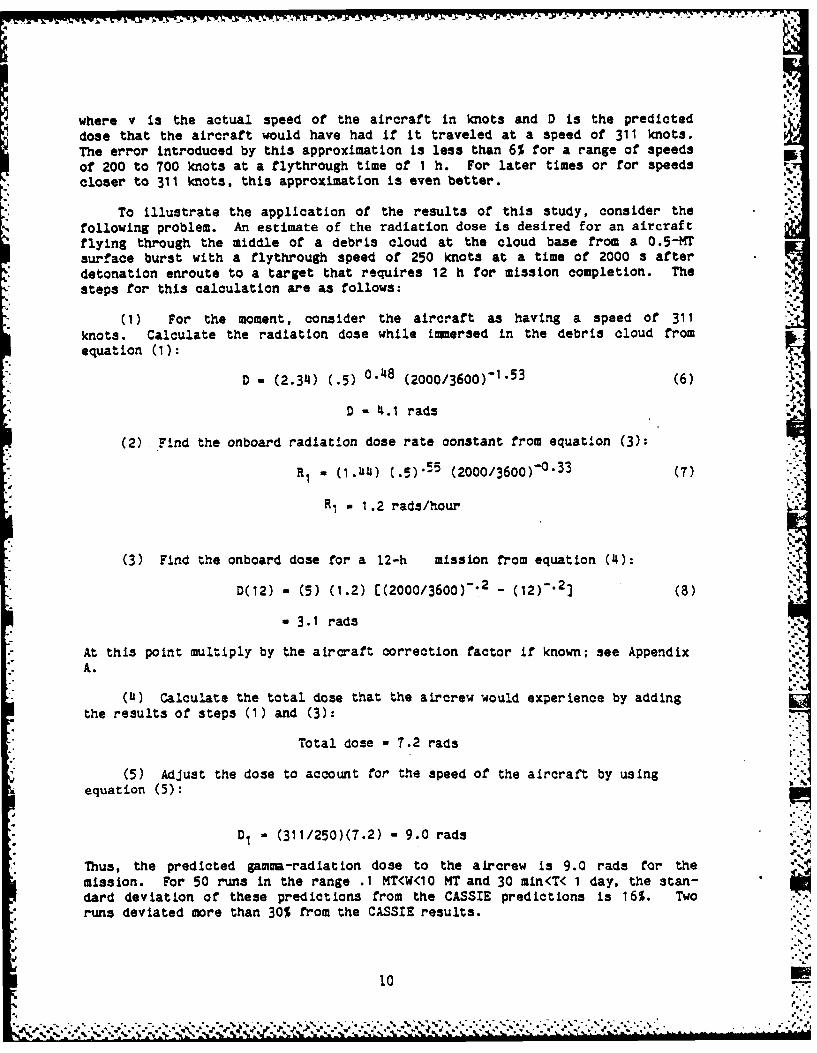
To illustrate the application of the results of this study, consider the .following problem. An estimate of the radiation dose is desired for an aircraft
flying through the middle of a debris cloud at the cloud base from a 0.5-MTsurface burst with a flythrough speed of 250 knots at a time of 2000 s after
, detonation enroute to a target that requires 12 h for mission completion. Thesteps for this calculation are as follows:
(1) For the moment, consider the aircraft as having a speed of 311
knots. Calculate the radiation dose while immersed in the debris cloud fromequation (1):
D 1 (2.34) (.5) 0.48 (2000/3600)-1. (6)
D - 4.1 rads
(2) Find the onboard radiation dose rate constant from equation (3):
R (I.h4) (.5).S5 (2000/3600)-'0.33 (7)
R1 - 1 .2 rads/hour
(3) Find the onboard dose for a 12-h mission from equation (4):
D(12) - (5) (1.2) E(2000/3600) -.2 - (12) -'23 (8) •
- 3.1 rads
At this point multiply by the aircraft correction factor if known; see AppendixA.
(4) Calculate the total dose that the aircrew would experience by adding
the results of steps (1) and (3):
Total dose - 7.2 rads
(5) Adjust the dose to account for the speed of the aircraft by usingequation (5):
D1 - (311/250)(7.2) - 9.0 rads
Thus, the predicted gamma-radiation dose to the aircrew is 9.0 rads for themission. For 50 runs in the range .1 MT<W<10 MT and 30 min<T< 1 day, the stan-dard deviation of these predictions from the CASSIE predictions is 16%. Tworuns deviated more than 30% from the CASSIE results.
A10
dl..
If the aircraft flies through more than one cloud, the radiation dose of ,-'.
each cloud must be calculated separately. The total dose is the sum of all theindividual doses.
ACKNOWLEDGMENTS
We gratefully acknowledge the encouragement and technical assistance of
Colonel (Ret.) J. E. Pickering, chief of the Radiation Sciences Division of theUSAF School of Aerospace Medicine, Brooks Air Force Base. Appreciation andthanks are also extended to Dr. R. A. Albanese, Mr. Earl Bell, ROTC CadetWilliam Berger, Dr. D. N. Farrer, and Dr. J. Taboada for their technical adviceand support.
REFERENCES
1. Taboada, J., D. Hegedusich, and E. Bell. Interactive scenario computermodel for dose rates to aircrew in flight through nuclear debris clouds.USAFSAM-TR-85-49, USAF School of Aerospace Medicine, Brooks AFB, Texas,July 1985.
2. Showers, R. L., and C. Crisco. User's manual tar CASSANDRA: CloudSnapshots of Dust Raised Aloft. Report ARBRL-TR-02116, Ballistic ResearchLaboratory, Aberdeen Proving Ground, MD, 1978.
3. Norment, H. G., DELFIC: Department of Defense fallout prediction systemVol I and II. Report DNA 5159F-1, Atmospheric Science Associates, MA, 1977.
4. Glasstone, S., and P. J. Dolan. The effects of nuclear weapons, 3d ed.,P. 391. U.S. Government Printing Office, Washington D.C., 1977.
5. Way, K., and E. P. Wigner. The rate of decay of fission products. PhysRev 73:1318 (1948). -
6. Banks, J. E., Operation TEAPOT. Manned penetrations of atomic clouds,Project 2.8b. Report WT-1156 (EX), Air Force Special Weapons Center,Kirtland Air Force Base, NM, 1958.
7. Norment, H. G., Validation and Refinement of the DELFIC Cloud Rise Module.Report DNA 4320F, Atmospheric Science Associates, MA, 1977.
I...:,,
°11,
7-.7
APPENDIX A
CORRECTION FOR AIRCRAFT PARAMETERS
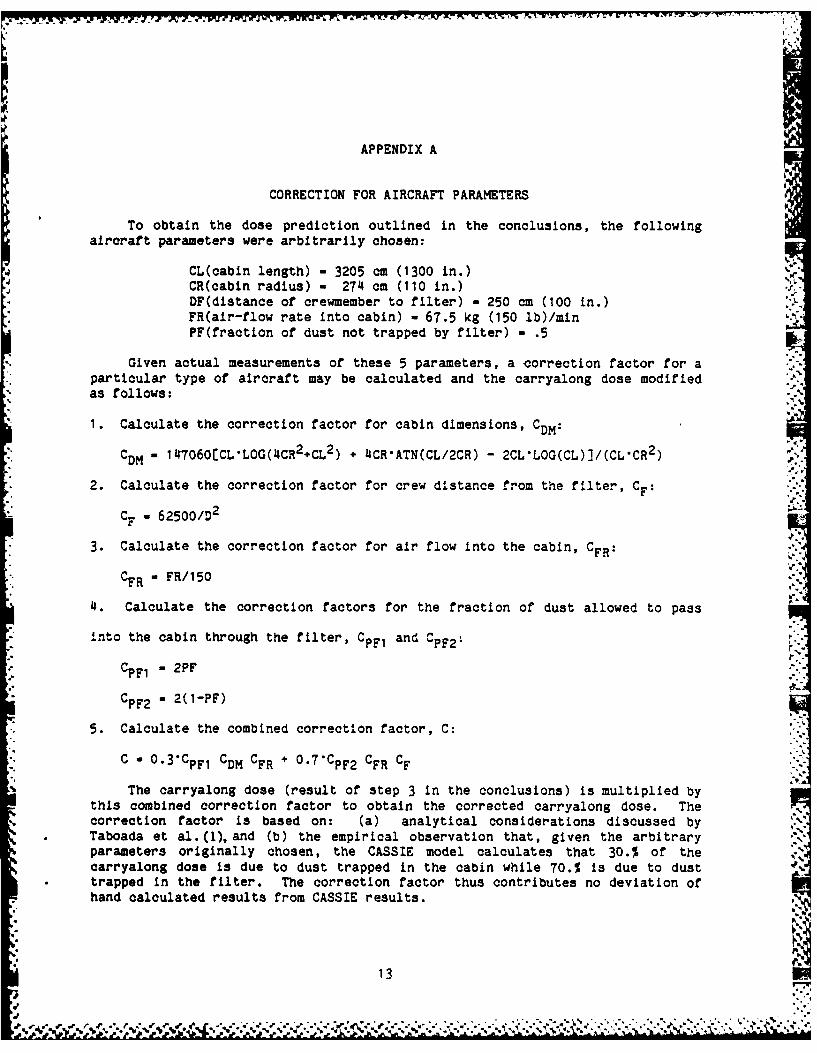
To obtain the dose prediction outlined in the conclusions, the followingaircraft parameters were arbitrarily chosen:
CL(cabin length) - 3205 cm (1300 in.)CR(cabin radius) - 274 cm (110 in.)DF(distance of crewmember to filter) - 250 cm (100 in.)FR(air-flow rate into cabin) - 67.5 kg (150 ib)/minPF(fraction of dust not trapped by filter) - .5
Given actual measurements of these 5 parameters, a correction factor for aparticular type of aircraft may be calculated and the carryalong dose modifiedas follows:
1. Calculate the correction factor for cabin dimensions, CDM:
2CDM - 14060CLLOG(CR+CL2) 4CR'ATN(CL/2CR) - 2CL'LOG(CL)]/(CL.CR 2)
2. Calculate the correction factor for crew distance from the filter, CF:
CF - 62500/D2
3. Calculate the correction factor for air flow into the cabin, CFR:
CFR - FR/150
4. Calculate the correction factors for the fraction of dust allowed to pass
into the cabin through the filter, CPFl and 2'PF21
CPF 1 - 2PF
CPF2 - 2(1-PF)
5. Calculate the combined correction factor, C:
-, C - 0.3CpF 1 CDM CFR P .7 CpF 2 CFR CF
The carryalong dose (result of step 3 in the conclusions) is multiplied bythis combined correction factor to obtain the corrected carryalong dose. Thecorrection factor is based on: (a) analytical considerations discussed byTaboada et al. (1), and (b) the empirical observation that, given the arbitraryparameters originally chosen, the CASSIE model calculates that 30.3 of thecarryalong dose is due to dust trapped in the cabin while 70.3 is due to dusttrapped in the filter. The correction factor thus contributes no deviation ofhand calculated results from CASSIE results.
13
APPENDIX B
EVALUATION OF MODEL ASSUMPTIONS
In the CASSIE model, the dose rate for a flythrough is calculated by thefollowing steps.
(1) Divide the flight path into a sequence of target points (xl, yI' Z1 , t),(x2, Y2 . z2, t2)""(Xn, Yn, ZN, tn), each 4 km apart.
(2) Calculate the dust concentration at each target point for each of 100 dust
sizes using the CASSANDRA code.
(3) Calculate the dose rate at each target point assuming:
(a) The rate contributed by a volume of space is proportional to the massof dust contained therein.
(b) When the dose rate is calculated at a particular target point, thedust concentration is uniform and equal to the concentration at the targetpoint.
(c) The cloud is considered to be infinite in extent for the purpose ofintegrating the dose rate for a target point.
(4) Approximate the dose integration over the flight path by assuming:
(a) Constant velocity
(b) The dose rate varies linearly between target points.
Each of these operations contributes some error. An analysis of the extentof some of them follows.
Frequency of Target Points
A variety of flight paths were evaluated by taking points much closertogether than 4 km (2.4 ml). The differences between these doses and theoriginal dose were less than 5%. Thus, it was concluded that the 4 km (2.4 mi)interval for target points was a good compromise between accuracy and computertime.
Integration to get Gamma Rate
Taboada et al. (1) calculated the immersion dose rate D at a point (ri )
and time (t) by the following integral:
100
D(r,) - t- 1 2 Kij K(J)f p(r,t,j) elp (-KR1Ir - r1 l) dV (B-1)41 Ir - ri,2
15
- ,-, ,p; , , -, , , , , ., , .. . . . . . .. . , . . . . ..... .. < .'i-- --- •- '" . . .,.,..v -- ,... .. ,."...
The space dependent portion of the gamma rate at any point for each dustsize category is
D (ri,j) - Constant* f p(r,j) exp (-K3 Ir - r41 ) dV (B-2)
4w Ir --r 12- i.
where ri is the i th target point location, p(r) is the dust density at loca-tion r, K3 - 6.767 x 10- meters -1 is the atmospheric absorption of a 1-MeV gamma photon, and j is the dust size category. The integral is takenover the volume of the cloud. If a coordinate transformation is made to putthe origin at the target point and spherical coordinates are used, thisequation becomes
D (ri,j) = Constant fff p(s,j) exp (-K3 s) sine dedods (B-3)4w
If the assumptions in steps 3(b) and 3(c) are made, then p(s) . p(ri). Then,p(s) is constant for purposes of evaluating the integral. Also, the cloud isspherically symmetric and infinite in size. Thus, the integral becomes
D(ri,j) - Constant p(ri,j) f exp (-K3 s) ds (B-4)0
D(ri,j) - Constant p(ri,j)/K 3 (B-5)
Two objections may occur at this point. First, the dust density does notcontinue indefinitely. This is not a serious problem because only 1% of thedose rate calculated by this approximation is due to any activity beyond a 680m (2244 ft) sphere about ri. That is,
80 exp(-K 3 s)ds - .99 fIexp(-K 3 s)ds (B-6)
A second objection is that p(r) is not constant enough even within a 680 m(2244 ft) sphere to make a good approximation. To estimate the error incurredfrom the constant density approximation, an alternative integration scheme wasperformed, using the following symmetry argument. Consider the target point (xi,Yip zip ti). Poll the dust concentrations at 7 points: (xi, yi, zi, t ), (xi ±200m, yi' zi, ti), (xi, yi ± 200m, zi, ti) and (xi, yi, zi ± 200m, ti Assumethe dust concentration is uniform within a 100 m (327 ft) sphere around thetarget point. This region would encompass one-half the dose rate in the previ-ous scheme. Divide the remaining space into 6 "congruent" (infinite) regions,each with axis of symmetry about the line through (xi, yi, zi) and the respec-tive polling point. This can be pictured by imagining the 8 points of a cube,(xi ± d, yi ± d,zi ± d), on a hollow cantaloupe and slicing between them. Ofcourse, this cantaloupe is infinite in radius. The intent of this division isto justify a weighting of the polled points. The dose rate due to one of theoutside regions is one-twelfth of the rate calculated over all space if the dustconcentration were uniformly equal to that of the polled point. In like manner,the interior sphere receives a one-half weighting.
16
The sequence of polling points (x1 y, z + 200, t1), .... (Xn, Yn, Zn +200, tn) creates a flight path 200 m (660 ft, above the original. The dosereceived from the upper outside region can be evaluated by running the originalprogram and taking one-twelfth of the resulting dose. The same is true of (xi,yi ± 200, zi, ti) and (xi, Yi, zi - 200, ti). The other 2 outside integrationregions (xi ± 200, yi, zi, t form flight paths along the original path butshifted in time by 200 m 1660 ft)/velocity, which is a negligible amount. It isassumed that the starting and ending points are outside the cloud.
Thus, the dose from this integration scheme is a linear function of 5 runsof the original program:
New dose estimate
- (1/2 + 1/12 + 1/12) Dose E(xl, yI, z1, tl) (Xn, Yn, Zn, tn)]
+ (1/1.2) Dose [(Xl, yl + 200, Zl, tI) + (xn, Yn + 200, Zn, tn)]
+ (1/12) Dose [(xl, y1 - 200, zI , tI) + (Xn, Yn - 200, zn, tn)) (B-7)
+ (1/12) Dose [(xl, y1 , Z, + 200, t) + (Xn, Yn' Zn + 200, tn)J
+ (1/12) Dose [(xj, YI, Zl - 200, tI) + (xn , Yn' Zn - 200, tn)]
The doses predicted by CASSIE along the (x 200, zI , tI) -
(Xn, Yn ± 200, zn, tn) flight paths do not differyfrom the prediction along theoriginal path. As can be seen from Figure 3, doses along the (xj, y1,z ± 200,tl)-(xn, Yn, Zn ± 200, tn) paths may differ by 25% from the prediction along theoriginal path but both will not differ in the same direction from the original.The choice of one flight path, to differ by 25% while the other agrees with theoriginal is a worst case and results in 25/12 or about 2% error. We take thisas evidence that the original integration scheme is sufficiently accurate.
Calculation of Dust Densities
Results of CASSANDRA agree well with dust concentrations measured in theDial Pack tests using conventional explosives. There are no measurements ofairborne dust from detonations in the megaton range with which to compare themodel's results. The cloud size discrepancy in the megaton range has alreadybeen noted. The lack of experimental data and other models for comparison makesthe sources and amounts of error difficult to assess.
Atmospheric Conditions
The atmospheric winds are assumed to be zero. If nonzero winds are di-rected horizontally, the cloud will be translated as a unit if the winds areuniform and distorted if a wind shear exists. A wind shear along the directionof the flight path will cause little difference in dose while a perpendicularwind shear will produce a lower dose.
The effects of precipitation and large vertical air currents as in athunderstorm are not considered. Precipitation will cause the dust particles tofall out earlier and thus, reduce doses from flythroughs.
17
. .. .-l -. )W - 11-- 2 -. .- , .
Flight Through Cloud Center
The trajectories of the aircraft are assumed to pass over ground zero. Ifthe aircraft passes a distance from ground zero, the radiation dose will bereduced by virtue of the aircraft spending less time inside the cloud and goingthrough a lower dust concentration.
18