analysis of cfd modeling techniques over the mv … of cfd modeling techniques over the mv-22...
TRANSCRIPT

Analysis of CFD Modeling Techniques over the MV-22 Tiltrotor
Jennifer Abras Aerospace Engineer
NAVAIR 4.3.2.1 Patuxent River, MD 20670 [email protected]
Robert Narducci Boeing Associate Technical Fellow
The Boeing Company Philadelphia, PA 19142
ABSTRACT
The V-22 Osprey is a tiltrotor aircraft designed to operate under a wide range of flight conditions. Its outer mold line geometry is aerodynamically complex in part because aerodynamic considerations were not primary influential factors for the major features of the aircraft. As mission requirements change and additional devices are added to the aircraft, questions regarding the aerodynamic impact must be answered. While many of these questions can be adequately answered using lower-fidelity methods, some situations require the use of higher-fidelity analysis. Computational fluid dynamics (CFD) is a tool that has been used frequently to answer aerodynamic questions associated with the V-22. However, the complexity of the aircraft makes this analysis challenging. Using unstructured grids is one way of reducing the lead time required to setup the simulation as unstructured grids lend themselves to modeling complex geometries. This paper compares independent OVERFLOW and FUN3D CFD analyses of the MV-22 tiltrotor in airplane mode over a range of angles of attack, and compares these results to data from a recent high-angle-of-attack wind tunnel test run in the Boeing V/STOL Wind Tunnel. The results lend insight into the choice of grid structure, near-body vortex generation, and numerical methodology, and reveal that care must be taken when setting up the CFD model as well as identifying any numerical phenomena that could be considered code specific.
INTRODUCTION
The V-22 Osprey (Figure 1) is a multi-service, multi-mission tiltrotor aircraft capable of operating in many diverse flight conditions. It is designed to take-off and land as a helicopter and fly like a turboprop airplane. During the design phase, the overall dimensions of the aircraft were defined by shipboard compatibility requirements (for example to operate, fold and stow on an LHA-class ship; and to carry an F-404 engine internally1). The wing thickness, sweep, and dihedral were also determined by non-aerodynamic considerations2. Extensive wind-tunnel testing in the 1980s helped shape the wing-fuselage juncture, overwing fairing, rear fuselage upsweep, and tail configuration.
Figure 1. The V-22 Osprey3.
Presented at the American Helicopter Society 66th Annual Forum, Phoenix, AZ, May 11-13, 2010. This is a work of the U.S. Government and is not subject to copyright protection in the U.S.
Much of the early testing focused on the full-scale development (FSD) aircraft. The current MV-22 Block B configuration has several shape changes including nacelle and spinner; and fuselage sponson. Many avionic kits and antennae are housed in fairings that protrude throughout the fuselage. Recently The Boeing Company re-established its wind tunnel database for the MV-22 (Marines) and CV-22 (Air Force) variants in an entry at the 20 FT x 20 FT Boeing V/STOL Wind Tunnel (BVWT)4,5. A photograph of the MV-22 model is shown in Figure 2.
Figure 2. MV-22 BVWT 0468 high-angle-of-attack 0.15-scale wind tunnel model.
The V-22 Osprey is in full production and has flown many operational missions for the Marines in Iraq and the Air Force in Afghanistan. As it’s capability is being verified and realized in fleet operations, the Marines and Air Force are actively persuing definition of

new missions to take advantage of it’s full potential. To support new designs, conventional aerodynamic tools and handbook assessments are often used to estimate drag or air loads and to size new parts. For aerodynamic interference effects, higher-fidelity analysis such as CFD is often utilized. Wind tunnel testing or flight test demonstrations are conducted whenever the level of uncertainty exceeds the ability of analytical means to predict accurately. However, these tests are expensive and generally have schedule implications.
Computational fluid dynamics (CFD) offers practical and timely analysis to address many aerodynamic designs. Advances in computer technology and computational algorithms have allowed Reynolds-Averaged Navier-Stokes (RANS) solvers to be used routinely in most aircraft programs. The V-22 Program is no exception and has relied on CFD for the past 15 years to provide results for the analysis of the many flow regimes of the tiltrotor aircraft. Today, computational models with tens of millions of grid cells are common and lead to very accurate and sophisticated flow simulations. CFD simulations for airplane-mode operations were studied, for example by Tai6, in the late 1990s. More recently, advances in CFD modeling to capture the rotation of rotor blades have allowed researchers to produce very sophisticated hover simulations. Potsdam studied rotor-fuselage interaction of the V-22 in hover capturing the asymmetric fountain effect7. Using a less sophisticated rotor model Narducci et al. modeled the interaction of two V-22 aircraft in shipboard operations8.
Although every attempt was made to optimize the aerodynamics of the V-22, engineering development involving design to improve shipboard suitability, survivability, reliability and fleet operations have resulted in aerodynamic compromises that caused loss in air-vehicle performance. As a result, design changes were incurred during Engineering Manufacturing Development to regain flight envelope. For instance, external wing fences, forebody strakes and vortex generators were added to increase low-speed and high-speed performance envelope. Though CFD methods are capable of capturing these aerodynamic interactions, application of these methods pose a challenge and proper care and modeling is required; grids designed for specific flow conditions or grid adaptation techniques are sometimes required.
This paper compares independent CFD analyses of the MV-22 in airplane mode. Two CFD codes, a structured code, OVERFLOW 2.1, and an unstructured code, FUN3D 10.8 are utilized to generate solutions over a range of angles of attack for conditions corresponding to 200-knot flight at 3000 feet. The rotors are not modeled to simulate the unpowered airframe aerodynamic wind tunnel testing. Forces and moments are compared and benchmarked against the latest wind-tunnel measurements. Interactional aerodynamics and off-body flow features are also compared.
APPROACH
Both unstructured (FUN3D) and structured (OVERFLOW) CFD approaches are compared and benchmarked against new wind tunnel measurements obtained for the MV-22.
FUN3D 10.8
FUN3D9,10 is an unstructured CFD code developed at NASA Langley that solves the RANS equations using a node-centered 2nd-order upwind implicit scheme. While there a variety of flux schemes and turbulence models that are available, for this study the Roe flux scheme and the Spalart-Allmaras turbulence model have been selected, since this turbulence model is available in both CFD codes studied. Additional relevant settings used within FUN3D consist of steady-state pseudo time-stepping formulation as well as mapped least-squares11. The mapped LSQ option is applied to reduce errors seen in unweighted LSQ methods applied to high aspect ratio elements near curved boundaries. It was ultimately found not to have a significant impact on the results.
OVERFLOW 2.1
OVERFLOW12 is also a RANS code developed at NASA Langley; however solutions are computed on structured overset grids. In this application of OVERFLOW, a 2nd-order finite-volume central differencing scheme with scalar dissipation is utilized with the Spalart-Allmaras turbulence model. Steady-state solutions are obtained using pseudo time-stepping. Hole cuts and block-to-block communication is established using the x-ray technique established by Meakin13. While this technique does not always provide optimal communication among the grid blocks, it does allow the blocks to move relative to each other during a calculation, for example rotor blades, which has been useful in applications of OVERFLOW to other V-22 problems.
GRID
The OML geometry used in this study accurately captures all the major components of the V-22. This includes the wings, fuselage, nacelles, and empennage as well as many of the smaller components of the MV-22B Marine version namely the wing fence, conversion fairing, forebody strakes, VCD, ARRP, FLIR, AA47 fairings, main landing gear door bumps, SATCOM antenna, windshield wiper fairing, landing lights, and glide slope antenna. The surface is shown in Figure 3. For FUN3D, the grid bounding this surface consists of mixed elements14, with prismatic layers near the boundaries and tetrahedral elements in the isotropic regions. The underlying surface geometry used to generate the grid consists of the same PLOT3D surfaces used to generate the OVERFLOW grid. These surfaces were converted to NURBS surfaces for unstructured grid
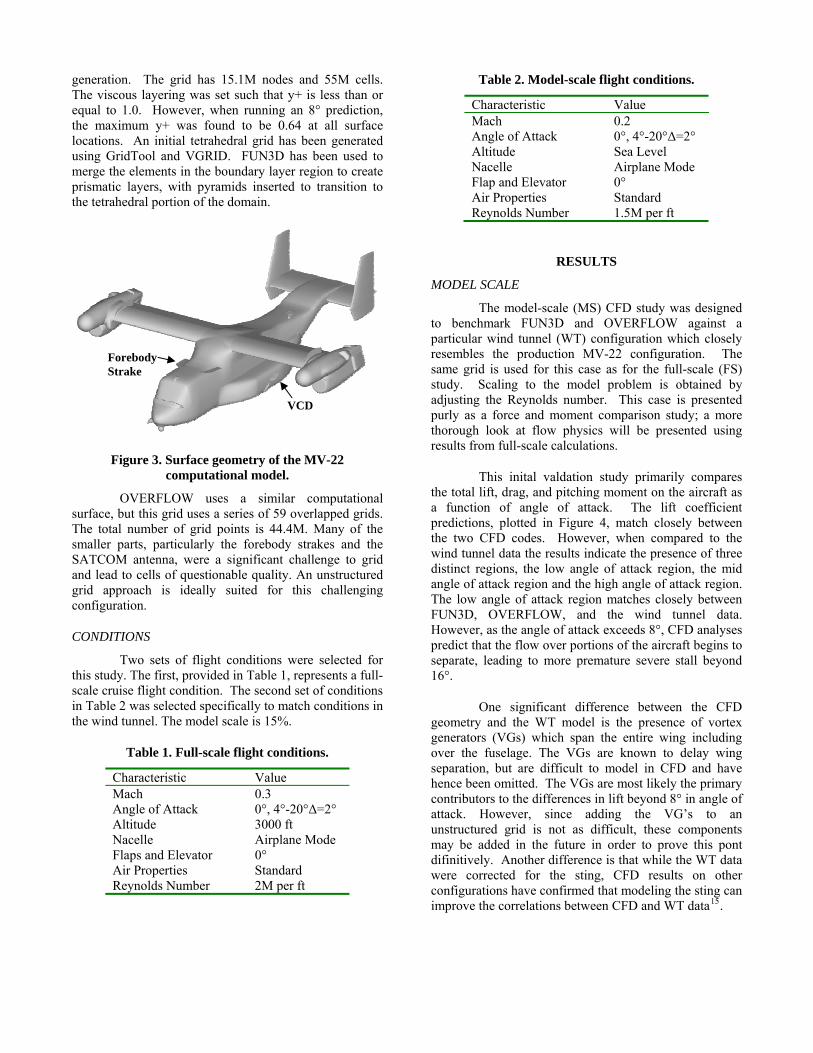
generation. The grid has 15.1M nodes and 55M cells. The viscous layering was set such that y+ is less than or equal to 1.0. However, when running an 8° prediction, the maximum y+ was found to be 0.64 at all surface locations. An initial tetrahedral grid has been generated using GridTool and VGRID. FUN3D has been used to merge the elements in the boundary layer region to create prismatic layers, with pyramids inserted to transition to the tetrahedral portion of the domain.
Figure 3. Surface geometry of the MV-22 computational model.
OVERFLOW uses a similar computational surface, but this grid uses a series of 59 overlapped grids. The total number of grid points is 44.4M. Many of the smaller parts, particularly the forebody strakes and the SATCOM antenna, were a significant challenge to grid and lead to cells of questionable quality. An unstructured grid approach is ideally suited for this challenging configuration.
CONDITIONS
Two sets of flight conditions were selected for this study. The first, provided in Table 1, represents a full-scale cruise flight condition. The second set of conditions in Table 2 was selected specifically to match conditions in the wind tunnel. The model scale is 15%.
Table 1. Full-scale flight conditions.
Characteristic Value Mach 0.3 Angle of Attack 0°, 4°-20°Δ=2° Altitude 3000 ft Nacelle Airplane Mode Flaps and Elevator 0° Air Properties Standard Reynolds Number 2M per ft
Table 2. Model-scale flight conditions.
Characteristic Value Mach 0.2 Angle of Attack 0°, 4°-20°Δ=2° Altitude Sea Level Nacelle Airplane Mode Flap and Elevator 0° Air Properties Standard Reynolds Number 1.5M per ft
RESULTS
MODEL SCALE
The model-scale (MS) CFD study was designed to benchmark FUN3D and OVERFLOW against a particular wind tunnel (WT) configuration which closely resembles the production MV-22 configuration. The same grid is used for this case as for the full-scale (FS) study. Scaling to the model problem is obtained by adjusting the Reynolds number. This case is presented purly as a force and moment comparison study; a more thorough look at flow physics will be presented using results from full-scale calculations.
Forebody Strake
VCD
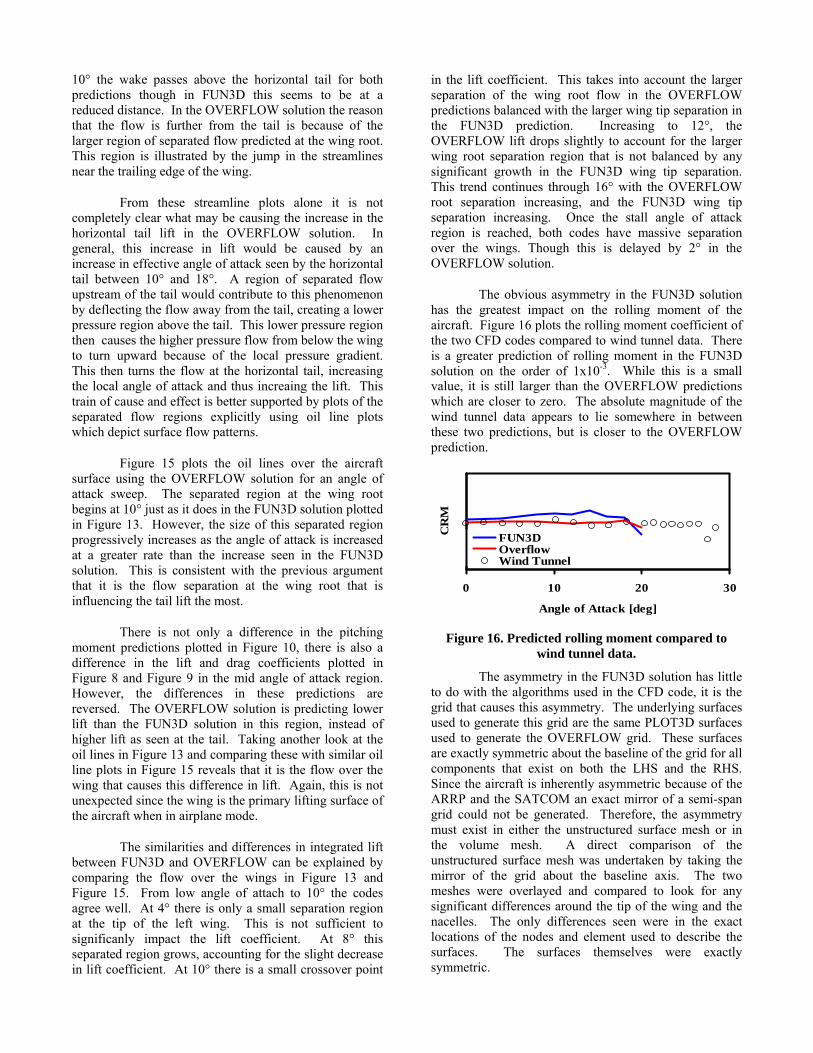
This inital valdation study primarily compares the total lift, drag, and pitching moment on the aircraft as a function of angle of attack. The lift coefficient predictions, plotted in Figure 4, match closely between the two CFD codes. However, when compared to the wind tunnel data the results indicate the presence of three distinct regions, the low angle of attack region, the mid angle of attack region and the high angle of attack region. The low angle of attack region matches closely between FUN3D, OVERFLOW, and the wind tunnel data. However, as the angle of attack exceeds 8°, CFD analyses predict that the flow over portions of the aircraft begins to separate, leading to more premature severe stall beyond 16°.
One significant difference between the CFD geometry and the WT model is the presence of vortex generators (VGs) which span the entire wing including over the fuselage. The VGs are known to delay wing separation, but are difficult to model in CFD and have hence been omitted. The VGs are most likely the primary contributors to the differences in lift beyond 8° in angle of attack. However, since adding the VG’s to an unstructured grid is not as difficult, these components may be added in the future in order to prove this pont difinitively. Another difference is that while the WT data were corrected for the sting, CFD results on other configurations have confirmed that modeling the sting can improve the correlations between CFD and WT data15.

0 10 20
Angle of Attack [deg]
CL
30
Wind TunnelFUN3DOverflow
Figure 4. Computed MS aircraft lift vs. WT data.
The drag predictions plotted in Figure 5 match closely, particularly between FUN3D and the WT measurements. OVERFLOW predicts slightly higher drag which has been traced to the viscous component. However, even with the offset both predictions are close to the wind tunnel data in character and magnitude. This data does not exhibit the same three-region division seen in the lift coefficient.
0 10 20
Angle of Attack [deg]
CD
30
Wind TunnelFUN3DOverflow
Figure 5. Computed MS aircraft drag vs. WT data.
The predicted pitching moment plotted in Figure 6 has the same divisions seen in the lift data. Here, the aerodynamics of the horizontal tail are strongly emphasized because of the large moment arm between the moment center and the horizontal tail. In this case, unlike the lift and the drag, there is a clear difference between
the FUN3D and OVERFLOW results for higher angles of attack. This difference is due in part to different predictions of the forbody/wing interaction between the two codes. This is studied more thorougly in the full-scale results section.
0 10 20
Angle of Attack [deg]C
M30
Wind TunnelFUN3DOverflow
Figure 6. Computed MS aircraft pitching moment vs. WT data.
The comparison of FUN3D and OVERFLOW to experimentally measured forces and moments reveal that predictions at angles of attack of 8° and below can be made with confidence. Differences in lift beyond 8° are attibuted to the VGs which remain an important challenge to model computationally. Still other differences exist and are most visible in the the pitching moment comparison. Of greater interest to the V-22 program are calculations made at full-scale conditions. Further studies comparing FUN3D and OVERFLOW are made at this scale, with comparisons to WT data used sparingly to provide a point of reference.
FULL SCALE
Even by disregarding the rotor, there are many aerodynamic phenomena associated with vortex generation and vortex interaction for the V-22. These features change significantly as a function of the aircraft angle of attack. Figure 7 shows the isosurface of vorticity plotted over the entire aircraft at an angle of attack of 6°. Rotational flow over the nacelles, VCDs, and forebody strakes is easily identified in this image. Of these, the forebody strakes and the VCDs are specifically intended to promote flow interaction under specific flight conditions. Under the conditions shown here the forebody strake vortex is interacting directly with the root of the wing. Physically, this is the expected result and the computational model is able to capture this vortex.
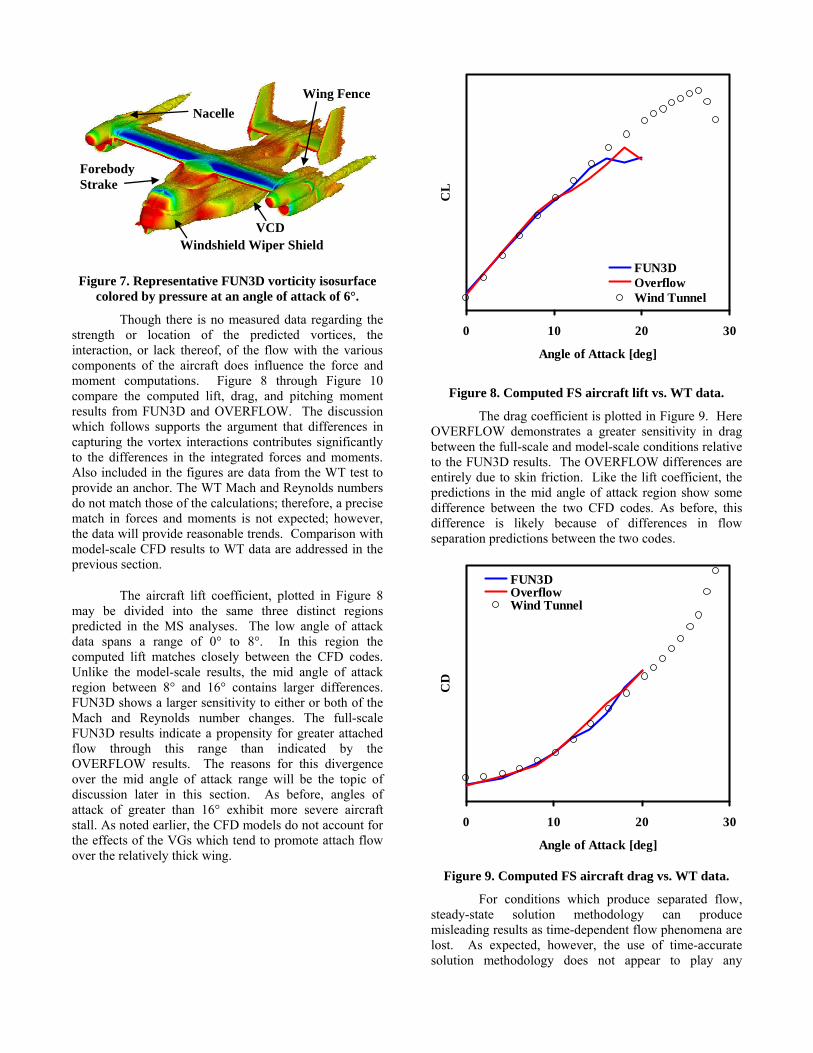
Figure 7. Representative FUN3D vorticity isosurface colored by pressure at an angle of attack of 6°.
Though there is no measured data regarding the strength or location of the predicted vortices, the interaction, or lack thereof, of the flow with the various components of the aircraft does influence the force and moment computations. Figure 8 through Figure 10 compare the computed lift, drag, and pitching moment results from FUN3D and OVERFLOW. The discussion which follows supports the argument that differences in capturing the vortex interactions contributes significantly to the differences in the integrated forces and moments. Also included in the figures are data from the WT test to provide an anchor. The WT Mach and Reynolds numbers do not match those of the calculations; therefore, a precise match in forces and moments is not expected; however, the data will provide reasonable trends. Comparison with model-scale CFD results to WT data are addressed in the previous section.
The aircraft lift coefficient, plotted in Figure 8 may be divided into the same three distinct regions predicted in the MS analyses. The low angle of attack data spans a range of 0° to 8°. In this region the computed lift matches closely between the CFD codes. Unlike the model-scale results, the mid angle of attack region between 8° and 16° contains larger differences. FUN3D shows a larger sensitivity to either or both of the Mach and Reynolds number changes. The full-scale FUN3D results indicate a propensity for greater attached flow through this range than indicated by the OVERFLOW results. The reasons for this divergence over the mid angle of attack range will be the topic of discussion later in this section. As before, angles of attack of greater than 16° exhibit more severe aircraft stall. As noted earlier, the CFD models do not account for the effects of the VGs which tend to promote attach flow over the relatively thick wing.
0 10 20
Angle of Attack [deg]
CL
Wing Fence Nacelle
Forebody Strake
30
FUN3DOverflowWind Tunnel
Figure 8. Computed FS aircraft lift vs. WT data.
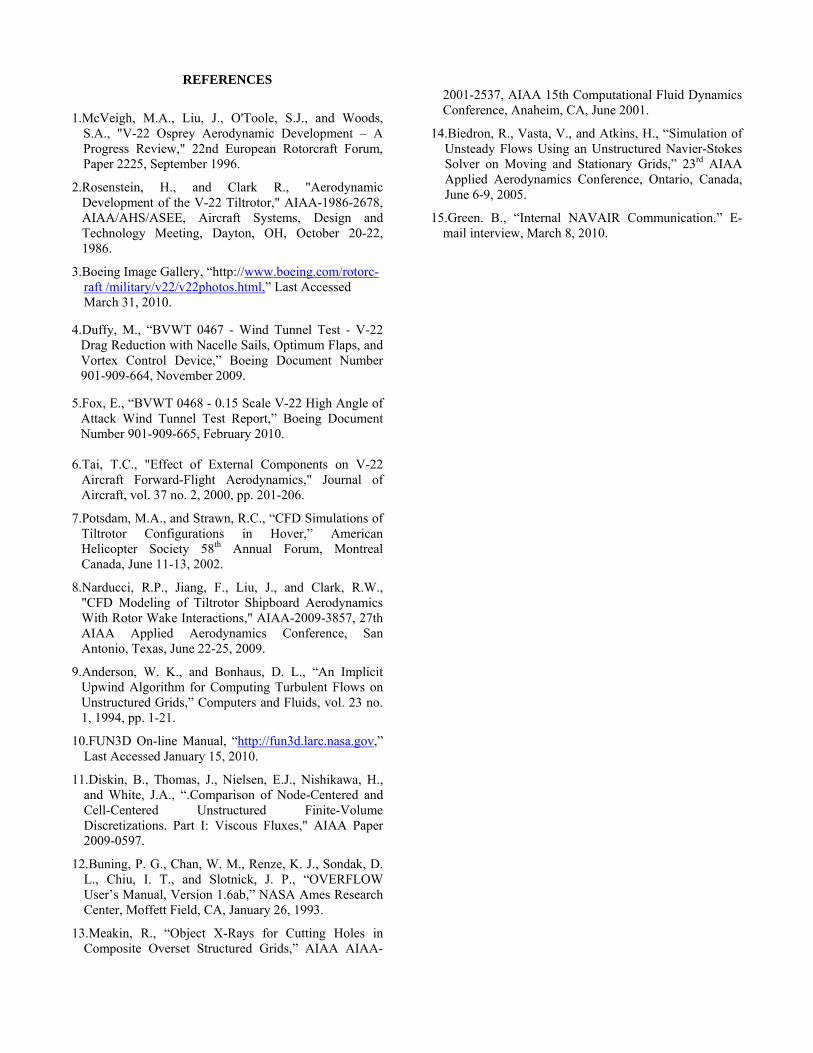
The drag coefficient is plotted in Figure 9. Here OVERFLOW demonstrates a greater sensitivity in drag between the full-scale and model-scale conditions relative to the FUN3D results. The OVERFLOW differences are entirely due to skin friction. Like the lift coefficient, the predictions in the mid angle of attack region show some difference between the two CFD codes. As before, this difference is likely because of differences in flow separation predictions between the two codes.
0 10 20
Angle of Attack [deg]
CD
30
FUN3DOverflowWind Tunnel
Figure 9. Computed FS aircraft drag vs. WT data.
For conditions which produce separated flow, steady-state solution methodology can produce misleading results as time-dependent flow phenomena are lost. As expected, however, the use of time-accurate solution methodology does not appear to play any
Windshield Wiper Shield VCD

significant role in the accuracy of the predictions at angles of attack below 10°, where flow is generally attached. Table 3 compares the steady-state and time-accurate results obtained when running FUN3D using a percent difference computation between the time-accurate and the steady-state solutions. These particular solutions were obtained using a full tetrahedral grid and different inputs for the numerical solution methodology. At 10° the predicted time-accurate solution has reached a steady-state and matches closely when a steady-state solution is forced. However, after 16° the flow over the wing has become more separated and the use of time-accurate methods becomes more important since the unsteadiness of the shed flow is of interest. In this case the average of the time-accurate solution at 18° does not exactly match the steady-state solution. This difference is because the time-accurate prediction is able to model unsteady phenomena at high angles of attack that the steady-state solution cannot.
Table 3. Steady-state vs. time-accurate CFD.
AoA CL CD CM 10° 0.079% 0.053% 0.598% 18° 4.104% 0.770% 0.115%
The pitching moment coefficient data, plotted in Figure 10, may be divided into the same three distinct regions. The physics that define these three regions are dominated by the interaction of the upstream flow over the wing with the horizontal tail. This interaction changes the local angle of attack at the tail and thus changes the lift generated by the tail.
0 10 20
Angle of Attack [deg]
CM
30
FUN3DOverflowWind Tunnel
Figure 10. Computed FS aircraft pitching moment vs.
WT data.
These line plots only show the overall predictions of the CFD solutions. A more detailed analysis of the flow around the aircraft reveals the reasons
between both the subtle and significant differences revealed by these plots. The most noticible difference is the increase in nose down pitching moment seen in the OVERFLOW solution. The FUN3D predictions indicate the initiation of the same phenomena at 10°, but does not continue the same trend past this point until 18° is reached.
The plot of the horizontal tail lift coefficient in Figure 11 confirms that it is the differences in the horizontal tail lift predictions that are causing the increase in nose down pitching moment. This is not unexpected since it is the horizontal tail that contributes significantly to the control of the aircraft pitch. Just as in Figure 10 the FUN3D and the OVERFLOW predictions match through 10°. This includes a slight increase in the horizontal tail lift at 10°. After this angle the FUN3D results follow a more linear trend with angle of attack, whereas the OVERFLOW data continues to increase in a somewhat nonlinear fashion. This continues until the horizontal tail stalls.
0 10 20
Angle of Attack [deg]
Hor
izon
tal T
ail C
30
L
FUN3DOverflow
Figure 11. Comparison of horizontal tail lift.
This discussion brings up the question of what upstream flow phenomenon is causing this discrepency in the horizontal tail lift. Looking for correlations in the flow phenomena reveals that it is the forebody strake vortex interaction with the wing that is the primary factor. First, the more linear of the two solutions is analyzed. This is done in an effort to identify what physical phenomena contribute to the improved slope prediction
First, the streamlines that describe the path taken by the vortex shed by the forebody strake are plotted. Figure 12 shows the FUN3D predictions for an angle of attack sweep. At angles of attack less than 6°, the vortex from the strake passes below the wing; at 8° it begins to interact with the wing and by 10° the interaction is quite strong. The OVERFLOW solutions, shown in Figure 14 indicate a similar interaction with the wing; however, differences between the solvers emerge with the flow surrounding the horizontal tail. It is clear from Figure 12 that FUN3D predicts a strong influence of the wing wake with the horizontal tail around 10°. On the other hand, the OVERFLOW solutions suggest that the wake passes above the horizontal tail at this angle. At angles above

Figure 12. Streamlines from the forebody strake for
an angle of attack sweep using FUN3D.
Figure 13. FUN3D oil line plots.
4° 8°
10° 12°
14° 16°
18° 20°
Figure 14. Streamlines from the forebody strake for an angle of attack sweep using OVERFLOW.
Figure 15. OVERFLOW oil line plots.
4° 8° 4° 8°
10° 12° 12° 10°
14° 16° 14° 16°
18° 20° 18° 20°
10° the wake passes above the horizontal tail for both predictions though in FUN3D this seems to be at a reduced distance. In the OVERFLOW solution the reason that the flow is further from the tail is because of the larger region of separated flow predicted at the wing root. This region is illustrated by the jump in the streamlines near the trailing edge of the wing.
From these streamline plots alone it is not completely clear what may be causing the increase in the horizontal tail lift in the OVERFLOW solution. In general, this increase in lift would be caused by an increase in effective angle of attack seen by the horizontal tail between 10° and 18°. A region of separated flow upstream of the tail would contribute to this phenomenon by deflecting the flow away from the tail, creating a lower pressure region above the tail. This lower pressure region then causes the higher pressure flow from below the wing to turn upward because of the local pressure gradient. This then turns the flow at the horizontal tail, increasing the local angle of attack and thus increaing the lift. This train of cause and effect is better supported by plots of the separated flow regions explicitly using oil line plots which depict surface flow patterns.
Figure 15 plots the oil lines over the aircraft surface using the OVERFLOW solution for an angle of attack sweep. The separated region at the wing root begins at 10° just as it does in the FUN3D solution plotted in Figure 13. However, the size of this separated region progressively increases as the angle of attack is increased at a greater rate than the increase seen in the FUN3D solution. This is consistent with the previous argument that it is the flow separation at the wing root that is influencing the tail lift the most.
There is not only a difference in the pitching moment predictions plotted in Figure 10, there is also a difference in the lift and drag coefficients plotted in Figure 8 and Figure 9 in the mid angle of attack region. However, the differences in these predictions are reversed. The OVERFLOW solution is predicting lower lift than the FUN3D solution in this region, instead of higher lift as seen at the tail. Taking another look at the oil lines in Figure 13 and comparing these with similar oil line plots in Figure 15 reveals that it is the flow over the wing that causes this difference in lift. Again, this is not unexpected since the wing is the primary lifting surface of the aircraft when in airplane mode.
The similarities and differences in integrated lift between FUN3D and OVERFLOW can be explained by comparing the flow over the wings in Figure 13 and Figure 15. From low angle of attach to 10° the codes agree well. At 4° there is only a small separation region at the tip of the left wing. This is not sufficient to significanly impact the lift coefficient. At 8° this separated region grows, accounting for the slight decrease in lift coefficient. At 10° there is a small crossover point
in the lift coefficient. This takes into account the larger separation of the wing root flow in the OVERFLOW predictions balanced with the larger wing tip separation in the FUN3D prediction. Increasing to 12°, the OVERFLOW lift drops slightly to account for the larger wing root separation region that is not balanced by any significant growth in the FUN3D wing tip separation. This trend continues through 16° with the OVERFLOW root separation increasing, and the FUN3D wing tip separation increasing. Once the stall angle of attack region is reached, both codes have massive separation over the wings. Though this is delayed by 2° in the OVERFLOW solution.
The obvious asymmetry in the FUN3D solution has the greatest impact on the rolling moment of the aircraft. Figure 16 plots the rolling moment coefficient of the two CFD codes compared to wind tunnel data. There is a greater prediction of rolling moment in the FUN3D solution on the order of 1x10⁻³. While this is a small value, it is still larger than the OVERFLOW predictions which are closer to zero. The absolute magnitude of the wind tunnel data appears to lie somewhere in between these two predictions, but is closer to the OVERFLOW prediction.
0 10 20
Angle of Attack [deg]
CR
M
30
FUN3DOverflowWind Tunnel
Figure 16. Predicted rolling moment compared to
wind tunnel data.
The asymmetry in the FUN3D solution has little to do with the algorithms used in the CFD code, it is the grid that causes this asymmetry. The underlying surfaces used to generate this grid are the same PLOT3D surfaces used to generate the OVERFLOW grid. These surfaces are exactly symmetric about the baseline of the grid for all components that exist on both the LHS and the RHS. Since the aircraft is inherently asymmetric because of the ARRP and the SATCOM an exact mirror of a semi-span grid could not be generated. Therefore, the asymmetry must exist in either the unstructured surface mesh or in the volume mesh. A direct comparison of the unstructured surface mesh was undertaken by taking the mirror of the grid about the baseline axis. The two meshes were overlayed and compared to look for any significant differences around the tip of the wing and the nacelles. The only differences seen were in the exact locations of the nodes and element used to describe the surfaces. The surfaces themselves were exactly symmetric.

The only other possibility is that the volume mesh is the reason for the asymmetry. Slices through the volume did not reveal any notable differences. However, there may still be some key difference that is triggering early separation on the LHS of the grid. In an initial test of the grid the conversion fairings were removed. Since these complex components were difficult to divide into patches there may have been some underlying differences that transferred to the volume mesh. Figure 17 compares the FUN3D solution with and without the conversion fairings. The solution on the modified grid is now symmetric over the wings at 4°. Since the PLOT3D surfaces were symmetric to begin with, this result supports that there was some asymmetry introduced into the surrounding volume grid by these components.
Figure 17. FUN3D oil lines comparing original and
modified grids at 4°.
In an effort to reduce the asymmetric differences in the volume grid cells, a new grid has been generated by slicing the underlying VGRID restart file in half and generating a semi-span model of the RHS. This new restart file was copied and mirrored about the mid-plane. The two halves of the aircraft were stiched together so that every curve, every patch, and every source used to generate the grid is exactly symmetric. The two asymmetric surface components were reintroduced into the grid independently. However, the background sources used to cluster the points on the ARRP and the SATCOM were copied over the symmetry plane. All the background sources in the grid have a field effect everywhere in the grid domain. Thus creating symmetric sources even if they are not necessary should in theory enhance the symmetry of the volume mesh. However, this procedure had little impact on the results. The symmetry was moderately altered, but the overall lift, drag, and pitching moment did not show any appreciable change. This result is positive when considering the lack of grid sensitivity for a given grid resolution on the solutions obtained, but is negative in the sense that it proves that at this grid resolution an approximatly symmetric result cannot be obtained on an asymmetric configuration.
While gridding more complex surfaces can present difficulties for both structured and unstructured methodologies, in regions where the surfaces are easier to model the results obtained by FUN3D and OVERFLOW are nearly identical. Figure 18 compares the pressure coefficient plots for an angle of attack sweep at Y=160in,
which is close to the mid-span of the wing. As the angle of attack increases the pressure distributions match closely between the two codes until the separated flow, predicted differently by each code, at the root and the tip of the wing begins to influence the wing mid-span. Over the right wing this divergence occurs at 18°.
Original Modified
Figure 18. Comparison of pressure coefficient over the right wing at Y=160in.
Differences between the pressure distributions occur at a lower angle of attack closer to the ends of the wing. Figure 19 plots the pressure coefficient at Y=100in, near the wing root. The predictions of both FUN3D and OVERFLOW begin to diverge around 10° at this location.
Figure 19. Comparison of pressure coefficient over the
right wing at Y=100in.

COMPUTATIONAL METRICS
Relevant computational metrics are provided in Table 4. These metrics take into account various factors including grid size, number of iterations, machine type, and number of processors used. The criteria used to define a converged solution isn’t precise. The FUN3D solution was actually run to 6000 iterations, but 2000 was chosen as the point where the lift, drag, and pitching moment coefficients appeared to stop changing when plotted against a reasonable scale. The last entry in the table aims to eliminate this subjective factor from the comparison by identifying the time per iteration. This entry also factors in the number of grid nodes and the number of processors used. The machine used to compute the FUN3D results is a Dell PowerEdge M610 system with two quad-core Intel Nehalem processors per node and 24 Gb RAM per node. The OVERFLOW results were computed on a HP BL460 G1 system with two Intel Xeon 5160 dual-core processors per node and 12 Gb of RAM per node. Both systems used 64-bit processing.
Table 4. Computational metrics.
Code FUN3D OVERFLOW Processor speed 2.8 GHz 3.0 GHz Number of processes 128 40 Grid size [nodes] 15.1M 44.4M Number of iterations to converge 0° case 2000 8000
Total wall time [hrs] 2.7 29.2 Time to solution/node [sec/node] 0.082 0.095
Time/iteration/node [sec/iter/node] 4.08x10⁻⁵ 1.18x10⁻⁵
CONCLUSIONS
For complex aircraft care must be taken when modeling the flow. The MV-22 falls into this category, presenting challenges for RANS-based analysis. This paper presented independent solutions from FUN3D, an unstructured flow solver, and OVERFLOW, an overset structured flow solver. Care was taken to maintain equality between the geometry used in both grids. The MV-22 airframe was analyzed at model- and full-scale in airplane mode. Despite the lack of rotors, the aerodynamics of the problem is characterized by strong vortex interactions. The 23% thick wing provides additional challenges as separation occurs gently and relatively early as angle of attack is increased unless VGs are utilized.
Generally, reasonable agrement between FUN3D and OVERFLOW was achieved for flows which were attached and vortex interactions which were minimal. Under these conditions CFD results also agreed well with experimental data recorded for the same configuration
and flow conditions. OVERFLOW, FUN3D and experimental data departed under conditions featuring strong vortex interactions and large separated flow regions. At mid to high angles of attack the experimental data suggests that attached flow is aided by main wing VGs. Both OVERFLOW and FUN3D separated over the main wing with OVERFLOW showing a stronger propencity to separate.
Separation over the wing initiates from the inboard section. This is also the region where the vortex from the forebody strake interacts strongly. The vortex is captured differently between the two codes resulting ultimately in different integrated forces and moments. OVERFLOW faces the challenge of maintaining accuracy as the vortex passes among block boundaries where dissipation tends to be the largest. The effects of the vortex interaction with the wing are felt as far back as the horizontal tail in the FUN3D solution. The OVERFLOW solution shows a smaller interaction with the horizontal tail. The solution symmetry was better maintained with OVERFLOW than with FUN3D for reasons not fully understood, but currently under investigation. FUN3D asymmetry resulted in mixed separation regions at the wing tips which increased the predicted rolling moment.
For many V-22 applications, RANS methods appear to be well suited to address difficult aerodynamic concerns. Ultimately however, careful evaluation of every solution is needed particularly for complex interactions and separated flows.
Future work on this project will attempt to identify the number of cells needed to approach grid independence as well as looking at the impact of modeling the wing and mid-wing VGs on wing separation, as well as studying unsteady effects at high angles of attack and the effect of turbulence models on these unsteady effects. The culmination of this work will be the analysis of the impact of the various aerodynamic components on the stability and control of the aircraft.
ACKNOWLEDGMENTS
The authors would like to acknowledge the resources provided by the HPC program, in particular the MHPCC, as well as the advice of the FUN3D development team, in particular Elizabeth Lee-Rausch and Eric Nielsen. Wind tunnel data was provided by the Boeing Company and was based on work performed under Boeing Independent Research and Development The authors would also like to acknowledge Jonathan Chiew and Joseph Gillman for their contributions to the OVERFLOW solutions. This work was funded in part by the V-22 Flight Dynamics Engineering lead Sean Roark. The authors would also like to thank Steven Woods of NAVAIR Flight Vehicle Performance for reviewing this paper.
REFERENCES
1.McVeigh, M.A., Liu, J., O'Toole, S.J., and Woods,
S.A., "V-22 Osprey Aerodynamic Development – A Progress Review," 22nd European Rotorcraft Forum, Paper 2225, September 1996.
2.Rosenstein, H., and Clark R., "Aerodynamic Development of the V-22 Tiltrotor," AIAA-1986-2678, AIAA/AHS/ASEE, Aircraft Systems, Design and Technology Meeting, Dayton, OH, October 20-22, 1986.
3.Boeing Image Gallery, “http://www.boeing.com/rotorc-raft /military/v22/v22photos.html,” Last Accessed March 31, 2010.
4.Duffy, M., “BVWT 0467 - Wind Tunnel Test - V-22
Drag Reduction with Nacelle Sails, Optimum Flaps, and Vortex Control Device,” Boeing Document Number 901-909-664, November 2009.
5.Fox, E., “BVWT 0468 - 0.15 Scale V-22 High Angle of
Attack Wind Tunnel Test Report,” Boeing Document Number 901-909-665, February 2010.
6.Tai, T.C., "Effect of External Components on V-22
Aircraft Forward-Flight Aerodynamics," Journal of Aircraft, vol. 37 no. 2, 2000, pp. 201-206.
7.Potsdam, M.A., and Strawn, R.C., “CFD Simulations of Tiltrotor Configurations in Hover,” American Helicopter Society 58th Annual Forum, Montreal Canada, June 11-13, 2002.
8.Narducci, R.P., Jiang, F., Liu, J., and Clark, R.W., "CFD Modeling of Tiltrotor Shipboard Aerodynamics With Rotor Wake Interactions," AIAA-2009-3857, 27th AIAA Applied Aerodynamics Conference, San Antonio, Texas, June 22-25, 2009.
9.Anderson, W. K., and Bonhaus, D. L., “An Implicit Upwind Algorithm for Computing Turbulent Flows on Unstructured Grids,” Computers and Fluids, vol. 23 no. 1, 1994, pp. 1-21.
10.FUN3D On-line Manual, “http://fun3d.larc.nasa.gov,” Last Accessed January 15, 2010.
11.Diskin, B., Thomas, J., Nielsen, E.J., Nishikawa, H., and White, J.A., “.Comparison of Node-Centered and Cell-Centered Unstructured Finite-Volume Discretizations. Part I: Viscous Fluxes," AIAA Paper 2009-0597.
12.Buning, P. G., Chan, W. M., Renze, K. J., Sondak, D. L., Chiu, I. T., and Slotnick, J. P., “OVERFLOW User’s Manual, Version 1.6ab,” NASA Ames Research Center, Moffett Field, CA, January 26, 1993.
13.Meakin, R., “Object X-Rays for Cutting Holes in Composite Overset Structured Grids,” AIAA AIAA-
2001-2537, AIAA 15th Computational Fluid Dynamics Conference, Anaheim, CA, June 2001.
14.Biedron, R., Vasta, V., and Atkins, H., “Simulation of Unsteady Flows Using an Unstructured Navier-Stokes Solver on Moving and Stationary Grids,” 23rd AIAA Applied Aerodynamics Conference, Ontario, Canada, June 6-9, 2005.
15.Green. B., “Internal NAVAIR Communication.” E-mail interview, March 8, 2010.