analysis of asymmetric interactions between nonnative
TRANSCRIPT

Analysis of Asymmetric Interactions between Nonnative Brown Trout, Salmo trutta, and Native Brook Char, Salvelinus fontinalis, as a Mechanism of Habitat Fragmentation in the Gunpowder River Watershed of Central
Maryland
By
Nicholas Jewett
A Capstone submitted to Johns Hopkins University
in conformity with the requirements for the degree of
Master of Science in Environmental Science and Policy.
Baltimore, Maryland
December, 2018
© 2018 Nicholas Jewett
All Rights Reserved

Table of Contents
List of Figures …...……………………………………………………………………………… iii
Abstract ………………………………………………….…………………………….………… v
Executive Summary …………………………………………………………...…...…………… vi
1. Introduction ………………………………………………………………………………..….. 1
2. Methods ……………………………………………………………………………….……..... 3
2.1 Fish Assemblage Data Collection …………………………………………................ 3
2.2 Physical and Biological Habitat Data Collection …………………………….……… 3
2.3 Data Analysis ………………………………….…………………………………….. 4
3. Results ……………………………………………………….………………………………... 5
4. Discussion …………………………………………………….……………………………... 12
5. Conclusions …………………………………………………..……………………………… 16
6. Acknowledgement …………………………………………..………………………………. 17
Works Cited ……………………………………………….………….………………………... 18
Appendices ……………………………………………………………………….…..………… 20
ii

List of Figures
Table 1. Summary of Results ………………………………………………………...………..… 6
Figure 1. Linear regression of MBSS calculated FIBI and BIBI scores for Gunpowder watershed streams containing brook char or brown trout from 1996 to 2017………..... 7
Figure 2. Plot of MBSS collected brook char densities (fish/m2) for the Gunpowder watershed from 1996 to 2017………………..………………………..……..………… 8 Figure 3. Plot of MBSS collected brown trout densities (fish/m2) for the Gunpowder watershed from 1996 to 2017………………..………..……………………..………… 8 Figure 4. Plot of MD Freshwater Fisheries collected brown trout densities (fish/m2) for the Panther Branch from 1994 to 2014 …………................………………………..…..…. 9 Figure 5. Plot of MD Freshwater Fisheries collected brook char densities (fish/m2) for the Panther Branch from 1994 to 2014 …………................………..………………..……. 9 Figure 6. Plot of MD Freshwater Fisheries collected brown trout densities (fish/m2) for Piney Creek at Piney Hill Road from 1983 to 1998 …………………………….....… 10 Figure 7. Plot of MD Freshwater Fisheries collected brook char densities (fish/m2) for Piney Creek at Piney Hill Road from 1983 to 1998 ………………………...….……. 10 Figure 8. Plot of MD Freshwater Fisheries collected brown trout densities (fish/m2) for Piney Creek upstream of Interstate 83 from 1990 to 2016 …………...……………… 11 Figure 9. Plot of MD Freshwater Fisheries collected brook char densities (fish/m2) for Piney Creek upstream of Interstate 83 from 1990 to 2016 ………………...………… 11 Figure 10. Exponential regression of brown trout drainage area within the Gunpowder watershed, from 1996 to 2017 ……………………..……………….….. 12 Map 1. MBSS sampling sites from 1996-2000 ……………………………….……………..…. 20
Map 2. MBSS sampling sites from 2001-2010 ………………………….……….…………….. 20
Map 3. MBSS sampling sites from 2011-2018 …………………….…..………………………. 21
Map 4. MD Freshwater Fisheries sample sites ………………………………………………… 21
Table 2. Summary of MBSS data for the brook char only group ...……………………………. 22
Table 3. Summary of MBSS data for brook char in the presence of brown trout …………..…. 22
iii

Table 4. Summary of MBSS data for the brown trout only group …………………………….. 22
Table 5. Summary of MBSS data for brown trout in the presence of brook char ……...……… 23
Table 6. Summary of regression analysis results ………………………….…………………… 23
iv

Abstract
Brook char, Salvelinus fontinalis, is the only salmonid that is native to the Mid-Atlantic
and South Eastern United States. Within the state of Maryland, it is estimated that brook char
have been expatriated from over 60% of the species historic range (Heft et al. 2006). Similar
population declines have been observed throughout the Central and Southern Appalachian
regions (Argent et al. 2018; Kanno et al. 2016). Brook char require cold water temperatures and
near pristine water conditions for wild populations to persist. Recent studies have shown that
brook char populations are negatively affected by the presence of the non-native salmonids
brown trout, Salmo trutta, and rainbow trout, Oncorhynchus mykiss (Hitt et al. 2016; Ohlund et
al. 2008; Malmros 2006). Within the Gunpowder the watershed of Central Maryland, wild
populations of brook char and brown trout exist together in the same sections of habitat. The
objective of this study was to determine if interference competition from non-native brown trout
is having a significant negative impact on brook char populations within the Gunpowder River
watershed.
Fish assemblage data were collected by the Maryland Biological Stream Survey (MBSS)
and the Maryland Department of Natural Resources Freshwater Fisheries by backpack
electrofishing between the years of 1983 and 2017. These data were used to calculate population
densities for brook char and brown trout. Fish population densities were compared to the
archived MBSS physical and biological habitat data using the unpaired t-test to analyze variance
between fish densities and physical habitat variables. Regression analysis was used to determine
if significant trends in population densities and distribution had occurred over time. It was found
the brown trout are moving progressively upstream into brook char habitat and are contributing
to reduced brook char densities and increased population fragmentation and isolation.
v

Executive Summary
This capstone project marks the completion of my work at Johns Hopkins University and
is requisite to the completion of a Master of Science in Environmental Science and Policy with a
concentration in Ecological Management. This topic was chosen because of my interest in
freshwater ecology and the preservation and restoration of freshwater habitats. As a student at
Johns Hopkins, I have focused my coursework on aquatic ecology, and this project serves as the
culmination of my educational journey so far.
As a species that is highly sensitive to habitat disturbance, and the only salmonid that is
native to the Mid-Atlantic and South Eastern United States, brook char, Salvelinus fontinalis, are
worthy of study and protection. In 2006, it was estimated that brook char had been expatriated
from 62% of the species historic range within the state of Maryland as a result of anthropogenic
habitat disturbance and competition from other introduced salmonid species (Heft et al. 2006).
This problem is not unique to Maryland. Other recent studies have documented similar
population declines throughout the species native range (Kanno et al. 2016; Argent et al. 2018).
Within the state of Maryland, the Gunpowder watershed represents the Eastern border of
the natural habitat range of brook char and about one quarter of the state’s total brook char
population (Heft et al. 2006). Most of the Gunpowder watershed lies within Baltimore County,
Maryland, but small portions also extend into Carrol and Harford Counties in Maryland and
York County in Pennsylvania. The watershed is within the piedmont region of Maryland and has
a mixture of forested, agricultural, urban, and suburban landscapes. This setting is somewhat
unusual for brook char, as they are typically associated with heavily forested mountain
landscapes (Heft et al. 2006).
Brook char is not the only salmonid with established resident populations in the
Gunpowder watershed. Brown trout were introduced into the watershed by the Maryland
vi

Department of Natural Resources to support recreational fishing, but have not been stocked since
into the Gunpowder since 1993. As a species that is sensitive to changes in temperature and
water quality, brook char is an ideal indicator species for spotting early trends of habitat
disturbance. Due to its geographic, topographic, and land use characteristics, it is likely that the
brook char communities of the Gunpowder River watershed will show signs of stress related to
climate change and anthropogenic disturbance before other ecoregions within Maryland. The
objective of this study was to determine if interference competition from non-native brown trout
is having a significant negative impact on brook char populations within Gunpowder River
watershed. Fish assemblage data collected between 1983 and 2017 by the Maryland Biological
Stream Survey (MBSS) and the Maryland Department of Natural Resources (DNR) Freshwater
Fisheries were used to calculate population densities for brook char and brown trout. The data
were collected using backpack electrofishing and were compared to archived MBSS physical and
biological habitat data. Regression analysis was used to determine the significance of population
density and distribution trends over time. The unpaired t-test was used to analyze variance
between fish densities and physical habitat variables.
The findings of this study revealed that brown trout are moving progressively upstream
into brook char habitat. This upstream movement may be in response to increasing stream
temperatures and increasing resident populations of brown trout, but more research is needed to
confirm these assumptions. It was also found that brook char populations had significantly
reduced densities in stream sections where brown trout were present. However, the presence of
brook char did not have a significant impact on brown trout densities. This result suggested that
brown trout have an asymmetrically negative impact on the sustainment of brook char
populations. It is likely that the movement of brown trout into brook char habitat is contributing
to a reduction in brook char densities and an increase in brook char population fragmentation.
vii

1. Introduction
Brook char are native to Eastern North America and have a habitat range spanning from
the Eastern Canadian Shield to the mountains of the Southern Appalachian region (Hitt et al.
2017, 406). Brook char are the only salmonid that is native to the central and southern portions
of the Eastern United States. Visually, brook char can be distinguished from the Gunpowder’s
three human-introduced salmonids, brown trout, Salmo trutta, rainbow trout, Oncorhynchus
mykiss, and golden trout Oncorhynchus mykiss aguabonita, by its light body spots on a dark
background and light colored vermiculations on its dorsal surface. Native brook char habitat
range is largely defined by the species narrow range of temperature tolerance. As a stenothermal
fish, brook char require maximum summer water temperatures of less than 20° C, and have an
optimal temperature range of between 14° C and 18° C (Stitt et al. 2014, 15). In addition to cold
temperatures, brook char require near pristine water conditions for the sustainment of wild
populations (Heft et al. 2006).
Over the last century, brook char populations have steadily declined throughout their
native range. In 2016, it was estimated that brook char had been expatriated from 75% of the
historic range in Great Smoky Mountain National Park (Kanno et al. 2016). In the same year,
brook char populations were estimated to occupy only 60% of the historic range in the state of
Pennsylvania (Argent et al. 2018). Similarly, in 2006 brook char were estimated to have been
expatriated from 62% of the species historic range in the state of Maryland (Heft et al. 2006).
The Gunpowder river basin accounts for 25.2% of Maryland’s total brook char
population (Heft et al. 2006). One factor that may be contributing to the decline of Gunpowder
brook char is habitat fragmentation resulting from interspecific competition with non-native
brown trout (Heft et al. 2006). The Maryland Department of Natural Resources (DNR) used to
stock the Gunpowder River with non-native brown trout to support recreational fishing.
1
However, the last adult brown trout were stocked into the watershed in 1990, and the brown trout
stocking program ceased operation in 1993. Since that time, resident brown trout populations
have persisted in the Gunpowder watershed.
The interspecies interactions between S. fontinalis and S. trutta have been examined in
several studies in recent decades. The competitive advantage of brown trout over brook char has
been documented in small, man-made experimental setups as well as in landscape-scale
observational studies (Hitt et al. 2016; Ohlund et al. 2008; Malmros 2006). Hitt et al. (2016),
used an artificial indoor stream to study condition influenced interspecific competition between
S. fontinalis and S. trutta. Their experimental setup incorporated habitat patchiness in the form
of thermal refugia and foraging areas. The authors concluded that brown trout presence has a
more significant impact on brook char habitat use than temperature, and that the habitat use of
brown trout does not change significantly in the presence or absence of brook char (Hitt et al.
2016). Andreas Malmros (2006) used young of year (YOY) S. fontinalis and S. trutta to
examine the interspecific and intraspecific interactions between the two species. After
measuring fish growth rates for a period of six weeks, Malmros concluded that brook char are
negatively affected by the presence of brown trout, and that brown trout are not significantly
affected by the presence of brook char (Malmros 2006).
Due to the sensitivity of brook char to other forms of habitat disturbance, it is difficult to
determine the extent of interspecific competition that occurs between the two species in natural
systems. In 2013, Wagner et al. found that a combination of anthropogenic habitat disturbances
and interspecific competition with brown trout may work synergistically to reduce the
probability of brook char occurrence in Pennsylvania streams (Wagner et al. 2013). Due to the
similarities between Pennsylvanian and Maryland streams, it was likely that similar interactions
were affecting Gunpowder brook char populations. The goal of this study was to determine if
2

brown trout related interference competition was having a significant negative impact on brook
char populations within Gunpowder River watershed.
2. Methods
2.1 Fish Assemblage Data Collection
The data in this study were provided by the Maryland Biological Stream Survey (MBSS)
and the Maryland Department of Natural Resources Freshwater Fisheries. Fish assemblage data
were collected following the Zippin Multiple Pass Fixed Station Electrofishing protocol between
the years of 1994 and 2017. Earlier electrofishing protocols were not specified in the data
archives, but it can be assumed that each sample was representative of the complete fish
population within the sampling area at the time of sampling. Sample site locations for each
collection were recorded using GPS location. Along with the sample location and fish
assemblage data, MD Freshwater Fisheries measured the length and mean width of each sample
site in meters, and the MBSS provided sample site areas in square meters.
To continuously assess the health of Maryland’s waterways, every year the MBSS
randomly selects locations throughout the state for sampling. Sample sites from the MBSS
archives were included in this analysis if brook char or brown trout were recorded as a part of
any sample between the years of 1983 to 2017 within the Gunpowder watershed. For the
Freshwater Fisheries data, fish densities were calculated by dividing the number of fish collected
in each sample by the sample site area. Sample site areas were calculated by multiplying the
mean site width by the length of the sample site in meters. Fish densities for both data sets were
calculated in fish per square meter.
2.2 Physical and Biological Habitat Data Collection
Benthic Indices of Biological Integrity and Fish Indices of Biological Integrity (BIBI and
FIBI respectively) were calculated by the MBSS for each sample location following the MBSS
3
adaptation of the Environmental Protection Agency (EPA) National Rivers and Streams
Assessment Protocols for wadeable and non-wadeable streams. Scores were calculated using
the Maryland Eastern piedmont region FIBI scoring matrix for fish and the Maryland piedmont
region BIBI scoring matrix for benthic macroinvertebrates. The variables of temperature, mean
pool depth, mean percent embeddedness, percent shading, number of woody debris, drainage
area, and overall habitat score were calculated by the MBSS following the standardized MBSS
stream assessment protocols developed for the piedmont region of Maryland.
2.3 Data Analysis
Fish assemblage data were arranged into four groups: brook char only, brook char in the
presence of brown trout, brown trout only, and brown trout in the presence of brook char. The
brook char only group was comprised of all measurements taken where only brook char were
found. Likewise, the brown trout only group included all measurements taken where only brown
trout were found. The other two groups, brook char in the presence of brown trout and brown
trout in the presence of brook char, included all measurements taken where both species were
found together. The unpaired t-test (𝑡 =�̅�−𝜇
√𝑆2−𝑛 ) was used to analyze the variance between the
single species groups and the mixed species groups for each of the nine variables. For example,
the mean drainage area for brown trout in the presence of brook trout, 689.61 hectares, was
compared to the mean drainage area for brown trout only, 5902.58 hectares. Results were
considered significant for calculated p values of less than 0.05. Similarly, fish densities were
analyzed using the unpaired t-test to determine if there were significant (p < 0.05) differences
between the single species and mixed species groups.
Linear regression analysis was used to determine if the habitat quality had changed
significantly during the MBSS sampling period (1996-2017) for FIBI and BIBI scores. Drainage
4

area was defined as the number of hectares of land upstream of the sample area where surface
water runs toward the sample site. Exponential regression was used to determine if statistically
significant changes in mean drainage area had occurred during the sampling period for either
species. Any significant changes in the mean drainage area were considered to be indicative of
changes in the spatial distribution of the species.
Habitat data was not provided for the MD DNR Freshwater Fisheries data. To assess the
site-specific population trends of the two tributaries, fish densities for each species were plotted
in fish per square meter against time for each of the three sample sites (Panther Branch, Piney
Creek at Piney Hill Road, and Piney Creek upstream of Interstate 83).
3. Results
Statistical analysis did not show significant differences (p < 0.05) between the single
species and mixed species groups for habitat score, percent embeddedness, number of woody
debris, pool depth, BIBI score or FIBI score. However, brown trout in the presence of brook
char had a significantly lower mean water temperature of 17.67°C than brown trout only with a
mean temperature of 18.16°C (Table 1). The mean percent of canopy shading for brown trout in
the presence of brook trout was also significantly greater (80.45%) than brown trout alone
(64.07%) (Table 1). The mean drainage area of brown trout in the presence of brook trout was
significantly smaller (689.61 hectares vs 5902.98 hectares) than brown trout only (Table 1).
Brook char did not show any significant variations between the single and mixed species
groups in any category other than fish density. Brook char in the presence of brown trout had a
significantly lower mean density of 0.06 fish/m2 than brook char only at 0.14 fish/m2 (Table 1).
However, brown trout did not show any statistically significant differences in fish density
between brown trout only (0.094 fish/m2) and brown trout in co-occurrence with brook char
(0.098 fish/m2) (Table 1).
5

6

Linear regression analysis of FIBI and BIBI scores showed that the habitat conditions
remained relatively stable over the two-decade MBSS sampling period (Figure 1). Furthermore,
there were no statistically significant differences in FIBI or BIBI scores between brook char and
brown trout (Table 1).
Fig. 1. Linear regression of MBSS calculated FIBI and BIBI scores for Gunpowder watershed streams containing brook char or brown trout from 1996 to 2017.
Brook char showed an apparent, although non-significant, decreasing trend in fish density
over the MBSS sampling period of 1996 to 2017 (Figure 2). Conversely, brown trout showed an
apparent, and significant, increasing trend in fish density over the same sampling time frame
(Figure 3).
7
00.5
11.5
22.5
33.5
44.5
5
1996 2001 2006 2011 2016
Scor
e
Year
Gunpowder Watershed FIBI and BIBI Scores (1996-2017)
FIBI BIBI Linear (FIBI) Linear (BIBI)

Fig. 2. Plot of MBSS collected brook char densities (fish/m2) for the Gunpowder watershed from 1996 to 2017. Each point represents a sampling occasion where at least one brook char was counted.
Fig. 3. Plot of MBSS collected brown trout densities (fish/m2) for the Gunpowder watershed from 1996 to 2017. Each point represents a sampling occasion where at least one brown trout was counted.
Similar observations were made for brook char and brown trout at each of the three
Inland Fisheries sample locations (Figures 4-9). Brown trout fish densities increased
significantly from 1994 to 2014 (Figure 4). Brook char were only sampled on three occasions
during the same time frame with no fish counted after 2002.
8
0
0.2
0.4
0.6
0.8
1
1.2
1996 2001 2006 2011 2016
Den
sity
(fis
h / m
2 )
Year
Total Brook Char Density (1996-2017)
0
0.2
0.4
0.6
0.8
1
1.2
1996 2001 2006 2011 2016
Den
sity
(fis
h / m
2 )
Year
Total Brown Trout Density (1996-2017)

Fig. 4. Plot of MD Freshwater Fisheries collected brown trout densities (fish/m2) for the Panther Branch from 1994 to 2014. Each point represents a sampling occasion where at least one brown trout was counted.
Fig. 5. Plot of MD Freshwater Fisheries collected brook char densities (fish/m2) for the Panther Branch from 1994 to 2014. Each point represents a sampling occasion where at least one brook char was counted.
Brown trout sampled from Piney Creek at the Piney Hill Road location showed a slight
increase in fish density between the years of 1983 and 1998 (Figure 6). Brook char showed
significant reductions in fish density at the same sample location during the same time frame
(Figure 7).
9
0
0.05
0.1
0.15
0.2
0.25
0.3
0.35
1994 1996 1998 2000 2002 2004 2006 2008 2010 2012 2014
Den
sity
(fis
h / m
2 )
Year
Panther Branch Brown Trout Density (1994-2014)
00.050.1
0.150.2
0.250.3
0.35
1994 1996 1998 2000 2002 2004 2006 2008 2010 2012 2014
Den
sity
(fis
h / m
2 )
Year
Panther Branch Brook Char Density (1994-2014)

Fig. 6. Plot of MD Freshwater Fisheries collected brown trout densities (fish/m2) for Piney Creek at Piney Hill Road from 1983 to 1998. Each point represents a sampling occasion where at least one brown trout was counted.
Fig. 7. Plot of MD Freshwater Fisheries collected brook char densities (fish/m2) for Piney Creek at Piney Hill Road from 1983 to 1998. Each point represents a sampling occasion where at least one brook char was counted.
10
0
0.2
0.4
0.6
0.8
1
1.2
1983 1985 1987 1989 1991 1993 1995 1997
Den
sity
(fis
h / m
2 )
Year
Piney Creek at Piney Hill Road Brown Trout Density (1983-1998)
0
0.2
0.4
0.6
0.8
1
1.2
1983 1985 1987 1989 1991 1993 1995 1997
Den
sity
(fish
/ m
2 )
Year
Piney Creek at Piney Hill Road Brook Char Density (1983-1998)

Brown trout densities at Piney Creek upstream of the Interstate 83 bridge increased
significantly from 1990 to 2016 (Figure 8). During the same time frame, brook char showed an
apparent, yet non-significant reduction in fish density at the same sample location (Figure 9).
Fig. 8. Plot of MD Freshwater Fisheries collected brown trout densities (fish/m2) for Piney Creek upstream of Interstate 83 from 1990 to 2016. Each point represents a sampling occasion where at least one brown trout was counted.
Fig. 9. Plot of MD Freshwater Fisheries collected brook chart densities (fish/m2) for Piney Creek upstream of Interstate 83 from 1990 to 2016. Each point represents a sampling occasion where at least one brook char was counted.
11
00.10.20.30.40.50.60.7
1990 1995 2000 2005 2010 2015
Den
sity
(fis
h / m
2 )
Year
Piney Creek Upstream of I-83 Brown Trout Density from (1990-2016)
0
0.1
0.2
0.3
0.4
0.5
0.6
0.7
1990 1995 2000 2005 2010 2015
Den
sity
(fis
h / m
2 )
Year
Piney Creek Upstrem of I-83 Brook Char Density (1990-2016)

Regression analysis of average brown trout drainage area within the Gunpowder
watershed showed a statistically significant decreasing trend during the MBSS sampling period
of 1996 through 2017 (Figure 10). Unlike brown trout, brook char did not show a significant
reduction in drainage area during the same sampling period (Table 6). The difference in mean
drainage area between brook char only and brook char with brown trout was 143.03 hectares.
The mean drainage size of the brook char only group was 541.58 hectares (Table 1).
Fig. 10. Exponential regression of brown trout drainage area within the Gunpowder watershed, from 1996 to 2017. Each point represents the drainage area, in hectares, of a sample site that included at least one brown trout. 4. Discussion
The results of this study supported the findings of Hitt et al. (2016) and Malmros (2006).
Brook char and brown trout densities were compared in groups with one species present (brook
char or brown trout) against groups with both species present (brook char and brown trout), for
nine independent variables and for fish densities. In addition, regression analysis was used to
examine changes in drainage area, FIBI score, BIBI score, and population density over time for
each species.
12
0
2000
4000
6000
8000
10000
12000
14000
1996 2001 2006 2011 2016
Dra
inag
e A
rea
(Hec
tare
s)
Year
Brown Trout Drainage Area (1996-2017)

No significant differences in habitat quality were found to occur during the sampling period
(Figure1). Most notably, over the two decades of habitat data that were examined in this study,
no significant changes occurred in the Fish Indices of Biological Integrity or in Benthic Indices
of Biological Integrity. This suggests that the biological communities of fish and benthic
macroinvertebrates had remained stable. If major changes in habitat quality were to have
occurred, it would be expected that the FIBI and BIBI scores would have changed accordingly.
Likewise, mean embeddedness, mean percent of overhead shading, mean number of woody
debris, and mean habitat scores remained relatively stable throughout the sampling period. This
suggest that the observed changes in fish densities were most likely not attributed to changes that
occurred in habitat quality.
Unlike the other habitat characteristics that were analyzed, temperature did show an
increasing trend. This trend was apparent at each of the individual sampling locations, as well as
for the Gunpowder River watershed as a whole. However, temperature data was only available
for the eleven-year period between 1996 and 2007 (Table 6). To determine if a long-term trend
of warming stream temperatures had been occurring, a longer sampling history was needed.
Despite this, it is important to note that the brown trout only group had a mean water temperature
of 18.16 °C (Table 1). Like brook char, brown trout are stenothermal and require cool water
conditions for survival and reproduction. The water temperature of 18.16 °C is above the ideal
condition for naturally occurring brown trout, and just below the thermal maxima of 18.2-19.5°C
for brown trout relying on benthic invertebrates as a primary food source (Elliot and Elliot,
2010). If the temperatures of the primary brown trout holding areas in the Gunpowder River are
increasing, it is likely that portions of these populations are seeking thermal refuge by migrating
into the cooler conditions found in smaller tributaries.
From 1996 to 2017, there was a significant trend of progressively decreasing drainage
13

areas for Gunpowder brown trout (figure 10). In addition, the percentage of canopy cover for
brown trout in the presence of brook trout was significantly higher than for brown trout alone
(Table 1). These trends add further evidence that brown trout may be seeking the thermal refuge
of the cooler and more shaded tributaries. While the factors that influence stream water
temperatures are complex and are influenced by both groundwater inputs and temperature
exchange across the air-water interface, it is expected that stream temperatures will rise over the
next century in response to climate change (Snyder et al. 2015).
Brook char also showed some evidence of upstream migration during the sampling
period, but the trend was weak and not statistically significant (Table 6). The difference in mean
drainage area between brook char only and brook char in sympatry with brown trout was 143.03
hectares, while the mean drainage size of the brook char only group was only 541.58 hectares
(Table 1). This suggests that most of the brook char populations within the Gunpowder
watershed occured in the upper reaches of the tributaries. Due to the small size of streams in
their upper reaches, it is likely that many brook char populations would not be able to move
further upstream in response to increasing water temperatures or the increasing presence of
brown trout.
Brook char in the presence of brown trout had a significantly lower mean population
density of 0.06 fish/m2 than the mean density of 0.14 fish/m2 of the brook char only group (Table
1). This supports the findings of Malmros (2006) and of Hitt et al. (2016) that the presence of
brown trout has a significant negative correlation with brook char survival and reproduction.
Conversely, it was observed that the presence of brook char did not have a significant correlation
with any changes in brown trout density. Brown trout in the presence of brook char had a mean
density of 0.098 fish/m2 and brown trout only had a mean density of 0.094 fish/m2 (Table 1).
Brown trout showed statistically significant increases in population density at the two
14

sampling locations on Piney Creek as well as the sampling location on the Panther Branch
(Figures 4, 6, and 8). In contrast, brook char showed a significant decrease in population
density at the Piney Creek at Piney Hill Road sample location (Figure 7) and an apparent,
although non-significant, decrease in population density at the Piney Creek upstream of the
Interstate 83 bridge sample location (Figure 9). At the Panther Branch sample site, no brook
char were found after 2002 (Figure 5). However brown trout were counted at the same site in
2007, 2012, 2013, and 2014 (Figures 4). These trends were echoed when the trout populations
were examined as a whole. Brown trout showed statistically significant increases in population
density (Figure 3), while brook char showed an apparent, yet non-significant reduction in density
over time (Figure 2).
The observed trends in this study could be bolstered by more in depth spatial studies of
brook char and brown trout population densities and movement patterns. In addition, more
research needs to be conducted to determine the extent of influence that climate change is having
on the stream temperatures of the Gunpowder Watershed. If brown trout are indeed moving
progressively further into brook char habitat areas, it is likely that they will outcompete and
greatly reduce, or completely expatriate the brook char populations of the Gunpowder watershed.
Studies have shown a strong positive relationship between genetic variation in
fragmented brook char populations with patch size (Whiteley et al. 2013). Even for populations
fragmented within the last 50 years, small habitat patches are highly correlated with reduced
genetic variability within the population (Whiteley et al. 2013). A similar effect would likely
occur where brook char populations are fragmented by thermal boundaries or intraspecific
competition from brown trout. In isolation, the total loss of genetic diversity increases with
successive generations (Heft et al. 2006). Over time, this loss of genetic diversity results in a
lower overall population fitness and leaves the population vulnerable to localized extinction
15
resulting from environmental stochasticity (Whiteley et al. 2013). Letcher et al. (2007) found
that localized extinction can be predicted to occur within a period of six years or less for brook
char populations in complete isolation.
5. Conclusion
This study demonstrates that brown trout are gradually moving from the main stem of the
Gunpowder River into its tributaries. In tributaries with resident brook char populations, the
presence of alien brown trout is correlated highly with reduced brook char densities. Like brown
trout, brook char are stenothermal species and require cold water condition for the sustainment of
wild populations. However, because most brook char occur in the upper reaches of the
Gunpowder’s tributaries, populations may not be able to migrate upstream to seek refuge.
Furthermore, the combination of increasing brown trout presence and gradually increasing
temperatures may be acting together as a physical barrier to brook char movement. This barrier
effect isolates brook char populations to small patches of habitat that may have little or no
connectivity to source populations.
This study provides evidence that human introduced brown trout are contributing to
population fragmentation of native brook char in the Gunpowder watershed. Increases in water
temperature and an expanding resident brown trout population may be a driving factors in the
progressive upstream movement of brown trout into the tributary systems. Under this scenario, it
is possible that brook char could be expatriated from the Gunpowder watershed entirely.
However, more studies are needed to better understand the extend of habitat fragmentation that
has occurred in the Gunpowder watershed resulting from asymmetric competition between
brown trout and brook char. Additional, studies looking at climate change as a driving factor of
habitat fragmentation should be conducted to better understand the rates of change and to predict
what changes will likely occur in the spatial distributions of native brook char.
16

6. Acknowledgement
The author extends his sincere gratitude to Kevin D. Brittingham, Ph.D. Adjunct Faculty
at Johns Hopkins University Advanced Academic Programs Environmental Science and
Policy program for his professional insight, assistance, and mentorship as the primary faculty
advisor for this Capstone, and to Daniel S. Zachary, Ph.D., Program Director and senior
lecturer of the Energy Policy and Climate program at Johns Hopkins Advanced Academic
Programs for his guidance over the course of this project. Special thanks are also due to
Daniel Boward, Adjunct Professor for the Johns Hopkins Environmental Science and Policy
program and Environmental Program Manager at the Maryland Department of Natural
Resources and Lynn Davidson, Wildlife and Heritage Conservation Technology Manager at
the Maryland Department of Natural Resources for their assistance in providing the
Maryland Biological Stream Survey data used for this project. Also, thanks are due to Mark
Staley, Maryland Department of Natural Resources Central Region Freshwater Fisheries
Program Manager for his assistance in providing site-specific fisheries data and for his time
and professional insight given in support of this project.
17

Works Cited
Argent, David G., William G. Kimmel, and Derek Gray. "Changes in the status of native brook trout on Laurel Hill, southwestern Pennsylvania." Northeastern Naturalist 25, no. 1 (2018): 1-20. doi:10.1656/045.025.0101.
Cucherosset, Julien and Julian D. Olden. “Ecological impacts of non-native freshwater fishes.” Fisheries 36,
no 5 (2011): 215-230. Elliot, J.M. & J.A Elliot. “Temperature requirements of Atlantic salmon Salmo salar, brown trout, Salmo
trutta, and Arctic char, Salvelinus alpinus: predicting the effects of climate change.” Journal of Fish Biology 77 (2010): 1793-1817. doi: 10.1111/j.1095-8649.2010.02762.x.
Heft Alan, A., Nancy Butowski, Don Cosden, Steve Early, Charlie Gougeon, Todd Heerd, Jody Johnson,
Alan Klotz, Karen Knotts, H. Robert Lunsford, John Mullican, Ken Pavol, Susan Rivers, Mark Staley, Mark Toms, Paul Kazyak, Ron Klauda, Scott Stranko, Ray Morgan, Matt Kline, Bob Hilderbrand. “2006 Maryland brook trout fisheries management plan”. Maryland Department of Natural Resources Fisheries Service Inland Fisheries Management Division. (2006).
Hitt, Nathaniel P., Erin L. Snook, and Danielle L. Massie. "Brook trout use of thermal refugia and foraging
habitat influenced by brown trout." Canadian Journal of Fisheries and Aquatic Sciences 74, no. 3 (2017): 406-18. doi:10.1139/cjfas-2016-0255.
Hoxmeier, R. John H., and Douglas J. Dieterman. "Seasonal movement, growth and survival of brook trout in
sympatry with brown trout in Midwestern US streams." Ecology of Freshwater Fish 22, no. 4 (2013): 530-42. doi:10.1111/eff.12051.
Kanno, Yoichiro, Matt A. Kulp, and Stephen E. Moore. "Recovery of native brook trout populations
following the eradication of nonnative rainbow trout in Southern Appalachian Mountains streams." North American Journal of Fisheries Management36, no. 6 (2016): 1325-335. doi:10.1080/02755947.2016.1221004.
Letcher, Benjamin H, Kieth H. Nislow, Jason A. Coombs, Matthew J. O’Donnell, Todd L. Dubreuil.
“Population response to habitat fragmentation in a stream-dwelling brook trout population.” PLoS ONE 2 (2011): e1139. doi:10.1371/journal.pone.0001139.
Malmros, Andreas. “Interspecific and intraspecific competitive interactions in brook charr, salvelinus
frontalis, and brown trout, Salmo trutta.” Institutinen för Vattenbruk 901, no83 (2006): 1-14. Snyder, D., Hitt, Nathaniel P, Young, John A. “Accounting for groundwater in stream fish thermal habitat
response to climate change.” Ecological Applications 25, no. 5 (2015): 1397-1419. doi:128.220.8.15 Stitt, Bradley C., Gary Burness, Kirsten A. Burgomaster, Suzanne Currie, Jenni L. Mcdermid, and Chris C.
Wilson. "Intraspecific variation in thermal tolerance and acclimation capacity in brook trout (Salvelinus Fontinalis): physiological implications for climate change." Physiological and Biochemical Zoology 87, no. 1 (2014): 15-29. doi:10.1086/675259.
Studinski, Jered M., Andrew W. Hafs, Jonathan M. Niles, and Kyle J. Hartman. "The effects of riparian
disturbance on the condition and summer diets of age-0 brook trout (Salvelinus fontinalis) in three Central Appalachian streams." Canadian Journal of Fisheries and Aquatic Sciences 974, no. 7 (2017): 980-86. doi:10.1139/cjfas-2016-0301.
18
Waddle, J. Hardin, Robert M. Dorazio, Susan C. Walls, Kenneth G. Rice, Jeff Beauchamp, Melinda J. Schuman, and Frank J. Mazzotti. "A new parameterization for estimating co-occurrence of interacting species." Ecological Applications 20, no. 5 (2010): 1467-475. doi:10.1890/09-0850.1.
Wagner, Tyler, Jefferson T. Deweber, Jason Detar, and John A. Sweka. "Landscape-scale evaluation of
asymmetric interactions between brown trout and brook trout using two-species occupancy models." Transactions of the American Fisheries Society 142, no. 2 (2013): 353-61. doi:10.1080/00028487.2012.734892.
Whiteley, Andrew R., Jason A. Coombs, Mark Hudy, Zachary Robinson, Amanda R. Colton, Keith H.
Nislow, and Benjamin H. Letcher. "Fragmentation and patch size shape genetic structure of brook trout populations." Canadian Journal of Fisheries and Aquatic Sciences 70, no. 5 (2013): 678-88. doi:10.1139/cjfas-2012-0493.
Öhlund, Gunnar, Fredrik Nordwall, Erik Degerman, and Torleif Eriksson. "Life history and large-scale
habitat use of brown trout (Salmo trutta) and brook trout (Salvelinus fontinalis) — implications for species replacement patterns." Canadian Journal of Fisheries and Aquatic Sciences 65, no. 4 (2008): 633-44. doi:10.1139/f08-003.
Rahel, Frank J, Nathan P Nibbelink. “Spatial patterns in relations among brown trout (Salmo trutta)
distribution, summer air temperature, and stream size in Rocky Mountain streams.” Canadian Journal of Fisheries and Aquatic Sciences 43, no. 56 (1999): 43-51. doi:10.1139/f99-210.
19

Appendices
Map 1. MBSS sampling sites from 1996-2000
Map 2. MBSS sampling sites from 2001-2010
20

Map 3. MBSS sampling sites from 2011-2018
Map 4. MD Freshwater Fisheries sample sites
21

Brook Char Only Number of samples (n) �̅� 𝜎 BIBI 18 4.23 0.54 FIBI 18 2.98 0.97
Temp (°C) 18 16.35 2.10 Drainage Area
(Hectares) 18 541.58 331.22
Mean Depth 18 42.89 15.91 Mean Habitat Score 18 14.67 0.24
Mean Embeddedness 18 34.17 17.68 Mean Percent Shading 18 73.33 21.16 Mean Number Woody
Debris 18 3.61 3.33
Fish Density (fish/m2) 18 0.14 0.24 Table 2. Summary of MBSS data for the brook char only group.
Brook Char in the Presence of Brown
Trout
Number of samples (n) �̅� 𝜎
BIBI 20 4.43 0.60 FIBI 20 2.88 0.74
Temp (°C) 10 17.67 2.44 Drainage Area
(Hectares) 20 698.01 597.86
Mean Depth 20 49.77 17.56 Mean Habitat Score 20 16.00 1.49
Mean Embeddedness 20 32.00 15.76 Mean Percent Shading 20 80.45 12.63
Mean Number of Woody Debris
20 5.65 4.40
Fish Density (fish/m2) 20 0.06 0.05 Table 3. Summary of MBSS data for brook char in the presence of brown trout.
Brown Trout Only Number of samples �̅� 𝜎 BIBI 42 3.5 1.13 FIBI 42 3.59 0.76
Temp (°C) 28 18.16 3.22 Drainage Area
(Hectares) 42 5902.98 9255.65
Mean Depth 42 67.57 27.27 Mean Habitat Score 42 13.83 2.73
Mean Embeddedness 42 40.36 22.50 Mean Percent Shading 42 64.07 19.30 Mean Number Woody
Debris 42 7.54 11.27
Fish Density (fish/m2) 42 0.094 0.31 Table 4. Summary of MBSS data for the brown trout only group.
22
Brown Trout in the Presence of Brook Char
Number of samples �̅� 𝜎
BIBI 20 4.43 0.60 FIBI 20 2.88 0.74
Temp (°C) 10 17.67 2.44 Drainage Area
(Hectares) 20 698.01 597.86
Mean Depth 20 49.77 17.56 Mean Habitat Score 20 16.00 1.49
Mean Embeddedness 20 32.00 15.76 Mean Percent Shading 20 80.45 12.63
Mean Number of Woody Debris
20 5.65 4.40
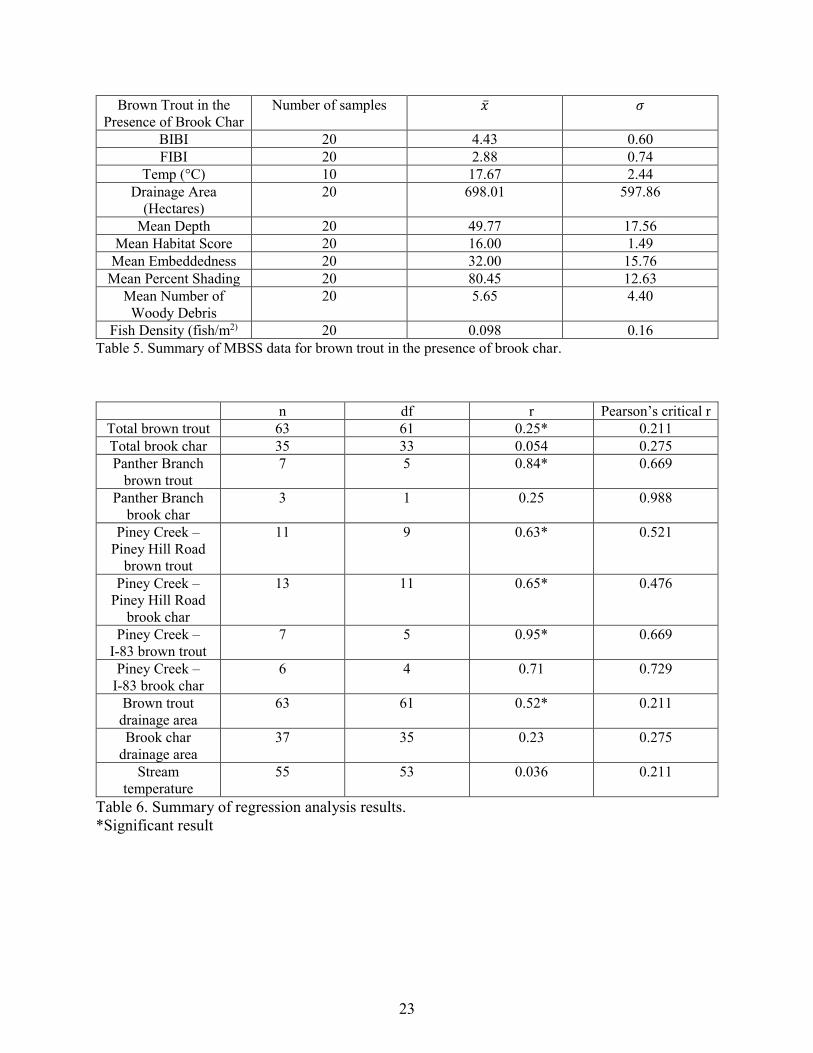
Fish Density (fish/m2) 20 0.098 0.16 Table 5. Summary of MBSS data for brown trout in the presence of brook char.
n df r Pearson’s critical r
Total brown trout 63 61 0.25* 0.211 Total brook char 35 33 0.054 0.275 Panther Branch
brown trout 7 5 0.84* 0.669
Panther Branch brook char
3 1 0.25 0.988
Piney Creek – Piney Hill Road
brown trout
11 9 0.63* 0.521
Piney Creek – Piney Hill Road
brook char
13 11 0.65* 0.476
Piney Creek – I-83 brown trout
7 5 0.95* 0.669
Piney Creek – I-83 brook char
6 4 0.71 0.729
Brown trout drainage area
63 61 0.52* 0.211
Brook char drainage area
37 35 0.23 0.275
Stream temperature
55 53 0.036 0.211
Table 6. Summary of regression analysis results. *Significant result
23