analysis of arctas-carb using wrf-chem and mozart
TRANSCRIPT
Analysis of ARCTASAnalysis of ARCTAS--Carb Using Carb Using WRFWRF--ChemChem and MOZARTand MOZART
Gabriele PfisterNational Center for Atmospheric ResearchBoulder, CO
ARCTAS California Workshop, 30 June 2009

Analysis of ARCTASAnalysis of ARCTAS--Carb Using Carb Using WRFWRF--ChemChem and MOZARTand MOZART
Acknowledgements:Louisa Emmons, Christine Wiedinmyer, Stacy Walters, David Edwards (NCAR)
ARCTAS Science Team
EPA for surface monitoring dataSatellite Teams for dataNSF and NASA for funding
and many others...
ARCTAS California Workshop, 30 June 2009
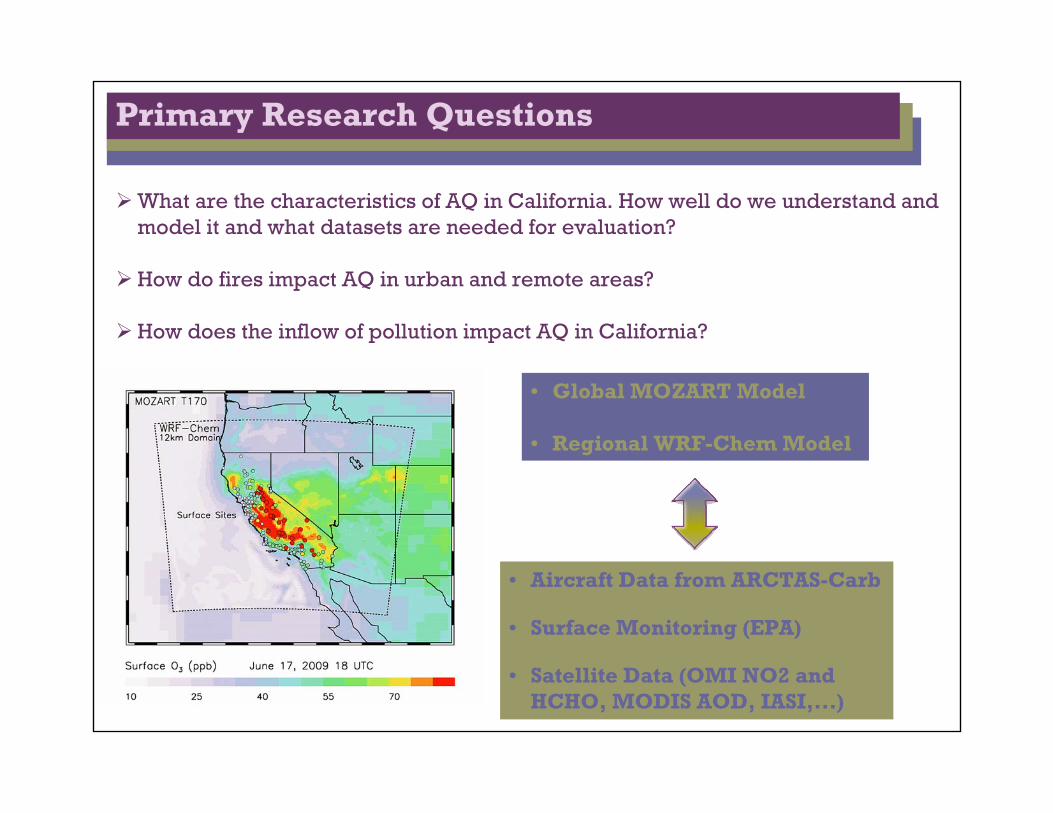
Primary Research Questions
What are the characteristics of AQ in California. How well do we understand and model it and what datasets are needed for evaluation?
How do fires impact AQ in urban and remote areas?
How does the inflow of pollution impact AQ in California?
What are the characteristics of AQ in California. How well do we understand and model it and what datasets are needed for evaluation?
How do fires impact AQ in urban and remote areas?
How does the inflow of pollution impact AQ in California?
• Aircraft Data from ARCTAS-Carb
• Surface Monitoring (EPA)
• Satellite Data (OMI NO2 and HCHO, MODIS AOD, IASI,...)
• Global MOZART Model
• Regional WRF-Chem Model
Primary Research Questions
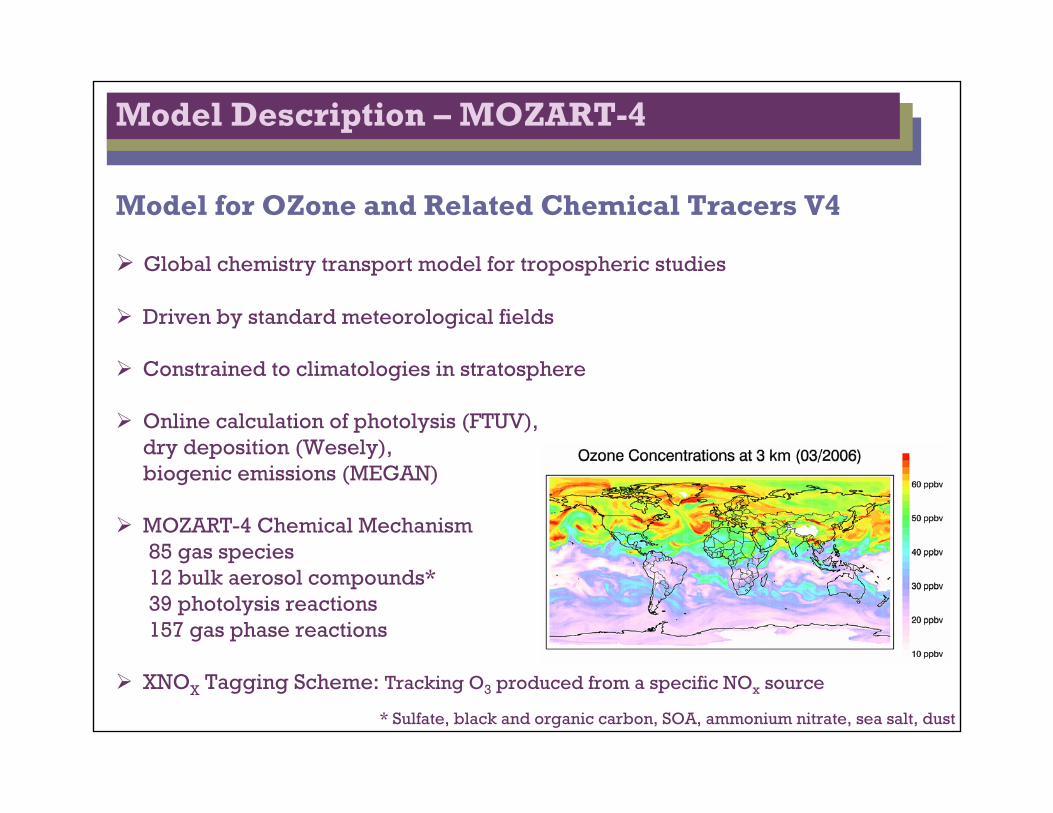
Model Description – MOZART-4
Model for OZone and Related Chemical Tracers V4
Global chemistry transport model for tropospheric studies
Driven by standard meteorological fields
Constrained to climatologies in stratosphere
Online calculation of photolysis (FTUV), dry deposition (Wesely), biogenic emissions (MEGAN)
MOZART-4 Chemical Mechanism85 gas species12 bulk aerosol compounds*39 photolysis reactions157 gas phase reactions
XNOX Tagging Scheme: Tracking O3 produced from a specific NOx source
* Sulfate, black and organic carbon, SOA, ammonium nitrate, sea salt, dust
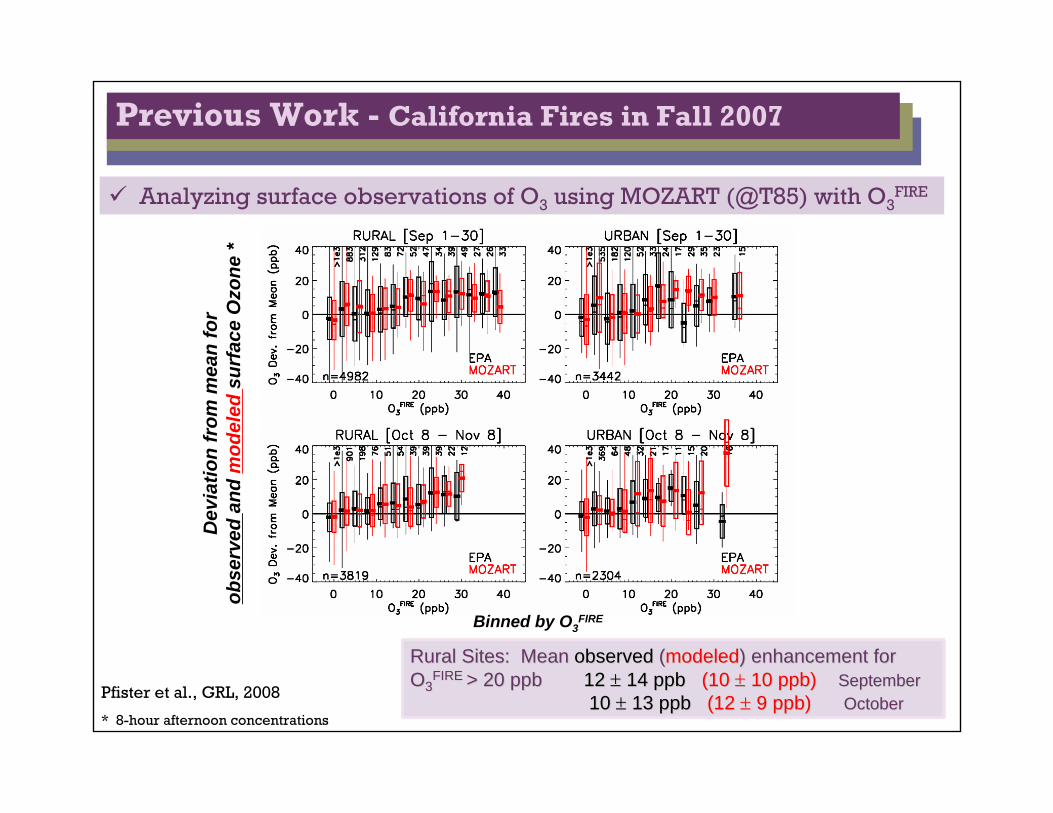
Previous Work - California Fires in Fall 2007
Dev
iatio
n fr
om m
ean
for
obse
rved
and
mod
eled
sur
face
Ozo
ne *
Binned by O3FIRE
* 8-hour afternoon concentrations
Rural Sites: Mean Rural Sites: Mean observed observed ((modeledmodeled) enhancement for ) enhancement for OO33
FIRE FIRE > 20 ppb > 20 ppb 12 12 14 ppb 14 ppb (10 (10 10 ppb) 10 ppb) SeptemberSeptember10 10 13 ppb 13 ppb (12 (12 9 ppb) 9 ppb) OctoberOctober
Analyzing surface observations of O3 using MOZART (@T85) with O3FIRE
Pfister et al., GRL, 2008

Previous Work - California Fires in Fall 2007
Hypothesis:
NO2FIRE and O3
FIRE Relationship for different NOx regimes
Mean Median| Stdv
Adding additional Adding additional NONOxx in a less polluted environment in a less polluted environment causes a causes a larger larger ozone increaseozone increase
compared to a compared to a NONOxx and VOC richer environment and VOC richer environment
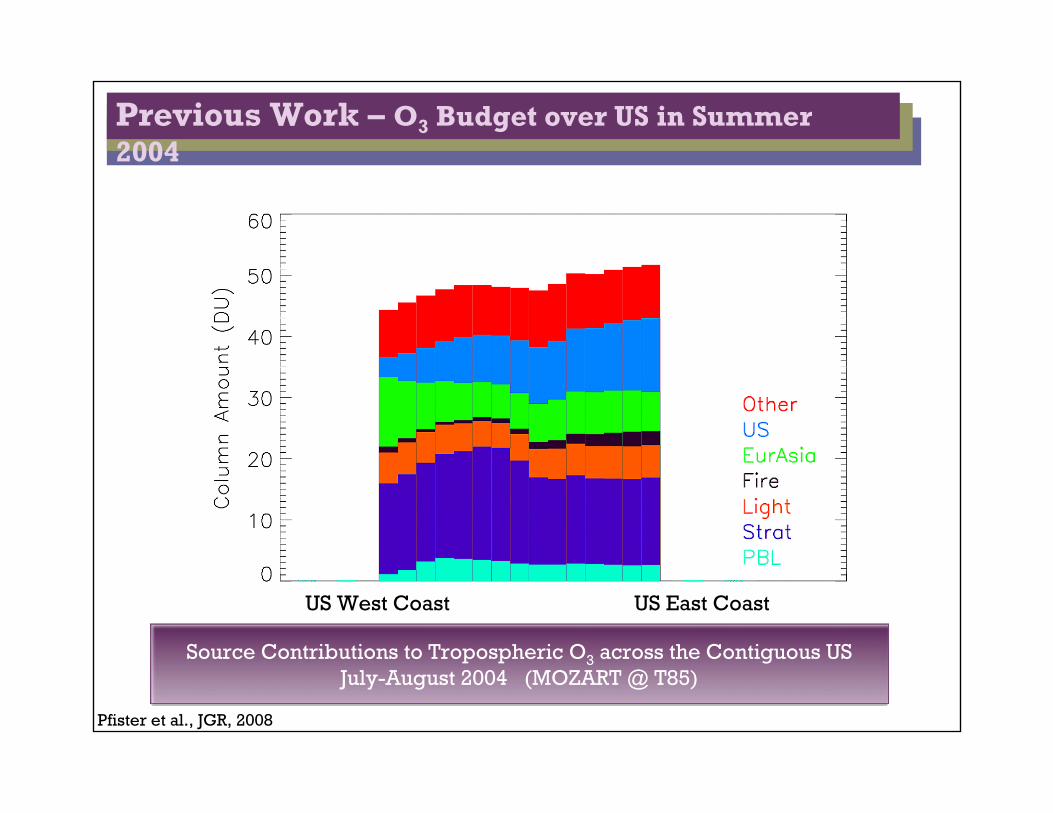
Source Contributions to Tropospheric O3 across the Contiguous USJuly-August 2004 (MOZART @ T85)
Previous Work – O3 Budget over US in Summer 2004
Pfister et al., JGR, 2008
US West Coast US East Coast
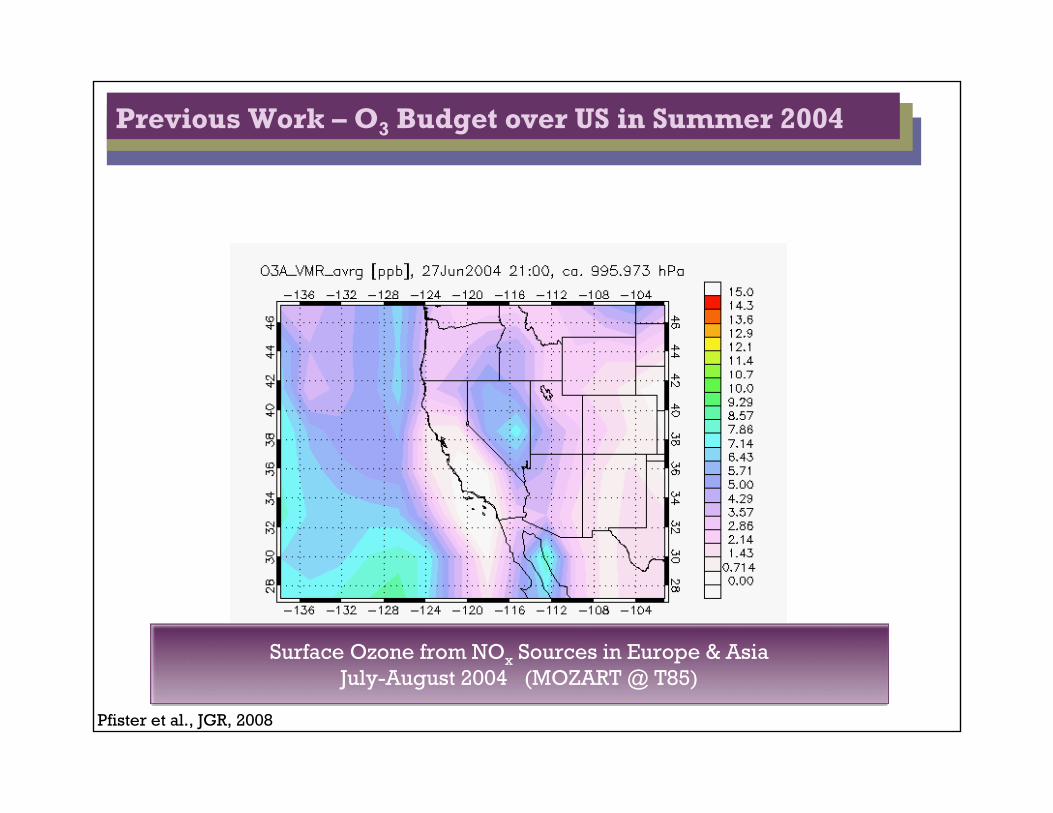
Surface Ozone from NOx Sources in Europe & AsiaJuly-August 2004 (MOZART @ T85)
Previous Work – O3 Budget over US in Summer 2004
Pfister et al., JGR, 2008
ARCTAS-Carb – Summer 2008ARCTAS-Carb – Summer 2008ARCTAS-Carb – Summer 2008

ARCTAS-Carb – Summer 2008ARCTAS-Carb – Summer 2008ARCTAS-Carb – Summer 2008PreliminaryPreliminary

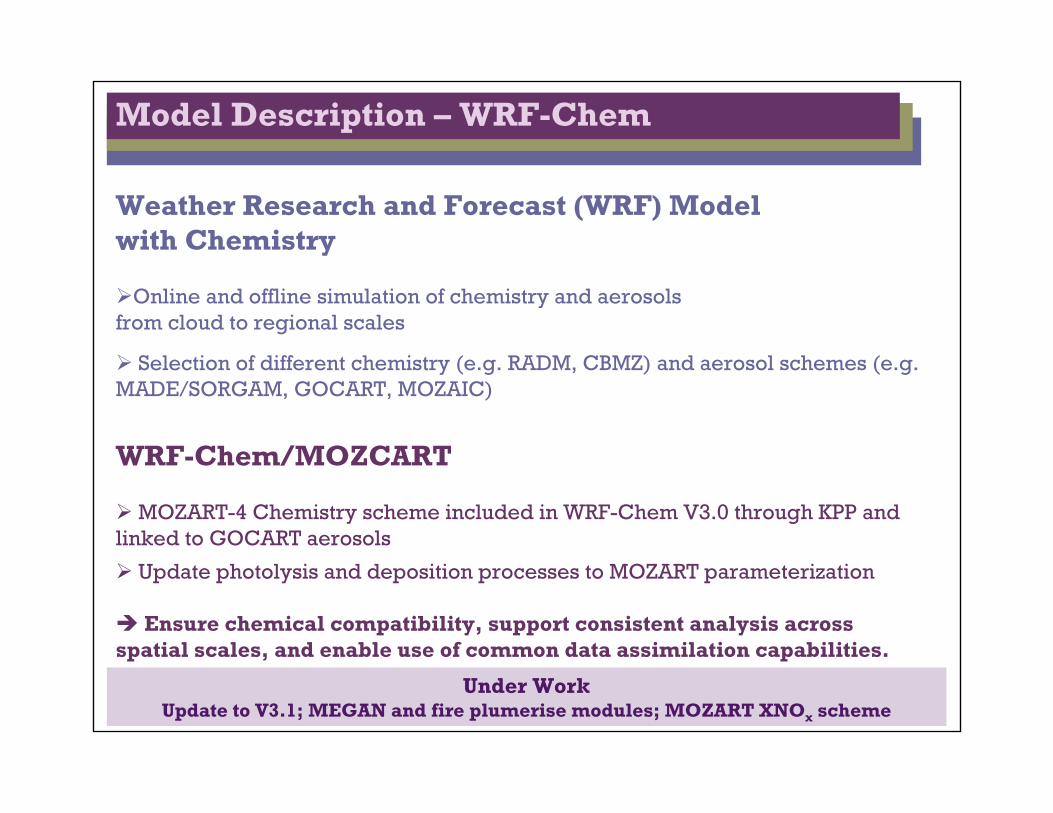
Model Description – WRF-Chem
Weather Research and Forecast (WRF) Model with Chemistry
Online and offline simulation of chemistry and aerosols from cloud to regional scales
Selection of different chemistry (e.g. RADM, CBMZ) and aerosol schemes (e.g. MADE/SORGAM, GOCART, MOZAIC)
WRF-Chem/MOZCART
MOZART-4 Chemistry scheme included in WRF-Chem V3.0 through KPP and linked to GOCART aerosols
Update photolysis and deposition processes to MOZART parameterization
Ensure chemical compatibility, support consistent analysis across spatial scales, and enable use of common data assimilation capabilities.
Under WorkUpdate to V3.1; MEGAN and fire plumerise modules; MOZART XNOx scheme

Model Simulations
WRF-Chem/MOZCART MOZART-4
Resolution 12x12 km2, 1 domain T170 (~0.7°x0.7°)
Anthr. Emissions
EPA NEI -2005 *Hourly Daily
Fire EmissionsInjection HeightDiurnal Cycle
C. Wiedinmyer (NCAR)Surface-1.5 km Surface
WRAP daily profile none
Biogenic Emis. Guenther MEGAN V2.1, soil NOx
Met. Fields NAM (IC,BC, grid nudging) NCEP/GFSVertical Levels
51 (up to 65 hPa) 42 (up to 2 hPa)
Simulation Period: June 12-30, 2008
MOZART (@T85) provides initial and boundary conditions for WRF-Chem/MOZCART
* provided by Stu McKeen (NOAA)
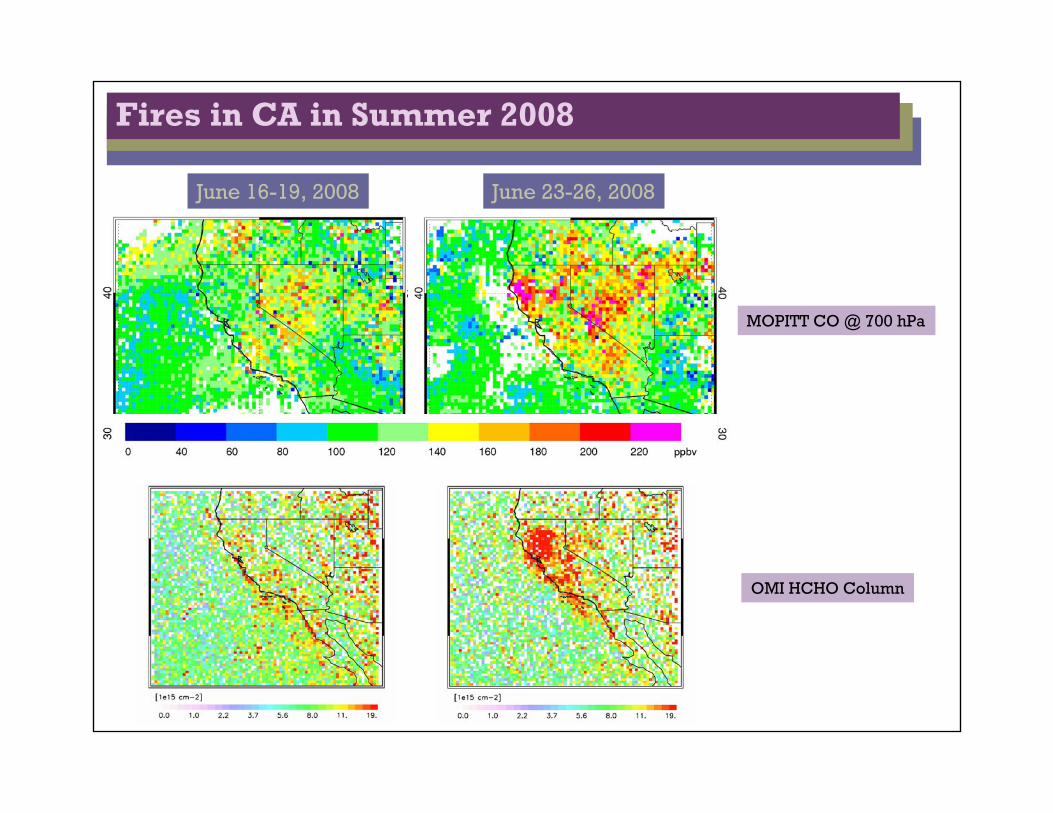
Fires in CA in Summer 2008
June 16-19, 2008 June 23-26, 2008
MOPITT CO @ 700 hPa
OMI HCHO Column
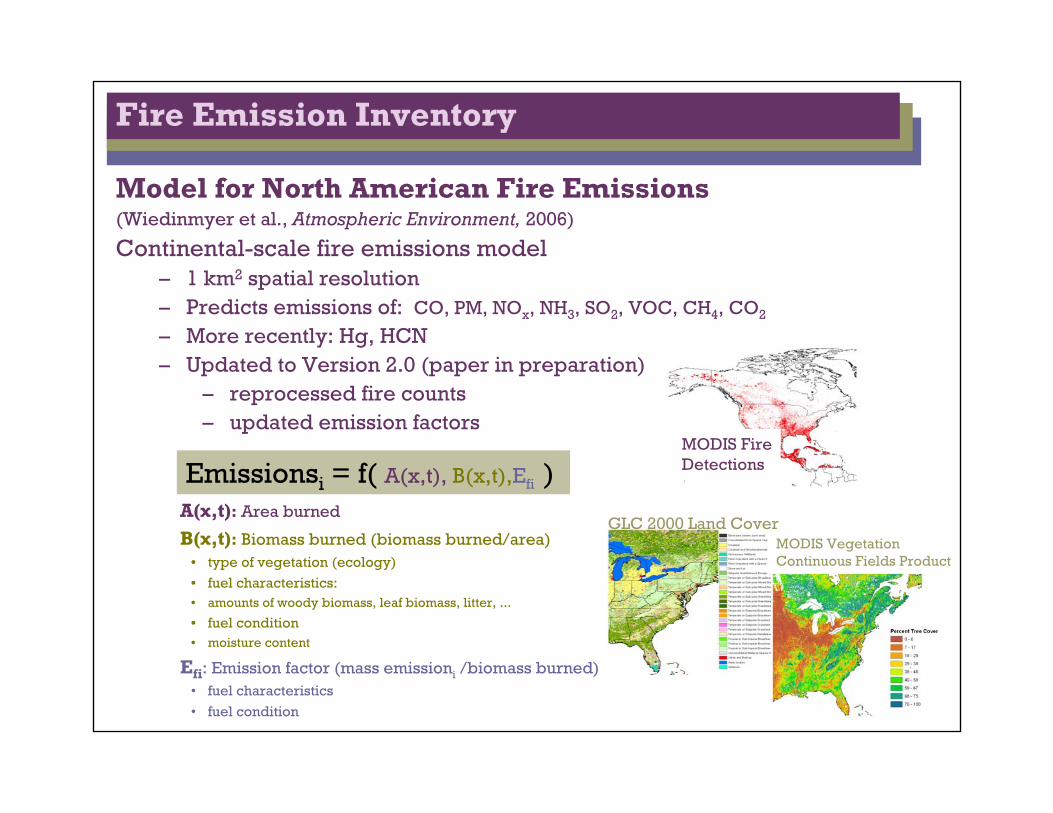
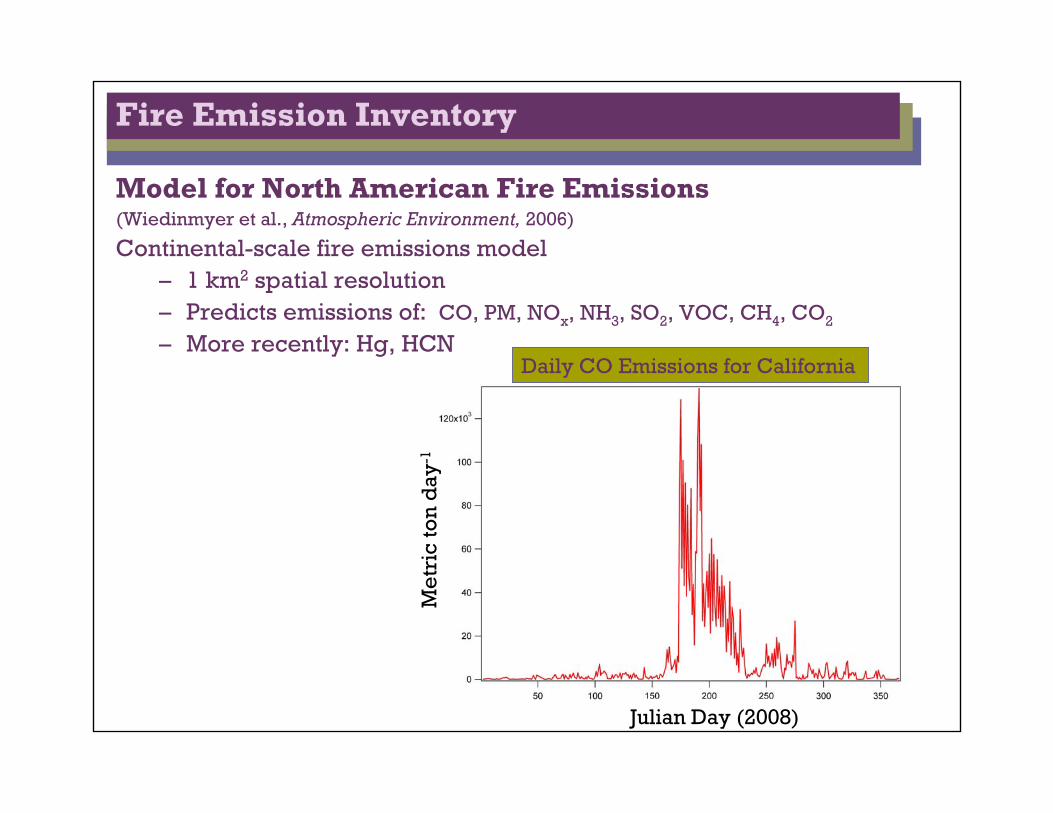
Fire Emission Inventory
Model for North American Fire Emissions(Wiedinmyer et al., Atmospheric Environment, 2006)
Continental-scale fire emissions model– 1 km2 spatial resolution– Predicts emissions of: CO, PM, NOx, NH3, SO2, VOC, CH4, CO2
– More recently: Hg, HCN– Updated to Version 2.0 (paper in preparation)
– reprocessed fire counts– updated emission factors
Fire Emission Inventory
A(x,t): Area burned
B(x,t): Biomass burned (biomass burned/area)• type of vegetation (ecology)
• fuel characteristics:• amounts of woody biomass, leaf biomass, litter, ...
• fuel condition• moisture content
Efi: Emission factor (mass emissioni /biomass burned)• fuel characteristics
• fuel condition
GLC 2000 Land CoverMODIS VegetationContinuous Fields Product
MODIS Fire DetectionsEmissionsi = f( A(x,t), B(x,t),Efi )
Model for North American Fire Emissions(Wiedinmyer et al., Atmospheric Environment, 2006)
Continental-scale fire emissions model– 1 km2 spatial resolution– Predicts emissions of: CO, PM, NOx, NH3, SO2, VOC, CH4, CO2
– More recently: Hg, HCN– Updated to Version 2.0 (paper in preparation)
– reprocessed fire counts– updated emission factors
Fire Emission Inventory
Model for North American Fire Emissions(Wiedinmyer et al., Atmospheric Environment, 2006)
Continental-scale fire emissions model– 1 km2 spatial resolution– Predicts emissions of: CO, PM, NOx, NH3, SO2, VOC, CH4, CO2
– More recently: Hg, HCNDaily CO Emissions for California
Me
tric
ton
day
-1
Julian Day (2008)

MOZART O3 Fire Tracer
Surface Ozone from Fires in Contiguous US(15 June – 7 July 2008, MOZART @ T170)
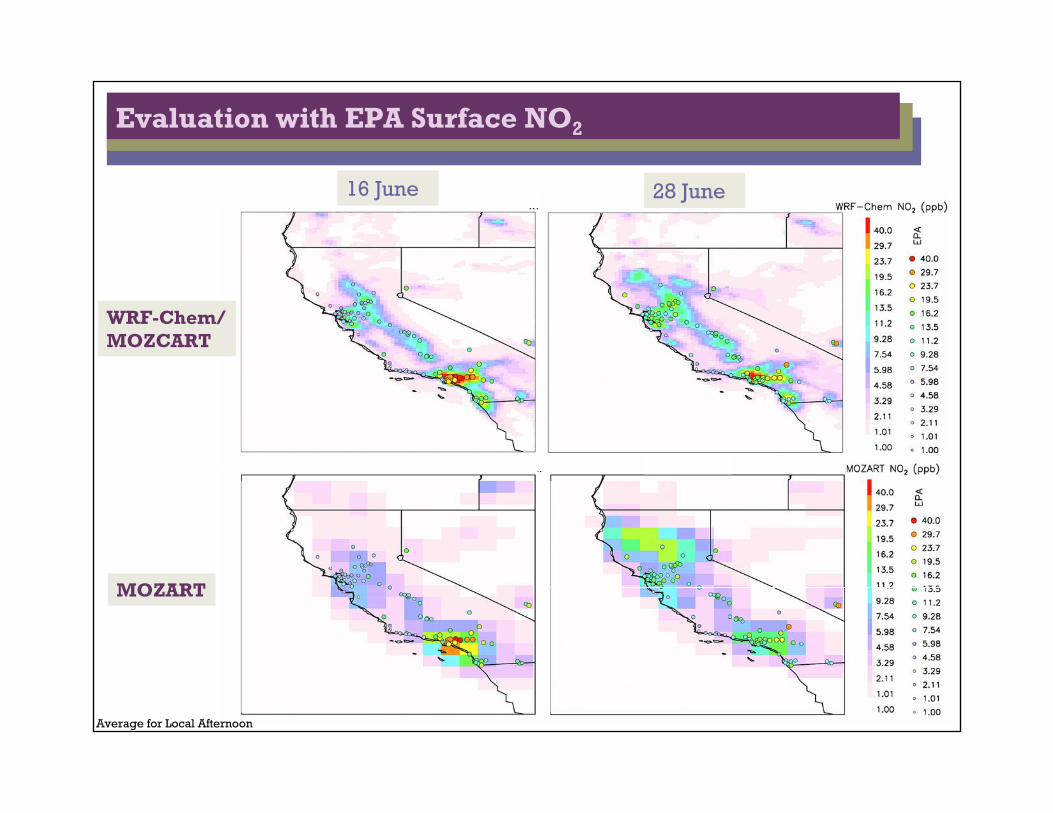
Evaluation with EPA Surface NO2
WRF-Chem/MOZCART
16 June
Average for Local Afternoon
MOZART
28 June

Evaluation with OMI NO2
Preliminary No exact match of model time with AURA overpass time
OMI WRF-Chem/MOZCART MOZART
June 15-19, 2008
June 20-24, 2008

Evaluating Surface O3 – EPA Monitoring Sites
WRF-Chem/MOZCART
16 June
MOZART
28 June
Daily 8-hour Maximum

Evaluating Surface O3 – EPA Monitoring Sites
WRF-Chem/MOZCART
16 June
MOZART
28 June
Daily 8-hour Maximum
Isoprene Concentrations
WRF-Chem/MOZCART MOZART
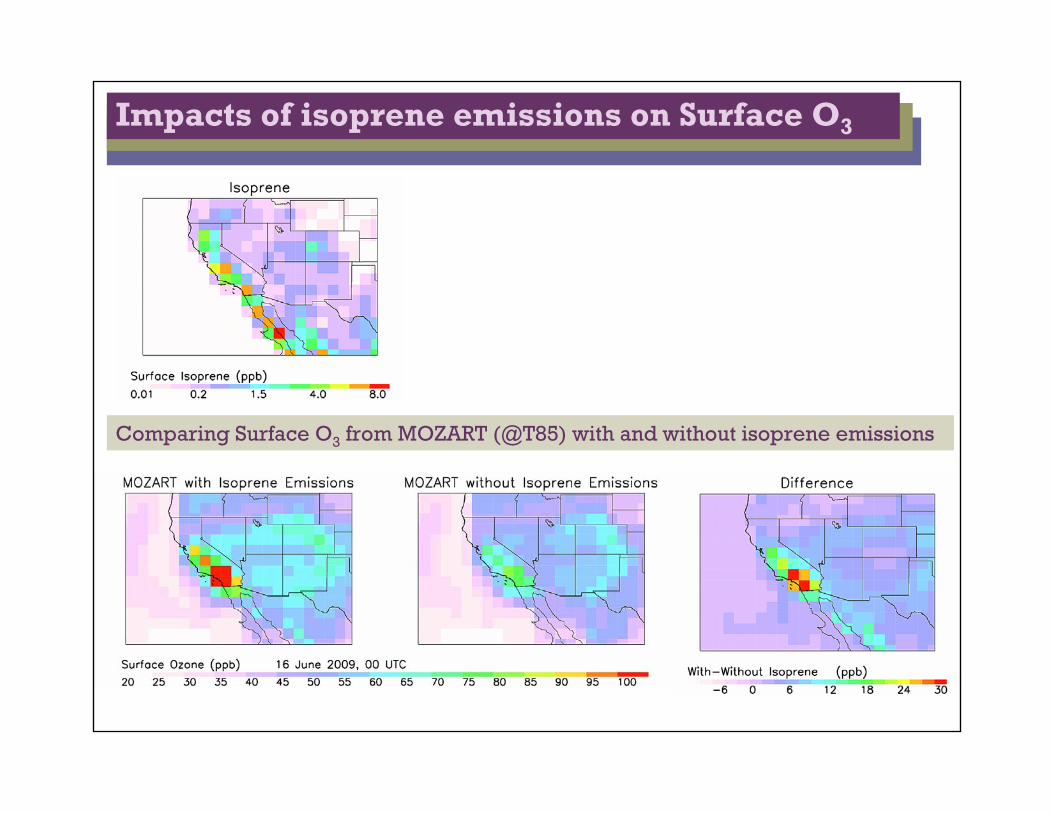
Impacts of isoprene emissions on Surface O3
Comparing Surface O3 from MOZART (@T85) with and without isoprene emissions

Impacts of isoprene - DC-8 Aircraft Data
Observations WRF-Chem/MOZCART MOZART
O3
(pp
b)
Iso
p(p
pb
)H
CH
O (
pp
b)
DC-8 FlightJune 18
ac_comparison_mz4.5_CARB_T170_WRFrun_24_set2_Jun18.eps.g if
O3
FIR
E (
pp
b) A
ceto
nitrile
(pp
b)
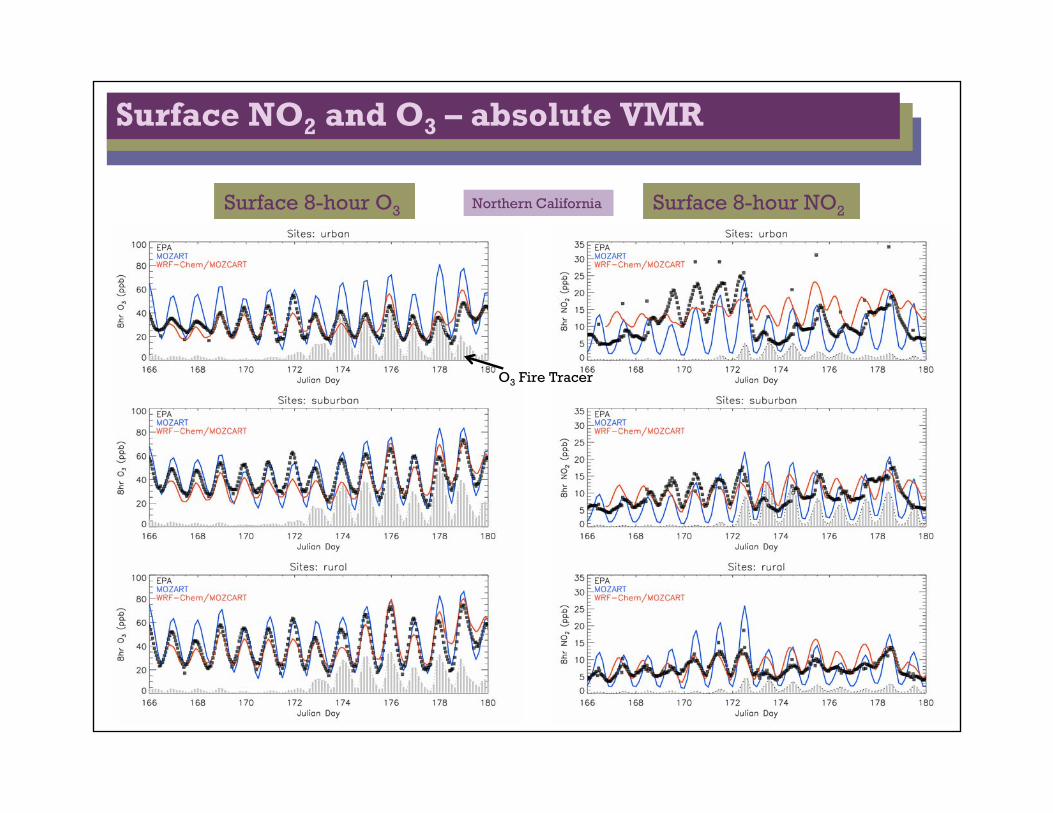
Surface NO2 and O3 – absolute VMR
Northern CaliforniaSurface 8-hour O3 Surface 8-hour NO2
O3 Fire Tracer

Surface O3 – Absolute & Deviation from Mean
Surface 8-hour O3 Deviation from MeanNorthern California
Summary• Analysis of ARCTAS-Carb will integrate in-situ data (ground & aircraft), satellite data and the WRF-Chem and MOZART models. Observations will be essential in model evaluation and models will play a significant role in data interpretation.
• Large impact of biogenic emissions over the study region –careful evaluation of biogenic emission schemes needed
• Intense wildfires during ARCTAS-Carb. Combination of datasets and models will help to evaluate emission inventories, emission factors, injection height, etc.
• Research goal is to understand the spatial and temporal characteristics of the different factors that impact air pollution over California (pollution inflow, local sources, fires and biogenic emissions).
Thanks
Summary• Analysis of ARCTAS-Carb will integrate in-situ data (ground & aircraft), satellite data and the WRF-Chem and MOZART models. Observations will be essential in model evaluation and models will play a significant role in data interpretation.
• Large impact of biogenic emissions over the study region –careful evaluation of biogenic emission schemes needed
• Intense wildfires during ARCTAS-Carb. Combination of datasets and models will help to evaluate emission inventories, emission factors, injection height, etc.
• Research goal is to understand the spatial and temporal characteristics of the different factors that impact air pollution over California (pollution inflow, local sources, fires and biogenic emissions).

Additional Slides
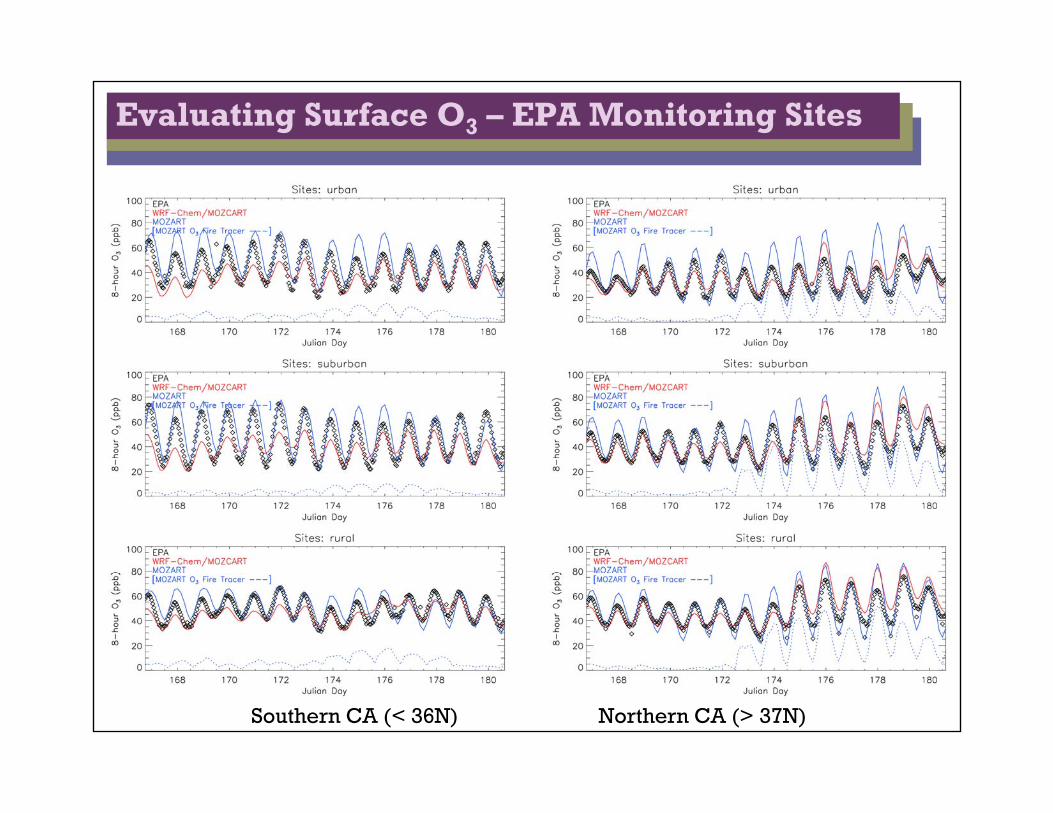
Southern CA (< 36N) Northern CA (> 37N)
Evaluating Surface O3 – EPA Monitoring Sites

Southern CA (< 36N) Northern CA (> 37N)
Evaluation with EPA Surface NO2