analysis of an intervention to reduce
TRANSCRIPT

1
Analysis of an Intervention to Reduce
Truck Drivers’ Exposure to Whole-Body Vibration
Thomas Louwers
A thesis
submitted in partial fulfillment of the
requirements for the degree of
Master of Public Health
University of Washington
2016
Committee:
Peter Johnson (Chair)
Gregory Martin
Sverre Vedal
Program Authorized to Offer Degree:
School of Public Health

2
© Copyright 2016
Thomas Louwers

3
University of Washington
Abstract
Analysis of an Intervention to Reduce
Truck Drivers’ Exposure to Whole-Body Vibration
Thomas Louwers
Chair of the Supervisory Committee:
Peter Johnson, PhD, MSc
Department of Environmental and Occupational Health Sciences
Introduction. The high prevalence of low back pain in drivers of commercial motor
vehicles is well-documented. A number of interventions to reduce low back pain in
commercial motor vehicle operators have focused on reducing exposures to whole-
body vibration (WBV).
Objective. An intervention to be evaluated for the trucking industry is an air-filled
ballistic seat pad designed to reduce exposure to WBV. The effectiveness of the seat
pad in semi-trucks has not yet been established. Results from a previous pilot study
involving 12-ton and 16-ton vibratory rollers used by Seattle Public Utility drivers
suggest that the seat pad is not effective at very low speeds (1-3 mph).

4
Methods. The current study measures, characterizes and compares WBV exposures in
nine truck drivers who operated their trucks over the same roads. WBV exposures
were compared between their existing air-suspension seat and the air-filled ballistic seat
pad which sat on top of their existing seat. This study uses a Wilcoxon signed rank test
to compare the seat pad’s effectiveness in reducing WBV exposures relative to their
existing air-suspension seat.
Results. Overall, the truck drivers' vibration exposures were above daily vibration
action values set by the International Standards Organization (ISO) and the air-filled
ballistic seat pad did not significantly reduce WBV exposure relative to the WBV
exposures experienced with their existing air-suspension seat.
Conclusions. In the semi-trucks evaluated in this study, the air-filled ballistic seat pad
was not effective in reducing WBV exposures. The seat pad has been shown to be
effective in reducing WBV exposures in public transportation buses and cars. The
answer for why the air-filled seat pads were not effective in semi-trucks may lie in a
future analysis of the power spectral densities, which shows the vibration exposures as
a function of frequency. Buses and cars produce more high frequency vibration energy,
and the air-filled seat pad has been shown to be effective in these vehicles when
travelling at moderate to high speeds. Trucks may produce less high frequency
vibration energy, and this may have diminished the air-filled seat pad’s effectiveness in
the semi-truck evaluated in this study.
5
Disclaimer: The views expressed in this article are those of the authors and do not
necessarily reflect the official policy or position of the Department of the Army,
Department of the Navy, Department of Defense, or the United States Government. I
am a military service member. This work was prepared as part of my official duties.
Title 17, USC, §105 provides that 'Copyright protection under this title is not available
for any work of the U.S. Government.' Title 17, USC, §101 defines a U.S. Government
work as a work prepared by a military service member or employee of the U.S.
Government as part of that person's official duties. The study protocol was approved
by the University of Washington Institutional Review Board in compliance with all
applicable Federal regulations governing the protection of human subjects. The images
in this presentation are public domain graphics and do not represent any person in this
presentation.
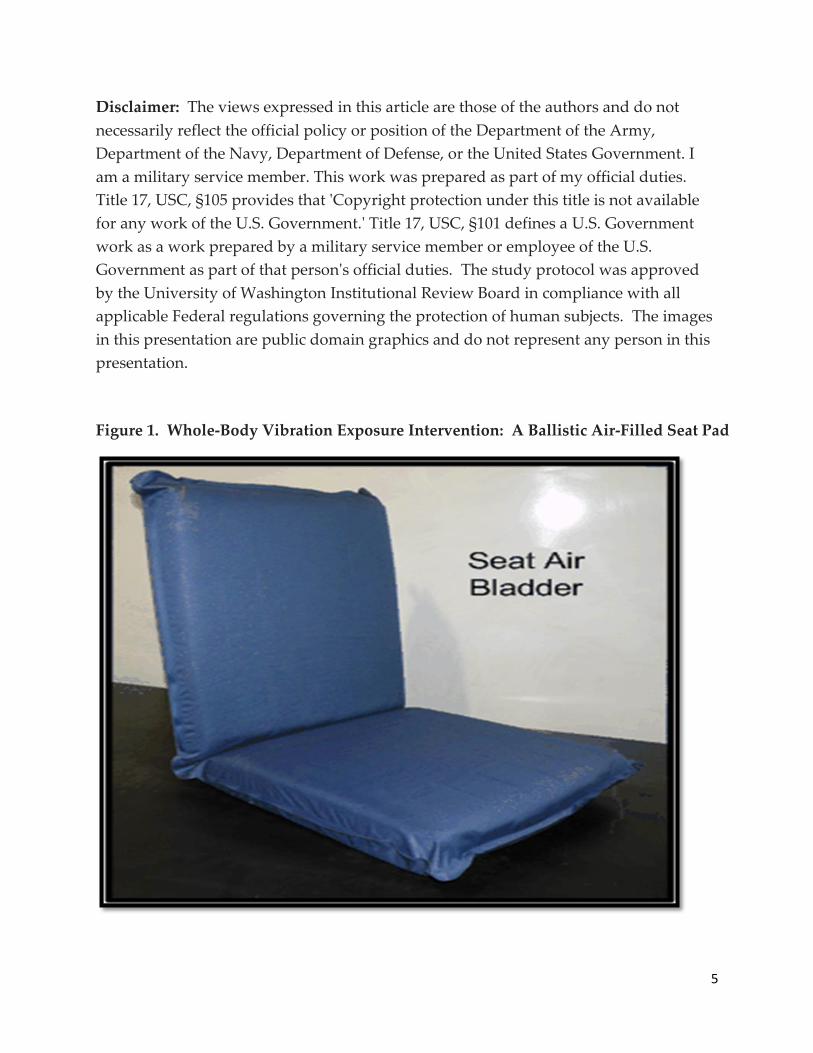
Figure 1. Whole-Body Vibration Exposure Intervention: A Ballistic Air-Filled Seat Pad

6
Acknowledgements
Thanks to Peter Johnson, PhD, MS; Gregory Martin, MD, MPH; Sverre Vedal, MD, MSc;
and Hugh Davies, PhD, MSc. Without their generous support, my research would not
have been possible.
I am also very grateful to my fellow University of Washington Ergonomics Laboratory
colleagues—Fangfang Wang, MS, Bronson Du, MS, and Maggie Hughes, MS. Thanks,
too, to Boris Reiss. Bronson and Fangfang collected the study data; and Fangfang
conducted much of the initial data analysis and helped me create the summary
exposure measures for the data analysis used in my thesis. Maggie helped me learn
JMP, and both Maggie and Boris devoted more time than they could afford to help
transform my research vision into reality.
I also wish to thank other faculty members from the Department of Environmental and
Occupational Health Sciences, including Debra Cherry, MD, MS; Joel Kaufman, MD,
MPH; and June Spector, MD, MPH.

7
Dedication
I dedicate this work to my family, including my wife, Amie; my daughter, Katie; my
son, Brady; my parents, Jim and Ev; and my in-laws, Rob and Marcia. Without their
love, support, and sacrifice, I could not have completed this thesis.
My home office.
I also dedicate this work to the truck drivers of North America, whose own work goes
largely unnoticed.

8
Table of Contents
List of Figures ............................................................................................................................. 9
List of Tables ..............................................................................................................................10
Introduction ...............................................................................................................................11
Specific Aims .............................................................................................................................18
Methods .....................................................................................................................................20
Results ........................................................................................................................................28
Discussion ..................................................................................................................................38
Conclusions................................................................................................................................43
References ..................................................................................................................................45
Appendix A ...............................................................................................................................56
Appendix B ................................................................................................................................58

9
List of Figures
Figure 1 – The Ballistic Air-Filled Seat Pad....................................................................................5
Figure 2 – Diagram of the Ballistic Air-Filled Seat Pad..............................................................17
Figure 3 – Ballistic Air-Filled Seat Pad vs. Stock Foam Seat .....................................................18
Figure 4 – The Semi-Truck Model.................................................................................................22
Figure 5 – Tri-Axial Seat Pad Accelerometer...............................................................................22
Figure 6 – The Basicentric Model...................................................................................................23
Figure 7 – The Standardized Route...............................................................................................25
Figure 8 – Overall A(8) ...................................................................................................................29
Figure 9 – Overall VDV(8) .............................................................................................................30
Figure 10 –A(8) by Route Segment................................................................................................31
Figure 11 – VDV(8) by Route Segment.........................................................................................32
Figure 12 – A(8) by Road Condition.............................................................................................36
Figure 13 – VDV(8) by Road Condition.......................................................................................37
Figure 14 – A Cab-Forward Bus ...................................................................................................41
Figure 15 – Truck Cab Location Relative to Buses’....................................................................41
Figure 16 – Power Spectral Density in Trucks............................................................................42
Figure 17 – Power Spectral Density in Buses..............................................................................42

10
List of Tables
Table 1 – Whole-Body Vibration Measures..................................................................................13
Table 2 - Daily Exposure Action and Limit Values..............................................................15
Table 3 – WBV and Subjective Comfort........................................................................................15
Table 4 – The Study Participants....................................................................................................21
Table 5 - Wilcoxon Signed Rank Test: A(8) Floor-Seat..............................................................33
Table 6 - Wilcoxon Signed Rank Test: A(8) Seat-Seat Pad........................................................34
Table 7 - Wilcoxon Signed Rank Test: VDV(8) Floor-Seat........................................................34
Table 8 – Wilcoxon Signed Rank Test: VDV(8) Seat-Seat Pad..................................................35
Table 9 – Wilcoxon Signed Rank Test: A(8) and VDV(8) On-Road – Off-Road.....................38

11
Introduction
Low back pain is the most common musculoskeletal complaint affecting the labor force.
37% of all workers’ low back pain has been attributed to occupational exposures (27, 41,
45). Twenty percent of workers’ compensation claims and up to 45% of compensation
costs are due to work-related back injuries (3, 4, 50). While lost work days and lost
work productivity add to the costs to employers, the financial impact of lost wages
upon the individual worker can be particularly severe.
The mental and physical toll on the worker is substantial, as well. Low back pain
symptoms include chronic pain, radiation of pain distally, lower extremity numbness
and tingling, distracted driving, disrupted sleep, and even depression. Clinical signs
include localized tenderness to palpation and loss of touch sensation in the lower
extremities. Imaging studies may reveal degenerative changes of the lumbar spine, but
pain may be present in the absence of degenerative changes (53).
The high prevalence of low back pain—about 60%—in drivers of commercial motor
vehicles, is well-documented (4, 5, 19, 26, 30, 31, 34, 42, 43, 46, 47). Commercial vehicle
operators change jobs and some leave the occupation altogether, often for medical

12
reasons, so the extent of the problem may be underestimated, a phenomenon known as
the healthy worker effect.
Whole-body vibration (WBV) has been shown to be an important risk factor for low
back pain, independent of other risk factors (15,16, 39, 42-44). Vertical moments
associated with driving, from jarring bumps, large potholes, and off-road conditions,
appear to impact the spine the most, in a dose-response pattern (55,56).
Provided sufficient time and intensity, WBV’s cumulative impact upon the lumbar
spine is analogous to sound waves breaking a wine glass. Just as sound waves can
stress the glass to its breaking point, WBV can stress the lumbar spine, due to the
phenomenon of resonance. Lumbar vertebrae are compressed, intervertebral discs
bulge, protrude, herniate, or rupture, and the associated dorsal roots of the spinal
nerves are pinched in what can often be a painful, debilitating cascade of events.
Though regulatory standards for WBV have been proposed, they are not currently
enforced here in the United States. The European Union, however, has codified (EU
2002/44/EC) a standard to protect its labor force, ISO 2631-1 (1997). It utilizes an

13
orthogonal coordinate system, depicted in a seated operator, including the x-axis (fore-
and-aft), y-axis (side-to-side), and z-axis (up-and-down).
Accelerometers measure tri-axial vibration in meters per second squared (m/s2). By
convention, values are often expressed in terms of root-mean-square (r.m.s), vice peak
acceleration. WBV measures, associated units, reference standard, and equations are
provided below (see Table 1). A(8) is a continuous, cumulative measure of vibration
time-weighted over eight hours. VDV(8) is a continuous, cumulative measure of
vibration time-weighted over eight hours, as well. However, because it weighs
impulse, or transient shock, acceleration more heavily, it is thought to more accurately
depict the full extent of vibration exposure (38).
Table 1. Whole-Body Vibration Measures, Reference Standards, and Equations
Description Unit Standard Equation
Root mean square of the
instantaneous frequency-
weighted acceleration.
m/s2 ISO 2631-1 2
1
0
2 )(1
T
ww dttaT
A
8-h equivalent acceleration m/s2 ISO 2631-1 A(8)=Aw*(480/T)1/2
Cumulative impulsive vibration
exposure
m/s1.75 ISO 2631-5
4
1
0
4)(
T
w dttaVDV

14
Where:
aw(t) = the weighted acceleration as a function of time measured in m/s2
T = the duration of the measurement in seconds (37,38)
VDV is the vibration dose value in m/s1.75
a(t) is the frequency weighted acceleration in m/s2
T is the total measurement period in seconds (38)
Over time, the adverse health effects from vibration exposure involving multiple shocks
to the lumbar spine predominate. To better protect workers, International Organization
for Standardization (ISO) 2631-5 (2004) addresses these concerns. This update to the
previous standard uses a biomechanical model to describe a linear relationship between
peak acceleration and spinal compression due to transient shocks. The lumbar spine
was found to be more susceptible to single shocks than continuous vibration (58).
Associated action values, requiring action to reduce the worker’s exposure, and limit
values, requiring removal of the worker from the exposure altogether in order to reduce
the risk of moderate to severe adverse health effects, are provided in Table 2 (37,38):

15
Table 2. European Union Daily Exposure Action and Limit Values
For a qualitative perspective of what WBV exposures approaching or exceeding these
action and limit values might mean to drivers, subjective assessments attributed to
typical WBV ranges are provided in Table 3 below (37). Based upon this table, it is
apparent that vibration levels exceeding the European Union daily vibration action
value are associated with at least “fairly uncomfortable” levels of comfort. On a long-
term basis, such levels pose serious risk of moderate to severe adverse health effects to
truck drivers, including debilitating low back pain.
Table 3. Whole-Body Vibration Ranges and Associated Levels of Comfort

16
Due to the sheer number of commercial motor vehicle operators, the high prevalence of
low back pain, and its associated high costs, a number of interventions have attempted
to reduce exposures to WBV, with mixed results. A new intervention to be evaluated is
an air-filled ballistic seat pad designed to reduce WBV exposure (Figure 1). It presents
the possibility of a cheaper alternative to the high cost of active air-suspension seats,
particularly if it effectively attenuates truck drivers’ exposure to WBV. However, the
effectiveness of the seat pad in semi-trucks has not yet been established. This study
investigated the effectiveness of the seat pad by measuring both steady state, A(8), and
transient shock or impulse vibrations, VDV(8).
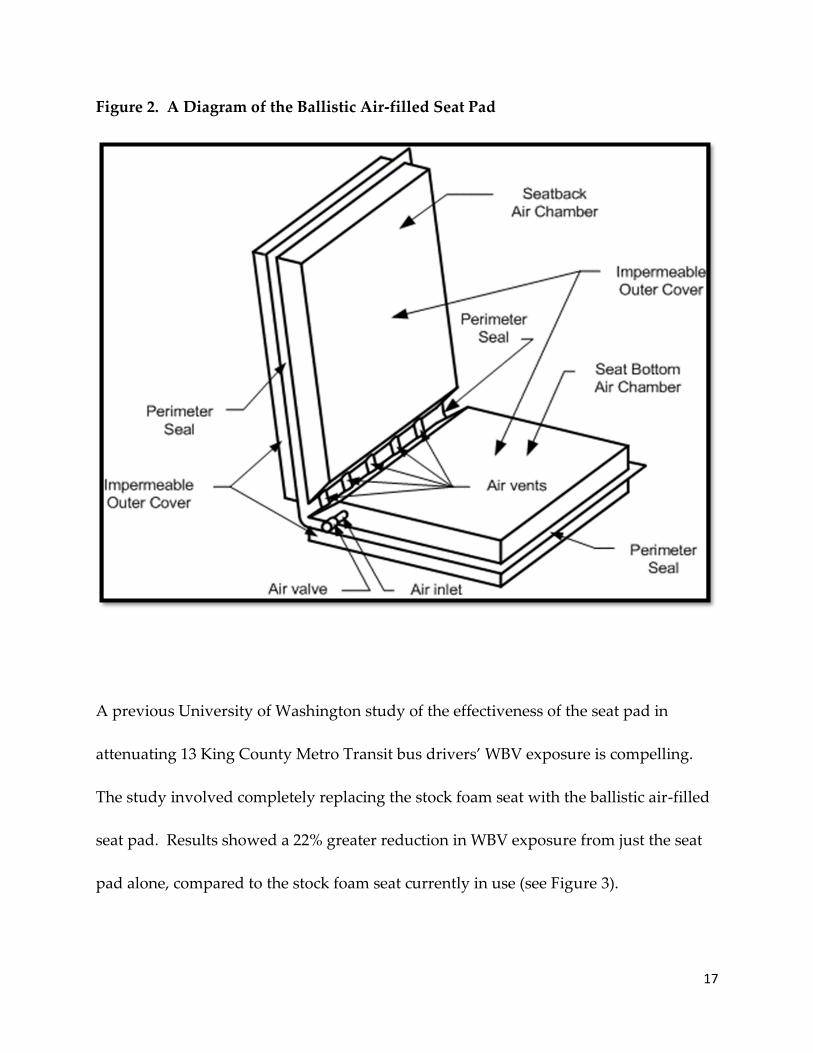
The device is engineered to diminish the energy directly impacting the user’s lumbar
spine. The seat pad redirects vertical moments associated with WBV horizontally, away
from the lumbar spine. The transformed horizontal moments propel air through five
vents between the seat cushion and the seat back (see Figure 2).
17
Figure 2. A Diagram of the Ballistic Air-filled Seat Pad
A previous University of Washington study of the effectiveness of the seat pad in
attenuating 13 King County Metro Transit bus drivers’ WBV exposure is compelling.
The study involved completely replacing the stock foam seat with the ballistic air-filled
seat pad. Results showed a 22% greater reduction in WBV exposure from just the seat
pad alone, compared to the stock foam seat currently in use (see Figure 3).

18
Figure 3. Vibration Transmitted from Bus Floor to Driver’s Seat
Note: The stock foam cushion attenuates only 11% of the vibration exposure, while the ballistic
air-filled seat pad (with the foam seat cushion removed) attenuates 33% of the vibration
exposure.
The current study evaluates professional semi-truck drivers’ WBV exposure on
different road conditions, including freeways, highways, city streets, and off-road.
Specific Aims
19
1. To measure, characterize, and analyze WBV exposures over a standardized
route; WBV exposures will be collected in series, on the truck floor, on the stock
air-suspension seat, and on the ballistic air-filled seat pad placed on top of the
air-suspension seat, used by nine semi-truck drivers. WBV exposures will be
collected in accordance with ISO 2631-1 (1997) and ISO 2631-5 (2004), which use
time-weighted average A(8) and continuous impulse vibration exposure VDV(8),
respectively.
2. To compare the median WBV exposures with box and whisker plots and
Wilcoxon signed rank tests to determine if there are significant differences
amongst the three exposures to determine the effectiveness of the ballistic air-
filled seat pad.
The current study measured truck drivers’ exposure to WBV and determined whether
there were differences between the WBV exposures measured at the seat top of an
industry standard air-suspension seat and on the ballistic air-filled seat pad set on top
of the air-suspension seat as an additional layer to further attenuate the driver’s
exposures to WBV. It was hypothesized that the seat pad would significantly reduce
the truck drivers’ exposures to WBV relative to the WBV measures at the top of the
stock air-suspension seat. Ultimately, if the ballistic seat pad was found to reduce WBV

20
exposure, it could potentially decrease the incidence, prevalence, and severity of semi-
truck drivers’ low back pain. Drivers could potentially drive for longer periods of time
with less discomfort. Cost-savings from a cheaper alternative to active air-suspension
seats—let alone from decreases in medical and surgical treatment costs, workers’
compensation, lost work days, and lost work productivity—could be substantial.
Methods
The study compared repeated measures of WBV exposure in nine professional semi-
truck drivers. The study was approved by the University of Washington’s Human
Subjects Committee, and informed consent was obtained. The range of ages of the
drivers was 42 to 64, with a mean of 54. Their mean weight was 213 lbs., with a
standard deviation of 58 lbs. Associated demographic data are provided in Table 4.

21
Table 4. Demographics of Study Participants
Subject Age Height (cm) Weight (lb) BMI
S02 53 170 190 29.8
S04 44 178 220 31.6
S05 55 163 160 27.5
S06 56 178 160 23.0
S07 64 165 175 29.1
S10 53 193 350 42.6
S11 56 180 220 30.7
S12 42 183 225 30.5
S15 63 180 220 30.7
Median (IQR)
55 (11)
178 (14)
220 (55)
30.5 (2.85)
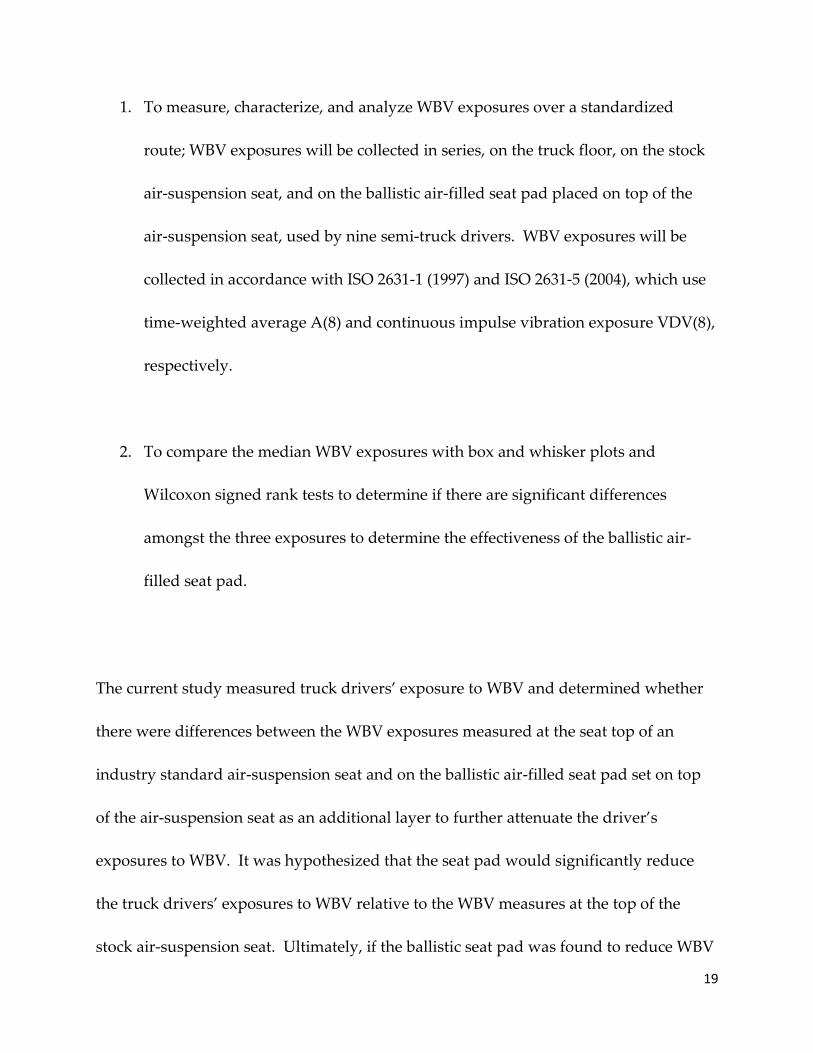
In a 72,000 kg nine-axle truck (Model 4500-2014; Western Star; City, State) (see Figure 4),
WBV measurements were collected on the floor, on the drivers’ existing air-suspension
seat, and on the seat pad, which sat on top of their seat. The same stock air-suspension
seat was used by all nine drivers.
22
Figure 4. Western Star Model 4500 (2014), the Semi-Truck Model Used in the Study
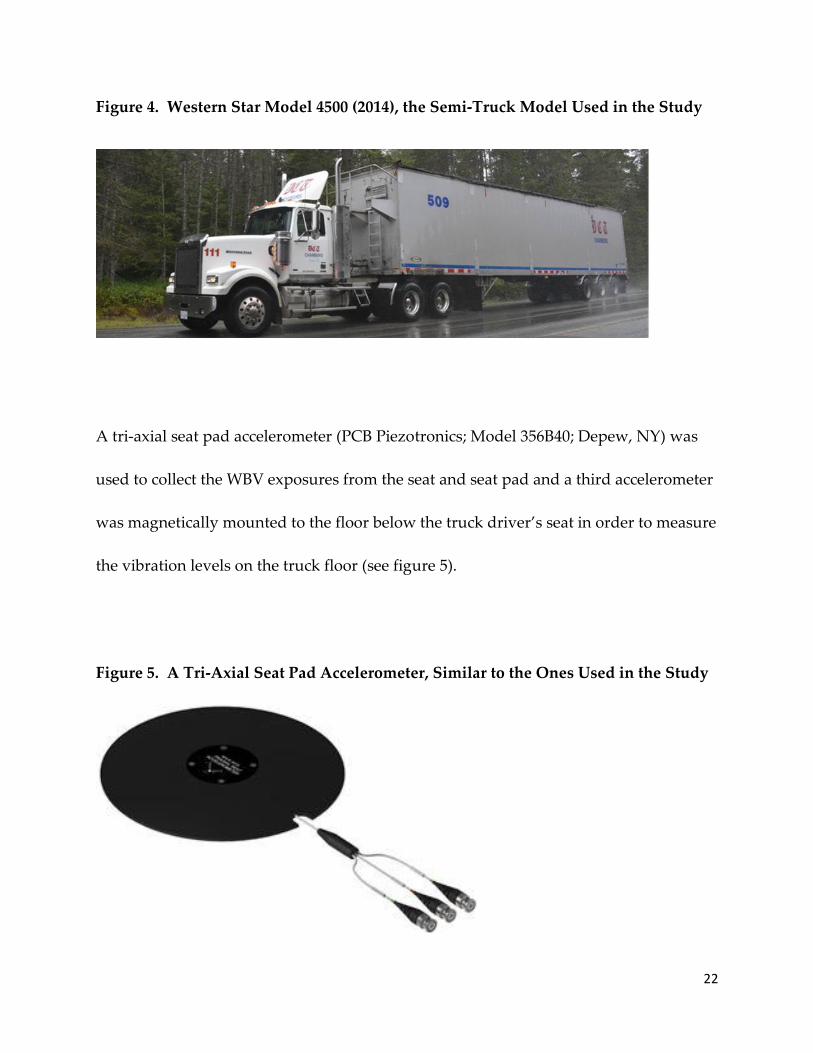
A tri-axial seat pad accelerometer (PCB Piezotronics; Model 356B40; Depew, NY) was
used to collect the WBV exposures from the seat and seat pad and a third accelerometer
was magnetically mounted to the floor below the truck driver’s seat in order to measure
the vibration levels on the truck floor (see figure 5).
Figure 5. A Tri-Axial Seat Pad Accelerometer, Similar to the Ones Used in the Study

23
Rion-20 and Rion-40 series vibration monitors collected tri-axial (x-direction, or fore-aft;
y-direction, or side to side; and z-direction, or up and down) WBV simultaneously (see
Figure 6 and Appendix B).
By convention, according to the International Standards Organization (ISO) 2631-1
Whole Body Vibration standard (37), the highest value of the three directions was used
to characterize the exposure, as was the vector sum (Σxyz) to characterize total
exposure. The WBV exposure data was collected at 1280 Hz per channel and all data
analyses were performed in accordance with International Standards Organization
2631-1 (1997) and ISO-2631-5 (2004) (see Appendix B).
Figure 6. A Basicentric Seated Model Depicting the Three Axes
Note: Axes include the x-direction, or fore-aft; y-direction, or side to side; and z-direction, or up
and down.

24
In addition, a GPS unit recorded the truck’s progress along the route at one-second
intervals. Subsequently, the WBV exposure data and GPS data were combined which
allowed the WBV exposures data to be analyzed by the various road segments
traversed by the trucks.
The subjects drove the same truck on the same standardized route which was used to
pick up aggregate materials from mines and deliver the materials to a port in the city of
Vancouver, British Columbia. The round-trip originated in Chilliwack, British
Columbia, proceeded east to the mines where the trucks were loaded with aggregate,
and then west to the Port of Vancouver where the aggregate material was unloaded,
and then returned east to the terminal in Chilliwack (see Figure 7). The route included
two lane freeways, single lane highways, city streets in the port and an unpaved road in
and out of the mine. The trucks had no loads when driving to the mine and when
returning from the port to the truck terminal in Chilliwack, and were loaded when
driving from the mine to the port. It took the truck drivers roughly eleven hours to
circumnavigate the whole 800-km route.

25
Figure 7. The Standardized Route Used in the Study
Note: The round-trip originated in Chilliwack, British Columbia, and proceeded east to the
Copper Mountain mines where the semi-trucks were loaded with aggregate. The trucks then
drove west to the Port of Vancouver where the aggregate material was unloaded. The trucks
then returned to the terminal in Chilliwack.
The three accelerometers were calibrated prior to the data collection with an exciter
(Bruel & Kjaer; Type 4294) with 10 m/s2 r.m.s.; oscillation frequency was 159.2 Hz. WBV
exposures collected in accordance with ISO 2631-1 and ISO 2631-5 included:
(i) Weighted root mean square (r.m.s.) average vibration (Aw) normalized to
an 8-hour work day, A(8), in m/s2

26
(ii) Vibration Dose Value normalized to an 8-hour work day, VDV(8), in
m/s1.75
LabVIEW (National Instruments; v2014; Austin, TX) software was used to verify the
calibration.
WBV values were measured for each route segment. Data was collected using a four-
channel recorder (Rion Co., LTD; Model DA-20 and DA-40; Tokyo, Japan) (see
Appendix B). Raw tri-axial accelerations were collected at 1280 Hz per channel by seat
pad ICP accelerometers (PCB Piezotronics; Model 356B40; Depew, NY) mounted on the
driver’s seat and on top of the ballistic air-filled seat pad. A third accelerometer was
installed magnetically on the floor beneath the driver’s seat. Data was stored on a
memory card (San Disk; Extreme III; Milpitas, CA). GPS data was collected at one-
second intervals (Global Sat; Model DG-100; Chino, CA), allowing for speed and
location information to be matched with vibration data.
LabVIEW post-processing software was used to synchronize the data collection. A
program with graphical interface calculated ISO 2631-1 and ISO 2631-5 values, with

27
output into Microsoft Excel. Error checks used a mean of 1 m/s2, standard deviation of 3
m/s2, and a peak of 40 m/s2.
JMP (v12; SAS Institute; Cacy, SC) was used to conduct the statistical analysis. To
determine if there were differences in WBV exposure between the floor and the seat,
and the seat and the ballistic air-filled seat pad, Wilcoxon signed rank tests were
performed. These tests produced p-values. The significance level used was a p-value of
not higher than 0.05; p-values above 0.05 indicate no difference in WBV exposure was
observed. Medians and interquartile ranges of measured WBV exposure values were
compared, as well, in box and whisker plots.
Wilcoxon signed rank tests are non-parametric. With the notable exception of an
assumption of symmetry, few assumptions are made, and no assumption is made with
regard to normality, in particular. It is a robust method, not unduly affected by outliers
(62). It is intended to compare at least eight matched samples. This corroborates an
analysis that was performed to ensure adequate power; results are provided in
Appendix A.
28
As a paired-difference test between measures, Wilcoxon signed rank tests are well-
suited to compare the WBV exposures measured at the top of the nine drivers’ existing
air-suspension seat relative to the WBV exposures measured at the ballistic air-filled
seat pad which sat on top of the driver’s seat. In addition, to determine the
effectiveness of the seat itself in attenuating vibration exposure, WBV exposure
measured at the top of the seat were compared to the vibration levels collected from the
truck’s floor.
Results
Over the full route, truck drivers' vibration exposures were above European Union
daily vibration action values and the air-filled ballistic seat pad did not significantly
reduce those exposures. Overall A(8) and VDV(8) exposures are summarized in Figure
8 and Figure 9, respectively. These two figures are the first of many indications from
this study that neither the stock air-suspension seat nor the ballistic air-filled seat pad
were effective in reducing drivers’ WBV exposure.

29
Figure 8. Overall Comparison of the WBV Exposures from a Ballistic Air-Filled Seat
Pad and a Conventional Air-Suspension Seat: Z-Axis Daily Average Continuous
Vibration—A(8)
Note: Box and whisker plots compare the z-axis average daily-weighted vibration between the
seat pad and the top of air-suspension seat. The dashed lines show the daily vibration action
value (0.5 m/s2). European Union daily vibration action values were exceeded.

30
Figure 9. Overall Comparison of the WBV Exposures from a Ballistic Air-Filled Seat
Pad and a Conventional Air-Suspension Seat: Z-Axis Daily Average Continuous
Impulsive Vibration—VDV(8)
Note: Box and whisker plots below compare the z-axis average daily-weighted vibration
between the seat pad and the top of air-suspension seat. The dashed lines show the daily
vibration action value (9 m/s1.75). European Union daily vibration action values were exceeded.
Additional data analyses were performed to determine whether there were differences
between the seat and seat pad WBV exposure across different segments of the route.
Associated graphs of A(8) and VDV(8) are presented in Figures 10 and 11, below.

31
Figure 10. Comparison of the WBV Exposures from a Ballistic Air-Filled Seat Pad
and a Conventional Air-Suspension Seat by Route Segment: Z-Axis Daily Average
Continuous Vibration—A(8)
Note: Box and whisker plots below compare the z-axis average daily-weighted vibration
between the seat pad and the top of air-suspension seat. The dashed lines show the daily
vibration action value (0.5 m/s2). With the exception of the Copper Mountain (CM), British
Columbia, route segment, European Union daily vibration action values were exceeded. Other
route segments in British Columbia listed are: Chilliwack to Hope; Chilliwack to the Port of
Vancouver; Copper Mountain Mine; Highway 3; Hope to Chilliwack; the Port of Vancouver;
and the Port of Vancouver to Chilliwack.
Daily Vibration
Action Value
A(8
) m
/s2

32
Figure 11. Comparison of the WBV Exposures from a Ballistic Air-Filled Seat Pad
and a Conventional Air-Suspension Seat by Route Segment: Z-Axis Daily Average
Continuous Impulsive Vibration—VDV(8)
Note: Box and whisker plots compare the z-axis average daily-weighted vibration between the
seat pad and the top of air-suspension seat. The dashed lines show the daily vibration action
value (9 m/s1.75). The European Union daily vibration action value was exceeded here, as well.
Route segments in British Columbia listed are: Chilliwack to Hope; Chilliwack to the Port of
Vancouver; Copper Mountain (CM); Copper Mountain Mine; Highway 3; Hope to Chilliwack;
the Port of Vancouver; and the Port of Vancouver to Chilliwack.
With respect to different route segments, as depicted in Figure 10 and Figure 11, the
truck drivers' vibration exposures were above European Union daily vibration action

33
values. The only exception was the A(8) exposure on the Copper Mountain route
segment (see Figure 10 above). The seat pad did not significantly reduce WBV
exposures. Note, too, that the highest WBV exposures were associated with the off-road
segment leading into and out of the Copper Mountain Mine.
Wilcoxon signed rank tests confirmed the findings (see Tables 5-8).
Table 5. A(8) Floor-Seat Matched Pairs Difference: Median (IQR) and p-Values

34
Table 6. A(8) Seat-Seat Pad Matched Pairs Difference: Median (IQR) and p-Values
In Table 5, regardless of road condition, there were no significant A(8) Floor-Seat p-
values. In Table 6, regardless of road condition, there were no significant A(8) Seat-Seat
Pad p-values. In Table 7, with respect to road condition, the only significant VDV(8)
Floor-Seat p-value was from the freeway from Chilliwack to Port of Vancouver.
Table 7. VDV(8) Floor-Seat Matched Pairs Difference: Median (IQR) and p-Values

35
Table 8. VDV(8) Seat-Seat Pad Matched Pairs Difference: Median (IQR) and p-
Values
In Table 8, regardless of road condition, there were no significant VDV(8) Seat-Seat Pad
p-Values.
With virtually every road condition and route segment, there were no significant p-
values, i.e., there was no difference in WBV exposure measured at the existing seat and
at the ballistic seat pad. In other words, the seat pad did not significantly attenuate
WBV exposure. Interestingly, there was only one significant difference in WBV
exposures measured at the floor and the existing seat, (see Table 7). In other words, the
seat itself did not effectively attenuate WBV from the floor.

36
Figure 12. Comparison of the WBV Exposures by Off-Road Segment (Copper
Mountain Mine) and On-Road Segment (Port): Z-Axis Daily Average Continuous
Vibration—A(8)
37
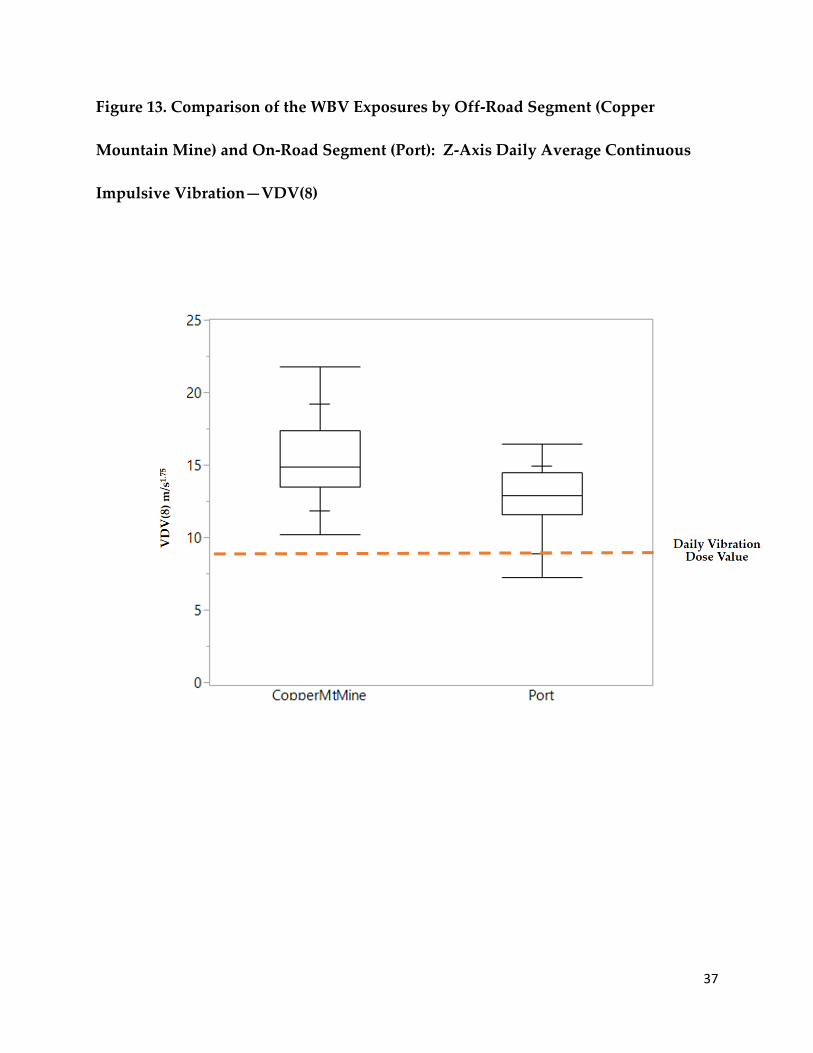
Figure 13. Comparison of the WBV Exposures by Off-Road Segment (Copper
Mountain Mine) and On-Road Segment (Port): Z-Axis Daily Average Continuous
Impulsive Vibration—VDV(8)

38
Table 9. A(8) and VDV(8) On-Road and Off-Road Matched Pairs Difference: Median
(IQR) and p-Values
On-Road Off-Road P-value
A(8) m/s2 0.58
(0.54-0.62)
0.79
(0.75-0.83)
<0.0001
VDV(8) m/s1.75 12.58
(11.88-13.28)
15.39 (14.69-16.09)
<0.0004
Note: This comparison of road conditions only, with the truck loaded with aggregate and
driven at similar speeds, indicates a significant difference in WBV exposure, as one might
expect.
With respect to on-road and off-road conditions, the truck drivers' vibration exposures
were above European Union daily vibration action values and the seat pad did not
significantly reduce WBV exposures (see Table 9 and Figure 12 and Figure 13).
Discussion
The same truck was used for each of the nine professional drivers. Each driver drove it
at comparable speeds on each individual route segment, including freeways, highways,
city streets, and off-roads. Each driver’s WBV exposure was measured in series—at the
floor, at the stock air-suspension seat, and at the ballistic air-filled seat pad. This is
similar to a previous University of Washington study that involved just 13 bus drivers.

39
On a route of approximately 800 km and a duration of eleven hours, tens of thousands
of matched observations were collected, at one-second intervals.
A power analysis of this study was performed, which suggested that as few as eight
drivers may be needed. This observation is corroborated by other similar studies (60)
with even fewer study participants. Wilcoxon signed rank tests are well-suited to
matched pairs analysis with a sample size of at least eight, as well. It is a non-
parametric, robust test, that is not unduly affected by outliers. Though the risk of
making a Type II error exists, it is no more likely than any other small, negative study
making the same assumptions with regard to significance level.
The fact that the ballistic air-filled seat pad—as well as the seat itself—did not
significantly reduce WBV exposure was surprising, based upon previous studies
involving use of the seat pad in buses. The question of whether the seat pad may
significantly reduce the incidence, prevalence, or severity of low back pain in semi-
truck drivers remains, but it appears unlikely that the seat pad can do so based upon
the WBV exposures observed in this study. WBV exposures exceeding the daily
vibration action value put truck drivers at moderate to severe risk of developing
adverse health outcomes, and the seat pad did little to diminish them.

40
Due to the surprising ineffectiveness of the stock air-suspension seat, it deserves closer
inspection. Questions arise with regard to whether there is something about that
particular seat that made it ineffective with regard to attenuating drivers’ WBV
exposure, or whether it is part of a bigger systemic problem associated with all seats of
the same type.
In light of the seat and the seat pad’s ineffectiveness, there is an opportunity here for
administrative controls to make a difference with regard to reducing the truck drivers’
WBV exposure. One example would be to change drivers in Chilliwack, reducing the
time each driver spends in the truck by approximately half.
The answer to why the seat pad was not effective may lie in a future analysis of power
spectral densities. Power spectral densities are measures of vibration intensity across a
frequency spectrum. With regard to drivers’ exposure to WBV, buses and trucks are
not created equal. The first indication is the location of the operator’s cab relative to the
front axle (see Figure 14 and Figure 15). There is another key difference that is
inherently related to cab position. Buses produce more high frequency energy to which
the driver is exposed, where the air-filled seat pad was effective. Trucks produce less

41
high frequency energy to which the driver is exposed, which may diminish the air-filled
seat pad’s relative effectiveness (note the relative intensities of the power spikes at 10
Hz in Figure 16 and Figure 17).
Figure 14. A Cab-Forward Bus
Note: The bus driver’s cab is located in front of the front axle, increasing high frequency
energy.
Figure 15. The Truck Model Used in the Study
Note: The truck’s cab is located behind the front axle, reducing high frequency energy.

42
Figure 16.
Figure 17.
Note: Vibration energy is extremely high at 10 Hz in this bus power spectral density graph, in
contrast to the previous graph of truck power spectral density.
43
Based upon these observations, the ballistic, air-filled seat pad may be better suited to
buses, and perhaps to smaller cab-forward construction vehicles. It is an intriguing
possibility that will likely be investigated in follow-up studies.
Limitations: A small number of drivers volunteered to participate in the study, due to
time and financial constraints. Demographic data presented in Table 4 was self-
reported, permitting reporting and recall bias, likely leading to some inaccuracy. Truck
availability was an issue, as well. The truck involved in the study was a maintenance
back-up. It was subject to recall to replace other trucks which would break down
frequently, due to the strenuous nature of hauling heavy loads of copper ore long
distances up and down steep mountain passes. The impact of these limitations was
minimized by reliance upon objective measures of WBV exposure and appropriate
statistical analyses, which were corroborated by a power analysis.
Conclusions
With regard to WBV exposure, there was only one significant difference in effect
between the floor and the truck’s air-suspension seat, and no significant difference in
effect between the truck’s air-suspension seat and the air-filled ballistic seat pad.
Reduction of WBV exposure in a cost-effective manner remains an elusive goal. Air-

44
suspension seats are expensive, and based on this study, not always effective; the seat
pad is a cheaper alternative, but it was not effective, either.
This intervention’s long-term goal is to reduce commercial motor vehicle drivers’
disability and pain. Surprisingly, this study did not demonstrate a significant reduction
of WBV exposure in semi-truck drivers, as had been demonstrated previously in a
study of bus drivers. An explanation for this disparity in exposures between drivers of
semi-trucks and buses, may lie in a future analysis of associated power spectral
densities (61).

45
References:
1. ACGIH. Whole-Body Vibration. 2001.
2. Ahuja, Shaman, Davis, Jerry and Wade, Lloyd. Postural Stability of Commercial
Truck Drivers: Impact of Extended Durations of Whole-Body Vibration.
3. Andersson, G.B.J., Epidemiological features of chronic low-back pain. Lancet, 1999.
354(9178): p. 581-585.
4. Anderson, R., The Back Pain of Bus Drivers: Prevalence in an Urban Area of
California. Spine, 1992. 17(12): p. 1481-1488.
5. Bernard, B.P. and V. Putz-Anderson, Musculoskeletal disorders and workplace
factors: a critical review of epidemiologic evidence for work-related musculoskeletal
disorders of the neck, upper extremity, and low back. DHHS (NIOSH) publication, ed.
N.I.f.O.S.a. Health. 1997, Cincinnati, OH: U.S. Dept. of Health and Human Services,
Public Health Service, Centers for Disease Control and Prevention National Institute for
Occupational Safety and Health. 1 v. (various pagings).
6. Bliithner, Ralph, Hinz, Barbara, Menzel, Gerhard and Seidel, Helmut. Back muscle
response to transient whole-body vibration. International Journal of Industrial
Ergonomics, 12 (1993) 49-59 49 Elsevier.

46
7. Blood, Ryan P., Dennerlein, Jack, Lewis, Charlotte, Rynell, Patrik and Johnson, Peter
W. Evaluating whole-body vibration reduction by comparison of active and passive
suspension seats in semi-trucks. PROCEEDINGS of the HUMAN FACTORS and
ERGONOMICS SOCIETY 55th ANNUAL MEETING - 2011 1750.
8. Thamsuwan, Ornwipa, Blood, Ryan P., Ching, Randal P., Boyle, Linda and Johnson,
Peter W. Whole body vibration exposures in bus drivers: A comparison between a
high-floor coach and a low-floor city bus. International Journal of Industrial
Ergonomics 43 (2013) 9-17.
9. Blood, Ryan P., Yost, Michael G., Camp, Janice E. and Ching, Randal P. (2015):
Whole-body vibration exposure intervention among professional bus and truck drivers:
A laboratory evaluation of seat-suspension designs, Journal of Occupational and
Environmental Hygiene, DOI: 10.1080/15459624.2014.989357.
10. Blood, Ryan P. Improving Ergonomic Interventions to Reduce Whole-Body
Vibration Exposures among Professional Drivers. A dissertation submitted in partial
fulfillment of the requirements for the degree of Doctor of Philosophy. University of
Washington 2013.
11. Blood, Ryan P. and Johnson, Peter W. Quantifying whole body vibration exposures
in metropolitan bus drivers: an evaluation of three seats. Noise Notes. Volume 61,
Number 1, (2012) 61-70.
47
12. Blood, Ryan P., Ploger, James D. and Johnson, Peter W. (2010) 'Whole body
vibration exposures in forklift operators: comparison of a mechanical and air
suspension seat', Ergonomics, 53: 11, 1385 — 1394.
13. Blood, Ryan P., Rynell, Patrik W. and Johnson, Peter W. (2011) 'Vehicle Design
Influences Whole Body Vibration Exposures: Effect of the Location of the Front Axle
Relative to the Cab', Journal of Occupational and Environmental Hygiene, 8: 6, 364 —
374, First published on: 25 May 2011 (iFirst)
14. Blood, Ryan P., Rynell, Patrik W. and Johnson, Peter W. (2012) Whole-body
vibration in heavy equipment operators of a front-end loader: Role of task exposure
and tire configuration with and without traction chains. Journal of Safety Research 43:
357-364.
15. Bovenzi, Massimo. A Longitudinal Study of Low Back Pain and Daily Vibration
Exposure in Professional Drivers. Industrial Health 2010, 48, 584–595.
Bovenzi, Massimo. Low Back Pain Disorders and Exposure to Whole-Body Vibration in
the Workplace.
16. Bovenzi, Massimo. Metrics of whole-body vibration and exposure–response
relationship for low back pain in professional drivers: a prospective cohort study. Int
Arch Occup Environ Health (2009) 82:893–917 DOI 10.1007/s00420-008-0376-3.

48
17. Bovenzi, Massimo and Betta, Alberto. Low-back disorders in agricultural tractor
drivers exposed to whole- body vibration and postural stress. Applied Ergonomics
1994 25(4) 231-241.
18. Bovenzi, M. and Hulshof, C. T. J. An updated review of epidemiologic studies on
the relationship between exposure to whole-body vibration and low back pain (1986-
1997). Int Arch Occup Environ Health (1999) 72: 351-365.
19. Bovenzi, M., I. Pinto, and N. Stacchini, Low back pain in port machinery operators.
Journal of Sound and Vibration, 2002. 253(1): p. 3-20.
20. Bovenzi, Massimo, Rui, Francesca, Negro, Corrado, D’Agostin, Flavia, Angotzi,
Giuliano, Bianchi, Sandra, Bramanti, Lucia, Festa, GianLuca, Gatti, Silvana, Pinto, Iole,
Rondina, Livia and Stacchini, Nicola. An epidemiological study of low back pain in
professional drivers. Journal of Sound and Vibration 298 (2006) 514-539.
21. Bovenzi, Massimo, Schust, Marianne, Menzel, Gerhard, Hofmann Jörg and Hinz,
Barbara (2014): A cohort study of sciatic pain and measures of internal spinal load in
professional drivers, Ergonomics, DOI: 10.1080/00140139.2014.943302.
22. Burström, Lage, Nilsson, Tohr and Wahlström, Jens. Whole‑body vibration and the
risk of low back pain and sciatica: a systematic review and meta‑analysis. Int Arch
Occup Environ Health DOI 10.1007/ s00420-014-0971-4.

49
23. Burton, A.K. and Sandover, J. Back pain in Grand Prix drivers: a 'found'
experiment. Applied Ergonormcs 1987, 18.1, 3-8.
24. Cann, Adam P., Salmoni, Alan W. and Eger, Tammy R. (2004) Predictors of
wholebody vibration exposure experienced by highway transport truck operators,
Ergonomics, 47:13, 1432-1453.
25. Chambers, Keith. Whole Body Vibration and Low Back Pain Literature Review.
Workers’ Compensation Board of British Columbia. 2001.
26. 54. Chen, J.C., et al., Using "Exposure prediction rules" for exposure assessment −
An example on whole-body vibration in taxi drivers. Epidemiology, 2004. 15(3): p. 293-
299.
27. 16. Clays, E., et al., The impact of psychosocial factors on low back pain
−Longitudinal results from the Belstress study. Spine, 2007. 32(2): p. 262-268.
28. Costa, Nelson and Arezes, Pedro M. The influence of operator driving
characteristics in whole-body vibration exposure from electrical fork-lift trucks.
International Journal of Industrial Ergonomics 39 (2009) 34-38.
29. DIRECTIVE 2002/44/EC OF THE EUROPEAN PARLIAMENT AND OF THE
COUNCIL of 25 June 2002 on the minimum health and safety requirements regarding
the exposure of workers to the risks arising from physical agents (vibration) (sixteenth

50
individual Directive within the meaning of Article 16(1) of Directive 89/391/EEC).
Official Journal of the European Communities L 177/13-19 (2002).
30. Dahl, S., et al., Hospitalization for lifestyle related diseases in long haul drivers
compared with other truck drivers and the working population at large. Work-a Journal
of Prevention Assessment & Rehabilitation, 2009. 33(3): p. 345-353.
31. Du, C.L., et al., Cervical HIVD probably related to long-term repetitive shock and
neck flexion among dump-truck drivers. Journal of Occupational Health, 2006. 48(4): p.
273-275.
32. Eger, T., Stevenson, J., Boileau, P. -E., Salmoni, A. and VibRG. Predictions of health
risks associated with the operation of load-haul-dump mining vehicles: Part 1—
Analysis of whole-body vibration exposure using ISO 2631-1 and ISO-2631-5 standards.
International Journal of Industrial Ergonomics 38 (2008) 726-738.
33. Fu, Joshua S., Calcagno, James A., III, Davis, Wayne T. and Alvarez, Albert.
Evaluation of Noise Level, Whole-Body Vibration, and Air Quality Inside Cabs of
Heavy-Duty Diesel Vehicles Parked Engine Idling and On-Road Driving.
Transportation Research Record: Journal of the Transportation Research Board, No.
2194, Transportation Research Board of the National Academies, Washington, D.C.,
2010, pp. 29–36. DOI: 10.3141/2194-04.
51
34. Funakoshi, M., et al., Measurement of whole-body vibration in taxi drivers. Journal
of Occupational Health, 2004. 46(2): p. 119-124.
35. Google Images
36. Hoy, J., Mubarak, N., Nelson, S., Sweerts de Landas, M., Magnusson, M.,
Okunribido, O. and Pope, M. Whole body vibration and posture as risk factors for low
back pain among forklift truck drivers. Journal of Sound and Vibration 284 (2005) 933-
946.
37. IS0 2631-1. Mechanical vibration and shock – Evaluation of human exposure to
whole-body vibration –Part 1: General requirements. Second edition 1997-05-01.
38. ISO 2631-5. Mechanical vibration and shock — Evaluation of human exposure to
whole-body vibration — Part 5: Method for evaluation of vibration containing multiple
shocks. First edition 2004-02-15.
39. Kim, Jeong Ho, Aulck, Lovenoor, Hughes, Margaret, Zigman, Monica, Cavallari,
Jennifer, Dennerlein, Jack T. and Johnson, Peter W. Whole Body Vibration Exposures
in Long-haul Truck Drivers. Proceedings of the Human Factors and Ergonomics
Society 59th Annual Meeting (2015) 1274-1278.
40. Kumar, Shrawan. Vibration in operating heavy haul trucks in overburden mining.
Applied Ergonomics 35 (2004) 509-520.

52
41. Lahiri, S., P. Markkanen, and C. Levenstein, The cost effectiveness of occupational
health interventions: Preventing occupational back pain. American Journal of Industrial
Medicine, 2005. 48(6): p. 515-529.
42. McKinnon, C.D., J.P. Callaghan, and C.R. Dickerson, Field Quantification of
Physical Exposures of Police Officers in Vehicle Operation. International Journal of
Occupational Safety and Ergonomics, 2011. 17(1): p. 61-68.
43. Miyamoto, M., et al., Epidemiological study of low back pain and occupational risk
factors among taxi drivers. Industrial Health, 2008. 46(2): p. 112-117.
44. Paschold, Helmut W. Whole-Body Vibration: An emerging topic for the SH&E
profession. Occupational Hazards.
45. Plante, D., M. Rothwell, and H. Tufo, Managing the quality of care for low back
pain. 2nd ed. The Adult Spine: Principles and Practice. 1997, Philadelphia: Lippincotte-
Raven.
46. Raanaas, R.K. and D. Anderson, A questionnaire survey of Norwegian taxi drivers'
musculoskeletal health, and work-related risk factors. International Journal of Industrial
Ergonomics, 2008. 38(3-4): p. 280-290.
47. Schwarze, S., et al., Dose-response relationships between whole-body vibration and
lumbar disk disease − A field study on 388 drivers of different vehicles. Journal of
Sound and Vibration, 1998. 215(4): p. 613-628.
53
48. Smets, Martin P.H., Eger, Tammy R. and Grenier, Sylvain G. Whole-body vibration
experienced by haulage truck operators in surface mining operations: A comparison of
various analysis methods utilized in the prediction of health risks. Applied Ergonomics
41 (2010) 763-770.
49. Tiemessen, Ivo J., Hulshof, Carel T.J. and Frings-Dresen, Monique H.W. An
overview of strategies to reduce whole-body vibration exposure on drivers: A
systematic review. International Journal of Industrial Ergonomics 37 (2007) 245-256.
50. 29. Webster, B.S. and S.H. Snook, The Cost of 1989 Workers' Compensation Low
Back Claims. Spine, 1994. 19(10): p. 1111-1116.
51. Wikstrom, Bengt-Olov, Kjellberg, Anders and Landstrom, Ulf. Health effects of
long-term occupational exposure to whole-body vibration: A review. International
Journal of Industrial Ergonomics 14 (1994) 273-292.
52. Wolfgang, Rebecca and Burgess-Limerick, Robin. Whole-body vibration exposure
of haul truck drivers at a surface coal mine. Applied Ergonomics 45 (2014) 1700-1704.
53. Brinjikji, W., Luetmer, P.H., Comstock,B., Bresnahan, B.W., Chen, L.E., Deyo, R.A.,
Halabi, S. Turner, J.A., Avins, A.L. James, K. Wald, J.T. Kallmes, D.F., and Jarvik J.G.
Systematic Literature Review of Imaging Features of Spinal Degeneration in
Asymptomatic Populations. American Journal of Neuroradiology. 2015 Apr; 36(4): 811–
816.
54
54. http://clincalc.com/stats/samplesize.aspx
55. Krause N, Rugulies R, Ragland D R, and Syme S L. (2004) Physical workload,
ergonomic problems, and incidence of low back injury: A 7.5-year prospective study of
San Francisco transit operators. American Journal of Industrial Medicine 46, 570-585.
56. Tiemessen I J H, Hulshof C T J, and Frings-Dresen M H W. (2008) Low back pain in
drivers exposed to whole body vibration: analysis of a dose-response pattern.
Occupational and Environmental Medicine 65, 667-675.
57. Mayton AG, Jobes CC, Gallagher S. Assessment of whole-body vibration exposures
and influencing factors for quarry haul truck drivers and loader operators. International
journal of heavy vehicle systems. 2014;21(3):241-261. doi:10.1504/IJHVS.2014.066080.
58. Wilkstrom B O, Kjellberg A, and Landstrom U. (2004) Health effects of long-term
occupational exposure to whole-body vibration: a review. International Journal of
Industrial Ergonomics 14, 273-292.
59. Ismail A R, Nuawi M Z, Kamaruddin N F, and Bakar R A. (2010) Comparative
assessment of the whole-body vibration exposure under different car speed based on
Malaysian road profile. Journal of Applied Science 10(14), 1428-1434.
60. Smith, S. D., Bowden, D. R., and Jurcsisn, J.G. Multiaxis Seat Cushion
Transmissibility Characteristics. Proceedings of the 2nd American Conference on
Human Vibration. IC 9513 June 4-6, 2008.

55
61. Smith S.D., Jurcsisn J.G., Walker A.Y., Smith J.A., Bowden, D.R. Dynamic
characteristics and human perception of vibration aboard a military propeller aircraft.
Wright-Patterson Air Force Base, OH: Air Force Research Laboratory, Human
Effectiveness Directorate, Biosciences and Protection Division, Biomechanics Branch.
Report No. AFRL-HE-WP-TR 2007-0114. NTIS No. ADA473700. [2007].
62. Kim H-Y. Statistical notes for clinical researchers: Nonparametric statistical
methods: 1. Nonparametric methods for comparing two groups. Restorative Dentistry
& Endodontics. 2014;39(3):235-239.
56
University of Washington Graduate School
This is to certify that I have examined this copy of a master’s thesis by
Thomas D. Louwers
and have found that it is complete and satisfactory in all respects, and that any and all revisions required
by the final examining committee have been made.
Committee Members:
_____________________________________________________ Peter W. Johnson
_____________________________________________________ Sverre Vedal
_____________________________________________________ Gregory J. Martin
Date:__________________________________

57
In presenting this thesis in partial fulfillment of the requirements for a master’s degree at the University
of Washington, I agree that the Library shall make its copies freely available for inspection. I further
agree that extensive copying of this thesis is allowable only for scholarly purposes, consistent with “fair
use” as prescribed in the U.S. Copyright Law. Any other reproduction for any purposes or by any means
shall not be allowed without my written permission.
Signature ________________________
Date ____________________________
58
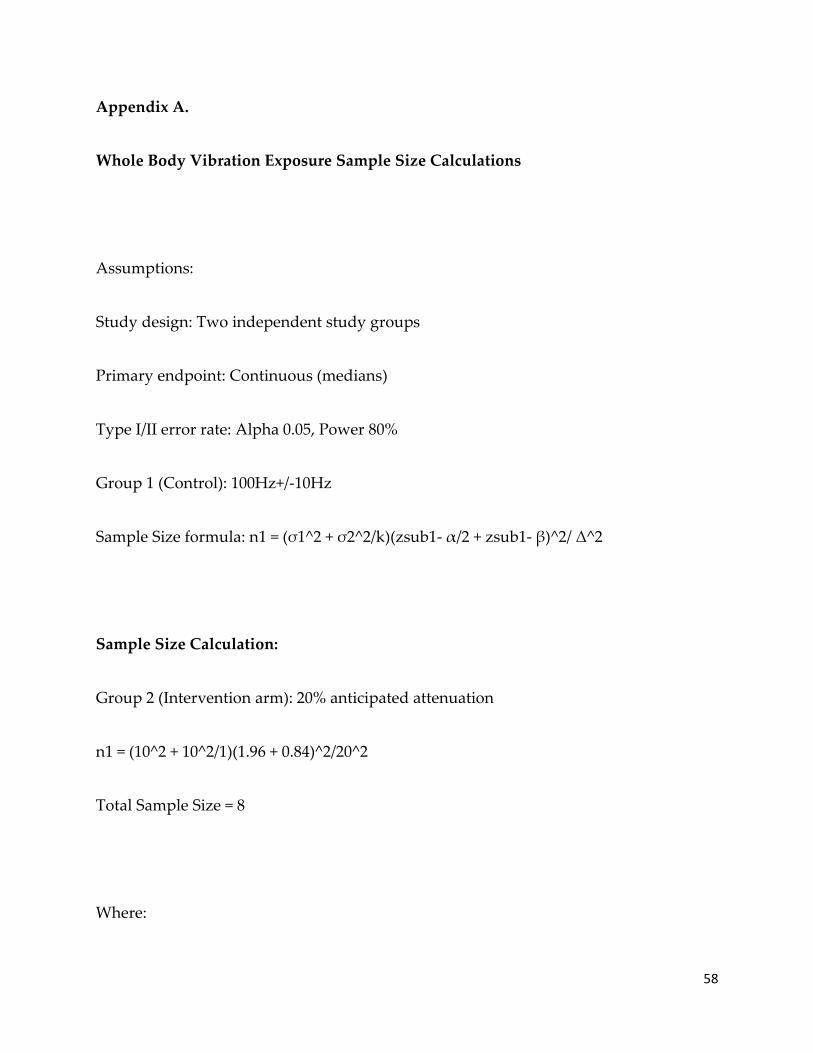
Appendix A.
Whole Body Vibration Exposure Sample Size Calculations
Assumptions:
Study design: Two independent study groups
Primary endpoint: Continuous (medians)
Type I/II error rate: Alpha 0.05, Power 80%
Group 1 (Control): 100Hz+/-10Hz
Sample Size formula: n1 = (σ1^2 + σ2^2/k)(zsub1- α/2 + zsub1- β)^2/ Δ^2
Sample Size Calculation:
Group 2 (Intervention arm): 20% anticipated attenuation
n1 = (10^2 + 10^2/1)(1.96 + 0.84)^2/20^2
Total Sample Size = 8
Where:

59
Δ = |μ2-μ1| = absolute difference between two means
σ1, σ2 = variance of mean #1 and #2
n1 = sample size for group #1
α = probability of type I error (usually 0.05)
β = probability of type II error (usually 0.2)
z = critical Z value for a given α or β
k = ratio of sample size for group #1 to group #2 (54)

60
Appendix B.
Subject ID: _________ Study site: ____ Investigator: ______ Date: ____ /____ /____
Subject First Name: _______________________________ Truck#________ M#_______ Time Point: ___
Key Location: ______________________ Shift Start Time: ____________ Shift End Time: ____________
APPARATUS
Vehicle
Make: ______________ Model: ______________
Year: ____________ Mileage: ___________
Seat Type:
Data Collection
Installation
Turn on the Rion data logger and check the settings
Settings: Range: 3.00 x 10^2 m/s^2 (3V) Input: CCLD, HPF Off, LPF Off, Sens PICK Frequency Range: 500Hz Sampling Freq: x2.56Hz Check Date/Time
Seat accelerometer (X, Y, Z) => Ch. 1, 2, 3
8-channel logger Floor accelerometer (X, Y, Z) => Ch. 4, 5, 6
4-channel logger Floor accelerometer (Z) => Ch. 4
Press record - time (__ __ : __ __ )
Oscillate all accelerometers (3x X direction – away 1st, 6x Y direction right 1st, 9x Z direction up 1st)
Post measurement
Turn off the Rion data logger and GPS (__ __ : __ __)
Away from site
Download GPS, save as .csv .gpx, .nmea .kml with name; save map STUDY_TIMEPOINT_M000_SITE_T00000_SEAT_GPS00_YYYYMMDD
Move Rion file and save as STUDY_TIMEPOINT_M000_SITE_T00000_SEAT_RION0_YYYYMMDD
Check GPS and Rion files for quality, process to power file, and backup on iDrive
Recharge Rion internal batteries (C or AA)
Recharge GPS
Recharge external batteries

61
WBV HARDWARE
Logger ID Model Channel CF card #
Battery Seat Floor GPS
Accel. # Cable # Accel. # Cable # Unit #
#1 RION DA-20 4 1 1 A7 7 S2 1002 20
#2 RION DA-20 4 2 5 A8 16 S3 1003 21
#3 RION DA-20 4 3 6 A1 10 S4 1001 22
#4 RION DA-40 8 4 7 A6 6 A4 3 23
#5 RION DA-40 8 5 11 A2 20 A5 10 24 25
#6 RION DA-40 8 6 12 A9 1004 A3 22 26 27
#7 RION DA-40 8 7 8 14 15 A10 17 S1 1000 28 29
0.1 Start RION by pressing POWER. Photos on the left are for the DA-20, photos on right for DA-40.
0.2 This may appear, to ask if you want to save setting from card:
0.3 Chose Cancel
1.0 Press MENU, and choose Input.
1.1 Make sure (or change so) Input for channel 1, 2 and 3 is CCLD, and that HPF and LPF is OFF.

62
Should look like this:
1.2 For the DA-40, ensure Sens is set to PICK and sensitivity is appropriate for attached accelerometers.
Instructions on adjusting sensitivity are in step 2.4.

63
1.3 For the DA-40: Turn off any channels that will not be used such as channels 7 and 8:
Menu -> Input Change Input to OFF for any unused channels.
2.0 Go to MENU, choose Rec. Parameters.
2.1 Make sure settings in Rec. Parameters are as follows: Frequency Range=500Hz, Sampling
Frequency=x2.56, Recording time=Manual, Pre-Time=0s, and Voice=OFF:
2.2 Go back to MENU, choose Calibration: (DA-20 only)
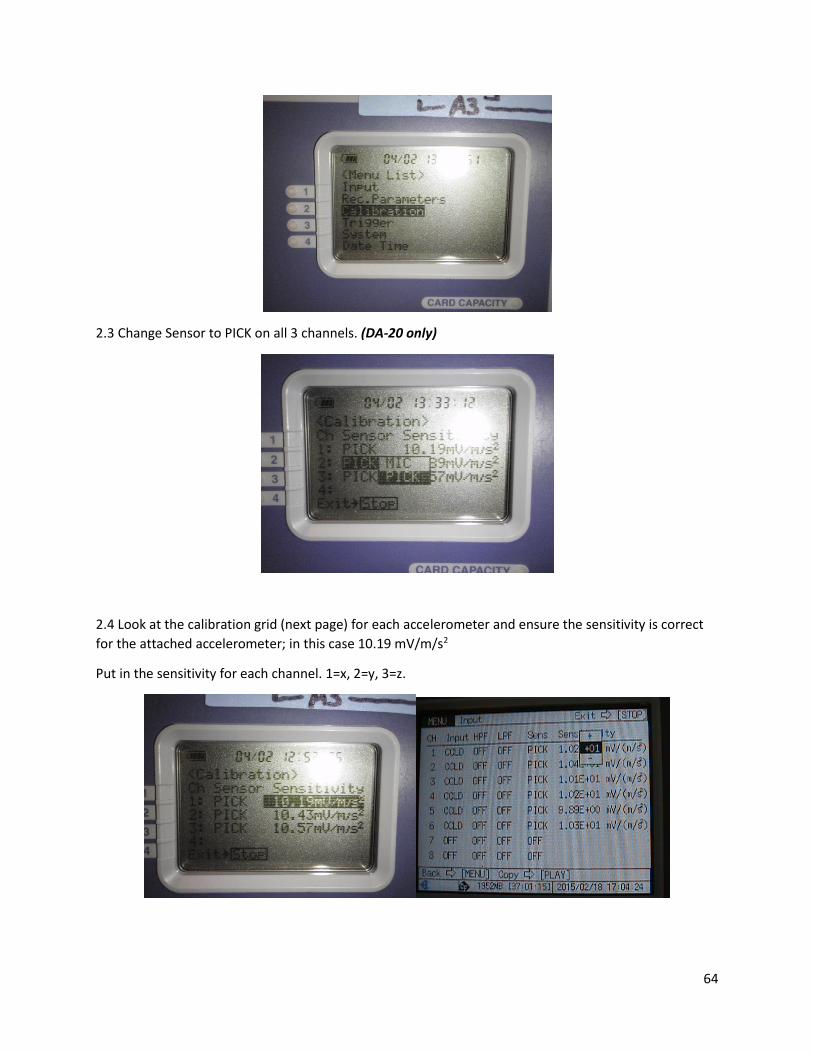
64
2.3 Change Sensor to PICK on all 3 channels. (DA-20 only)
2.4 Look at the calibration grid (next page) for each accelerometer and ensure the sensitivity is correct
for the attached accelerometer; in this case 10.19 mV/m/s2
Put in the sensitivity for each channel. 1=x, 2=y, 3=z.

65
Here is a list for all sensitivities for all accelerometers and all axes:
Accelerometer
X Y Z
1 10.31 10.33 9.63
2 10.24 10.37 10.11
3 10.19 9.89 10.35
4 10.11 10.14 10.11
5 9.88 10.15 9.89
6 10.51 10.64 10
7 10.1 10.11 9.99
8 10.18 10.22 9.93
9 9.89 10.32 10.52
10 10.36 9.86 10.11
11 10.20 10.43 10.27
12 10.29 10.31 10.36
14 10.10 10.50 10.06
S1 - - 10.32
S2 - - 10.74
S3 - - 10.2
S4 - - 10.43
S5 - - 10.57
S6 - - 10.25
Change the sensitivity on all channels.
3.0 Go to MENU. Choose System, then Card Format

66
3.1 You get a warning that you are deleting all the data on the memory card. Unless you have data left
on card that you have forgotten to transfer to computer, choose OK.
4.0 On the main screen, press RANGE. Adjust for all active channels to approximately 3 x 10² m/s2 – this
corresponds to 3V.

67
The RION settings are now ready.

68
To Start A New Measurement:
5.0 Go through steps above to ensure settings are correct. Attach external battery and secure cable to
Rion with a short strip of duct tape.
5.1 Place the seatpad accelerometer and feed cables through the seatback/seatpan joint before
connecting to the Rion.
5.2 Place floor accelerometer on floor near seatpad accelerometer and connect cable to Rion. If
dusty/greasy, wipe first with Chlorox Wet Wipe.
5.3 Press Record. You should see a flashing red dot on the screen and the Record button should have a
flashing red dot near it.
5.4 QC Procedure
5.4.1 Move seatpad accelerometer away from you then towards you 3x, then move towards your right
then to your left 6x, followed by moving it first up then down 8x.
5.4.2 Move floor accelerometer away from you then towards you 3x, then move towards your right then
to your left 6x, followed by moving it first up then down 9x. If only z-channel, not a triaxial
accelerometer, only the last step (up then down 8x) is necessary.
5.5 Tape down seatpad accelerometer with painters or gaffers tape.

69
5.6 Secure Rion in case behind passenger seat (daycab), driver seat (sleeper cab), or other location
where it will be secure and where accelerometer cables are not stretched tight.
5.7 Use duct tape and/or Velco to securely attach external battery to leg of passenger seat or similar
location.
5.8 Take photos of seatpad and floor accelerometer and any noteworthy features of cab.
5.9 Turn on GPS and use duct tape to securely attach to dash on passenger side. If dash is dusty/greasy,
use Chlorox Wet Wipes first.
5.10 Record RION number, seatpad and floor accelerometer and cable numbers, GPS number, and times
turned on on summary sheet. Record truck number, odometer reading, seat type, and any other
pertinent details about truck, driver, seat, or trip on summary sheet along with time expected back.
Retrieval:
6.1 Remove GPS and turn off. Record time off on summary sheet. If GPS showing no lights or showing a
red light, record that information on summary sheet.
6.2 Remove Rion logger case and ensure Rion still on and has a red flashing light on display indicating it
is recording. Press STOP, wait for warning message to go away, then turn OFF. Record time off on
summary sheet. If Rion already off, check if battery still plugged in and record information on summary
sheet.
6.3 Disconnect accelerometer cables from Rion. Remove seatpad and floor accelerometers.
6.4 Record odometer mileage on summary sheet with any other pertinent information mentioned by
driver.
Data Uploading:
70
7.0 Eject memory card from Rion and use a compact flash reader to connect the card to computer. Open
the device the same way you would an external hard drive. Open the WAVE folder and copy the file to
its new location on the hard drive. Change the file name to match the filename structure used such as
STUDY_SUBJECT#_TIMEPOINT_TRUCK#_RION#_DATE. Eject memory card and replace in Rion. Deleting
files off the memory card using the computer can result in card format errors when using the Rion.
7.1 To quickly check Rion data, open the Rion DA-40 Viewer software and open the file. Go to Settings-
>File Info to check for issues with Rion recording settings. Go to Settings->Scaling Info to check for issues
with sensitivity settings for the accelerometers. Go to Settings -> Graph Settings and change Fre q.
Weighting to Wd for x and y channels and Wk for z channels. Change Scaling to Auto or to Manual
(setting Upper value to 5 and Lower value to -5 will show you most of your data). From here you can
focus in on certain segments of the data using the second from the left graph icon beneath Edit. To see
summary values, go to Calculate -> Statistical Values. Do not place too much weight on these summary
values.
8.0 Turn the GPS on and connect to the computer. For the DG100, the built-in USB cord goes straight in.
For the DG200, connect a USB-to-MicroUSB cord to use it. For the Qstarz, connect a USB-to-USB cord to
use.
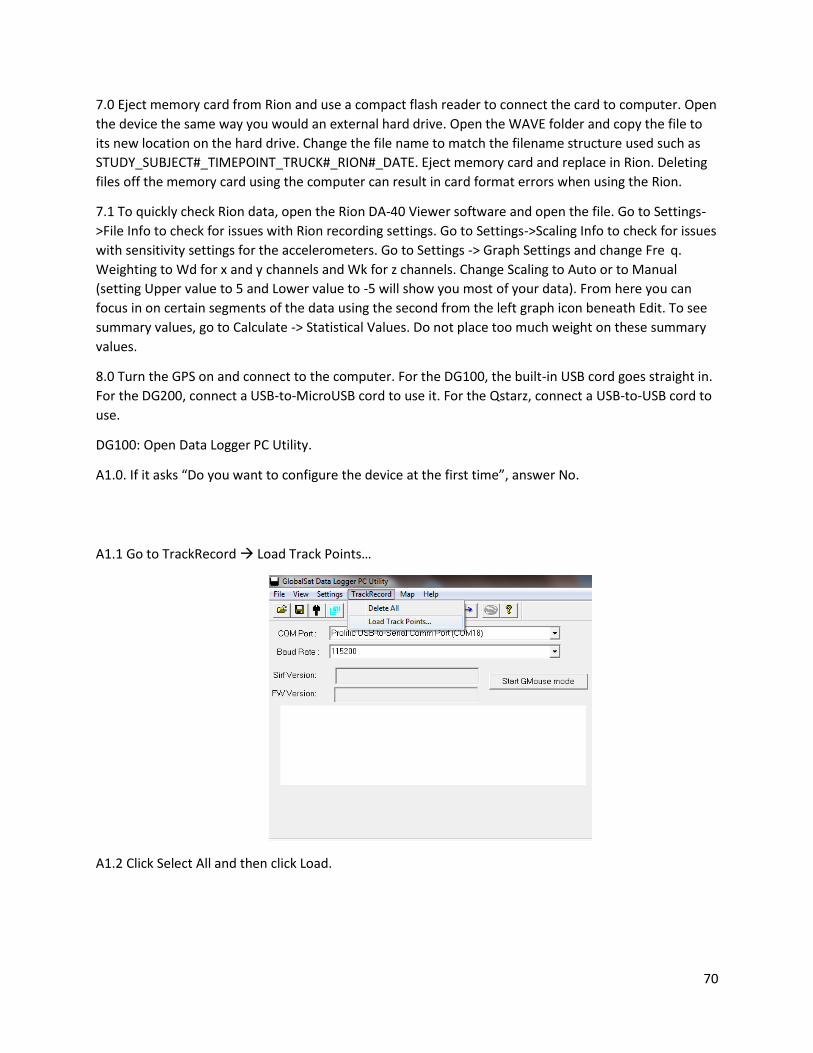
DG100: Open Data Logger PC Utility.
A1.0. If it asks “Do you want to configure the device at the first time”, answer No.
A1.1 Go to TrackRecord Load Track Points…
A1.2 Click Select All and then click Load.

71
A1.3 It will show the progress in the bottom right corner – it may take several minutes if a full shift was
recorded.

72
A2.0 When the software is done downloading files, Go to File Select All Files
A2.1 Go to Map View Point
A2.2 Go to File –> Export CSV File…
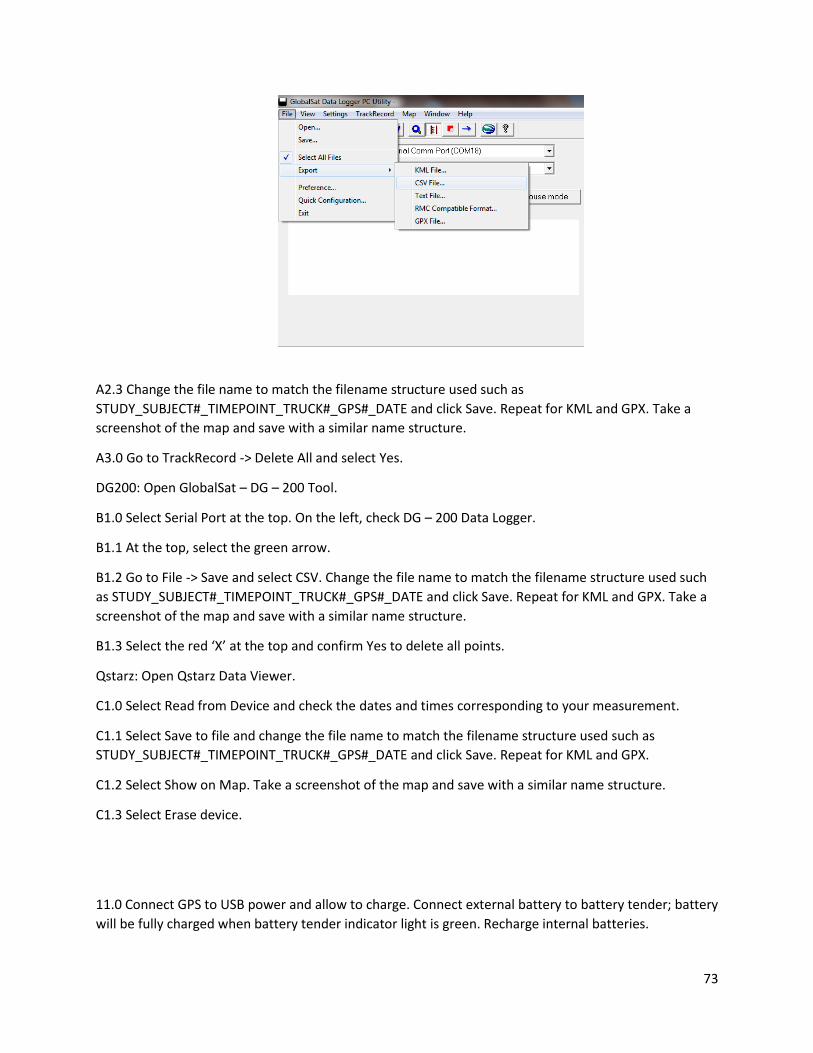
73
A2.3 Change the file name to match the filename structure used such as
STUDY_SUBJECT#_TIMEPOINT_TRUCK#_GPS#_DATE and click Save. Repeat for KML and GPX. Take a
screenshot of the map and save with a similar name structure.
A3.0 Go to TrackRecord -> Delete All and select Yes.
DG200: Open GlobalSat – DG – 200 Tool.
B1.0 Select Serial Port at the top. On the left, check DG – 200 Data Logger.
B1.1 At the top, select the green arrow.
B1.2 Go to File -> Save and select CSV. Change the file name to match the filename structure used such
as STUDY_SUBJECT#_TIMEPOINT_TRUCK#_GPS#_DATE and click Save. Repeat for KML and GPX. Take a
screenshot of the map and save with a similar name structure.
B1.3 Select the red ‘X’ at the top and confirm Yes to delete all points.
Qstarz: Open Qstarz Data Viewer.
C1.0 Select Read from Device and check the dates and times corresponding to your measurement.
C1.1 Select Save to file and change the file name to match the filename structure used such as
STUDY_SUBJECT#_TIMEPOINT_TRUCK#_GPS#_DATE and click Save. Repeat for KML and GPX.
C1.2 Select Show on Map. Take a screenshot of the map and save with a similar name structure.
C1.3 Select Erase device.
11.0 Connect GPS to USB power and allow to charge. Connect external battery to battery tender; battery
will be fully charged when battery tender indicator light is green. Recharge internal batteries.

74
12.0 Backup GPS and Rion files to Idrive and/or external hard drive.

75
Troubleshooting
1. Card Error Warning Message:
Rion displays warning message shown below or shows warning message of No Card:
Go to Menu -> System and select Format Card and press Enter. If warning message is repeated, follow
steps below to eject card:
On upper right edge, press outwards to open memory card slot. Press the black trigger to the right
inwards to eject the memory card. Memory card should be Extreme CompactFlash. For the DA-20, the
memory card must be 2 GB. For the DA-40, it can be either 2 or 4 GB.

76
2. Rion turns on then abruptly turns off or shows warning message about CCLD:
Insufficient power – the icon in the lower left corner of the display will resemble a blue battery when
running off internal battery, will resemble a plug when using external power, and will turn red when
battery power is low. Connect Rion to fully charged external battery and if possible change internal
batteries. For DA-20 NiMH rechargeable AAs do not have sufficient voltage to run CCLD so the Rion will
change its settings but may still show the battery indicator as blue. To prevent this, plug the DA-20 into
external power prior to powering on. Higher voltage (1.6V) NiZn AA batteries can be used in the Rions as
a backup to external battery power.
3. Rion shows units other than m/s2 in Range on front screen:
Sensor has changed to mode other than PICK. Redo step 2.3 for DA-20 or step 1.2 for DA-40. Go through
steps to check settings in case other settings have changed.
4. Overload light stays on during QC procedure:

77
Check RANGE by doing step 4.0. The overload warning light will come on as accelerometers are
initially connected but will go away within a few seconds. While it might reappear if someone
sits on the seat pad or a similarly large motion occurs, it should not appear during the QC
procedure.