analysis of 26 weber panel simple tandem repeat polymorphisms
TRANSCRIPT

APPLICATION INFORMATION
IntroductionShort tandem repeats (STRs) have become a boonto molecular geneticists who localize genes in mam-malian genomes. Ideal STR polymorphisms amplifywell under standard conditions, have a low amplifi-cation background, are easy to score, and are highlyinformative (Dubovsky et al., 1995). Dr. JamesWeber of the Marshfield Medical Research Foundationhas coordinated an effort to identify and map a largenumber of ideal human STRs for the genetics com-munity, fulfilling the goal of establishing a physicalframework of heritable polymorphic markers thatcan be used to map any gene of interest (Sheffieldet al., 1995). The latest set of markers has an aver-age density of one marker per 10 cM, or a geneticrecombination spacing of 10% (~ 10 million bases).Despite the large distance, the gap is readily closedusing additional genetic markers and a variety ofphysical techniques, including chromosome walking.
In this paper, we examine a subset of the Weberpanel version 9 using the CEQ™ 2000 Fragment Analysissystem from Beckman Coulter. The complete panel con-sists of nearly 390 dinucleotide, trinucleotide, andtetranucleotide repeat polymorphisms spread throughoutthe human genome. Twenty six STR loci in three sets of8 or 10 members each were examined on the CEQ 2000using the Beckman Coulter WellRed dye-labeled primers.Each set was separated and analyzed on an individualcapillary. The results clearly demonstrate that the CEQ2000 is well suited for the analysis of STRs.
Materials and MethodsPrimer sets were obtained from Research Genetics,Inc. (Huntsville, Alabama). Primer sequences were
obtained from the Marshfield Medical Research site(http://www.marshmed.org/genetics/). In all cases, theforward primers were dye-labeled as indicated in thefragment lists in Figures 1, 5, 6, and 7. The reverseprimers were unlabeled. The genomic DNAs wereCEPH Utah pedigree 1331 repository DNA samplesNA 07057A or NA 06990 obtained from the CoriellInstitute for Medical Research (Camden, NJ). Labeledprimers were tested for quality by dilution to 30 fM indeionized formamide, and separated on the CEQ 2000.Primer pairs were quantitated using a DU® 7500 UVSpectrophotometer from Beckman Coulter (Fullerton,CA). Genomic DNA was quantitated on a FLUOstar-PMicroplate Fluorometer (BMG Lab Technologies,Offenburg, Germany) using Pico Green* (P-7581;Molecular Probes, Eugene, Oregon). Lambda DNAwas used as a quantitative standard for this assay.
Individual amplification reactions were mixedas follows:
10x AmpliTaq Gold PCR Buffer 1.0 µL5X dNTPs (1.25 mM) 0.8 µLPrimer Mix (5.0 µM each) 0.5 µLMgCl2 (25 mM) 0.6 µLDNA (20 ng/µL) 1.0 µLEnzyme (5U/µL) 0.05 µLWater 6.05 µLTotal Reaction Vol. 10.0 µL
D N A F r a g m e n t A n a l y s i s
A-1879A
ANALYSIS OF 26 WEBER PANEL SIMPLE TANDEM REPEAT POLYMORPHISMSUSING THE CEQ 2000 FRAGMENT ANALYSIS SYSTEM
Mark Dobbs, Keith Roby, Scott Boyer, Doni Clark, and Graham ThreadgillBeckman Coulter, Inc.
* Pico Green is a registered trademark of Moleculer Probes,Inc.

2
Cycling conditions were: 95°C – 10 minutes,1 cycle to activate the enzyme (AmpliTaq Gold,Perkin Elmer, Branchburg, NJ), 95°C – 1 minute,57°C – 1 minute, 72°C – 1 minute, 40 cycles(MJ PTC 200 Thermocycler, MJ Research, Inc.,Waltham, MA). The individual samples were thenrun on the CEQ™ 2000 to determine the dilutionsneeded to balance the signal intensities of the sizestandards and amplification products. Two differentapproaches to preparing the mixtures were equallysuccessful. In the case of set 3, the amplificationproducts were mixed in calculated ratios beforeethanol precipitation. In the case of sets 21 and 31,each amplification product was precipitated, quanti-tated, and then mixed into deionized formamide tocreate the sample pool. Forty µL of each mixture,which included 0.5 µL CEQ DNA size standard –400 (Beckman Coulter P/N 608098), was aliquotedinto each sample well. Samples were run on a CEQ2000 under the Frag-3 method:
Capillary Temperature 50°CDenature Temperature
and Time 90°C for 120 secondsInjection Voltage
and Time 2.0 kV for 30 secondsSeparation Voltage
and Time 6.0 kV for 35 minutes
The total cycle time for each row of eight samples,which included denaturation, injection, separation,data analysis, and capillary replenishment wasapproximately 45 minutes.
Results and DiscussionAll of the loci selected for these experiments ampli-fy well using the three novel Beckman Coulter dyes(Figures 1-7). The scale of the reactions and ampli-fication conditions are no different from theconditions used to amplify the same loci with otherlabeled primers (e.g,. ftp://ftp.resgen.com/pub/map-pairs/humanset/mappairs_protocol.txt). The peakpatterns observed for the loci range from simple tocomplex. Locus D6S474 demonstrates a simple pat-tern with approximately 90% of the amplificationproduct present in the true length form, and 10%present in the +A form (Figure 4, 152.30 and168.38 bases). Each allele from locus D11S2000displays 3 peaks (Figure 4, 216.73 and 222.82bases). In the CEQ 2000 Fragment Analysis soft-ware, the user may arbitrarily assign any of thevisualized peaks as the peak to use in allele identifi-cation using the specifications set up for each locustag (e.g., Figure 8). After visually inspecting theallele patterns and evaluating the level of +A and
amount of stutter, the user creates an allele list bycalculating slope and offset of the linear relation-ship between two observed fragment sizes(Apparent size) and two expected sizes (True size).Alleles are identified based on their closeness to theapparent sizes. For all of the loci in the studied setsof STRs where more than two alleles were repre-sented by the two individuals examined (20/26), aplot of the observed size versus the expected sizewas a straight line. In practice, when nothing isknown about the alleles or their expected sizes, thefirst observed fragment may be matched up withany similarly sized true allele in the list. As a rule,because large peaks contain more data points andare more likely to be called accurately, it was bestto use the largest peak of a set to identify the allelesin the allele list of a locus tag. The other peakswithin the range of a locus tag will be sized by thesoftware and annotated in the Comment field of thefragment list (Figure 7). Samples of AlleleIdentification Criteria and an Allele List are shownin Figure 8.
The primer sets used in these experiments weresuggested by the Marshfield Medical ResearchFoundation. The number of independent loci exam-ined on individual capillaries was maximized byco-electrophoresis of non-overlapping allele ampli-fication products. Adequate spacing of the lociwithin a set prevented stutter peaks from one locusfrom migrating in the range of a neighboring locustagged with the same color. Nevertheless, if suitableloci are available, it may be possible to increase thenumber of amplification products that are analyzedsimultaneously, further improving the throughput ofthe system.
In the present experiments, individual PCRreactions or mixtures of independent PCR reactionswere precipitated and resuspended in formamidebefore loading on to the CEQ 2000. It was neces-sary to precipitate the pooled products to increasethe fraction of anions in the injection mixture thatwere present as DNA molecules. Chloride,phosphate, unincorporated nucleotides and primersdecrease the local potential field in the sample,leading to a decrease in the amount of amplifiedDNA injected. Longer DNA fragments and the sizestandards also compete with each other for injec-tion. However, from our experience with DNAsequencing, we know that it is possible to injecthundreds of different DNA fragments in largeamounts when the injection mixture is relativelyfree of non-DNA ions.
Most of the primer pairs tested on the CEQ2000 produced labeled DNA fragments in the sizes
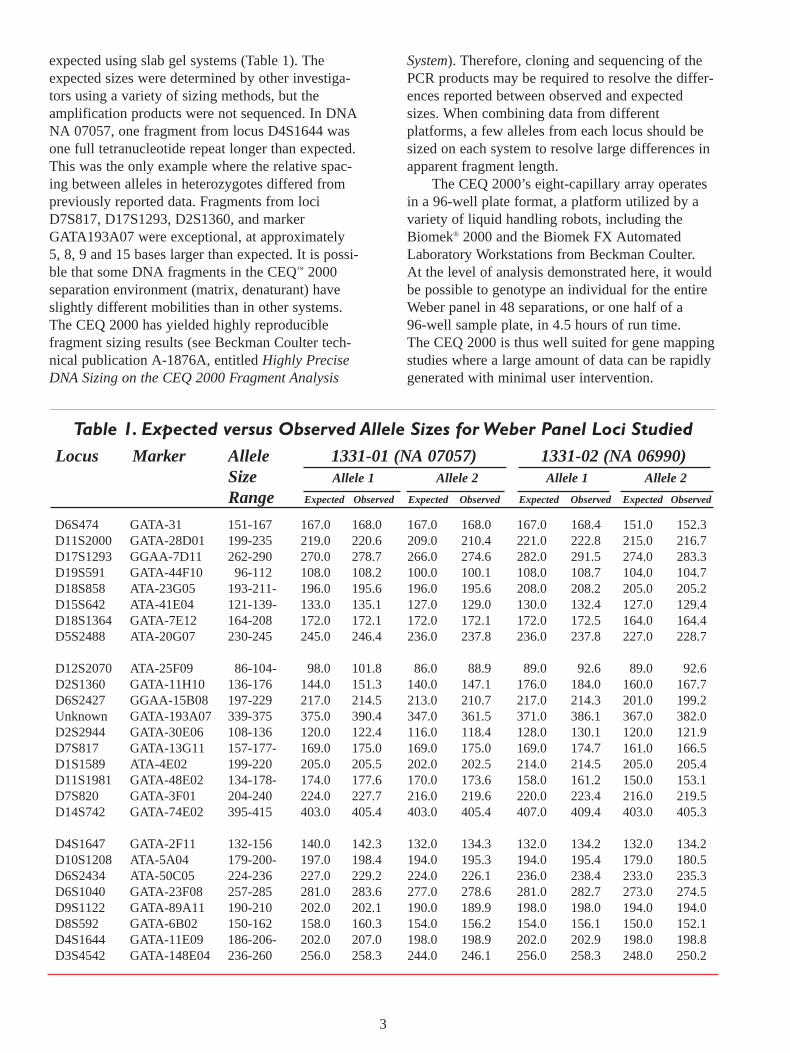
Table 1. Expected versus Observed Allele Sizes for Weber Panel Loci StudiedLocus Marker Allele 1331-01 (NA 07057) 1331-02 (NA 06990)
Size Allele 1 Allele 2 Allele 1 Allele 2
Range Expected Observed Expected Observed Expected Observed Expected Observed
D6S474 GATA-31 151-167 167.0 168.0 167.0 168.0 167.0 168.4 151.0 152.3D11S2000 GATA-28D01 199-235 219.0 220.6 209.0 210.4 221.0 222.8 215.0 216.7D17S1293 GGAA-7D11 262-290 270.0 278.7 266.0 274.6 282.0 291.5 274.0 283.3D19S591 GATA-44F10 96-112 108.0 108.2 100.0 100.1 108.0 108.7 104.0 104.7D18S858 ATA-23G05 193-211- 196.0 195.6 196.0 195.6 208.0 208.2 205.0 205.2D15S642 ATA-41E04 121-139- 133.0 135.1 127.0 129.0 130.0 132.4 127.0 129.4D18S1364 GATA-7E12 164-208 172.0 172.1 172.0 172.1 172.0 172.5 164.0 164.4D5S2488 ATA-20G07 230-245 245.0 246.4 236.0 237.8 236.0 237.8 227.0 228.7
D12S2070 ATA-25F09 86-104- 98.0 101.8 86.0 88.9 89.0 92.6 89.0 92.6D2S1360 GATA-11H10 136-176 144.0 151.3 140.0 147.1 176.0 184.0 160.0 167.7D6S2427 GGAA-15B08 197-229 217.0 214.5 213.0 210.7 217.0 214.3 201.0 199.2Unknown GATA-193A07 339-375 375.0 390.4 347.0 361.5 371.0 386.1 367.0 382.0D2S2944 GATA-30E06 108-136 120.0 122.4 116.0 118.4 128.0 130.1 120.0 121.9D7S817 GATA-13G11 157-177- 169.0 175.0 169.0 175.0 169.0 174.7 161.0 166.5D1S1589 ATA-4E02 199-220 205.0 205.5 202.0 202.5 214.0 214.5 205.0 205.4D11S1981 GATA-48E02 134-178- 174.0 177.6 170.0 173.6 158.0 161.2 150.0 153.1D7S820 GATA-3F01 204-240 224.0 227.7 216.0 219.6 220.0 223.4 216.0 219.5D14S742 GATA-74E02 395-415 403.0 405.4 403.0 405.4 407.0 409.4 403.0 405.3
D4S1647 GATA-2F11 132-156 140.0 142.3 132.0 134.3 132.0 134.2 132.0 134.2D10S1208 ATA-5A04 179-200- 197.0 198.4 194.0 195.3 194.0 195.4 179.0 180.5D6S2434 ATA-50C05 224-236 227.0 229.2 224.0 226.1 236.0 238.4 233.0 235.3D6S1040 GATA-23F08 257-285 281.0 283.6 277.0 278.6 281.0 282.7 273.0 274.5D9S1122 GATA-89A11 190-210 202.0 202.1 190.0 189.9 198.0 198.0 194.0 194.0D8S592 GATA-6B02 150-162 158.0 160.3 154.0 156.2 154.0 156.1 150.0 152.1D4S1644 GATA-11E09 186-206- 202.0 207.0 198.0 198.9 202.0 202.9 198.0 198.8D3S4542 GATA-148E04 236-260 256.0 258.3 244.0 246.1 256.0 258.3 248.0 250.2
3
expected using slab gel systems (Table 1). Theexpected sizes were determined by other investiga-tors using a variety of sizing methods, but theamplification products were not sequenced. In DNANA 07057, one fragment from locus D4S1644 wasone full tetranucleotide repeat longer than expected.This was the only example where the relative spac-ing between alleles in heterozygotes differed frompreviously reported data. Fragments from lociD7S817, D17S1293, D2S1360, and markerGATA193A07 were exceptional, at approximately5, 8, 9 and 15 bases larger than expected. It is possi-ble that some DNA fragments in the CEQ™ 2000separation environment (matrix, denaturant) haveslightly different mobilities than in other systems.The CEQ 2000 has yielded highly reproduciblefragment sizing results (see Beckman Coulter tech-nical publication A-1876A, entitled Highly PreciseDNA Sizing on the CEQ 2000 Fragment Analysis
System). Therefore, cloning and sequencing of thePCR products may be required to resolve the differ-ences reported between observed and expectedsizes. When combining data from differentplatforms, a few alleles from each locus should besized on each system to resolve large differences inapparent fragment length.
The CEQ 2000’s eight-capillary array operatesin a 96-well plate format, a platform utilized by avariety of liquid handling robots, including theBiomek® 2000 and the Biomek FX AutomatedLaboratory Workstations from Beckman Coulter.At the level of analysis demonstrated here, it wouldbe possible to genotype an individual for the entireWeber panel in 48 separations, or one half of a 96-well sample plate, in 4.5 hours of run time.The CEQ 2000 is thus well suited for gene mappingstudies where a large amount of data can be rapidlygenerated with minimal user intervention.

4
Figure 1. Plot of run with eight polymorphic Weber markers from DNA NA 06990 electrophoresed in the samecapillary (Weber panel set 3) and fragment list with called alleles only.Figure 1. Plot of run with eight polymorphic Weber markers from DNA NA 06990 electrophoresed in the samecapillary (Weber panel set 3) and fragment list with called alleles only.Figure 1. Plot of run with eight polymorphic Weber markers from DNA NA 06990 electrophoresed in the samecapillary (Weber panel set 3) and fragment list with called alleles only.Figure 1. Plot of run with eight polymorphic Weber markers from DNA NA 06990 electrophoresed in the samecapillary (Weber panel set 3) and fragment list with called alleles only.

5
Figure 2. Same run as Figure 1, displaying only the size standards and the amplification products labeled withdye D2.Figure 2. Same run as Figure 1, displaying only the size standards and the amplification products labeled withdye D2.Figure 2. Same run as Figure 1, displaying only the size standards and the amplification products labeled withdye D2.Figure 2. Same run as Figure 1, displaying only the size standards and the amplification products labeled withdye D2.
Figure 3. Same run as Figure 1, displaying only the size standards and the amplification products labeled withdye D3.Figure 3. Same run as Figure 1, displaying only the size standards and the amplification products labeled withdye D3.Figure 3. Same run as Figure 1, displaying only the size standards and the amplification products labeled withdye D3.Figure 3. Same run as Figure 1, displaying only the size standards and the amplification products labeled withdye D3.
Figure 4. Same run as Figure 1, displaying only the size standards and the amplification products labeled withdye D4.Figure 4. Same run as Figure 1, displaying only the size standards and the amplification products labeled withdye D4.Figure 4. Same run as Figure 1, displaying only the size standards and the amplification products labeled withdye D4.Figure 4. Same run as Figure 1, displaying only the size standards and the amplification products labeled withdye D4.

6
Figure 5. Plot of run with 10 polymorphic Weber markers from DNA NA 06990 electrophoresed in the samecapillary (Weber panel set 21) and fragment list with called alleles.Figure 5. Plot of run with 10 polymorphic Weber markers from DNA NA 06990 electrophoresed in the samecapillary (Weber panel set 21) and fragment list with called alleles.Figure 5. Plot of run with 10 polymorphic Weber markers from DNA NA 06990 electrophoresed in the samecapillary (Weber panel set 21) and fragment list with called alleles.Figure 5. Plot of run with 10 polymorphic Weber markers from DNA NA 06990 electrophoresed in the samecapillary (Weber panel set 21) and fragment list with called alleles.

7
Figure 6. Plot of run with eight polymorphic Weber markers from DNA NA 06990 electrophoresed in the samecapillary (Weber panel set 31) and fragment list with called alleles.Figure 6. Plot of run with eight polymorphic Weber markers from DNA NA 06990 electrophoresed in the samecapillary (Weber panel set 31) and fragment list with called alleles.Figure 6. Plot of run with eight polymorphic Weber markers from DNA NA 06990 electrophoresed in the samecapillary (Weber panel set 31) and fragment list with called alleles.Figure 6. Plot of run with eight polymorphic Weber markers from DNA NA 06990 electrophoresed in the samecapillary (Weber panel set 31) and fragment list with called alleles.

8
Figure 7. Segment of set 3 data with non-allele peaks within a locus range identified in the Commentsfield.
8
Figure 7. Segment of set 3 data with non-allele peaks within a locus range identified in the Commentsfield.
8
Figure 7. Segment of set 3 data with non-allele peaks within a locus range identified in the Commentsfield.
8
Figure 7. Segment of set 3 data with non-allele peaks within a locus range identified in the Commentsfield.

9
Locus Tag Name: D11S200/GATA28D01Locus: D 11 S2000GenBank Accession:Primer Set Name: D 11 S2000Primer Dye: D4Primer Labeled: ForwardForward Sequence: AGTA CAAA AGCC TATT TAGT CAGGReverse Sequence: TTTG AAGATCTG TGAA ATGT GCFragment Size Range Min Size: 195Fragment Size Range Max Size: 239Repeat Unit Length: 4Repeat Unit Sequence: GATANo. of Repeats in Shortest Allele: 1Shortest Allele Size: 195Apparent size includes + A: Yes
Allele ID CriteriaAllele Confidence Interval: 0.50Search for stutter: YesStutter Detection Window Width: 2 repeatsDetect stutter shorter than allele: YesDetect stutter longer than allele: YesMaximum relative stutter peak height: 20%Detect spurious peaks: YesMaximum height for spurious peaks: 50%Detect +/- A: Yes+ A is dominant: Yes
Allele ListNumber
True Size (nt) Apparent Size (nt) of Repeats ID199 200.49 1 1203 204.55 2 2207 208.61 3 3211 212.67 4 4215 216.73 5 5219 220.79 6 6221 222.82 6.2 6.2223 224.85 7 7227 228.91 8 8231 232.97 9 9235 237.03 10 10
Figure 8 .Sample Locus Tag Information. Each field listed is available for data entry by the user.

Developing innovative solutions in genetic analysis, drug discovery, and instrument systems.
Beckman Coulter, Inc.• 4300 N.Harbor Boulevard,Box 3100 • Fullerton,California 92834-3100Sales:1-800-742-2345 • Service:1-800-551-1150 • Telex:678413 • Fax:1-800-643-4366 • www.beckmancoulter.com
Worldwide Bioresearch Division Offices: Australia (61) 2 9844-6000 Canada (905) 819-1234 China (86) 10 6515 6028 Eastern Europe, Middle East, Africa (41) 22 994 07 07 France 01 49 90 90 00 Germany (89) 35870-0 Hong Kong (852) 2814 7431 / 2814 0481 Italy 02-953921 Japan 03-5404-8359 Mexico 525-559-16-35 Netherlands 0297-230630 Singapore (65) 339 3633 South Africa (27) 11-805-2014/5 Spain 91 728 7900 Sweden 08-98 53 20 Switzerland 0800 850 810 Taiwan (886) 2 2378 3456 U.K. 01494 441181 U.S.A. 1-800-742-2345.
B2000-3944-CB-5 © 2000 Beckman Coulter, Inc. Printed in U.S.A.on recycled paper.
All trademarks are the property of their respective owners.