analysis of 2014 nys 3 8 test results - datag of 2014 nys 3‐8 test results. ... i remembered a...
TRANSCRIPT

ANALYSIS OF 2014 NYS 3‐8 TEST RESULTS

How This Investigation Started
Sullivan County is a county with struggling schools and a high number of economically disadvantaged families.
I wanted to find schools within the same economic disadvantaged ranges that were out‐performing other schools.
I remembered a chart that John King put out in 2014, showing a bunch of schools that were doing well even though they had high percentages of economically disadvantaged students – I set out to figure out which schools these were.

Former Commissioner John King’s Slide

AVERAGE PROFICIENCY

I Started with 3rd Grade ELA
•I compiled all the schools in NYS, but I removed the charters, because I felt they had advantages that other schools did not have
•I set my horizontal line at 50% rather than 30%, because we want to be more than just average
•The following chart is what I came up with


Results – 51 High Performing Schools:
• As I investigated the schools in the upper right hand quadrant, I realized that they were ALL NYC schools (except for 1). After further investigation, I realized that many of those school had gifted programs and/or were magnets and some sort of student application/selection takes place
• This set me in the direction of finding only the schools that, like most schools outside of NYC, had to take every student who lived in their school zones
• Upon removing magnet schools and schools with gifted programs, the results were much different, with very few schools finding themselves in that upper right‐hand quadrant
• In addition, as I removed these schools, the r‐squared value became higher and the trendline became tighter

PS 172 BEACON SCHOOL OF EXCELLENCEPS 191 THE MAYFLOWER
PS 100 THE CONEY ISLAND SCH.
PS 275 JOHN F. HYLAN

25 Schools Remain in the Upper Right Quadrant
PS 12 JAMES B COLGATE 91 54
PS 69 JOURNEY PREP SCHOOL 91 52
PS 172 BEACON SCHOOL OF EXCELLENCE 90 69
PS 226 ALFRED DE B MASON 85 52PS 176 OVINGTON 84 53PS 257 JOHN F HYLAN 78 59
PS 164 QUEENS VALLEY 78 55
STATEN ISLAND SCHOOL OF CIVIC LEADERSHIP 77 54
PS 31 SAMUEL F DUPONT 73 51PS 249 THE CATON 72 52ANNSVILLE AREA SCHOOL 70 54
PS 38 GEORGE CROMWELL 69 55PS 102 THE BAYVIEW 68 56PS 153 HOMECREST 68 51
PS 171 PATRICK HENRY 66 54
PS 133 64 58
PS 100 THE CONEY ISLAND SCHOOL 61 65
PS 290 60 57PS 173 FRESH MEADOW 60 51
PS 69 JACKSON HEIGHTS 59 53
PS 162 JOHN GOLDEN 58 54PS 11 PURVIS J BEHAN 56 53PS 191 MAYFLOWER 55 72
PS 222 KATHERINE R SNYDER 53 51
PS 213 THE CARL ULLMAN SCHOOL 50 68
First Column after Name is Economic Disadvantage %, Second is Proficiency

There is only 1 non‐NYC School in this list–Annsville Area School
Annsville Area School is a k‐5 elementary school with a population of 196 students, located about 50 miles NE of Syracuse. Annsville has a minority population of 3%.

So I tried the same experiment with 4th
Grade…


P.S. 172 Beacon School of Excellence
PS 164 Queens Valley
PS 173 Fresh Meadow

The 27 Schools in the Upper Right Quadrant
PS 316 ELIJAH STROUD 91 57PS 172 BEACON SCHOOL OF EXCELLENCE 90 85PS 176 OVINGTON 84 54PS 163 FLUSHING HEIGHTS 78 57PS 164 QUEENS VALLEY 78 64PS 58 SCHOOL OF HEROES 76 51PS 134 74 51PS 31 SAMUEL F DUPONT 73 53PS 165 EDITH K BERGTRAUM 73 62ANNSVILLE AREA SCHOOL 70 54PS 102 THE BAYVIEW 68 54PS 254 DAG HAMMARSKJOLD 64 56PS 133 64 59
PS 232 LINDENWOOD 62 53PS 100 THE CONEY ISLAND SCHOOL 61 60PS 247 60 61PS 173 FRESH MEADOW 60 76PS 162 JOHN GOLDEN 58 52PS 101 THE VERRAZANO 57 54PS 26 THE CARTERET SCHOOL 57 57PS 11 PURVIS J BEHAN 56 51PS 191 MAYFLOWER 55 68PS 222 KATHERINE R SNYDER 53 61FRANKLIN CENTRAL SCHOOL 52 69PS 207 ELIZABETH G LEARY 51 52PS 213 THE CARL ULLMAN SCHOOL 50 61W H STEVENSON ELEMENTARY SCHOOL 50 71
First Column after Name is Economic Disadvantage %, Second is Proficiency

There are 3 non‐NYC School in this list
1. Annsville Area School is a k‐5 elementary school with a population of 196 students, located about 50 miles NE of Syracuse
2. Franklin Central School is a k‐12 school with 113 students in k‐5, located about 50 miles NE of Binghamton
3. W H Stevenson Elementary School is a k‐5 school with a population of 207 students located near Niagara Falls
*It should be noted that all three of these schools have less than 5% minority students enrolled

From here on out, I removed all charter, magnet, and gifted program schools from my charts…

P.S. 172 Beacon School of ExcellencePS 191 Mayflower
PS 42 Benjamin Altman
PS 100 Coney Island

The 19 Schools in the Upper Right Quadrant
PS 161 ARTHUR ASHE SCHOOL 92 52PS 172 BEACON SCHOOL OF EXCELLENCE 90 66PS 22 THOMAS JEFFERSON 90 53PS 131 ABIGAIL ADAMS 86 51PS 199 FREDERICK WACHTEL 85 51PS 31 SAMUEL F DUPONT 73 52PS 42 BENJAMIN ALTMAN 71 57PS 39 FRANCIS J MURPHY JR 69 54SHERMAN ELEMENTARY SCHOOL 65 54
PS 186 DR IRVING A GLADSTONE 64 53PS 254 DAG HAMMARSKJOLD 64 53PS 100 THE CONEY ISLAND SCHOOL 61 59PS 247 60 54PS 173 FRESH MEADOW 60 52PS 162 JOHN GOLDEN 58 57PS 11 PURVIS J BEHAN 56 57PS 191 MAYFLOWER 55 57PS 312 BERGEN BEACH 50 51PS 213 THE CARL ULLMAN SCHOOL 50 61
First Column after Name is Economic Disadvantage %, Second is Proficiency

There is only 1 non‐NYC School on this list
Sherman Elementary School is a k‐6 Elementary School with a population of 225 students. It is located right outside of Fort Drum in Watertown, NY. The minority population is 2%.

CANASERAGA SCHOOL
PUTNAM CENTRAL SCHOOL
LAURENS CENTRAL SCHOOL

The 4 Schools in the Upper Right Quadrant
CANASERAGA SCHOOL 52 56PUTNAM CENTRAL SCHOOL 52 60LAURENS CENTRAL SCHOOL 51 57PS 207 ELIZABETH G LEARY 51 51
First Column after Name is Economic Disadvantage %, Second is Proficiency

There is are 3 non‐NYC School in this list
1. Canaseraga School is a k‐12 school with a k‐5 population of about 97 students. It is located about 50 miles NW of Corning*
2. Putnam Central School is a k‐6 elementary school with a population of 30 students, located about 45 miles above Lake George*
3. Laurens Central School is a k‐12 school with 108 students in k‐5, located outside of Oneonta*
*It should be noted that these schools have less than 10% minority students enrolled

PS 219 PAUL KLAPPERPS 207 ELIZABETH G LEARY

The 2 Schools in the Upper Right Quadrant: Both are in NYC
PS 219 PAUL KLAPPER 77 52
PS 207 ELIZABETH G LEARY 51 61
First Column after Name is Economic Disadvantage %, Second is Proficiency

PS/IS 295
PS 206 JOSEPH F LAMB
PS 232 LINDENWOOD

The 10 Schools in the Upper Right Quadrant
PS/IS 295 82 73PS 206 JOSEPH F LAMB 70 59PS/IS 113 ANTHONY J PRANZO 67 51PS 232 LINDENWOOD 62 60RICHFIELD SPRINGS CENTRAL SCHOOL 55 52SCHROON LAKE CENTRAL SCHOOL 55 58TUCKAHOE SCHOOL 52 61PS 207 ELIZABETH G LEARY 51 59SALEM HIGH SCHOOL 51 58WHITESVILLE CENTRAL SCHOOL 50 53
First Column after Name is Economic Disadvantage %, Second is Proficiency

There are 5 non‐NYC School in this list
1. Richfield Springs Central School is a k‐12 school with 31 students enrolled in 8th grade. It is located about 15 miles north of Cooperstown.*
2. Schroon Lake Central School is a k‐12 school with 13 students enrolled in 8th grade. It is located about 33 north of Lake George*
3. Tuckahoe School is a k‐8 school with 35 students enrolled in 8th grade. It is located near Southampton, Long Island.
4. Salem High School is a 7‐12 school with 44 students enrolled in 8th
grade. It is located about 24 miles east of Saratoga5. Whitesville Central School is a k‐12 school with 13 students enrolled in
8th grade. It is located outside of Genesse.*
*It should be noted that this school has less than 5% minority students enrolled

When looking at student proficiency, grade by grade,
there are very few schools that perform extraordinarily, so I decided to take a different
approach and look at the data in another way.

PERFORMANCE INDEXELA 3‐8

NYS Schools with Students in Grades 3‐8• In 2014 there appears to be a total of 3888 schools that house students in grades 3 through 8. Most schools run prek through 5 and then 6 through 8, but there are many combinations of this throughout the state.
• There are 204 charter schools within the 3888 schools. Charter schools are public schools which are privately funded. Students must apply to attend these schools. When charter schools are removed from the NYS list, there are 3684 schools remaining.
•Many schools in NYC are magnet schools or they house gifted programs, for which students must be tested. Students must apply to attend these schools. When you eliminate these schools from the rest, there are 3213 remaining.

PERFORMANCE INDEX (PI)• Performance Index is used by NYS to indicate how a group performed on a required state test for AYP purposes
• It has a value of 0 to 200
• It is calculated as follows: (only uses scores of continuously enrolled students)
The Number of students scoring at Levels 2, 3, and 4Plus the Number of students scoring at Levels 3 and 4Divided by the number of students Multiplied by 100

•The chart on the next slide shows the 2014 NYS 3‐8 schools’ Performance Index when combined with their Economically Disadvantage rate. •There are 3648 schools that have PI scores in NYS.


•The following chart shows the same data without the charter schools.•There are 3469 schools that have PI scores


•The following chart shows the same data without the charter schools, magnet schools, or gifted programs.•There are 3052 schools with PI scores
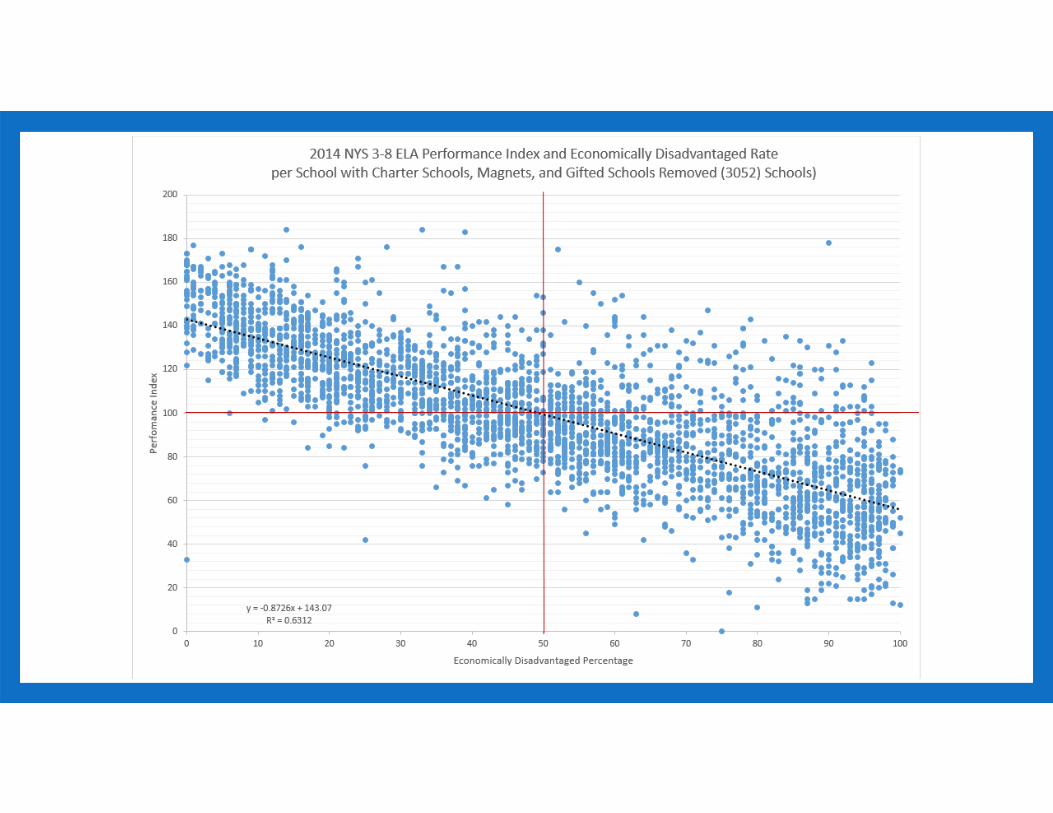

R‐Squared Value
Notice how the R‐Squared Value strengthens, showing that there are less outliers, as the charter schools and then the magnet/gifted programs are removed?
It is pretty clear that these schools do not perform in a similar manner as public schools which must take all students within their zones.
• All Schools = .52
•Without Charters = .56
•Without Charters, Magnets, and Gifted Programs = .63

• In addition, the average performance index for 3‐8 ELA in 2014 is 107.7. After removing Charter Schools, Magnet Schools, and Schools with Gifted Programs, it falls to 99.4. A difference of 8.3 points.
•All the schools in the upper right‐hand quadrant of the charts have a 50% or higher economically disadvantaged student rate and received at least a 100 for their performance indicator, meaning that all schools in this quadrant performed, at the very least, average.

Upper Right Hand Quadrant Schools
• On the third chart, after removing charter schools, magnet schools, and gifted programs, there are 257 schools in the upper right hand quadrant
• These schools have more than 50% economically disadvantaged students and achieved a PI of 100 or more.

So, Let’s Raise the Bar Above Average• If we keep the Economically Disadvantaged Rate at 50% or above, which significantly impacts a school, but raise the performance index to 120, which is above average, we end up with 68 schools on the list.
ANNSVILLE AREA SCHOOLCASSAVANT ELEMENTARY SCHOOL
DUTCH BROADWAY SCHOOL
PAKANASINK ELEMENTARY SCHOOLPS 100 THE CONEY ISLAND SCHOOLPS 101 THE VERRAZANOPS 102 THE BAYVIEWPS 107 THOMAS A DOOLEYPS 11 PURVIS J BEHANPS 112 LEFFERTS PARKPS 12 JAMES B COLGATEPS 127 MCKINLEY PARKPS 129 PATRICIA LARKINPS 131 ABIGAIL ADAMSPS 133PS 134PS 139 REGO PARKPS 152 GWENDOLYN N ALLEYNE SCHOOLPS 153 MASPETH ELEMENTARYPS 161 ARTHUR ASHE SCHOOL
PS 162 JOHN GOLDENPS 163 FLUSHING HEIGHTSPS 164 QUEENS VALLEYPS 165 EDITH K BERGTRAUMPS 171 PATRICK HENRYPS 172 BEACON SCHOOL OF EXCELLENCEPS 173 FRESH MEADOWPS 175 THE LYNN GROSS DISCOVERY SCHOOLPS 176 OVINGTONPS 186 DR IRVING A GLADSTONEPS 191 MAYFLOWERPS 199 FREDERICK WACHTELPS 206 JOSEPH F LAMBPS 207 ELIZABETH G LEARYPS 216 ARTURO TOSCANINIPS 22 THOMAS JEFFERSONPS 222 KATHERINE R SNYDERPS 232 LINDENWOODPS 24 ANDREW JACKSONPS 247PS 249 THE CATONPS 254 DAG HAMMARSKJOLDPS 255 BARBARA REING SCHOOLPS 26 RUFUS KING
PS 290PS 31 BAYSIDEPS 31 SAMUEL F DUPONTPS 38 GEORGE CROMWELLPS 380 JOHN WAYNE ELEMENTARYPS 39 FRANCIS J MURPHY JRPS 42 BENJAMIN ALTMANPS 54 CHARLES W LENGPS 58 SCHOOL OF HEROESPS 66 JACQUELINE KENNEDY‐ONASSISPS 69 JACKSON HEIGHTSPS 69 JOURNEY PREP SCHOOLPS 69 VINCENT D GRIPPO SCHOOLPS 83 LUIS MUNOZ RIVERAPS 84PS/IS 113 ANTHONY J PRANZOPS/IS 295PUTNAM CENTRAL SCHOOLROSA PARKS SCHOOL (THE)SCHROON LAKE CENTRAL SCHOOLSHERMAN ELEMENTARY SCHOOLSTATEN ISLAND SCHOOL OF CIVIC LEADERSHIP

Raise the Bar Again…
• If we keep the PI at 120 and move the economically disadvantaged percentage to 75%, we end up with a list of 19 Schools. This list shows Highest PI to Lowest.
PS 172 BEACON SCHOOL OF EXCELLENCE
PS 164 QUEENS VALLEY
PS 176 OVINGTON
PS 131 ABIGAIL ADAMS
PS 161 ARTHUR ASHE SCHOOL
PS 255 BARBARA REING SCHOOL
PS 163 FLUSHING HEIGHTS
PS 22 THOMAS JEFFERSON
ROSA PARKS SCHOOL (THE)
PS 12 JAMES B COLGATE
PS 129 PATRICIA LARKIN
PS 58 SCHOOL OF HEROES
PS/IS 295
PS 69 VINCENT D GRIPPO SCHOOL
STATEN ISLAND SCHOOL OF CIVIC LEADERSHIP
PS 127 MCKINLEY PARK
PS 66 JACQUELINE KENNEDY‐ONASSIS
PS 69 JOURNEY PREP SCHOOL
PS 83 LUIS MUNOZ RIVERA

A Study of the 21 Schools Indicates
•All the schools are located in NYC
•13 schools have an Asian population of at least 25%
•16 schools have a White population of 25% or lower
•16 schools have less than a 10% Black student population and only 1 school has more than 25% Black students (28%)

Why Does Ethnicity Matter?• The average Asian Student PI for the this group of schools is 142. Meanwhile, the average PI for All Students in these schools is 131. The Asian groups out performs the All Students group by 11 points.
• The average PI for Asian students in the entire state is 139; The average PI for Black students in the entire state is 75; a 64 point difference.
•When we take the scores into account for these groups of students, we must also take into account their subgroup percentages in certain schools, as the data shows more or less of these students can impact the average PI.

Narrowing the list even further:
• If we remove the schools that have 25% or more Asian students (because most of our schools do not have a large Asian student subgroup, and data shows they have a higher PI mean) we are left with 5 Schools:
1. PS 172 Beacon School of Excellence2. PS 66 Jacqueline Kennedy‐Onassis3. PS 69 Journey Prep School4. The Rosa Parks School5. Staten Island School of Civic Leadership

School Reviews

P.S. 172 Beacon School of Excellence• Located in the Sunset Park neighborhood of Brooklyn
• Houses pre‐K through 5th grade; student population of 600
• 90% Economically disadvantaged student population
• Performance Index of 178
• 4% Black, 79% Hispanic, 12% White, 4% Asian
• Very stable administration (principal has been there since the mid‐80s)
• Partners with Teachers College for literacy program
• http://www.nytimes.com/2010/04/26/education/26test.html?pagewanted=all&_r=0

P.S. 66 Jacqueline Kennedy Onassis• Located in the Richmond Hill part of Queens
• Houses pre‐K to 5th with a student population of 540 students
• 88% economically disadvantage students
• Performance Index of 120
• 7% Black, 67% Hispanic, 6% White, 18% Asian
• 25% ELL
• Stable administration – Principal has been there since 2001
• Each student gets 2 periods of Math and 3 periods of ELL each day
• 2x a week students who need more challenging work are pulled out for an enrichment program led by retired teachers
• There are no self‐contained special education classes

PS 69 Journey Prep School• Located in the Clason Point Neighborhood in the Bronx
• Houses grades PreK to 5, with 575 Students
• 91% economically disadvantaged
• Performance Index of 120
• 17% Black, 78% Hispanic, 1% White, 2% Asian
• Uniforms are required
• Reading programs utilized – Pearson Waterford Early Learning Program Digital Curriculum, JUMP Start Reading, Wilson Readin System, FUNdations, Fountas and Pinnell Reading Intervention, Read Works, OKAPI Flying Start to Literacy

P.S. 254 The Rosa Parks School• Located in the Richmond Hill area of Queens
• Houses grades pre‐K through 5 with a student population of 650
• 87% Economically disadvantaged
• Performance Index of 130
• 8% Black, 72% Hispanic, 7% White, 12% Asian

Staten Island School of Civic Leadership• Located in the Graniteville neighborhood of Staten Island
• Houses PreK through 8 with 850 Students enrolled
• 77% Economically disadvantaged
• Performance Index of 121
• 21% Black, 40% Hispanic, 26% White, 10% Asian

Digging Even Deeper…• If we remove the schools that have less than 10% in the Black Student Subgroup (which may or may not be different from our school), we are left with 2 Schools:
1. PS 69 Journey Prep School2. Staten Island School of Civic Leadership

Outside of NYC – Performance Index of at least 120 and Economically Disadvantage rate of 50% or more – 6 schools
1. Putnam Central School of Washington County ‐ 52% ED and 175 PI (31 Students)
2. Cassavant Elementary of Tompkins County ‐ 60% ED and 144 PI (85 Students)
3. Sherman Elementary of Jefferson County ‐ 65% ED and 129 PI (196) Students)
4. Annsville Area School of Oneida County – 70% ED and 125 PI (178 Students)
5. Schroon Lake Central School of Essex County – 55% ED and 123 PI (210 Stu)
6. Pakanasink Elementary School of Orange County ‐ 51% ED and 120 PI (439 Stu)

107 Schools in the Upper Right Quadrant outside of NYC
Putnam Central School
Cassavant Elementary
AnnsvilleArea School
Sherman Elementary School

BACK TO AVERAGE PROFICIENCY

Working with Average Proficiency on ELA Grades 3‐5 • All schools in this data must contain, at the minimum, grades 3, 4, and 5. This leaves out districts that may have 5th Grade in their middle schools.
• There are 2108 schools in NYS that have grades 3, 4, and 5 in them – 39 Schools are in the upper right quadrant
•Out of this group, 1935 are not charters or magnet schools – 12 Schools are in the upper right quadrant
•When the charters and magnet schools are removed, the R squared value increases from 48 to 56


Beacon School of Excellence

•The Average Proficiency Rating for the Non‐charter and Non‐magnet schools is 30 percent.
•The Average Proficiency Rating for the Non‐charter and Non‐magnet Schools that have a 50% or higher economically disadvantage rate is 20 percent.

The 12 High Performing Schools:• From Highest Average Proficiency Rate to Lowest:
• PS 172 Beacon School of Excellence• PS 191 Mayflower• PS 213 The Carl Ullman School• PS 100 The Coney Island School• PS 173 Fresh Meadow• PS 164 Queens Valley• PS 162 John Golden• PS 11 Purvis J. Behan• PS 222 Katherine R. Snyder• PS 247• PS 31 Samuel F. Dupont

There are no non‐NYC schools in the Upper Right Quadrant
• Only 45 non‐NYC schools with a 50% or greater economically disadvantaged rate are at or above the average rate of proficiency of 30%.
• There are only 2 schools outside of NYC with a 50% or greater economically disadvantaged rate that had an average proficiency rate of 40% or more, which is 10% above the average NYS non‐selective school rate.
1. Annsville Area School with a 70% ED rate and a 48% Average Proficiency 2. Sherman Elementary School with a 65% ED rate and a 43% Average
Proficiency

MATHBy proficiency in grades 3‐8

PS 172 BEACON SCHOOL OF EXCELLENCE
ROSA PARKS SCHOOL
PS 176 OVINGTON

There are 137 Schools in the Upper Right QuadrantThe top 10 outside of NYC are:
First Number after Name is Economic Disadvantage %, Second is Proficiency
BROOKFIELD CENTRAL SCHOOL 52 86MCCONNELLSVILLE ELEMENTARY SCHOOL 62 79CLEVELAND ELEMENTARY SCHOOL 63 78CASSAVANT ELEMENTARY SCHOOL 60 72G N CHAPMAN ELEMENTARY SCHOOL 54 71ANNSVILLE AREA SCHOOL 70 65CUBA‐RUSHFORD ELEMENTARY SCHOOL 57 65COHOCTON ELEMENTARY SCHOOL 62 64FORESTPORT ELEMENTARY SCHOOL 60 63NORTH BROAD STREET SCHOOL 67 61

PS 172 BEACON SCHOOL OF EXCELLENCE
PS 2 MEYER LONDONPS 173 FRESH MEADOW

There are 122Schools in the Upper Right QuadrantThe top 10 outside of NYC are:
First Number after Name is Economic Disadvantage %, Second is Proficiency
EDINBURG COMMON SCHOOL 63 76TIOGA ELEMENTARY SCHOOL 62 71CLEVELAND HILL ELEMENTARY SCHOOL 57 67TACONIC HILLS ELEMENTARY SCHOOL 58 64G N CHAPMAN ELEMENTARY SCHOOL 54 64BROOKFIELD CENTRAL SCHOOL 52 63A F PALMER ELEMENTARY SCHOOL / WINDSOR CENTRAL MIDDLE SCHOOL 50 62SCIO CENTRAL SCHOOL 67 61OWEGO ELEMENTARY SCHOOL 57 61WEST RIDGE ELEMENTARY SCHOOL 56 61

PS 172 BEACON SCHOOL OF EXCELLENCE
PS 31 SAMUEL F DUPONTPS 42 BENJAMIN ALTMAN
PS 163 FLUSHING HEIGHTS

There are 117 Schools in the Upper Right QuadrantThe top 10 outside of NYC are:
First Number after Name is Economic Disadvantage %, Second is Proficiency
NORTH BAY AREA SCHOOL 66 86DERUYTER ELEMENTARY SCHOOL 59 69FRANKLYN S BARRY SCHOOL 51 68NORTHERN ADIRONDACK ELEMENTARY SCHOOL 62 67WEST LEYDEN ELEMENTARY SCHOOL 56 67A F PALMER ELEMENTARY SCHOOL / WINDSOR CENTRAL MIDDLE SCHOOL 50 64TUSCARORA ELEMENTARY SCHOOL 83 63GERALDINE J MANN SCHOOL 59 60FLOYD BELL ELEMENTARY SCHOOL 54 59G N CHAPMAN ELEMENTARY SCHOOL 54 59

BRIDGEHAMPTON SCHOOL
PS 19 JUDITH K WEISS
PS/IS 113 ANTHONY J PRANZO

There are 39 Schools in the Upper Right QuadrantFirst Number after Name is Economic Disadvantage %, Second is Proficiency
BRIDGEHAMPTON SCHOOL 56 80PS 19 JUDITH K WEISS 56 80PS/IS 113 ANTHONY J PRANZO 67 70GREENPORT ELEMENTARY SCHOOL 70 68LIVERPOOL ELEMENTARY SCHOOL 52 67GOTHAM AVENUE SCHOOL 72 65PS 192 MAGNET SCHOOL FOR MATH AND SCIENCE INQUIRY 70 62CLARA H CARLSON SCHOOL 68 62OAKFIELD‐ALABAMA ELEMENTARY SCHOOL 53 62PS 152 GWENDOLYN N ALLEYNE SCHOOL 63 61TUSCARORA ELEMENTARY SCHOOL 83 60MINERVA CENTRAL SCHOOL 52 60PUTNAM CENTRAL SCHOOL 52 60MEMORIAL PARK ELEMENTARY SCHOOL 51 60PS 164 QUEENS VALLEY 78 59STATEN ISLAND SCHOOL OF CIVIC LEADERSHIP 77 59PS/MS 194 70 59G N CHAPMAN ELEMENTARY SCHOOL 54 59GENERAL HERKIMER ELEMENTARY SCHOOL 79 58MAYFIELD ELEMENTARY SCHOOL 50 58
PS 99 KEW GARDENS 68 57DUTCH BROADWAY SCHOOL 61 57PS 124 OSMOND A CHURCH 55 57PS 207 ELIZABETH G LEARY 51 57PS 219 PAUL KLAPPER 77 56PS 71 ROSE E SCALA 76 55PS 171 PATRICK HENRY 66 55COVERT AVENUE SCHOOL 56 55ABRAHAM WING SCHOOL 66 54KEESVILLE PRIMARY SCHOOL 52 54LAURENS CENTRAL SCHOOL 51 54PS 206 JOSEPH F LAMB 70 53WAYLAND‐COHOCTON MIDDLE SCHOOL 58 53ALICE E GRADY ELEMENTARY SCHOOL 52 53PS 37 MULTIPLE INTELLIGENCE SCHOOL 79 52AVOCA CENTRAL SCHOOL 54 52RIPLEY CENTRAL SCHOOL 72 51ST LAWRENCE MIDDLE SCHOOL 59 51FORT EDWARD SCHOOL 55 51

PS 206 JOSEPH F LAMB
STATEN ISLAND SCHOOL OF CIVIC LEADERSHIP
PS 219 PAUL KLAPPER

There are 9 Schools in the Upper Right QuadrantFirst Number after Name is Economic Disadvantage %, Second is Proficiency
PS 206 JOSEPH F LAMB 7072
STATEN ISLAND SCHOOL OF CIVIC LEADERSHIP 7771
PS 219 PAUL KLAPPER 7765
PS 226 ALFRED DE B MASON 8563
PS 164 QUEENS VALLEY 7859
PS/MS 4 CROTONA PARK WEST 9855
PS 163 BATH BEACH 8654
PS 171 PATRICK HENRY 6653
PS 19 JUDITH K WEISS 5651

JEFFERSON CENTRAL SCHOOL
PS/IS 295
PS 163 BATH BEACH

There are 10 Schools in the Upper Right QuadrantFirst Number after Name is Economic Disadvantage %, Second is Proficiency
JEFFERSON CENTRAL SCHOOL 57 65
PS/IS 295 8263
PS 163 BATH BEACH 8662
PS 206 JOSEPH F LAMB 7061
PAULA HEDBAVNY SCHOOL 7257
SCHROON LAKE CENTRAL SCHOOL 5557
PS 171 PATRICK HENRY 6655
PS 232 LINDENWOOD 6253
PS/MS 4 CROTONA PARK WEST 9851
LOWER MANHATTAN COMMUNITY MIDDLE SCHOOL 69
51

• There are several high‐performing, high‐ economically disadvantaged schools that continuously appear in the prior slides
• These schools might make for good studies, to find out what they are doing to achieve such results
• Since every school is a bit different, each administration must determine where the similarities and differences lie when comparing one of these schools to their own, asking the question, “Is it similar enough to my school that I might get the same results if I implement the same program/change?”