analysis and discussion of deepwater horizon accident · pdf fileanalysis and discussion of...
TRANSCRIPT

Analysis and Discussion of Deepwater Horizon Accident and Barrier Strategies
NTNU, Faculty of Engineering Science and Technology,Department of Marine Technology.
Nathalie M. De Oliveira
Jeevith Hegde

ContentsList of Figures 2
List of Tables 2
1 Introduction 41.1 Overview of topics . . . . . . . . . . . . . . . . . . . . . . . . . . . . . . . . . . . . . 41.2 Structure of report . . . . . . . . . . . . . . . . . . . . . . . . . . . . . . . . . . . . . . 4
2 Terminology and abbreviations 52.1 Terminology . . . . . . . . . . . . . . . . . . . . . . . . . . . . . . . . . . . . . . . . . 52.2 Abbreviations . . . . . . . . . . . . . . . . . . . . . . . . . . . . . . . . . . . . . . . . 5
3 Summary of the Macondo blowout 6
4 Discussion- failed barriers 74.1 Man Technology Organization (MTO) . . . . . . . . . . . . . . . . . . . . . . . . . . . 74.2 Energy flow perspective . . . . . . . . . . . . . . . . . . . . . . . . . . . . . . . . . . . 94.3 Comparison with similar accidents . . . . . . . . . . . . . . . . . . . . . . . . . . . . . 104.4 Comparison with the Texas City Refinery accident (2005) . . . . . . . . . . . . . . . . . 10
5 Proposed barrier strategies 115.1 Context . . . . . . . . . . . . . . . . . . . . . . . . . . . . . . . . . . . . . . . . . . . 115.2 Risk assessment . . . . . . . . . . . . . . . . . . . . . . . . . . . . . . . . . . . . . . . 115.3 Hazard identification . . . . . . . . . . . . . . . . . . . . . . . . . . . . . . . . . . . . 12
5.3.1 Preliminary hazard analysis (PHA) . . . . . . . . . . . . . . . . . . . . . . . . 125.3.2 Risk level picture . . . . . . . . . . . . . . . . . . . . . . . . . . . . . . . . . . 15
5.4 Risk treatment . . . . . . . . . . . . . . . . . . . . . . . . . . . . . . . . . . . . . . . . 165.5 Specific barrier strategy . . . . . . . . . . . . . . . . . . . . . . . . . . . . . . . . . . . 165.6 Performance requirements/standards . . . . . . . . . . . . . . . . . . . . . . . . . . . . 19
6 Conclusions 20
References 21
A Appendix- PHA Parameters 22A.1 Probability Classes . . . . . . . . . . . . . . . . . . . . . . . . . . . . . . . . . . . . . 22A.2 Severity Classes . . . . . . . . . . . . . . . . . . . . . . . . . . . . . . . . . . . . . . . 22
1

List of Figures1 MTO analysis for Macondo Blowout . . . . . . . . . . . . . . . . . . . . . . . . . . . . 72 Step diagram with MTO barrier perspective . . . . . . . . . . . . . . . . . . . . . . . . 83 Energy barrier perspective . . . . . . . . . . . . . . . . . . . . . . . . . . . . . . . . . 94 Barrier management in the planning phase [PSA, 2013] . . . . . . . . . . . . . . . . . . 115 Proposed barrier management- prevent accidents . . . . . . . . . . . . . . . . . . . . . 176 Proposed barrier management- mitigate consequences . . . . . . . . . . . . . . . . . . . 18
List of Tables1 Comparison of similar accidents . . . . . . . . . . . . . . . . . . . . . . . . . . . . . . 102 Hazard identification . . . . . . . . . . . . . . . . . . . . . . . . . . . . . . . . . . . . 123 Preliminary hazard analysis . . . . . . . . . . . . . . . . . . . . . . . . . . . . . . . . . 134 Preliminary hazard analysis (continued) . . . . . . . . . . . . . . . . . . . . . . . . . . 145 Initial risk matrix . . . . . . . . . . . . . . . . . . . . . . . . . . . . . . . . . . . . . . 156 Residual risk matrix . . . . . . . . . . . . . . . . . . . . . . . . . . . . . . . . . . . . . 157 Risk matrix colour legend . . . . . . . . . . . . . . . . . . . . . . . . . . . . . . . . . . 158 Barrier performance standard- functional level . . . . . . . . . . . . . . . . . . . . . . . 199 Barrier performance standard- element level . . . . . . . . . . . . . . . . . . . . . . . . 1910 Barrier performance standard- organization level . . . . . . . . . . . . . . . . . . . . . 2011 Probability classes . . . . . . . . . . . . . . . . . . . . . . . . . . . . . . . . . . . . . 2212 Severity classes . . . . . . . . . . . . . . . . . . . . . . . . . . . . . . . . . . . . . . . 22
2

PrefaceThis report is a mandatory task in the course TMR4555, Applied Risk Analysis. The group members areNathalie M. de Oliveira and Jeevith Hegde. Both members have worked together in all parts of the project.
The accident assigned to the pair was the Macondo Blowout of April 2010. Even though environmental,economic and reputation losses were hefty in this event, the team chose to focus on issues related topersonnel safety. This decision was made in order to keep the work scope manageable.
MTO and energy flow perspectives were used to analyze the accident. Barrier failures were classifiedbased on technical, human and organizational. Barrier failures in the interface between human and or-ganizational aspects amounted to high number and therefore received attention when designing a newbarrier strategy.
The new barrier strategy proposed included man, technology and organization barriers and listed theirperformance requirements. The team hopes to have achieved compliance with PSA’s demands on de-signing barriers and a continuous barrier management process.
The team would like to acknowledge Professor Jan.Erik. Vinnem for his continued assistance and forsharing his knowledge with the class on the subject of Offshore Risk Assessment. The image for the titlepage is credited to [Ideum - ideas + media, 2010].
A famous quote from the character Uncle Ben in the comic Spiderman reads, “With great power comesgreat responsibility” . The Macando well would have been one of the deepest offshore wells ever com-pleted, but the stakeholders involved in this accident failed to foresee the fatal accident propagation. Astrivial as it may sound, this quote summarizes the lack of top level management focus of the stakeholderson safety.
3

1 Introduction
1.1 Overview of topicsThe list of greatest human engineering accomplishments is long. From building the huge pyramids in an-cient Egypt, to sending men to the moon or exploring the depths of the ocean, deeds have been executedby groups of engineers and other professionals that awe us. But oftentimes these mind blowing projectsend up costing us much more than we were willing to pay, mainly when consequences are difficult totranslate to monetary units, being cashed out on the environment or in lives that are lost.
Nonetheless, we believe most of these unwanted losses can be avoided if a proper barrier managementsystem is implemented. The objective of the barrier management system is to isolate what we hold valu-able from potential threats.
Deepwater Horizon, an ultra-deepwater semi-submersible offshore oil drilling rig built in 2001, owned byTransocean and working for BP in its last mission, had an inadequate Barrier Strategy for the Macondodrilling project. The consequence summed up to 11 deaths, 17 major injuries, sinking of the rig andmassive environmental damage from estimated 5 million barrels of released hydrocarbons [CSB, 2014].In the year previous to their accident, Deepwater horizon had drilled down to 10.5 km, the deepest oiland gas well in the world. A great achievement followed by a terrible fall.
But what was inappropriate in Deepwater Horizon’s Barrier Strategy? Which barriers failed and whatcould have been done differently to achieve another outcome? In an accident with the Macondo Blowoutmagnitude, it is a challenge to answer these questions with the certainty that all possible aspects havebeen regarded. In this work, the aim is to address some of the most relevant barrier failures, as well as tosuggest barriers that could have been implemented to avoid the accident.
We noted that by far the two notions "Safety Culture must be rooted with top management" and "BarrierManagement must be a continuous process, keeping pace with changes occurring in the execution phaseof the project in opposition to a static safety strategy designed in the planning stage and never updated",are the most valuable changes that should be implemented in the organizations involved in this accidentand overall over the entire Oil and Gas industry.
1.2 Structure of reportThis report analyzes the Macondo accident and the Barrier Strategy that was in place when the accidenthappened. It also discusses what could have been different in order to minimize the escalation of theoutcome or even interrupt the chain of events that caused the blowout.
The report will follow the risk for the people perspective, meaning the more than 80 days of oil spillafter the sinking of the rig a, before the definitive shut down of the well, and the environmental damageare outside the scope of this report. We choose to limit the analysis of the accident up to the rescue ofpersonnel not because the 5 million barrels of oil [Vinnem, 2014, The Deepwater Horizon Study Group(DHSG), 2011, CSB, 2014] reported to spill is of small importance, but to keep this work within a feasi-ble outline for the Risk Analysis course, taught by Professor Vinnem. Section 3 starts with a condensedpresentation of the accident chronology.
4
Section 4 starts by presenting barriers which failed and why, from a technical perspective, following theenergy flow perspective and MTO perspective. This analysis then evolves to include human and organi-zational aspects relevant to discussed failures that permitted the accident to escalate to the point where 11deaths and 17 injuries occurred. This part concludes with comparison of other similar accidents in termsof causes and consequences.
Section 5 proposes specified barrier strategy based on the failure of barrier functions revealed in the pre-vious section. The section 6 concludes the report.
2 Terminology and abbreviations
2.1 TerminologyIt is not unusual that different terms are used interchangeably across the oil and gas industry when de-scribing the topic of safety barriers. The definitions of barrier terminologies in this report is refereedfrom [Sklet, 2006].
Safety barriers- are physical and/or non-physical means planned to prevent, control, or mitigate unde-sired events or accidents.
Barrier function- is a function planned to prevent, control, or mitigate undesired events or accidents.
Barrier system- is a system that has been designed and implemented to perform one or more barrier func-tions.
Barrier element- A barrier element is a component or a subsystem of a barrier system that by itself is notsufficient, to perform a barrier function [Sklet, 2006].
2.2 Abbreviations
ALARP As Low As Reasonably PracticableBOP Blowout PreventerDHSG The Deepwater Horizon Study GroupEDS Emergency Disconnect SystemESD Emergency ShutdownHC HydrocarbonLMRP Lower Marine Riser PackageMTO Man Technology OrganizationNCS Norwegian Continental ShelfOIM Offshore Installation ManagerPSA Petroleum Safety AuthoritySIL Safety Integrity LevelTD Total Depth
5

3 Summary of the Macondo blowoutThe Macondo well-blowout accident resulted in 11 personnel fatalities, 17 personnel injuries, an esti-mated 5 million barrels of oil spilled, and vast environment pollution. [Vinnem, 2014, The DeepwaterHorizon Study Group (DHSG), 2011, CSB, 2014]
The accident progression of the Macondo well blowout began in late 2009 when hurricane Ida passedthe Mexican gulf damaging the Marinas rig. In January 2010, BP replaced the Marinas rig with theDeepwater Horizon rig from Transocean. When the exploration drilling resumed in February, a leak wasidentified in the yellow pod of the Blow-Out Preventer (BOP), subsequently the redundant blue pod re-duced the leak. However, insufficient charge in the blue pod battery was discovered during investigations.While drilling in depth of 13305 ft, influx of formation fluids were noticed and the drill pipe and welllogging tools were stuck. Drilling continued by well sidetracking operation. Two lost circulation inci-dents occurred in early April at depths of 18260 and 18360 feet. In both instances, the well was stabilizedby pumping lost-circulation fluids. At the total depth (TD) of 18360 ft, BP decided to terminate furtherdrilling citing unnecessary jeopardizing of the well bore.
BP chose to use the long string casing completion design and Haliburton was contracted to perform thecementing job. BP requested Halliburton to use 6 centralizers for the cementing job against BP’s originalplan of using 21 centralizers. The long string casing completion design was installed with 6 centralizers.On April 18th, BP attempted to circulate the well to plug the float collar or the reamer shoe. It took BPnine attempts before the float collar was converted at a pressure of 3142 psi. This high pressure requiredfor the operation, raised concerns about blockages in the reamer shoe, breakdown of surrounding wellformations and that the float collar may not have been converted as thought. Due to BP engineers fearsof wash-out at the weak formations, BP decided to carry out a partial bottoms-up circulation of the well.Partial bottoms-up circulation meant that any hydrocarbons remaining in the bore could linger in the up-per part of the well after cementing.
On 20th April, pressure monitoring observed the floats to be holding and the well in static state. BPplanned to start the temporary abandonment procedure consisting of positive pressure test, negative pres-sure test, displacing drilling mud in the riser, setting cement plug, pressure testing cement plug integrity,performing impression test, and installing lockdown sleeve.
The crew carried out two different positive pressure and negative pressure tests, which were performedless than 48 hours after the cementing job in the bottom of the well. Simultaneous operations (displacingmud, pressure testing, trip tank cleaning, offloading mud to support vessel) meant that the crew was un-able to monitor the mud pit levels. This also meant that the crew was unaware as to the amount of mudlost during displacement/flushing operations. There was more backflow than anticipated during the thefirst negative test and personnel at BP and Transocean had different interpretations of the results, whichled to an agreement for a second negative pressure test. The second negative pressure test was acceptedeven after abnormalities were found in terms of backflow in the drill pipe. The pressure in the drill pipeincreased and decreased several times.
The sea water was pushed into the drill derrick which was followed by uncontrolled flow of drilling mud.The crew diverted the hydrocarbon flow to the mud-gas separator, which was not designed to containhuge volumes of gas flowing through the well. Emergency systems failed to perform their function. Dueto the latent failure in the BOP control pod’s the emergency disconnect system (EDS) was not able to
6

disconnect the Lower Marine Riser Package (LMRP). Two explosions occurred in quick succession anda mayday call was made by the crew. The decision to evacuate the platform was made. Some crewmembers jumped to sea and others mustered around the lifeboats. The evacuation process was chaotic,but 115 on board managed to be rescued.
For the next 83 days BP and partners made a series of attempts to stop flow of hydrocarbons into the Gulfof Mexico and after 10 different attempts were able to kill and seal the Macondo well.
4 Discussion- failed barriers
4.1 Man Technology Organization (MTO)A step diagram of the Deepwater Horizon accident was constructed to identify key events and failed bar-riers leading to the accident. The illustration (Figure 2) depicts the failure in barriers during the accident.Accident causation theories such as, the domino theory, swiss cheese model and energy flow theoriescan be observed in this accident. To analyze the failure of barriers, an MTO perspective was chosen incombination with the step diagram as seen in Figure 2.
The scope for this analysis was selected to encompass key events leading to the Macondo accident. Acolor coding system is used to illustrate man, technology, and organizational barriers which failed duringthe accident progression.
Man
Organization
Technology
2
0
3
5
3
1
2
Figure 1: MTO analysis for Macondo Blowout
The results from the step diagram were further incorporated to setup a venn-diagram of MTO failedbarriers refer Figure 1. The results show that failures in the intersection of man and organizational barriersare higher in number than other categories. The combination of man and organization resulted in sixfailed barriers. Choice of long string completion, MMS approval to use single string completion, use of 6centralizers, incomplete bottoms up operations, early pressure testing, and alarm software disconnected.
7

Loss
of
Cir
cula
tio
n a
t 1
826
0ft
and
1
836
0ft
- St
op
pe
d D
rilli
ng
BP
Act
ors
Events
Halliburton TransoceanMinerals
Management Services
Mar
inas
ch
ang
ed t
o
Dee
pw
ate
r H
ori
zon
BO
P:
Leak
in
yello
w P
od
Feb
ruar
y 20
10M
arch
20
10
Ap
prov
ed S
ingl
e Lo
ng
strin
g ca
sin
g de
sign
Ap
ril 2
010
Ch
oic
e o
f Lo
ng
Str
ing
C
asin
g t
o c
om
ple
te t
he
wel
l.
Ap
ril 9
20
10A
pri
l 12
201
0A
pri
l 15
20
10
6 C
en
tral
ize
rs
inst
alle
d
Ap
ril 1
6
2010
Dec
isio
n t
o u
se 7
C
en
tral
ize
rs
An
aly
zed
7
C
en
tral
ize
rs d
esi
gn
Re
po
rt is
sue
d t
o B
P
wit
h c
on
cern
s o
n
nu
mb
er
of
cent
rali
zer
use
d se
nt
afte
r ce
me
nti
ng
Ap
ril 1
8
2010
Ap
ril 1
9
2010
Inco
mpl
ete
B
ott
om
s U
p
op
erat
ion
s
Ap
ril 2
0
2010
Ear
ly P
resu
rre
Tes
tin
g. B
efo
re
Ce
me
nt
Sett
ing
.
Sim
ult
ane
ou
s O
pe
rati
on
s
Dif
fere
nt
Ite
rpre
tati
on
of
Tw
o N
ega
tive
P
ress
ure
Te
st
We
ll K
ick
Red
irec
ted
G
as to
Se
para
tor
13:2
8 H
ours
20:0
0 H
ours
21:4
5 H
ours
Ou
tage
of
Po
we
rE
xplo
sio
n 1
an
d 2
Ala
rm
Soft
war
e D
isco
nn
ect
ed
ED
S
Mal
fun
ctio
n
Man
Org
an
iza
tion
Tech
nol
ogy
Bar
rier
Leg
end
21:4
9 H
ours
21:5
2 H
ours
Un
con
tro
lled
HC
Le
ak
Ben
din
g o
f D
rill
Pip
e
Figu
re2:
Step
diag
ram
with
MTO
barr
ierp
ersp
ectiv
e
8

4.2 Energy flow perspectiveThe energy flow principle was used to demonstrated the flow of excess energy from the potential source-the reservoir to the vulnerable target- the crew members and topside structure. Together with the energybarrier principle, other accident propagation theories such as the domino theory and the swiss cheesemodel also provide theoretical background in this analysis.
From Figure 3, it is observed that the accident causation models mentioned above can be illustrated as thefailed barriers in the Macondo blowout. The study assumed the Macondo blowout event to be the mainaccidental event. This event occurred because the physical barriers did not operate as they should havedue to man, technology, and organizational factors. Subsequently, the flow of energy progressed from thereservoir to the topside facility. The barriers established to protect the crew and the topside facility werefurther weakened by failure of additional MTO barriers such as gas detection, fire deluge, and evacuationsystems/process.
In majority of failed barriers, organization factors played a vital role in the accident. Choosing the lessprotective casing design, using less number of centralizers, pressure testing sooner than the cement settingtime, inadequate quality in maintenance of equipment- BOP and topside gas detection systems, disablingalarm functions of the fire and gas detection/fighting systems, and chaotic evacuation process all of whichcontributed to the increased severity of the accident.
Barrier Legend
Macondo Blowout
Man
Organization
Technology
Single String Completion Casing
Wel
lhea
d S
eal
Cho
ice
of S
ingl
e St
ring
Cas
ing
Blow Out Preventer
Shea
r R
am
s
An
nula
r Pr
even
tors
Pipe
Ram
s
BO
P
Cer
tifi
cati
on
Pressure Testing
Test
ing
afte
r C
emen
t Se
t
Val
ida
te T
est
R
esul
ts
Centralizers
Inte
rnal
C
omm
unic
atio
n
Val
idat
e R
esu
ltsEnergy
Flow
HC Detection and Mitigation
Mai
nte
nan
ce o
f F&
G B
arri
ers
Explosion
Fire
& G
as
De
tect
ion
Emer
gen
cy
Pre
pa
red
ne
ss
Red
irec
tio
n of
HC
Ala
rm a
nd
Del
uge
Sy
stem
s
Fire
Fig
htin
g Sy
ste
m
Evacuation
Energy Flow
Figure 3: Energy barrier perspective
9

4.3 Comparison with similar accidents[Vinnem, 2014] presents a table that compares similar accidents focusing on barrier functions and how/ifthey worked for each accident. From the presented set of accidents involving blowouts, three had severeconsequence for life. Table 1 presents comparison of the Macondo blowout accident with the Usumacintaand Enchova blowout accidents.
Table 1: Comparison of similar accidentsSl. No. Facts of Accident Macondo 2010 Usumacinta 2007 Enchova 1984
1 Initiating event High pressures in the wellbore andformation
Bad weather Unknown
2 Accident Progression During work for abandonment ofthe well, a kick occurred that esca-lated to a blowout, with two big ex-plosions, outage of power and sink-ing of the rig with a leaking well
While finishing to drill a well for asmall production platform, a stormapproached. The drilling platformwas moved and struck the top of aproduction valve tree on the fixedplatform, resulting in leaking of oiland gas. Safety valves were acti-vated but unable to seal completely.Personnel died during evacuation ofthe platform.
During a drilling activity a gas leakcaused a fire to start. This first firewas controlled, and a second fire,from a oil leak, occurred and lasteduntil the following day. Personneldied during evacuation of the plat-form.
3 Fatalities 11 of 126 (9%) 22 of 81 (27%) 42 of 249 (17%)
It is interesting to observe that in the previous two blowouts deaths occurred during the evacuation pro-cess in the installation, and Macondo’s accident investigations lead us to believe that no lives were lostduring this process.
One could infer that Transocean had better evacuation procedures than PEMEX (Usumacinta) or Petro-bras (Enchova). Even though it was reported that a split chain of command between the Offshore In-stallation Manger (OIM) and the captain confused some of the crew members during the evacuation inDeepwater Horizon, no fatalities resulted during the evacuation stage [Vinnem, 2014, The DeepwaterHorizon Study Group (DHSG), 2011].
4.4 Comparison with the Texas City Refinery accident (2005)BP’s Texas City Refinery explosion claimed 15 lives and injured more than 170 people.
Although this accident and Macondo Blowout aren’t strictly similar, a parallel can be draw in the underly-ing causes of both events. To start, both accidents were considered avoidable if BP had taken appropriatemeasures (BP was identified as the main responsible). The lack of a safety culture geared towards systemsafety instead of only focusing to avoid labor accidents was also common to both events. The lack ofappropriate maintenance in the level transmitters of the knockout drum and of the slitter tower, leadingto malfunction, resembles the inadequate inspection of the BOP pods, previous to its installation in Ma-condo. Lastly, the refinery operator decision to ignore the high level alarm and continue to fill in thetower with hydrocarbons (BP Texas City Refinery) reminds us of BP’s decision to proceed with the wellabandonment procedure even though the pressure test result indicated something was amiss in the well(Macondo well). In both cases, there was pressure to complete work as fast as possible, that is, pressureto cut costs [CSB, 2007, The Deepwater Horizon Study Group (DHSG), 2011].
10

5 Proposed barrier strategiesFrom the previous sections it is observed that a barrier strategy management is vital to avoid risk ofmajor accidents. The barrier strategies can be developed at different levels such as, man, technology, andorganization. The Petroleum Safety Authority (PSA) in Norway has in the past focused on developing aframework for building a barrier strategies [PSA, 2013]. Figure 4 is the framework suggested by PSA todevelop specific barrier strategies and corresponding performance standards for the barriers.
Figure 4: Barrier management in the planning phase [PSA, 2013]
The PSA barrier management framework was utilized in this study to develop barrier strategies. Thesubsections describe the method in detail.
5.1 ContextIn relation to the Macondo blowout, the study was limited to risk of blowout during drilling operationsat offshore installations. The study assumed that such an accident can re-occur in the Norwegian Con-tinental Shelf (NCS) and the PSA regulations were referred for requirements on various contexts suchas safety functions, fire and explosion protection systems, competence and training, and evacuation pro-cess [Petroleum Safety Authority Norway- PSA, 2014].
5.2 Risk assessmentThe risk assessment process mentioned in the barrier management framework is a four step process.The first step is to identify hazards in and to the system. The second step is to control the hazards byidentifying barrier functions, elements and performance requirements. The third step is to perform a
11

qualitative or quantitative risk analysis of the system. The final step is to asses and evaluate the risks andpresent a risk picture [PSA, 2013].
5.3 Hazard identificationHazard identification was carried out through a brainstorming session and by focusing on failed MTObarriers in Macondo blowout. The hazard identification was organized on basis of the checklist providedin [Rausand, 2011](page 67). The identification was limited to a blowout scenario and correspondingfire, explosion, and evacuation related hazards. Table 2 presents the generic hazards identified for thesafety case.
Table 2: Hazard identificationSL. No. Generic Hazard Hazard1 Mechanical hazards High/unstable pressure in the well
StabilityDegradation of equipment
2 Dangerous materials Flammable3 Thermal hazards Flame
ExplosionPersonnel exposed to high temperature and heat radiation
4 Organizational hazards Safety cultureLess than adequate maintenanceLess than adequate competenceCrowd control
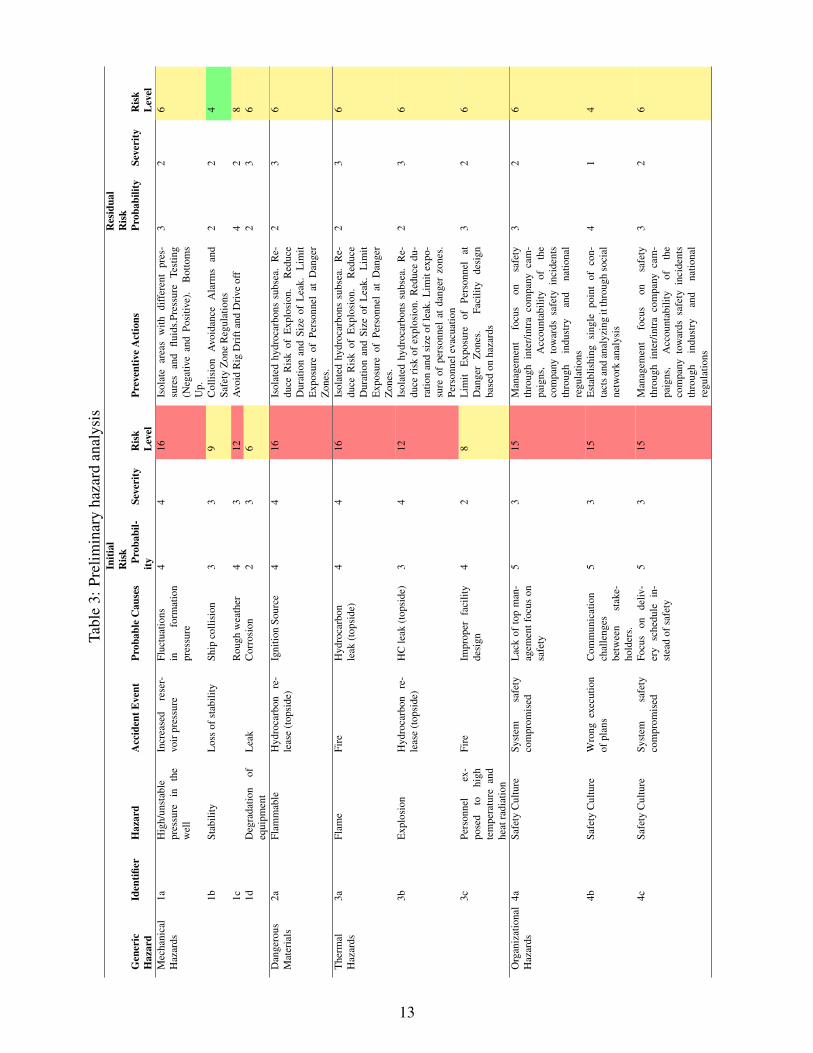
5.3.1 Preliminary hazard analysis (PHA)
A PHA was carried out with the process as described in [Rausand, 2005]. Barrier functions and elementswere introduced as preventive measures to reduce the risk of a blowout. Both existing risk level withoutproposed barriers and residual risk with proposed barriers were assessed. The preventive actions wereutilized to also develop proposed barrier strategy as discussed in Section 5.
Table 3, 4 presents the PHA worksheet with existing risk level and residual risk level. Table 5, 6 presentthe corresponding initial and residual risk picture.
12
Tabl
e3:
Prel
imin
ary
haza
rdan
alys
isIn
itial
Ris
kR
esid
ual
Ris
kG
ener
icH
azar
dId
entifi
erH
azar
dA
ccid
entE
vent
Prob
able
Cau
ses
Prob
abil-
itySe
veri
tyR
isk
Lev
elPr
even
tive
Act
ions
Prob
abili
tySe
veri
tyR
isk
Lev
elM
echa
nica
lH
azar
ds1a
Hig
h/un
stab
lepr
essu
rein
the
wel
l
Incr
ease
dre
ser-
voir
pres
sure
Fluc
tuat
ions
info
rmat
ion
pres
sure
44
16Is
olat
ear
eas
with
diff
eren
tpr
es-
sure
san
dflu
ids.
Pres
sure
Test
ing
(Neg
ativ
ean
dPo
sitiv
e).
Bot
tom
sU
p.
32
6
1bSt
abili
tyL
oss
ofst
abili
tySh
ipco
llisi
on3
39
Col
lisio
nA
void
ance
Ala
rms
and
Safe
tyZ
one
Reg
ulat
ions
22
4
1cR
ough
wea
ther
43
12A
void
Rig
Dri
ftan
dD
rive
off
42
81d
Deg
rada
tion
ofeq
uipm
ent
Lea
kC
orro
sion
23
62
36
Dan
gero
usM
ater
ials
2aFl
amm
able
Hyd
roca
rbon
re-
leas
e(t
opsi
de)
Igni
tion
Sour
ce4
416
Isol
ated
hydr
ocar
bons
subs
ea.
Re-
duce
Ris
kof
Exp
losi
on.
Red
uce
Dur
atio
nan
dSi
zeof
Lea
k.L
imit
Exp
osur
eof
Pers
onne
lat
Dan
ger
Zon
es.
23
6
The
rmal
Haz
ards
3aFl
ame
Fire
Hyd
roca
rbon
leak
(top
side
)4
416
Isol
ated
hydr
ocar
bons
subs
ea.
Re-
duce
Ris
kof
Exp
losi
on.
Red
uce
Dur
atio
nan
dSi
zeof
Lea
k.L
imit
Exp
osur
eof
Pers
onne
lat
Dan
ger
Zon
es.
23
6
3bE
xplo
sion
Hyd
roca
rbon
re-
leas
e(t
opsi
de)
HC
leak
(top
side
)3
412
Isol
ated
hydr
ocar
bons
subs
ea.
Re-
duce
risk
ofex
plos
ion.
Red
uce
du-
ratio
nan
dsi
zeof
leak
.Lim
itex
po-
sure
ofpe
rson
nel
atda
nger
zone
s.Pe
rson
nele
vacu
atio
n
23
6
3cPe
rson
nel
ex-
pose
dto
high
tem
pera
ture
and
heat
radi
atio
n
Fire
Impr
oper
faci
lity
desi
gn4
28
Lim
itE
xpos
ure
ofPe
rson
nel
atD
ange
rZ
ones
.Fa
cilit
yde
sign
base
don
haza
rds
32
6
Org
aniz
atio
nal
Haz
ards
4aSa
fety
Cul
ture
Syst
emsa
fety
com
prom
ised
Lac
kof
top
man
-ag
emen
tfoc
uson
safe
ty
53
15M
anag
emen
tfo
cus
onsa
fety
thro
ugh
inte
r/in
tra
com
pany
cam
-pa
igns
,A
ccou
ntab
ility
ofth
eco
mpa
nyto
war
dssa
fety
inci
dent
sth
roug
hin
dust
ryan
dna
tiona
lre
gula
tions
32
6
4bSa
fety
Cul
ture
Wro
ngex
ecut
ion
ofpl
ans
Com
mun
icat
ion
chal
leng
esbe
twee
nst
ake-
hold
ers.
53
15E
stab
lishi
ngsi
ngle
poin
tof
con-
tact
sand
anal
yzin
git
thro
ugh
soci
alne
twor
kan
alys
is
41
4
4cSa
fety
Cul
ture
Syst
emsa
fety
com
prom
ised
Focu
son
deliv
-er
ysc
hedu
lein
-st
ead
ofsa
fety
53
15M
anag
emen
tfo
cus
onsa
fety
thro
ugh
inte
r/in
tra
com
pany
cam
-pa
igns
,A
ccou
ntab
ility
ofth
eco
mpa
nyto
war
dssa
fety
inci
dent
sth
roug
hin
dust
ryan
dna
tiona
lre
gula
tions
32
6
13

Tabl
e4:
Prel
imin
ary
haza
rdan
alys
is(c
ontin
ued)
Initi
alR
isk
Res
idua
lR
isk
Gen
eric
Haz
ard
Iden
tifier
Haz
ard
Acc
iden
tEve
ntPr
obab
leC
ause
sPr
obab
il-ity
Seve
rity
Ris
kL
evel
Prev
entiv
eA
ctio
nsPr
obab
ility
Seve
rity
Ris
kL
evel
Org
aniz
atio
nal
Haz
ards
4dSa
fety
Cul
ture
Pers
onne
lsa
fety
com
prom
ised
Com
plac
ent
attit
ude
tow
ards
safe
ty
52
10M
anag
emen
tfo
cus
onsa
fety
thro
ugh
inte
r/in
tra
com
pany
cam
-pa
igns
,E
stab
lishi
ngco
ntin
uous
impr
ovem
ent
safe
tydr
ive
inth
eco
mpa
ny
32
6
4eSa
fety
Cul
ture
Syst
emsa
fety
com
prom
ised
Ove
rloo
king
pos-
sibi
lity
ofm
ajor
acci
dent
s
53
15M
anag
emen
tfo
cus
onsa
fety
thro
ugh
inte
r/in
tra
com
pany
cam
-pa
igns
,A
ccou
ntab
ility
ofth
eco
mpa
nyto
war
dssa
fety
inci
dent
sth
roug
hin
dust
ryan
dna
tiona
lre
gula
tions
32
6
5aL
ess
than
adeq
uate
mai
n-te
nanc
e
Proj
ectd
elay
Focu
son
deliv
-er
ysc
hedu
lein
-st
ead
ofsa
fety
53
15M
anag
emen
tfo
cus
onsa
fety
thro
ugh
inte
r/in
tra
com
pany
cam
-pa
igns
,A
ccou
ntab
ility
ofth
eco
mpa
nyto
war
dssa
fety
inci
dent
sth
roug
hin
dust
ryan
dna
tiona
lre
gula
tions
32
6
5bSy
stem
safe
tyco
mpr
omis
edL
owqu
ality
au-
dits
(cer
tifica
tion)
44
16A
ccou
ntab
ility
ofth
eco
mpa
nyto
-w
ards
safe
tyin
cide
nts
thro
ugh
in-
dust
ryan
dna
tiona
lreg
ulat
ions
42
8
5cPr
ojec
tde
lay,
Syst
eman
dpe
rson
nel
safe
tyco
mpr
omis
ed
Cos
tcu
tting
inop
erat
ions
42
8R
e-op
timiz
em
aint
enan
ceco
sts
31
3
5dL
ess
than
adeq
uate
com
-pe
tenc
e
Wro
ngde
cisi
onm
akin
gL
ack
oftr
aini
ngan
dex
peri
ence
ofpe
rson
nel
43
12In
vest
men
tin
trai
ning
pers
on-
nel.
Inve
stm
ent
inm
ento
ring
prog
ram
mes
.H
irin
gco
mpe
tent
pers
onne
l.Sh
arin
gle
sson
sle
arne
dto
othe
rcom
pani
es
22
4
5eW
ork
over
load
Lac
kof
pers
onne
l3
412
Hir
ing
com
pete
ntpe
rson
nel
base
don
proj
ect
fore
cast
s.O
utso
urci
ngw
ork
toco
nsul
tant
com
pani
es
32
6
5fC
row
dC
ontr
olM
anov
erbo
ard
Cri
tical
pro-
cess
/pro
cedu
reva
riat
ions
33
9Ti
mel
yce
rtifi
catio
nan
dm
aint
e-na
nce
ofsa
fety
criti
cal
syst
ems,
Plan
sfo
rem
erge
ncy
prep
ared
ness
base
don
faci
lity
desi
gn.
22
4
5gea
rly
laun
chof
life
craf
tsIm
prop
erev
acua
-tio
npr
oced
ure
34
12Pl
ans
for
Em
erge
ncy
Prep
ared
ness
base
don
faci
lity
desi
gn2
24
14

5.3.2 Risk level picture
From Table 3 and 4 a risk picture was established in a 4 X 5 risk matrix. The risk matrix is based on theALARP principle along with classification inputs from [Rausand, 2005]. The classification of probabilityand severity classes are provided in Appendix A of the report. Table 7 provides the color legend for the4 X 5 risk matrix.
Initial risk matrix- The results from the initial risk matrix show 15 hazards, which fall under the notacceptable limits of the ALARP principle. While 5 hazards fall under the acceptable zone of the ALARPprinciple.
Table 5: Initial risk matrixFrequency/Consequence
1-Very Unlikely 2-Remote 3-Occasional 4-Probable 5-Frequent
4-Catastrophic 3b, 5e, 5g 1a, 2a, 3a, 5b
3-Critical 1d 1b, 5f 1c, 5d 4b, 4c, 4e, 5a
2-Major 3c, 5c 4a, 4d
1-Minor
Residual risk matrix- Residual risk matrix demonstrates the risk reduction achieved by introduction ofrisk reducing measures (preventive actions). In other words, the residual risk is the risk left over after theintroduction of risk reducing measures.The results from the residual risk matrix show a reduction in risklevel. 16 hazard items fall under the acceptable zone of the ALARP principle, but these risks can furtherbe reduced by introducing additional preventive actions. While 5 hazard items fall under the acceptablezone of the ALARP principle.
Table 6: Residual risk matrixFrequency/Consequence
1-Very Unlikely 2-Remote 3-Occasional 4-Probable 5-Frequent
4-Catastrophic
3-Critical 1d, 2a, 3a, 3b, 5b
2-Major 1b, 5d, 5g 1a, 3c, 4a, 4c, 4d,4e, 5a, 5e, 5f
1c
1-Minor 5c 4b
Table 7: Risk matrix colour legendColour Legend
Not Acceptable- Risk reduction required
Acceptable using ALARP. Consider further risk reduction.
Acceptable.
15

5.4 Risk treatmentOne of the steps in the PSA barrier management framework is to evaluate need for further risk treatmentafter introducing the preventive actions. In the current study, the residual hazards in the system were aslow as reasonably practicable- ALARP. Therefore, the study continued with the next stage- developingspecific barrier strategy to avoid recurrence of such accidents in the future. The next subsection describesthe barrier functions, sub functions and elements.
5.5 Specific barrier strategyAccording to [PSA, 2013], the setup of barrier management for the offshore industry consists of the fol-lowing steps: the risk picture identifies risks that need reduction; the reduction of these risks is achievedby implementation of barrier functions; barrier functions must be further specified down to barrier ele-ments; to be manageable, these functions or elements need to be measured or evaluated in some way, andthe way to do it is do define which requirements they need to fulfill.
In this section we present the selected barrier functions and elements, both to decrease the probabilitythat an accident may occur, in Figure 5 and to decrease the consequence in case an accident occurs, inFigure 6. Later, in section 5.6 performance requirements/standards, the requirements are presented.
Figure 5 can be roughly divided in two parts, one part where a block diagram presents technical barriers,and the second part where a green rectangle presents man and organizational barriers. These barriers areconnected to the risk picture presented in tables 3 and 4. The same is valid for Figure 6. While technicalbarriers presented in both figures were already in place in Deepwater Horizon albeit containing failures,some of the suggested man and organizational barriers were not part of their barrier strategy in the timeof the accident.
16

Red
uce
Pro
bab
ility
of
Hyd
roca
rbo
n L
eak
fro
m t
he
Wel
l
Iso
late
are
as w
ith
diff
eren
t pr
essu
res
and
flu
ids.
Pr
even
t co
llaps
ing
and
leak
of
wel
l fo
rmat
ion
. R
egu
late
flo
w o
f H
ydro
carb
ons
Kill
th
e w
ell
Avo
id R
ig D
rift
and
Dri
ve o
ff
Avo
id
Ext
ern
al S
hip
C
ollis
ion
Iso
late
d h
ydro
carb
ons
subs
ea.
Ris
ers
BO
PC
asin
gC
asin
gC
entr
aliz
ers
Dri
llin
g M
ud
Barrier Functions Barrier Elements
BO
P
Sub-Functions
Dri
llin
g M
ud
Cho
ke
Val
veK
ill L
ine
Val
ve
BO
P
Emer
gen
cy
Shu
tdo
wn
Dyn
amic
P
osi
tio
nin
gSy
stem
Col
lisio
n
Avo
idan
ce
Ala
rms
Safe
ty Z
one
Reg
ula
tio
ns
Bot
tom
s-up
Pres
sure
Tes
ting
(N
egat
ive
and
P
ost
ive
)
Performance Requirements
Org
an
izat
ion
an
d M
an b
arr
iers
are
incl
ude
d in
ea
ch b
arr
ier
ele
me
nt b
eca
use
the
sele
ctio
n o
f th
e ab
ove
ph
yisc
al b
arr
iers
dep
end
s o
n t
he
ind
ivid
ua
l/o
rga
niz
ati
on
per
cep
tio
ns
in f
orm
o
f a
na
lysi
s a
nd
des
ign
.
M
anag
em
ent
focu
s o
n s
afet
y th
rou
gh c
amp
aign
s. (
Top
to
bo
tto
m a
nd
bo
tto
m t
o to
p)
A
ccou
nta
bili
ty o
f th
e co
mp
any
tow
ard
s sa
fety
inci
den
ts t
hro
ugh
ind
ust
ry a
nd
nati
on
al r
egu
lati
on
s
Esta
blis
hin
g si
ngl
e p
oin
t o
f co
nta
cts
and
an
alys
ing
it t
hro
ugh
Soc
ial N
etw
ork
An
alys
is t
ools
C
on
tin
uo
us im
pro
vem
ent
of
safe
ty d
rive
in t
he
co
mp
any
and
exp
ansi
on
of
each
pro
ject
’s R
isk
An
alys
is A
sses
smen
t to
ke
ep u
p w
ith
ch
ange
s m
ade
to t
he
ori
gin
al p
lan
d
uri
ng
the
exe
cuti
on
phas
e -
co
nti
nu
ous
re
asse
ssm
ent
of t
he r
isk
pic
ture
.
Per
iodi
cally
re
-op
tim
ize
mai
nte
nan
ce c
osts
In
vest
men
t in
co
nti
nuo
us
trai
nin
g o
f p
erso
nne
l in
best
ava
ilab
le s
afet
y p
ract
ices
In
vest
men
t in
men
tori
ng p
rogr
amm
es
Hir
ing
com
pet
ent
per
son
nel
Sh
arin
g le
sso
ns
lear
nt
to o
ther
co
mp
anie
s
Tim
ely
ce
rtif
icai
ton
an
d m
ain
ten
ance
of
safe
ty c
riti
cal s
yste
ms
Figu
re5:
Prop
osed
barr
ierm
anag
emen
t-pr
even
tacc
iden
ts
17

Red
irec
t H
ydro
carb
ons
to S
afe
Are
a
Red
uce
Co
nse
qu
en
ce o
f H
ydro
carb
on
Lea
k
Red
uce
Dur
atio
n an
d Si
ze o
f Le
ak
Lim
it E
xpo
sure
of
Pe
rso
nn
el
at D
ange
r Zo
nes
Pla
ns
for
Emer
gen
cy
Prep
ared
ness
Per
son
nel
Eva
cuat
ion
Red
uce
Risk
of E
xplo
sio
n
Fire
& G
as
Det
ecti
on
Ala
rm a
nd
Del
uge
Sys
tem
s
Emer
gen
cy
Proc
edu
res
Fire
& G
as
Det
ecti
on
Proc
ess
Shud
own
Sy
stem
s
Fire
and
Gas
Det
ecto
rs
Emer
gen
cy
Safe
ty
Proc
edu
res
Sh
ud
ow
n
Proc
ess
Fire
and
Gas
De
tect
ors
Safe
ty A
larm
sSp
rink
lers
Faci
lity
Des
ign
Bas
ed
on H
aza
rds
Expl
osio
n R
esis
tant
C
onst
ruti
on
Are
a Is
ola
tio
n
(Res
tric
ted
Per
son
nel
Acc
ess
Are
as)
Life
boa
tsSu
pp
ort
V
esse
ls
Pers
onn
el
Prot
ecti
ve
Eq
uip
me
nt
Barrier Functions Barrier ElementsSub-Functions
Org
an
izat
ion
an
d M
an b
arr
iers
are
incl
ude
d in
ea
ch b
arr
ier
ele
me
nt b
eca
use
the
sele
ctio
n o
f th
e ab
ove
ph
yisc
al b
arr
iers
dep
end
s o
n t
he
ind
ivid
ua
l/o
rga
niz
ati
on
per
cep
tio
ns
in f
orm
o
f a
na
lysi
s a
nd
des
ign.
M
anag
em
ent
focu
s o
n s
afet
y th
rou
gh c
amp
aign
s. (
Top
to
bo
tto
m a
nd
bo
tto
m t
o to
p)
A
ccou
nta
bili
ty o
f th
e co
mp
any
tow
ard
s sa
fety
inci
den
ts t
hro
ugh
ind
ust
ry a
nd
nati
on
al r
egu
lati
on
s
Esta
blis
hin
g si
ngl
e p
oin
t o
f co
nta
cts
and
an
alys
ing
it t
hro
ugh
Soc
ial N
etw
ork
An
alys
is t
ools
C
on
tin
uo
us im
pro
vem
ent
of
safe
ty d
rive
in t
he
co
mp
any
and
exp
ansi
on
of
each
pro
ject
’s R
isk
An
alys
is A
sses
smen
t to
ke
ep u
p w
ith
ch
ange
s m
ade
to t
he
ori
gin
al p
lan
d
uri
ng
the
exe
cuti
on
phas
e -
co
nti
nu
ous
re
asse
ssm
ent
of t
he r
isk
pic
ture
.
Per
iodi
cally
re
-op
tim
ize
mai
nte
nan
ce c
osts
In
vest
men
t in
co
nti
nuo
us
trai
nin
g o
f p
erso
nne
l in
best
ava
ilab
le s
afet
y p
ract
ices
In
vest
men
t in
men
tori
ng p
rogr
amm
es
Hir
ing
com
pet
ent
per
son
nel
Sh
arin
g le
sso
ns
lear
nt
to o
ther
co
mp
anie
s
Tim
ely
ce
rtif
icai
ton
an
d m
ain
ten
ance
of
safe
ty c
riti
cal s
yste
ms
Figu
re6:
Prop
osed
barr
ierm
anag
emen
t-m
itiga
teco
nseq
uenc
es
18

5.6 Performance requirements/standardsPSA requires that safety barriers are specified along with their performance requirements in order toensure effective barrier management [PSA, 2013]. The main goal of this process is to ensure "measure-ment" of barrier performances to predefined barrier requirements.
Table 8, 9, 10 present requirements for the proposed barrier strategy. The barriers in Table 8 correspondto reducing probability of hydrocarbon leak from the well refer figure 5 while, Table 9 corresponds toreducing the consequence of hydrocarbon leak refer figure 6. Table 10 corresponds to both figures 5 and6.
Table 8: Barrier performance standard- functional levelBarrier Performance Standard Performance Standard
(Functionality, Integrity, Vulnera-bility)
Isolate areas with different pres-sures and fluids
Functionality Established pressure limits in various zones
Prevent collapsing and leak of wellformation
Functionality Loss of drilling mud should not exceed the given limit
Regulate flow of Hydrocarbons Integrity Minimum failure rate of BOP through quantitative analysis.Example- SIL analysis
Isolated hydrocarbons subsea Integrity Minimum failure rate of BOP through quantitative analysis.Example- SIL analysis
Avoid Rig Drift and Drive off Functionality Limits and accuracy dynamic positioning system envelopes
Table 9: Barrier performance standard- element levelBarrier Performance Standard Performance Standard
(Functionality, Integrity, Vulnera-bility)
Fire and Gas Detectors Integrity Determine acceptable failure rate of detectors through quanti-tative analysis. Example- SIL analysis
Emergency Safety Procedures Functionality Be aligned with the risk pictureSafety Alarms Integrity Determine acceptable failure rate of detectors through quanti-
tative analysis. Example- SIL analysisSprinklers Integrity Determine acceptable failure rate of FF equipment through
quantitative analysis. Example- SIL analysisProcess Shutdown Systems Integrity Determine acceptable failure rate of Process Shutdown System
through quantitative analysis. Example- SIL analysisLifeboats Functionality Have sufficient capacity to include all personnel onboard the
rigSupport Vessels Functionality Response to an emergency call within a given time limitRestricted Personnel Access Areas Functionality Normally manned working stations should be sheltered or out
of reach from potential explosions caused by HC releasePersonnel Protective Equipment Vulnerability Guarantees impact and thermal protection to a stipulated level
19

Table 10: Barrier performance standard- organization levelBarrier Performance Standard Performance Standard
(Functionality, Integrity, Vulnera-bility)
Management focus on safety through campaigns Functionality Commit management time to safety activi-ties. Safety walk. Walk-Observe-Feedback.
Accountability of the company towards safety inci-dents through industry and national regulations
Functionality Social corporate responsibility drive
Establishing single point of contacts and analyzing itthrough Social Network Analysis tools
Functionality Make contact information of single points ofcontact public and know
Continuous improvement of safety drive in the com-pany and expansion of each project’s Risk AnalysisAssessment to keep up with changes made to the orig-inal plan during the execution phase - continuous re-assessment of the risk picture.
Functionality Risk Analysis Assessments should be re-viewed at fixed intervals during planningphase and whenever a major modification toplan occurs during project execution
Periodically re-optimize maintenance costs Functionality At predetermined given time intervals, aim-ing to cut a given percentage of labor
Investment in continuous training of personnel in bestavailable safety practices
Functionality Annual evaluation of relevant technicalknowledge
Investment in mentoring programmes Functionality Ensure mentoring program for new employ-ees
Hiring competent personnel Functionality Assessment of technical knowledge and per-sonality
Sharing lessons learnt to other companies Functionality Target number of published industry whitepapers
Timely certification and maintenance of safety criticalsystems
Integrity Traceability of equipment and process cer-tificates
6 ConclusionsThrough this accident analysis, it is observed that complex systems tag along with complex accidentpropagation. The consequences in such systems also highlight the need for continued focus on barriermanagement. However, to understand the nature of faults and failures in such systems a thorough riskanalysis is paramount.
Organizational and human barriers and their performance requirements are difficult to define, maintain,and measure. Nonetheless, these barriers are frequently in demand during offshore accident progression.The current study observed that the amount of organization and human barriers that failed in the Macondoblowout increased both the probability of blowout occurrence as well as the consequences associate withthe blowout. In instances in this accident, technical barrier failed on account of previous organizationalor human barrier failure. For example, the failure to certificate the BOP probably allowed the wiring ofthe pods to go amiss and the battery on the yellow pod to discharge ahead of time, both technical failures.The same happened in the numerous attempts to control the HC leak to the sea, after the rig had sunk.
This study points on the direction that inadequate human and organizational barrier functions were tightlyconnected to the development of the Macondo accident. It indicates that there is room for improvementin assessment and treatment of major accidents scenarios, and that system safety should not be neglectedin favor of traditional HSE performance indicators.
20

References[CSB, 2007] CSB, U. (2007). CSB Safety Video: Explosion at BP Refinery . YouTube Video-
http://youtu.be/c9JY3eT4cdM.
[CSB, 2014] CSB, U. (2014). Deepwater Horizon Blowout Animation . YouTube Video-https://www.youtube.com/watch?v=FCVCOWejlag.
[Ideum - ideas + media, 2010] Ideum - ideas + media (2010). Deepwater horizon offshore drilling plat-form on fire. Photo.
[Petroleum Safety Authority Norway- PSA, 2014] Petroleum Safety Authority Norway- PSA (2014).PSA regulations. Webpage.
[PSA, 2013] PSA, P. (2013). Principles for barrier management in the petroleum industry. Technicalreport.
[Rausand, 2005] Rausand, M. (2005). Lecture Notes- Risk Assessment- Preliminary Hazard Analysis(PHA).
[Rausand, 2011] Rausand, M. (2011). Risk Assessment : Theory, Methods, and Applications. John Wiley& Sons, Inc.
[Sklet, 2006] Sklet, S. (2006). Safety barriers on oil and gas platforms. means to prevent hydrocarbonreleases.
[The Deepwater Horizon Study Group (DHSG), 2011] The Deepwater Horizon Study Group (DHSG)(2011). Final report on the investigation of the macondo well blowout. Technical report, Center forCatastrophic Risk Management (CCRM).
[Vinnem, 2014] Vinnem, J. E. (2014). Offshore Risk Assessment Vol 1 and 2, volume 1 and 2. Springer,London, 3rd edition edition.
21

A Appendix- PHA Parameters
A.1 Probability ClassesTable 11 presents classification of probability classes as suggested by [Rausand, 2005].
Table 11: Probability classesRank Probability class Description1 Very unlikely Once per 1000 years or more seldom2 Remote Once per 100 years3 Occasional Once per 10 years4 Probable Once per year5 Frequent Once per month or more often
A.2 Severity ClassesTable 12 presents classification of severity classes as suggested by [Rausand, 2005].
Table 12: Severity classesRank Severity class Description4 Catastrophic Failure results in major injury or death of per-
sonnel.3 Critical Failure results in minor injury to personnel, per-
sonnel exposure to harmful chemicals or radia-tion, or fire or a release of chemical to the envi-ronment
2 Major Failure results in a low level of exposure to per-sonnel, or activates facility alarm system.
1 Minor Failure results in minor system damage but doesnot cause injury to personnel, allow any kind ofexposure to operational or service personnel orallow any release of chemicals into the environ-ment.
22