analog forecast system for precipitation cleared e2
TRANSCRIPT
Reprint 1097
An Analog Forecast System for Precipitation Forecasting
S.T. Chan, C.H. Fong* & M.Y. Chan
28th Guangdong-Hong Kong-Macao Seminar on
Meteorological Science and Technology,
Hong Kong, 13-15 January 2014
*Chinese University of Hong Kong
1
An Analog Forecast System for Precipitation Forecasting
CHAN Sai-tick, FONG Chi-hang* and CHAN Man-yee
Hong Kong Observatory *Chinese University of Hong Kong
Abstract
With limited resolution, the global numerical weather prediction (NWP)
models are generally less effective in forecasting precipitation due primarily to mesoscale instead of synoptic forcing. Based on the notion of “history repeats itself” and assuming a perfect prognosis by NWP, an analog forecast system was developed by the Hong Kong Observatory to search for historical cases with weather patterns that are analogous to the current pattern as portrayed by NWP. The similarity measures employed by the system are so defined that special focus has been put on capturing of the heavy precipitation events in the vicinity of Hong Kong.
The paper presents the formulation of the analog forecast system and the performance evaluation results.
2
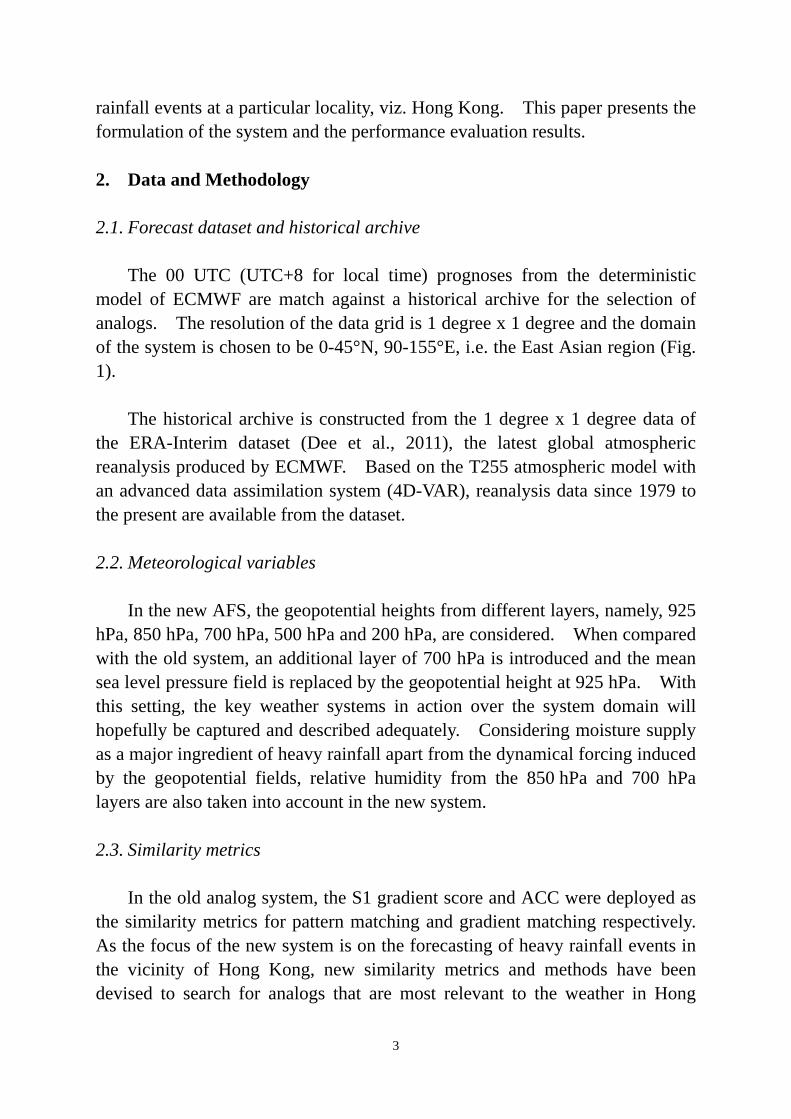
1. Introduction Hong Kong, located near 22N, 114E, is a subtropical city which has a hot, humid and unstable climate in summer. The southwest monsoon and tropical cyclones bring heavy rainfall to Hong Kong every year. Taking June as an example, the average total rainfall in the month is 456.1 mm and the extreme recorded in 2008 is 1346.1 mm. The annual mean number of days having a daily rainfall of 25 mm or more from 1981 to 2010 is about 29. While the rainfall forecasts provided by the global medium-range numerical weather prediction (NWP) models have improved over the years, due to limited resolution, such models are generally less effective in capturing heavy rainfall events driven primarily by mesoscale forcing and subgrid processes. Based on the notion of “history repeats itself” and assuming a perfect prognosis by NWP, an analog forecast system (AFS) was developed by the Hong Kong Observatory (HKO) to search for historical cases with weather patterns that are analogous to the current pattern as portrayed by NWP, with special focus put on the forecasting of heavy rainfall events that occurred in the vicinity of Hong Kong. Past efforts have indeed been made by the Hong Kong Observatory in building a synoptic AFS based on the analysis and forecast data from the deterministic model of the European Centre for Medium-Range Weather Forecasts (ECMWF) (Poon and Ma, 1992; Lee and Poon, 1997, ‘the old analog system’ hereafter). The data used were in 2.5 degree x 2.5 degree resolution. The meteorological variables referenced in the system included the mean-sea-level pressure, geopotential height at 500 hPa and the winds at 850 hPa and 200 hPa. Anomaly correlation coefficient (ACC) and S1 score were used as similarity metrics for selection of analogs from the historical archive. The weather elements satisfactorily forecast were mainly those controlled by the synoptic situation, namely, the maximum and minimum temperatures, cloudiness and non-convective precipitation. In recent years, more model variables in higher resolution and a long record of reanalysis data are made available from ECWMF. This opens the opportunity of constructing a more skillful AFS to tackle specific forecast problems that remain a challenge to modern NWP models. In the design of the new AFS, additional meteorological variables and an innovative set of similarity metrics were introduced with an aim to improving the forecasting of heavy
3
rainfall events at a particular locality, viz. Hong Kong. This paper presents the formulation of the system and the performance evaluation results. 2. Data and Methodology 2.1. Forecast dataset and historical archive The 00 UTC (UTC+8 for local time) prognoses from the deterministic model of ECMWF are match against a historical archive for the selection of analogs. The resolution of the data grid is 1 degree x 1 degree and the domain of the system is chosen to be 0-45°N, 90-155°E, i.e. the East Asian region (Fig. 1). The historical archive is constructed from the 1 degree x 1 degree data of the ERA-Interim dataset (Dee et al., 2011), the latest global atmospheric reanalysis produced by ECMWF. Based on the T255 atmospheric model with an advanced data assimilation system (4D-VAR), reanalysis data since 1979 to the present are available from the dataset. 2.2. Meteorological variables In the new AFS, the geopotential heights from different layers, namely, 925 hPa, 850 hPa, 700 hPa, 500 hPa and 200 hPa, are considered. When compared with the old system, an additional layer of 700 hPa is introduced and the mean sea level pressure field is replaced by the geopotential height at 925 hPa. With this setting, the key weather systems in action over the system domain will hopefully be captured and described adequately. Considering moisture supply as a major ingredient of heavy rainfall apart from the dynamical forcing induced by the geopotential fields, relative humidity from the 850 hPa and 700 hPa layers are also taken into account in the new system. 2.3. Similarity metrics In the old analog system, the S1 gradient score and ACC were deployed as the similarity metrics for pattern matching and gradient matching respectively. As the focus of the new system is on the forecasting of heavy rainfall events in the vicinity of Hong Kong, new similarity metrics and methods have been devised to search for analogs that are most relevant to the weather in Hong

4
Kong. a) Pattern matching
To quantify the similarity of the forecast geopotential height pattern with the archive cases, a modified correlation coefficient similar to ACC is proposed, except that the corresponding value at Hong Kong is taken as the reference rather than the climatology mean at each grid point. Furthermore, a Gaussian weight function is applied to assign more weights to grid points closer to Hong Kong and smaller weights to those farther away. Such a formulation will allow the new AFS to be more sensitive to the weather pattern around Hong Kong. The modified correlation coefficient is defined as:
(1)
where )( krG is the Gaussian weight function value at the k-th grid,
kf is the forecast geopotential height at the k-th grid,
kh is the reanalysis geopotential height at the k-th grid,
the subscript HK represent the grid at Hong Kong. The Gaussian weight function is defined as:
(2)
where 22 )()( HKkHKkk lonlonlatlatr
klat is the latitude of the k-th grid,
klon is the longitude of the k-th grid.
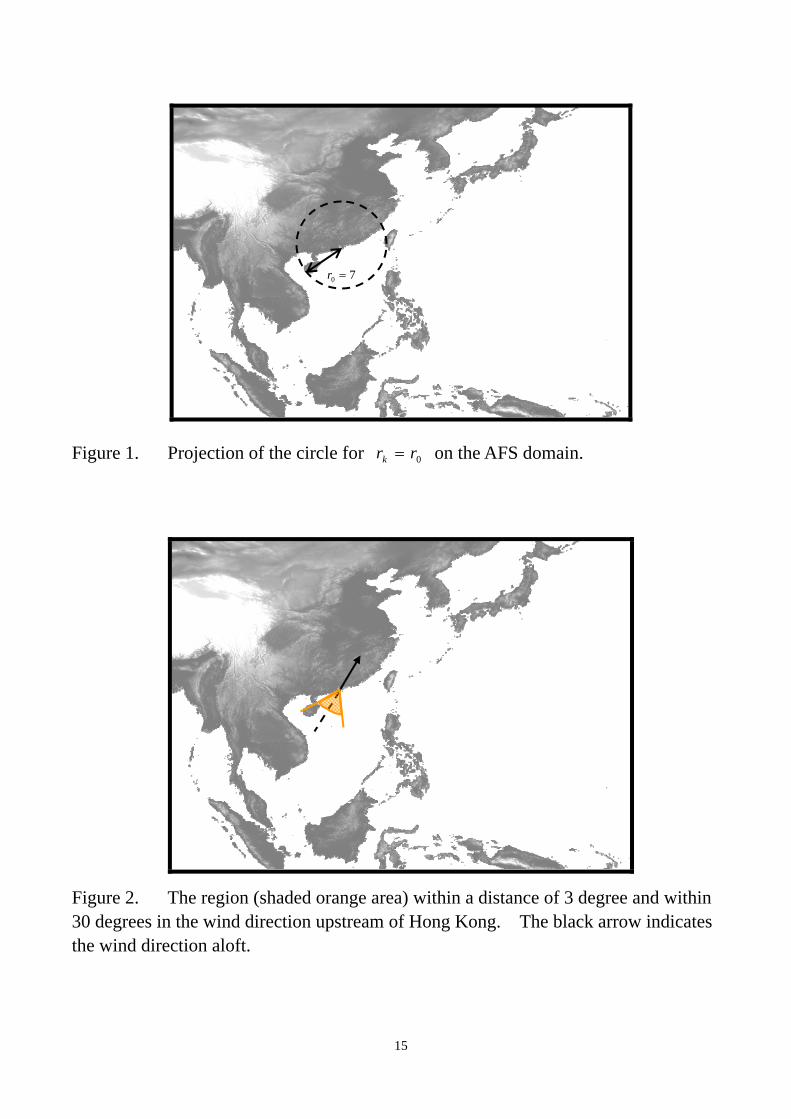
0r is empirically set as 7, such that when 0rrk , the weight )( krG will
drop to around 0.5. Fig. 1 shows the projection of the circle for 0rrk on the
22 )()(
)()(
HKkkHKkk
HKkkHKkk
hhrGffrG
hhrGffrGc
2
0
2
)2.1()(
r
rEXPrG k
k
5
system domain. The modified correlation coefficient, c, ranges from -1 to 1. Through the following transformation (Eq. 3), a similarity score which ranges from 0 to 1
can be defined such that 0levels for perfect similarity and 1levels for perfect
dissimilarity.
)(cos 1 c
slevel
(3)
where level represents different levels: 925 hPa, 850 hPa, 700 hPa, 500 hPa and 200 hPa.
A resultant similarity score combining the similarity scores for different levels is then defined as:
sresultant 20055004700385029251 spspspspsp (4)
where p1, p2, p3, p4 and p5 are normalized weights for different levels so that they sum to unity. They are determined following the optimization procedure described in Section 2.5 below. b) Synoptic pattern matching Through the application of the Gaussian weights in the preceding section, the system will become more sensitive to the weather pattern around Hong Kong. Yet in the analog selection process, it is desirable that the analogs selected should bear a certain degree of similarity in terms of the synoptic environment with the forecast pattern. For synoptic pattern matching, the similarity score synoptics is set to be the same as 500s , except that no Gaussian weight function is to be applied, or equivalently, )( krG is set to one. c) Gradient matching The gradient of the geopotential height fields, or equivalently, the geostrophic winds generated, has a direct impact on the supply of moisture and the updraft activities in the air column and subsequently on the precipitation at surface. A similarity metric akin to the S1 gradient score in the old analog system is also desirable. In this regard, the similarity score for gradient
6
matching is defined as follows:
1)(
)()(2
HKkk
HKkkHKkklevel
ffrG
hhrGffrGg (5)
In Eq. 5, the first term inside the absolute operator on the right hand side represents the projection of the geopotential height difference field of the analog onto the corresponding height difference field of the forecast being examined. Geopotential height at Hong Kong is again used as the reference and the same Gaussian weight function as deployed for pattern matching is again applied to increase the sensitivity of the system to the weather around Hong Kong. In effect, levelg calculates the percentage difference between the geopotential height gradient of the forecast and the analog. Note that 0levelg is unbounded and for perfect similarity, 0levelg . Considering that existence of low-level jets is a favorable mechanism for the generation of heavy rain, levelg is considered for 925 hPa, 850 hPa and 700 hPa only. d) Moisture matching Lastly, similarity in moisture supply to the Hong Kong region is assessed through the reference to a moisture index defined as the average relative humidity of all grid points within a distance of 3 degrees and within 30 degrees (empirically set) in the direction upstream of Hong Kong as determined by the winds aloft Hong Kong at 850 hPa and 700 hPa respectively (Fig. 2). 2.4. Selection of analogs and forecast output For any forecast day, to take into account the seasonal effects, the analog selection process is restricted to the current day +/- 50 days in the historical archive. The similarity metrics introduced above against the historical cases are then calculated. A screening process is performed to remove those cases that are considered dissimilar to the forecast day being examined, specifically, a) The resultant similarity score sresultant must be less than 6p . [Note: p6, …p11
hereinafter are system parameters determined by the optimization procedure described in the next section.]
7
b) The synoptic similarity score synoptics must be less than 7p . c) The moisture indexes for 850 hPa and 700 hPa from the analog must not
differ from the corresponding indexes from the forecast being examined by more than 8p and 9p respectively.
d) Each of the gradient similarity score for 925 hPa, 850 hPa and 700 hPa must be less than 10p . Should no analog exist as a result, 10p is incremented in steps of 0.01 until an analog is found.
Based on the daily rainfall amounts recoded for the analogs selected, AFS generates rainfall forecast in terms of rainfall levels same as those being referred to in the worded weather forecasts for Hong Kong issued by the forecasters of HKO every day (Table 1). In this regard, an additional system
parameter, 11p , is further introduced. All analogs with sresultant lower than or
equal to 11p are considered sufficiently similar to the forecast day in question,
and the mean of the rainfall levels of the analogs weighted by the reciprocal of sresultant is output as the forecast rainfall level from AFS. If sresultant of the
analogs selected are all higher than 11p , the rainfall level of the analog with the
lowest sresultant is directly output as the forecast. Analogs of lower similarity could be not quite reliable and are therefore excluded from the forecast generation process. 2.5 Optimization The ERA-Interim reanalysis data from 1979-2008 are used as the training dataset for the purpose of determining the system parameters p1,…, p11 introduced in the preceding sections. The search of optimal parameters is done by means of Cuckoo Search (CS), a generic optimization algorithm that is superior to other metaheuristic algorithms such as the genetic algorithms and particles swarm optimization algorithms for solving optimization problems (Yang and Deb, 2009). The optimization is performed by taking the reanalysis data valid at 00 UTC from each day in the training period as forecast, searching the analogs from other years in the training dataset and determining the overall performance of the forecasts thus generated. The subjective function for the optimization problem is taken to be the critical success index (CSI) (Wilks, 2011) of heavy rain forecasts (rainfall level >= 3 in Table 1) minus the
8
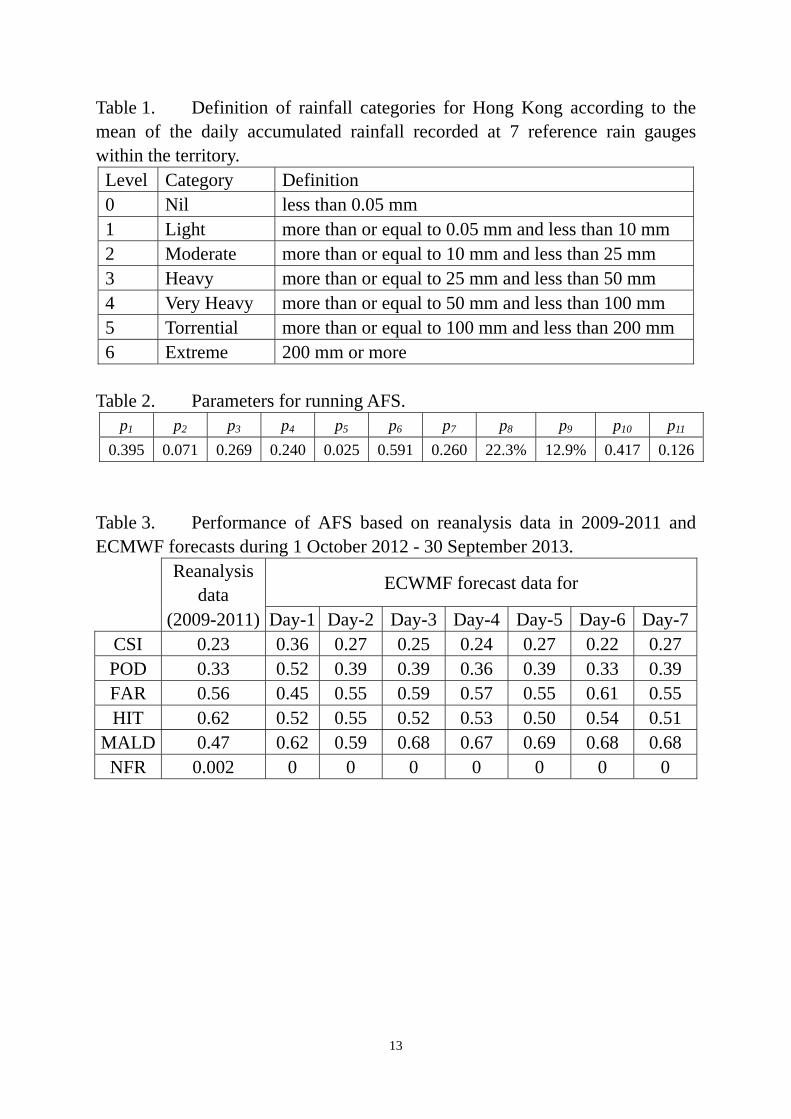
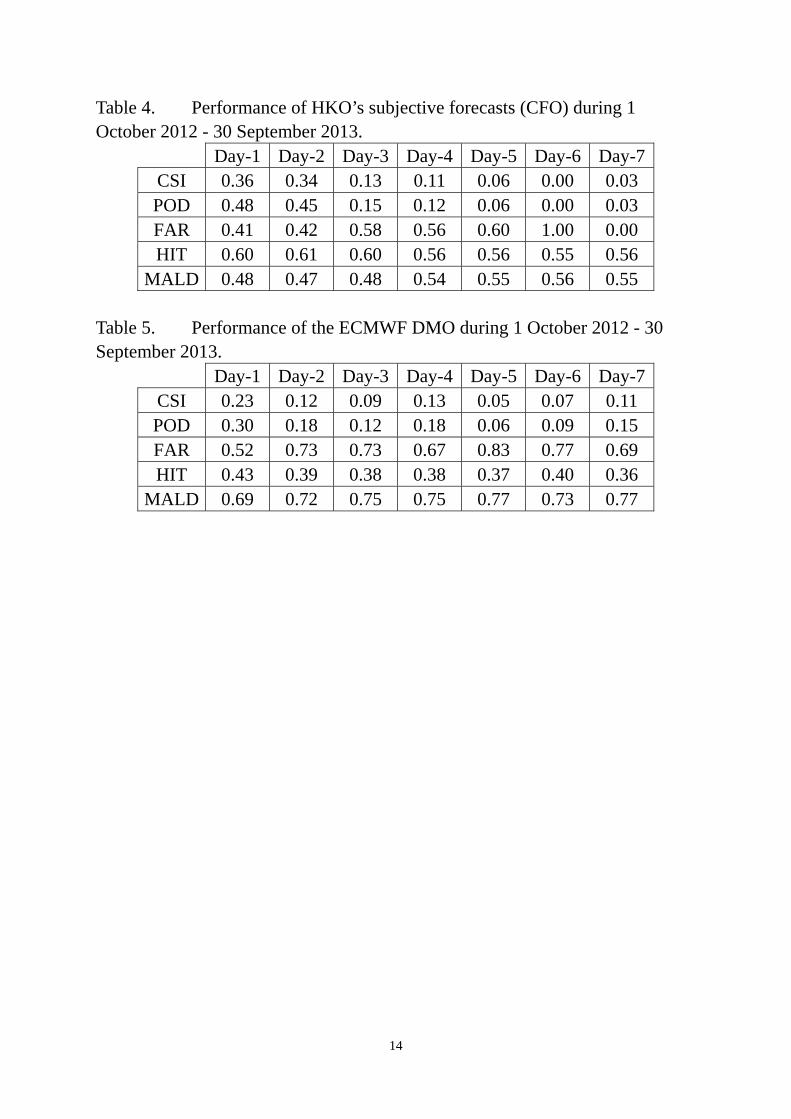
proportion of cases where no analogs can be found by the system (the “not found” ratio – NFR). In other words, the optimization aims at maximizing the CSI of heavy rain forecasts while minimizing the number of cases in which the system fails to generate a forecast. The system parameters determined from the above optimization procedure are as shown in Table 2. It is worth noting that among the five normalized weights for the pattern similarity scores, p5 is the smallest (0.025) suggesting that similarity of the 200 hPa geopotential height pattern is relatively less crucial in the forecasting of heavy rain events in Hong Kong. While the weights for other levels vary from 0.071 to 0.395, p1+p2 (0.466) is in similar magnitude to p3+p4 (0.509), which suggests that the geopotential height patterns at the lower layers (925 hPa and 850 hPa) and those at the middle layers (700 hPa and 500 hPa) are more or less equally important. 3. Performance Evaluation The performance of AFS is assessed by verifying the forecast rainfall levels output from the system taking the ERA-Interim reanalysis data valid at 00 UTC between 2009 and 2011 as forecast data and searching against the historical archive comprising the reanalysis data from 1979 to 2008. The system performance is further assessed using the 00 UTC prognoses valid at T+24h (as day-1), T+48h (day-2), … T+168h (day-7) from the ECMWF deterministic model during 1 October 2012 to 30 September 2013 to search against the reanalysis data from 1979 to 2011. A number of performance metrics are computed, including the CSI, probability of detection (POD) and false alarm ratio (FAR) (Wilks, 2011) of the heavy rain forecasts, the proportion of correct rainfall level forecasts (HIT) and the mean absolute difference between the forecast and observed rainfall levels (MALD). The performance of the system is also compared with that of the subjective forecasts issued by HKO’s Central Forecasting Office (CFO) and the direct model output of ECMWF (DMO) from the same period of 1 October 2012 to 30 September 2013.
Table 3-5 give the detailed performance results for AFS, CFO and DMO forecasts respectively. As noted from NFR in Table 3, most of the time AFS can successfully return with one or more analogs from the historical archive.
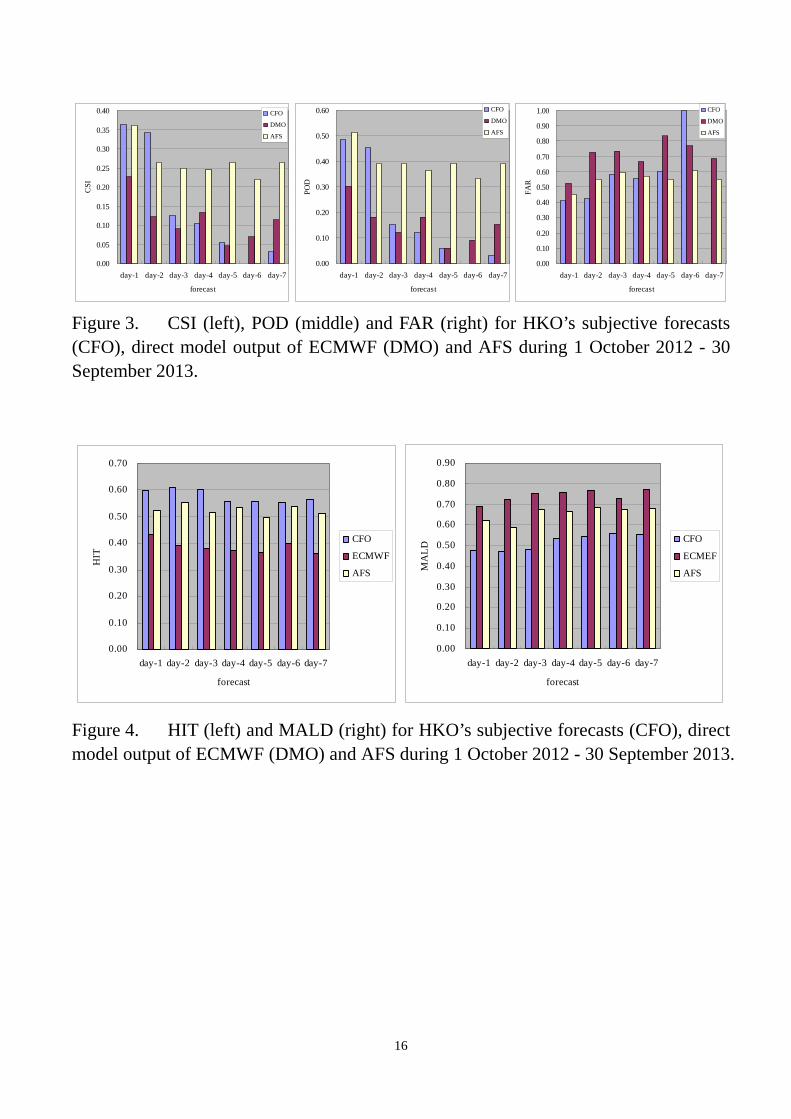
Fig. 3 shows the respective performance of the forecasts in capturing the
9
heavy rainfall events during 1 October 2012 to 30 September 2013. There were in total 33 cases of heavy rain recorded during the period. AFS exhibits a significant improvement over DMO with higher POD and lower FAR. In particular, both POD and CSI from AFS has improved by 100% or more in general over DMO from day-2 onward. CFO forecasts show skills comparable or even better than AFS in day-1 and day-2, but for day-3 and beyond, AFS outperforms CFO with a wide margin, mostly because the forecasters may be hesitant to issue heavy rain forecasts in the medium-term.
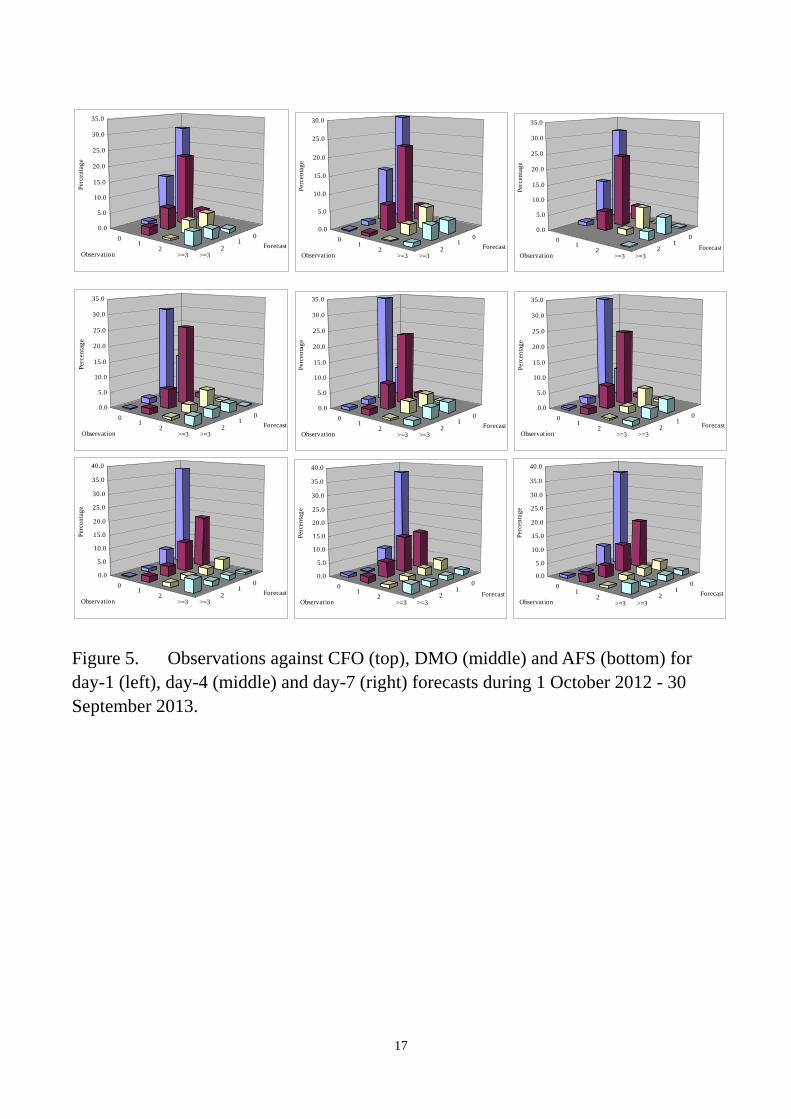
In terms of HIT and MALD (Fig. 4), AFS also shows general improvements over DMO, yet CFO remains the best performer for the whole forecast range. When plotting the frequency distribution of the observed rainfall levels against the forecasts (Fig. 5), it is readily noted that AFS is able to significantly reduce the number of false alarms of rainfall forecasts from DMO with much lower counts of forecast level > 0 when the observed level is 0. When compared with CFO, AFS also achieves the largest count of the pair (observation: 0, forecast: 0), indicative of the better skills of AFS in differentiating rain and no-rain situation over the subjective forecasts. For rain levels 1 and 2 that correspond to light rain and moderate rain conditions, the number of hits by AFS is comparatively less than CFO due mainly to a gross underestimation of the rainfall by the system in those two categories, as evident from the higher counts of the pairs (observation: 1, forecast: 0) and (observation: 2, forecast: 0). This leads to the overall lower HIT and higher MALD achieved by AFS when compared with CFO. 4. Discussion and conclusions A new AFS was constructed using the 30-year reanalysis data from the ERA-Interim dataset with special focus put on capturing the heavy rainfall events in the vicinity of Hong Kong. This is done through two means: (i) adoption of a Gaussian weight function in formulating the similarity metrics in order to increase the sensitivity of the system to local weather conditions; and (ii) the introduction of meteorological variables (relative humidity upstream) and similarity metrics (gradient matching of the geopotential height fields at the lower troposphere) relevant to the rain-producing mechanisms.
The system demonstrates superior performance than DMO as well as the subjective forecasts issued by HKO in forecasting heavy rainfall events by
10
being able to capture their occurrences at a higher detection rate and lower false alarm ratio. Moreover, the system significantly corrects the overestimation of rainfall occurrences by DMO, an issue also found in the subjective forecasts. Yet, owing to its formulation specialized for heavy rain forecasting, the system is comparatively less effective in dealing with the light rain and moderate rain situations, resulting in a generally poorer performance than the subjective forecasts in terms of HIT and MALD. The errors of AFS could be attributable to several reasons. First of all, the current 1 degree x 1 degree resolution of the model forecast data and reanalysis data is still too coarse to resolve the weather in Hong Kong, which has a total land area of around 1,100 km2, or about 10% of the system grid size. The weather as indicated by the selected analogs may occur over Hong Kong or just be realized in the neighbouring areas. Besides, small-scale convective activities may also lead to heavy rain in Hong Kong and the current data resolution is not adequate for resolving such activities. It would therefore always be helpful for the forecasters to refer to the weather scenarios as indicated by the list of analogs output from AFS for assessing the risk of heavy rain occurrence. It is expected that the use of higher resolution data in future would help improve the performance of the system. In the current formulation of AFS, model forecast fields valid at 00 UTC, or 8 a.m. locally, are matched with the historical archive to identify analog cases that are representative of the rainfall situation to be happening in Hong Kong. In the case of rapidly-changing weather conditions, this may not be sufficient for the estimation of rainfall amount to be received for the whole day. Other valid times, say, 12 UTC may also need to be referred to in such cases. This may be another direction to be looked at to further improve the skills of the system. During the process of training and verification of the system, it is found that analogs for tropical cyclone situation may sometimes be non-existent and this has accounted for the small value of NFR shown in Table 3. The main reason is that it is sometimes difficult to find a day in the historical archive that has a synoptic pattern sufficiently similar to the forecast day being examined. The filtering for synoptic pattern similarity may be turned off to increase the success rate in identifying analogs for such cases.
11
Attempts have been made to utilize different sets of system parameters pi optimized for different months. Yet no improvement in performance could be seen, possibly because there are insufficient training data in searching for the optimal parameters, and that the heavy rainfall events in Hong Kong are mostly confined to the wet season and the stratification by months may not be an effective means to differentiate rainstorms generated by different mechanisms (results omitted).
12
References Dee D. P. and Coauthors, 2011: The ERA-Interim reanalysis: configuration and performance of the data assimilation system. Quart. J. Roy. Meteor. Soc., 137, 553-597. Lee, S. M. and H.T. Poon, 1997: Improvement to the Hong Kong Observatory Synoptic Analogue Forecast System. HK Obs., Technical Note (Local) No.71. Poon, H.T. and W.M. Ma, 1992: The Royal Observatory Synoptic Analogue Forecast System. The Seventh Guangdong-Hong Kong-Macau Joint Seminar on Hazardous Weather, Macau, 16-17 December 1992. Wilks, D.S., 2011: Statistical Methods in the Atmospheric Sciences. 3rd Edition. Elsevier, 676 pp. Yang, X. S. and S. Deb, 2009: Cuckoo Search via Lévy Flights. NaBIC IEEE Publications, 210–214.
13
Table 1. Definition of rainfall categories for Hong Kong according to the mean of the daily accumulated rainfall recorded at 7 reference rain gauges within the territory.
Level Category Definition 0 Nil less than 0.05 mm 1 Light more than or equal to 0.05 mm and less than 10 mm 2 Moderate more than or equal to 10 mm and less than 25 mm 3 Heavy more than or equal to 25 mm and less than 50 mm 4 Very Heavy more than or equal to 50 mm and less than 100 mm 5 Torrential more than or equal to 100 mm and less than 200 mm 6 Extreme 200 mm or more
Table 2. Parameters for running AFS.
p1 p2 p3 p4 p5 p6 p7 p8 p9 p10 p11
0.395 0.071 0.269 0.240 0.025 0.591 0.260 22.3% 12.9% 0.417 0.126
Table 3. Performance of AFS based on reanalysis data in 2009-2011 and ECMWF forecasts during 1 October 2012 - 30 September 2013.
Reanalysis
data ECWMF forecast data for
(2009-2011) Day-1 Day-2 Day-3 Day-4 Day-5 Day-6 Day-7CSI 0.23 0.36 0.27 0.25 0.24 0.27 0.22 0.27 POD 0.33 0.52 0.39 0.39 0.36 0.39 0.33 0.39 FAR 0.56 0.45 0.55 0.59 0.57 0.55 0.61 0.55 HIT 0.62 0.52 0.55 0.52 0.53 0.50 0.54 0.51
MALD 0.47 0.62 0.59 0.68 0.67 0.69 0.68 0.68 NFR 0.002 0 0 0 0 0 0 0
14
Table 4. Performance of HKO’s subjective forecasts (CFO) during 1 October 2012 - 30 September 2013.
Day-1 Day-2 Day-3 Day-4 Day-5 Day-6 Day-7 CSI 0.36 0.34 0.13 0.11 0.06 0.00 0.03 POD 0.48 0.45 0.15 0.12 0.06 0.00 0.03 FAR 0.41 0.42 0.58 0.56 0.60 1.00 0.00 HIT 0.60 0.61 0.60 0.56 0.56 0.55 0.56
MALD 0.48 0.47 0.48 0.54 0.55 0.56 0.55
Table 5. Performance of the ECMWF DMO during 1 October 2012 - 30 September 2013.
Day-1 Day-2 Day-3 Day-4 Day-5 Day-6 Day-7 CSI 0.23 0.12 0.09 0.13 0.05 0.07 0.11 POD 0.30 0.18 0.12 0.18 0.06 0.09 0.15 FAR 0.52 0.73 0.73 0.67 0.83 0.77 0.69 HIT 0.43 0.39 0.38 0.38 0.37 0.40 0.36
MALD 0.69 0.72 0.75 0.75 0.77 0.73 0.77
15
Figure 1. Projection of the circle for 0rrk on the AFS domain.
Figure 2. The region (shaded orange area) within a distance of 3 degree and within 30 degrees in the wind direction upstream of Hong Kong. The black arrow indicates the wind direction aloft.
70 r
16
0.00
0.05
0.10
0.15
0.20
0.25
0.30
0.35
0.40
day-1 day-2 day-3 day-4 day-5 day-6 day-7
forecast
CSI
CFO
DMO
AFS
0.00
0.10
0.20
0.30
0.40
0.50
0.60
day-1 day-2 day-3 day-4 day-5 day-6 day-7
forecast
POD
CFO
DMO
AFS
0.00
0.10
0.20
0.30
0.40
0.50
0.60
0.70
0.80
0.90
1.00
day-1 day-2 day-3 day-4 day-5 day-6 day-7
forecast
FAR
CFO
DMO
AFS
Figure 3. CSI (left), POD (middle) and FAR (right) for HKO’s subjective forecasts (CFO), direct model output of ECMWF (DMO) and AFS during 1 October 2012 - 30 September 2013.
0.00
0.10
0.20
0.30
0.40
0.50
0.60
0.70
day-1 day-2 day-3 day-4 day-5 day-6 day-7
forecast
HIT
CFO
ECMWF
AFS
0.00
0.10
0.20
0.30
0.40
0.50
0.60
0.70
0.80
0.90
day-1 day-2 day-3 day-4 day-5 day-6 day-7
forecast
MA
LD
CFO
ECMEF
AFS
Figure 4. HIT (left) and MALD (right) for HKO’s subjective forecasts (CFO), direct model output of ECMWF (DMO) and AFS during 1 October 2012 - 30 September 2013.
17
01
2>=3
01
2>=3
0.0
5.0
10.0
15.0
20.0
25.0
30.0
35.0
Perc
enta
ge
ForecastObservation
01
2>=3
01
2>=3
0.0
5.0
10.0
15.0
20.0
25.0
30.0
Perc
enta
ge
ForecastObservation
01
2>=3
01
2>=3
0.0
5.0
10.0
15.0
20.0
25.0
30.0
35.0
Perc
enta
ge
ForecastObservation
01
2>=3
01
2>=3
0.0
5.0
10.0
15.0
20.0
25.0
30.0
35.0
Perc
enta
ge
ForecastObservation
01
2>=3
01
2>=3
0.0
5.0
10.0
15.0
20.0
25.0
30.0
35.0Pe
rcen
tage
ForecastObservation
01
2>=3
01
2>=3
0.0
5.0
10.0
15.0
20.0
25.0
30.0
35.0
Perc
enta
ge
ForecastObservation
01
2>=3
01
2>=3
0.0
5.0
10.0
15.0
20.0
25.0
30.0
35.0
40.0
Perc
enta
ge
ForecastObservation
01
2>=3
01
2>=3
0.0
5.0
10.0
15.0
20.0
25.0
30.0
35.0
40.0
Perc
enta
ge
ForecastObservation
01
2>=3
01
2>=3
0.0
5.0
10.0
15.0
20.0
25.0
30.0
35.0
40.0
Perc
enta
ge
ForecastObservation
Figure 5. Observations against CFO (top), DMO (middle) and AFS (bottom) for day-1 (left), day-4 (middle) and day-7 (right) forecasts during 1 October 2012 - 30 September 2013.