anaerobic digestion of wood ethanol stillage using upflow anaerobic sludge blanket reactor
TRANSCRIPT

Anaerobic Digestion of Wood Ethanol Stillage Using Upflow Anaerobic Sludge Blanket Reactor
I. J. Callander, T. A. Clark, and P. N. McFarlane* Biotechnolog y Section, Forest Research Institute, Rotorua, New Zealand
Accepted for publication December 30, 1986
The anaerobic digestion of wood ethanol stillage in a UASB reactor was studied. At organic loading rates be- low 16 kg COD/m3 day the reactor performed ef- fectively, achieving soluble COD and BOD removals in excess of 86 and 93%, respectively. Removal of color averaged 40%. At a loading rate of 16 kg COD/m3 day the methane yield was 0.302 L CH, (STP)/g COD removed, and the observed cell yield was 0.112 g VSS/g COD re- moved. Operation of the reactor at higher loading rates was unsuccessful. Nitrogen, phosphorus, and alkalinity were supplemented. No additions of the essential trace elements Fe, Co, and Ni were required.
INTRODUCTION
The New Zealand Forest Research Institute has per- formed pilot-scale studies of the production of ethanol from the softwood Pinus rudiutu. A dilute acid hydrolysis- fermentation-distillation process train was investigated.’ The major wastewater produced was the still bottoms prod- uct, or stillage, remaining after distillation. Stillage is a relatively strong, highly colored soluble wastewater. The organic matter is composed mainly of unfermented pentose sugars and carbohydrate and lignin degradation products. The characteristics of this wastewater have been described in detail elsewhere.’
Preliminary laboratory studies were performed to assess the amenability of this stillage to anaerobic digestion and to determine the nutrient supplements required.
A logical development of these earlier studies was to assess the suitability of an upflow anaerobic sludge blanket (UASB) reactor for the anaerobic digestion of this stillage. UASB reactors offer significant capital cost benefits over state-of-the-art methanogenic attached growth reactors, and they are therefore likely to be the preferred reactor type for a full-scale installation.
The objectives of this study were to determine whether commercial organic loading rates could be achieved in a
* To whom all correspondence should be addressed.
Biotechnology and Bioengineering, Vol. 30, Pp. 896-908 (1987) 0 1987 John Wiley tk Sons, inc.
laboratory-scale UASB reactor and to monitor the reactor for any operating problems such as inadequate biomass re- tention, excessive ash content of the biomass, and localized acid production. The nutrient requirements for satisfactory digestion were also investigated.
EXPERIMENTAL
Wastewater Characteristics and Preparation
Wood ethanol stillage was obtained from the New Zeal- and Forest Research Institute’s pilot-scale wood ethanol process, as has been previously described.2 The important characteristics of this stillage are summarized in Table I.* Following low-temperature neutralization in the pilot plant, the soluble sulfate concentration averaged 1800 mg/L. In a full-scale process a soluble sulfate concentration of 500 mg/L may be produced by neutralization at 140°C. In order to obtain this lower sulfate concentration the stillage was pretreated by a barium precipitation technique that has been fully described el~ewhere.~
The stillage was then stored at -20°C until required. This storage technique had no observable effect on stillage com- position. Upon thawing, nitrogen and phosphorus were added at concentrations of 240 mg N/L and 120 mg P/L, respectively. To achieve a suitable reactor alkalinity, 2.5-5.0 mL 20% NaOH was added to each liter of stillage prior to feeding.
Apparatus
The UASB reactor was constructed from two concentric perspex cylinders each with a wall thickness of 6 mm. The outer annulus was circulated with water maintained at 37°C.
The inner cylinder had a working volume of 10.0 L. A schematic diagram of the reactor and its ancillary equipment is presented in Fig. 1. The reactor was fitted with five ports that enabled the digester contents to be sampled at different
CCC 0006-3592/87/070896-13$04.00

Table I. Major characteristics of wood ethanol stillage.
Gas Collecting Cone
Water Seal Tube
Parameter
-3
Recycle Pump
- 2
Average value (mg/L except color and pH)
Eifluent
4
PH COD BODS Total solids Volatile solids Suspended solids Total nitrogen Total phosphorus Sulfate Color (chloroplatinate units)
4.5-5.0 25,500 13,200 13,700 8,800
400 95.3 10.3
1,800 4,200
Product - Gas Samole Point7
-+ Rake Motor
We’r \ Settling Region
Gas Dtverter -
Feed Pump
Figure 1. Schematic diagram of upflow anaerobic sludge blanket reactor.
heights. The gas production was measured with wet test gas meters (Wilhelm Ritter, Bochum, FRG). As the feed con- tainer emptied, the headspace was filled with oxygen-free nitrogen. This prevented the substantial fungal growth that otherwise occurred.
A rake was used to minimize localized acid production during start-up (days 1-32) when gas production was insuf- ficient to adequately mix the sludge bed. The rake, which was controlled by a timer and operated intermittently for 1 min in 5, turned at 1 rpm.
Effluent recycle was practiced as the soluble COD of the stillage was in excess of the 8-10,000 mg/L recommended as an acceptable feed concentration without excessive local-
ized production of organic acids o~curring.~~’ To provide an adequate dilution of the feed, effluent was recycled (see Fig. 1) at approximately 5 times the flow rate of the influent stillage.
Reactor Inoculation
The reactor’s seed was obtained from the following sources: (1) 6.0 L from the contents of a digester accli- matized to the stillage. The results of studies performed using this reactor have been reported el~ewhere.~ This in- oculum contained 6.66 g VSS/L. (2) 4.0 L of recently pro- duced effluent from the digester previously acclimatized to the stillage.
Prior to being transferred to the UASB reactor the inocu- lum had been subjected to an organic load of 0.6 kg COD/kg VSS day. Following inoculation, the UASB reac- tor contained 4.0 g VSS/L and a loading rate of 0.4 kg COD/kg VSS day, or 1.6 kg COD/m3 day, was imposed.
Reactor Operation
Four distinct phases occurred during the operation of the UASB reactor.
Phase I : initial loading phase. A low and uniform or- ganic loading rate was initially placed on the reactor to enable a suitably flocculent or granular biomass to develop before elevated loading rates were attempted.
Phase 2: increased loading phase. Once adequate bio- mass characteristics had developed, the loading rate was steadily, but gradually, increased until an operational load- ing rate, in the vicinity of 10 kg COD/m3 day was achieved.
Phase 3: operational phase. Subsequently, the loading rate was gradually elevated to 16.3 kg COD/m3 day to as- sess the effects on the UASB reactor’s performance.
Phase 4: inhibited phase. At the end of the operational phase inhibition of the biomass occurred. The results ob- tained constitute the inhibited phase.
The reactor’s performance during each of these opera- tional phases was analyzed in detail. Cell yield data, COD balances, degree of color removal, and requirements for nutrients and alkalinity were assessed.
Analytical Techniques
The sludge activity was determined by dividing the mass of COD removed daily by the mass of VSS in the reactor. The volumetric feed rate and the influent and effluent COD concentrations were used to calculate the mass of COD re- moved. The mass of volatile suspended solids was obtained by integrating the area under VSS profile curves (Fig. 10).
All other analytical methods used in this study have been fully described in an earlier p~blication.~
897 CALLANDER, CLARK, AND MCFARLANE: ANAEROBIC DIGESTION OF WOOD ETHANOL

RESULTS AND DISCUSSION
Initial Loading Phase (Days 1-32)
Over the first 20 days of operation the organic loading rate was gradually raised to approximately 3.6 kg COD/ m3 day where it was maintained until day 32 (Fig. 2). The objective of this low loading rate was to develop a suit- able mass of flocculent and granular organisms in the reac- tor before the elevated loading rates typical of commercial operation were attained. The success of the low loading rate in achieving its objective was indicated by the increase in the solids retention time (SRT) to 192 days during this pe- nod (Fig. 3).
During this phase of operation, the gas production mir- rored the organic loading rate, and from days 20 to 32 approximately 15 L/day of gas containing an average of 63% CH, and 36% CO, were produced (Fig. 4). The di- gester pH gradually decreased from the value of 7.1 at inoculation to between 6.8 and 6.9 (Fig. 5). The volatile fatty acids were generally at satisfactorily low concen- trations with propionate usually less than 50 mg/L and ace- tate generally less than 20 mg/L (Fig. 6). The exception was the propionate peak observed on days 24-28.
The probable cause of this sudden increase in the pro- pionate concentration was the use of a new batch of stillage from day 20 onward. This stillage had a COD of 30.5 g/L compared with 23.1 g/L for that previously used. Also, the concentrations of inhibitory compounds present in stillage, such as laevulinic acid, 5-hydroxymethylfurfural, and a range of low-molecular-weight phenolic^,^ were likely to have increased in proportion to the COD.
However, within 12 days, or 1.5 hydraulic residence times (HRTs), the methanogenic consortium had become
acclimatized to the new feedstock, and low VFA concen- trations were again observed. The use of effluent recycle undoubtedly dampened the fluctuations in organic concen- tration and assisted the reactor in accommodating this varia- tion in feed COD.
During this initial phase the percentage removals of or- ganic matter were good, with 88% removal of sCOD and 87% removal of tCOD being achieved (Fig. 7). The close- ness of these two values reflects the low concentration of effluent suspended solids being produced at the time and the high level of biomass retention within the reactor.
Increased Loading Phase (Days 32-80)
During the increased loading phase of operation the or- ganic loading rate (OLR) was increased from 3.6 to 9.3 kg COD/m3 day at a relatively uniform rate (Fig. 2). This period represents the transition from the establishment of a granular and flocculent biomass to a commercially ac- ceptable loading rate. An OLR of 10 kg COD/m3 day is a frequently used commercial design value.
This transitional phase was typified by all the signs of a healthy digester. Gas production increased steadily from approximately 15 L/day at day 32 to 42 L/day at day 80, whereas the methane and carbon dioxide content of the gas remained uniform at approximately 63 and 36%, respec- tively (Fig. 4). The pH varied between 6.8 and 7.0 (Fig. 5 ) , whereas the VFA concentrations were generally low with acetate averaging about 40 mg/L and propionate approxi- mately 70 mg/L (Fig. 6). One propionate peak, which reached 162 mg/L, occurred on day 70. No unusual circum- stances could be identified that may have caused this event.
During this period long SRTs, in the vicinity of 190 days, were initially maintained, but as the HRT decreased so did
1
0 20 40 60 80 100 DAYS
120
Figure 2. Chronological plot of organic loading rate and sludge activity
898 BIOTECHNOLOGY AND BIOENGINEERING, VOL. 30, NOVEMBER 1987

240-
200 - - U ..., w
I-
2
z 160- -
0 F 120. 2 w I- w D!
v) 80- a _1 z - 40-
e
10 40 80 80 100 120 140
DAYS
Figure 4. Chronological plot of gas production rate and gas composition.
I I I l o
0 10 2 0 30 40 50 60 70 80 90 100 DAYS
Figure 3. Chronological plot of solids and hydraulic retention times.
20 40 60 80 100 120 140
DAYS
Figure 5. Chronological plot of pH.
P 0 <
100.
0 20 40 60 80 100 120 140 DAYS
Figure 6. concentrations.
Chronological plot of acetic acid and propionic acid
the SRT, and by day 80 it had reached approximately 80 days (Fig. 3 ) . The fact that this value was 20 times the HRT demonstrated that the sludge was still highly flocculent.
Operational Phase (Days 80-98)
During this stage of operation the OLR increased from 9.6 to 16.4 kg COD/m3 day (Fig. 2) , indicating that OLRs similar to those used to design full-scale commercial UASB reactors could be obtained with wood ethanol stillage. This has therefore been termed the operational phase.
At the end of this stage the HRT had decreased to 2 days, whereas the SRT had also decreased to approximately 60 days (Fig. 3 ) . Compared with earlier studies using a
CALLANDER, CLARK, AND MCFARLANE: ANAEROBIC DIGESTION OF WOOD ETHANOL 899

96 - 94 - 9 2 -
- 9 0 -
- .3?
*-I - 3 8 8 -
G o > 86- O U I w a 8 4 - U O
0 8 2 -
0 Y m 80-
a 1
l - u l 6 0’ 7 8 -
76-
‘*
Figure 7. Chemical oxygen demand removal as function of organic loading rate
H Total COD
D-G Soluble COD
0 2 4 6 8 1 0 12 14 16 18
CSTR operated in a stirkettle mode,3 this was a long SRT and demonstrated the improved settling ability of the bio- mass in the UASB. The activity of this biomass was consis- tently in the range of 0.43-0.46 kg COD/kg VSS day (Fig. 2), which compared favorably with the average activity of 0.50 kg COD/kg VSS day observed in the stir/settle reac- tor.3 This confirmed that the only supplements required for satisfactory digestion were nitrogen, phosphorus, and alkalinity.
The gas production rate ranged from 4.4 to 68.5 L/day, and the gas composition averaged 62% methane and 38% carbon dioxide (Fig. 4). The pH of the reactor contents gradually increased from 6.85 to 7.14 (Fig. 5 ) , indicating that excess alkalinity was added over this period.
The removals of organic material remained satisfactory with the tCOD, C O D , and BODs removals averaging 82%, 86%, and 92% respectively (Fig. 7). The VFA concen- trations remained low during this phase of operation, with acetate generally remaining below 20 mg/L and propionate averaging approximately 50 mg/L (Fig. 6).
This operational stage conclusively demonstrated that a UASB reactor could successfully treat wood ethanol stillage at organic loading rates of up to 16 kg COD/m3 day with supplementation of only nitrogen, phosphorus, and alka- linity. This loading rate is in excess of commercially used loading rates.
Inhibited Phase (Days 98-130)
On day 98, increased propionate concentrations were ob- served at 75 mg/L (Fig. 6). The cause was initially consid- ered to be due to overloading as the OLR had been increased rather rapidly over the previous 7 days (Fig. 2). The OLR was therefore decreased to 13.3 kg COD/m3 day for 4 days. The gas production closely followed the organic loading rate over this period, although no plateau of gas production was
observed during the period 100-103 days, when a steady OLR was exerted (Fig. 4).
The pH was satisfactory at this time. The reduction in loading rate did not result in a decrease in the propionate concentration, and by day 105 propionate had increased to 269 mg/L (Fig. 6). However, on day 104 a fresh batch of stillage was used as the feedstock, and subsequent analyses demonstrated that this stillage had an iron concentration in excess of 1 g/L compared with the normal concentration of 150 mg/L.2 This feed stillage was used until day 119, when feeding was stopped.
On day 108 the feed was turned off for 48 h. In 24 h the propionate concentration decreased from 540 to 93 mg/L, whereas the acetate concentration increased from 0 to 21 rng/L. After 48 h, the acetate concentration was 15 mg/L, and the propionate concentration was 9.5 mg/L.
On day 110 feed to the reactor was resumed at an OLR of approximately 4.8 kg COD/m3 day, and this was main- tained for the remainder of the experiment (Fig. 2). Over the next 9 days the propionate concentration increased from 9.5 to 500 mg/L, whereas the acetate concentration was ele- vated to 158 mg/L from 15 mg/L (Fig. 6). Clearly, in- hibition of the biomass was occurring.
The reactor pH remained satisfactory throughout this pe- riod (Fig. 5 ) and was not the cause of the inhibition.
Wastewaters containing few sulfide precursors and up to 1400 mg Fe/L have been successfully treated in anaero- bic digesters.6 The high iron content of the stillage was therefore unlikely to be the inhibitory agent, and conclusive identification of the inhibitor must await the results of fur- ther studies.
COD Balance
On day 97, when the reactor was operating at its highest OLR of approximately 16 kg COD/m3 day, sufficient data
900 BIOTECHNOLOGY AND BIOENGINEERING, VOL. 30, NOVEMBER 1987

were gathered to permit a COD balance to be performed. The results obtained are summarized in Table 11.
At the time of sampling the UASB reactor was being fed 161 g COD/day, of which 116 g COD/day, or 72% of the feed COD, were stabilized as CH4. The effluent soluble COD was 3.83 g/L, or 14.5% of the influent COD. At this OLR the UASB reactor was therefore achieving an 85.5% removal of soluble COD.
Assuming that the effluent was saturated with methane at 37"C, 0.20 L CH,/day or 0.51 g COD/day would be re- moved as soluble methane in the effluent. The microbial reduction of sulfate to sulfide would consume 1.02 g COD/day or 0.63% of the mass flow rate of COD. Both of these factors were considered to be below the degree of uncertainty in the COD mass balance and have therefore been omitted from Table I.
The mass of COD converted to cells on a daily basis was calculated by difference. In the preceding case 21.7 g COD/day were converted to cells representing 13.5% of the influent COD. Assuming that 1 g VSS has a COD of 1.42 g,7 the observed cell yield at this OLR was 0.112 g VSS/g COD removed.
At this OLR the COD of the cells leaving the reactor in the effluent was in the range of 4.0-5.6% of the influent value. Using an average value of 4.8%, this implies that 13.5 - 4.8%, or 8.7%, of the influent COD was converted to cells that remained within the UASB. Thus, 64.4% of the mass of bacteria synthesized, or 0.061 g VSS/g COD re- moved, were retained within the reactor at this OLR. There- fore, throughout this experiment biomass was continuously accumulating in the digester, and unsteady state conditions prevailed.
The methane yield observed during this period was 0.302 L CH,/g COD removed.
Biomass Concentrations
The biomass concentration in the UASB steadily in- creased throughout this study (Fig. 8). Although the graph is based only on five sampling occasions, the trends are clearly apparent. The mass of VSS in the UASB increased from 40 g at inoculation to 122 g by day 55 and to 301 g on day 97.
A steady increase in the mineral content of the sludge was also observed with the VSS-TSS ratio decreasing with time from 0.60 at inoculation to 0.56 on day 55 and to 0.50 on day 97.
Table 11. Summary of COD mass balance on day 97." ~
Parameter %
Influent COD 161 100 Effluent COD as
CH, 116 72.0 sCOD 23.3 14.5 Cells 21.7 13.5
a HRT = 1.64 days, OLR = 16 kg COD/m3 day.
The biomass concentration profile changed significantly throughout the experiment (Fig. 9). By day 55 a dense sludge blanket containing approximately 37 g VSS/L oc- cupied the bottom 20% of the reactor volume, with low biomass concentrations occupying the upper 60% of the reactor. This VSS profile was similar to that reported for a full-scale UASB.' As the study continued and the total bio- mass in the reactor increased, the reactor volume occupied by the dense sludge blanket also increased so that after 87 days of operation 60% of the reactor volume consisted of the sludge blanket. By day 97 this had increased to 80%, and some problems were encountered with sludge filling the settling region.
Similar upward movement of the dense sludge bed has been previously reported for a pilot-scale UASB treating potato-processing ~as tewater .~
The VSS concentration in the lower 40% of the reactor volume ranged from 25 to 45 g/L and, with the exception of the data for day 87, increased throughout the study. This occurred despite decreased HRTs, which resulted in in- creased superficial fluid velocities and increased gas pro- duction, which caused increased gas superficial velocities. Both of these factors would have caused expansion of the bed, and decreased biomass concentrations may have been anticipated. However, the increase in the suspended solids concentration demonstrated that the superficial velocity ef- fects were more than offset by the improved settling ability of the biomass.
Cell Yields
The true growth yield (Y,) and the endogenous decay coefficient (kd) were determined by plotting (Yob3)-' vs. 8, (Fig. The resultant values obtained by linear re- gression were:
Y, = 0.191 g VSS/g COD removed
kd = 9.53 X W3 day-'
The Y, value compares favorably with literature data for methanogenic consortia growing on a range of complex substrates that range from 0.142 to 0.213 (Table 111). How- ever, it is substantially higher than the Y, value of 0.142 ob- served in a stirkettle reactor being fed the same wastewater.
The endogenous decay coefficient of 9.53 X loL3 day-' is near the low end of the data reported in the literature, which range from 5 X lo-' to 8.8 X day-' (Table IV). This wide spread of kd values is not surprising given the dependence of the maintenance energy requirements of a cell on a wide range of factors including ionic strength, futile cycles, and metabolic uncoupling."
Nitrogen and Phosphorous Requirements
Throughout this study nitrogen and phosphorus were sup- plemented at 240 mg N/L and 120 mg P/L of stillage fed. These additions were equivalent to 9.4 mg N/g COD and 4.7 g P/g COD fed. The soluble concentrations of these
CALLANDER, CLARK, AND MCFARLANE: ANAEROBIC DIGESTION OF WOOD ETHANOL 90 1

Total Suspended Solid8
Volalile Suspended Solids
1 1
0 10 20 30 40 50 60 70 80 90 100
DAYS
Chronological plot of mass of total and volatile suspended solids in UASB reactor. Figure 8.
1270
I
E - E 1016
I- I 2
762
a
$ 508
a
E w
254
0
VOLATILE SUSPENDED SOLIDS CONCENTRATION (g . 1 - l )
Figure 9. Profiles of volatile suspended solids at various sampling times.
H R T O L R ( d ) (kg COD m-3d-I)
day 5 5 4.4 5
day 6 7 3-3 - day a? 2 . 4 4
o---------O day 9 7 1 .6
3
2
1
10 20 30 40 50 60 70 80 90 100
nutrients observed in the UASB effluent ranged from 50 to 310 mg N/L and from 0.7 to 3.0 mg P/L over the course of this study. Limiting concentrations of either nutrient were not encountered.
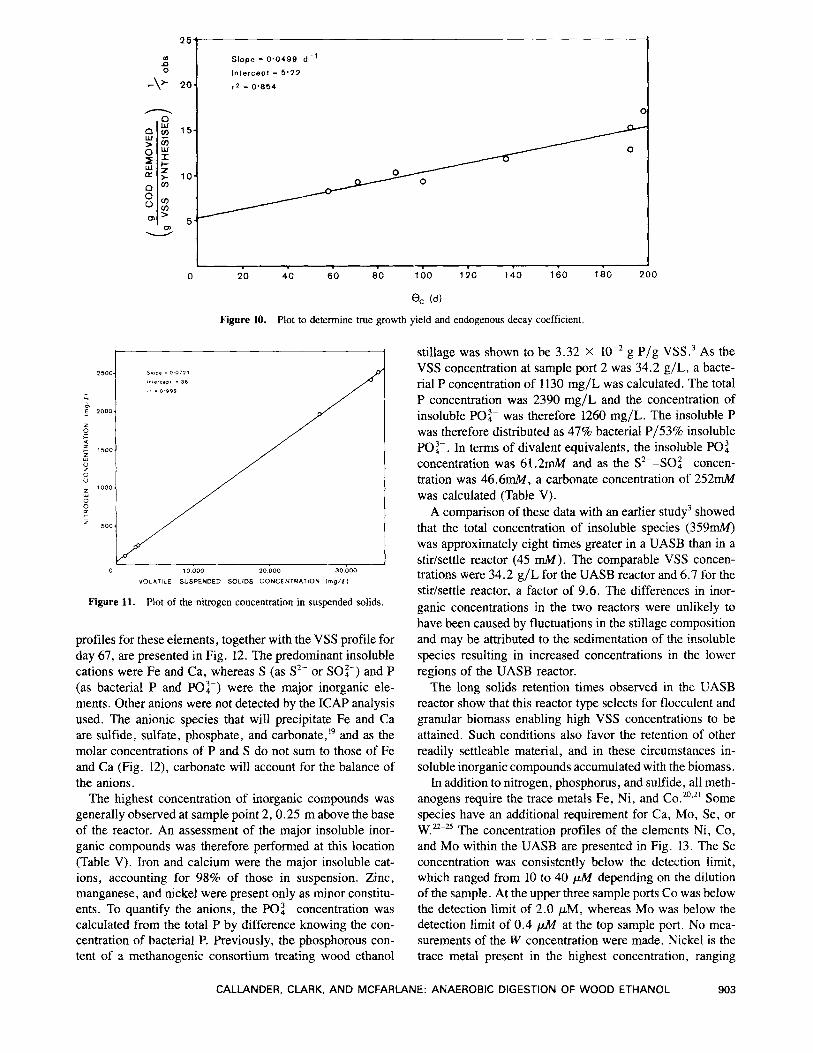
Using nitrogen uptake and VSS production data between days 54 and 66, the nitrogen content of the biomass was calculated to be 0.109 g N/g VSS. On day 67 nitrogen and VSS analyses were performed on suspended solids drawn from the reactor’s sampling ports. The nitrogen content of the biomass calculated using these data was 0.072 g N/g VSS (Fig. 11). An earlier study of the anaerobic digestion of wood ethanol stillage reported a biomass nitrogen content
902 BIOTECHNOLOGY AND BIOENGINEERING, VOL. 30,
of 0.091 g N/g VSS,’ which is approximately the average of the two nitrogen contents observed in this study. As the UASB data were sampled at similar times, the observed difference is unlikely to represent an actual variation in the nitrogen content of the biomass and may therefore be attrib- uted to sampling and analytical uncertainty.
Trace-Metal Considerations
An elemental analysis of the ash content of the suspended solids was performed on day 67. The major inorganic ele- ments present were Fe, Ca, S, P, and Zn. Concentration
NOVEMBER 1987
2 5 1 1 a 0 n
-\> 2 0 . - 0
Slope = 0 '0499 d - '
Intercept = 5 '22
r 2 = 0.854
0
10000 20 000 30 000
VOLATILE SUSPENDED SOLIDS CONCENTRATION l m g / l J
Figure 11. Plot of the nitrogen concentration in suspended solids.
0
= 0
profiles for these elements, together with the VSS profile for day 67, are presented in Fig. 12. The predominant insoluble cations were Fe and Ca, whereas S (as S2- or SO:-) and P (as bacterial P and PO:-) were the major inorganic ele- ments. Other anions were not detected by the ICAP analysis used. The anionic species that will precipitate Fe and Ca are sulfide, sulfate, phosphate, and carbonate," and as the molar concentrations of P and S do not sum to those of Fe and Ca (Fig. 12), carbonate will account for the balance of the anions.
The highest concentration of inorganic compounds was generally observed at sample point 2,0.25 m above the base of the reactor. An assessment of the major insoluble inor- ganic compounds was therefore performed at this location (Table V). Iron and calcium were the major insoluble cat- ions, accounting for 98% of those in suspension. Zinc, manganese, and nickel were present only as minor constitu- ents. To quantify the anions, the PO:- concentration was calculated from the total P by difference knowing the con- centration of bacterial P. Previously, the phosphorous con- tent of a methanogenic consortium treating wood ethanol
$ 15- w - 5 ;
? 10-
0 2 m' 5-
z = w e
stillage was shown to be 3.32 X g P/g VSS.3 As the VSS concentration at sample port 2 was 34.2 g/L, a bacte- rial P concentration of 1130 mg/L was calculated. The total P concentration was 2390 mg/L and the concentration of insoluble PO:- was therefore 1260 mg/L. The insoluble P was therefore distributed as 47% bacterial P/53% insoluble PO:-. In terms of divalent equivalents, the insoluble PO:- concentration was 61.2mM and as the S2--SO:- concen- tration was 46.6mM, a carbonate concentration of 252mM was calculated (Table V).
A comparison of these data with an earlier study3 showed that the total concentration of insoluble species (359mM) was approximately eight times greater in a UASB than in a stirkettle reactor (45 mM). The comparable VSS concen- trations were 34.2 g/L for the UASB reactor and 6.7 for the stirkettle reactor, a factor of 9.6. The differences in inor- ganic concentrations in the two reactors were unlikely to have been caused by fluctuations in the stillage composition and may be attributed to the sedimentation of the insoluble species resulting in increased concentrations in the lower regions of the UASB reactor.
The long solids retention times observed in the UASB reactor show that this reactor type selects for flocculent and granular biomass enabling high VSS concentrations to be attained. Such conditions also favor the retention of other readily settleable material, and in these circumstances in- soluble inorganic compounds accumulated with the biomass.
In addition to nitrogen, phosphorus, and sulfide, all meth- anogens require the trace metals Fe, Ni, and C O . ~ ~ . ~ ' Some species have an additional requirement for Ca, Mo, Se, or W.22-25 The concentration profiles of the elements Ni, Co, and Mo within the UASB are presented in Fig. 13. The Se concentration was consistently below the detection limit, which ranged from 10 to 40 ph4 depending on the dilution of the sample. At the upper three sample ports Co was below the detection limit of 2.0 pM, whereas Mo was below the detection limit of 0.4 ph4 at the top sample port. No mea- surements of the W concentration were made. Nickel is the trace metal present in the highest concentration, ranging
CALLANDER, CLARK, AND MCFARLANE: ANAEROBIC DIGESTION OF WOOD ETHANOL 903

1-4 1
. . . . , . . . . , . . . . , . - . . . , 0 500 loo0 1500 2000
IONIC CONCENTRATION (pM)
Figure 12. Profile of concentration gradients of major insoluble ions in reactor on day 67.
Table 111. substrates.
Summary of published true growth yields for methanogenic consortia utilizing complex
Y, Theoretical (T) Temperature (g VSS/g COD) or calculated (C) Reactor type Substrate ("C) Reference
~~~~~~
0.142 C - stillage 35 3 0.17 T - glucose 25 11
35 12 0.18 T 0.192 C contact glucose/peptone 35 13
0.208 C semicontinuous glucose 35 13
0.213 C contact piggery effluent - 14
- -
beef extract
contact
Table IV. methane from complex substrates.
Summary of published endogenous decay coefficients for anaerobic consortia producing
Endogenous decay coefficient (kd) Reactor Temperature
(days-') type Substrate ("C) Reference
0.005
0.0083 0.01 0.01-0.27 0.014 0.016 0.021
0.029
0.038
0.088
CSTR
stidsettle MARS CSTR CSTR contact contact
semicontinuous
CSTR
CSTR
contact
glucose, after
stillage whey permeate VFA nutrient broth piggery effluent glucose/peptone/
beef extract glucose
amino and fatty acids
glucose and starch
feeding ceased 35
35 35 35 35
35
35
35
35
-
15
3 16 17 15 14 13
13
15
15
from 1.4 to 1.7mM at the three lower sample ports. As with the major cations, the concentration profile for Ni closely follows the VSS profile. Such a profile is not so apparent for Co and Mo.
The essential trace metals were therefore all present in suspension within the zone of active metabolism at concen-
tration's above the reported growth-limiting levels (e.g., Fe < 5 pM, Ni < 0.25 pm, Co < 0.10 PM).~' As no soluble concentrations were measured, no firm conclusions can be made regarding growth limitation by trace nutrients. However, consideration of the amount of each element with- in bacterial cells and comparison with the precipitated and
904 BIOTECHNOLOGY AND BIOENGINEERING, VOL. 30, NOVEMBER 1987

Table V. Molar balance of major insoluble cations and anions at sample point 2 on day 67.
Concentration Mole percent of major Ion NLX Element (mM) precipitated ions
Cations Fe Ca Zn Mn Ni
239.2 113.5
2.9 2.1 1.7
66.5 31.6 0.8 0.5 0.5 __
Total cations 359.4 100.0
Anions Po:-' 61.2 S2- and SO:- 46.6
c0:y 251.6 -
17.0 13.0 70.0
Total anions 359.4 100.0
a Inorganic phosphate as divalent equivalents. Calculated by difference.
1.2
Lu I lY 0 0.6
0.2
0
IONIC CONCENTRATION (rn M)
VSS CONCENTRATION (9. L - l )
Figure 13. on day 67.
Profile of concentration gradients of essential trace elements for methanogenic bacteria in reactor
soluble equilibrium concentrations enables conclusions re- garding trace-metal availability to be drawn.
The insoluble inorganics may either be present in micro- bial biomass or in an insoluble form outside the cell.
Cellular concentrations of the essential inorganic ele- ments for the growth of methanogens have been calculated in relation to reactor height. The calculations are based on the following assumptions: (a) the bacterial mass constitutes 92% of the mass of the VSS,26 (b) all the methanogens grown are retained within the reactor and only acidogenic and acetogenic bacteria are washed out in the effluent, (c) the requirements of Methanobacterium thermoauto- trophicum for Fe, Ni, and Co are representative of all other methanogens, and (d) Escherichiu coli has trace-metal re-
quirements representative of the nonmethanogenic fraction of the biomass.
Schonheit et al. 23 have presented the tracemetal require- ments of M . thermoautotrophicum as
Fe = 10 pmol/g dry weight
Ni = 150 nmol/g dry weight
Co = 20 nmol/g dry weight
A maximum yield coefficient of 0.03 g VSS/g COD has been calculated for methanogenic bacteria.27 In this study a true growth yield of 0.191 g VSS/g COD was determined for the methanogenic consortium. As a mass balance showed that approximately 64% of the mass of cells syn-
CALLANDER, CLARK, AND MCFARLANE: ANAEROBIC DIGESTION OF WOOD ETHANOL 905

thesized were retained in the reactor, the maximum con- tribution of the methanogenic bacteria to the bacterial mass may be calculated to be 25%.
The iron requirement for E. coli has been documented as 25.9 pmol/g dry weight, and no requirements for nickel and cobalt were demonstrated for this bacterium.28 The phosphorous requirements were assumed to be 3.32 X lo-'
Using the preceding assumptions and knowing the VSS profile of the reactor (Fig. 9), the concentrations of P, Fe, Ni, and Co within bacterial cells at various locations within the UASB reactor may be calculated (Table VI). These data are also presented as a percentage of the total concentration of that element observed in the suspended solids.
On day 67 the sludge bed was between 0.51 and 0.76 m high. The VSS concentrations in the sample ports below the 0.6-m height ranged from 26.5 to 34.2 g/L, whereas those at ports above this height varied from 1.08 to 2.84 g/L. Consideration of these VSS concentrations aids in the inter- pretation of the data in Table VI.
Within the sludge bed, approximately 50% of the in- soluble phosphorus was present in the biomass with the remainder present as a precipitate. Above the sludge bed most of the insoluble phosphorus was present within bacte- ria, indicating that the precipitated forms of phosphorus are being selectively retained within the sludge bed.
The bacterial concentrations of the Fe, Ni, and Co in the sludge bed constituted a much smaller fraction of the in- soluble component of those elements than did the phos- phorus. Within the sludge bed bacterial concentrations of Fe and Ni represented approximately 0.20-0.30% and 0.07%, respectively, of the metal concentrations in the suspended solids, whereas Co ranged from 0.2 to 0.8% (Table VI). At sample ports above the sludge bed the proportion of the Fe and Ni present in bacteria was higher than within the sludge bed, again indicating preferential retention of the precipi- tated species.
The assumptions made previously regarding bacterial mass and inorganic concentrations appear valid given the small proportion of Fe, Ni, and Co calculated to be within bacterial cells. A substantial variation in bacterial mass and trace nutrient requirements would be required to alter the conclusions drawn.
g/g vss.26
Essentially, all the Fe, Ni, and Co in suspension was therefore present as either inorganic precipitates or as or- ganic chelates. The availability of these compounds to the microorganisms will therefore be controlled by one of the following factors29: (a) soluble concentrations in equilibrium with inorganic precipitates, (b) soluble concentrations present as ion pairs, (c) soluble concentrations in equi- librium with organic chelators, and (d) the ability of indi- vidual bacterial species to scavenge for these elements using microbially produced chelators such as enterochelin. 30
There are sufficient published data to calculate the soluble concentrations in equilibrium with the inorganic precipi- tates. However, a lack of knowledge regarding the natural and microbially synthesized organic chelators present in the system precludes any calculation of the soluble concen- trations in equilibrium with these compounds.
Within the reactor, hydroxide, phosphate, carbonate, and sulfide may be precipitating anions. In this study all four anions were consistently present in solution. Therefore, Fe, Ni, and Co will be precipitated as sulfide^,'^ and their solu- ble concentrations will be approximately
[Fez+] = 2 X IO-"M
[Ni2+] = 5 x lO-I3M
[coz+l = 2 x 10-%2
These concentrations are substantially less than the re- ported growth-limiting concentrations for methanogens ." Similar observations have been reported previously with measured soluble Fe concentrations 6 X lo5 greater than predicted by solubility considerations, whereas the maxi- mum discrepancy for Co was approximately lo9.'' The.=& uble concentrations of the essential trace metals are clearly present at concentrations above those predicted by solubility criteria, and providing some of the trace element is present, its availability to bacteria is probably controlled by one, or a combination, of the following factors: (a) the presence of natural chelators in the wastewater and their bio- degradability, (b) the availability of inorganic species that may form ion pairs with the essential metals, and (c) the capability of the methanogenic consortium to synthesize chelating agents.
Table VI. Calculated bacterial mineral concentrations as a proportion of those in suspended solids on day 67
Phosphorus Iron Nickel Cobalt
Height of sample port from Bacterial As fraction Bacterial As fraction Bacterial As fraction Bacterial As fraction
reactor base concentration of P in SS concentration of Fe in SS concentration of Ni in SS concentration of Co in SS (m) (mg/L) (%) (mg/L) (%) ( P d L ) (%) (Ccg/L)
1.27 35.9 > 100 1.01 1.77 1.98 0.76 0.26 1.02 83.7 71 2.52 0.48 4.95 0.10 0.66 0.762 94.3 72 3.02 0.49 5.95 0.10 0.80 0.508 88 1 48 27.2 0.28 53.5 0.07 7.18 0.70 0.254 1,130 41 34.2 0.20 67.4 0.07 9.04 0.23 0 1.110 52 33.2 0.27 65.4 0.07 8.78 0.75
Concentration of element in suspended solids below detection limits.
906 BIOTECHNOLOGY AND BIOENGINEERING, VOL. 30, NOVEMBER 1987

The large discrepancies observed between actual soluble metal concentrations and those predicted by solubility crite- ria indicate the importance of the techniques listed in in- creasing metal availability.
These considerations also imply that if sulfate reduction is occurring and if the essential trace metals are present in suspension, then metal supplementation should probably not be practiced as it serves primarily to increase the ash content of the suspended solids. This is disadvantageous as it oc- cupies expensive reactor space with inert material and may adversely affect the growth of a granular sludge.
The addition of nonbiodegradable chelating agents may therefore hold more promise than direct nutrient supple- mentation in improving the performance of trace-metal- deficient methanogenic fermentations.
Color Removal
Wood ethanol stillage is highly colored due to the pres- ence of chromophoric materials originating from sugar deg- radation and lignin-derived phenolics. * The removal of color will be an important consideration in the disposal of such wastewaters.
During this study few color measurements were made (Table VII). The color of the raw stillage is variable and is dependent on the hydrolysis conditions. This variability in feedstock color has caused a spread in the observed per- centage of color removals. Significantly, the color of the effluent increases steadily with an increase in organic load- ing rate and at a realistic commercial loading rate of 10 kg COD/m3 day the effluent will contain approximately 2000 CPUs. Such an effluent is still highly colored.
CONCLUSIONS
Wood ethanol stillage is amenable to treatment in a UASB reactor at organic loading rates of up to 16 kg COD/m3 day. At higher loading rates inhibition was observed.
Using stillage containing approximately 500 mg SO:-/L, very good removals of soluble organic carbon were obtained. At loading rates in the range 10-16 kg
Table VII. Color removal obtained in UASB reactor.
Color Organic loading rate Color removal
(kg COD/m' day) Sample (CPUa at pH 7.0) (%)
1.6 raw stillage 2500 - UASB effluent 1500 40
10.8 raw stillage 4170 - UASB effluent 2085 50
17.8 raw stillage 3750 - UASB effluent 2500 33
a CPU = chloroplatinate unit.
COD/m3 day, soluble COD and BOD5 removals averaged 86 and 93%, respectively. Color removal averaged 40%.
The stillage was nutrient deficient, and to ensure growth was carbon limited, supplements of 240 mg N/L stillage and 120 mg P/L were used. An average of 3.7 mL 20% NaOH/L was added to provide an adequate reactor alka- linity. No other nutrients were supplemented, and the pres- ence of insoluble Fe, Ni, and Co in the lower regions of the reactor indicated their availability would be limited by their solubility and that low levels of supplementation would not have significantly increased their availability.
The authors wish to thank Mrs. F. Harris for her skilled technical assistance under the direction of the late Dr. I. J. Callander. This research was funded by the New Zealand Liquid Fuels Trust Board.
References
1. R. J. Burton, G . P. Horgan, I. J . Callander, T. A. Clark, and K. L. Mackie, Proceedings VIth Alcohol Fuels Technology Symposium, Ottawa, Canada, Vol. 2 (Royal Society of Canada, Ottawa, 1983), p. 2114.
2. I. J. Callander, T. A. Clark, P. N. McFarlane, and K. L. Mackie, Envi- ron. Tech. Lett., 7 , 325 (1986).
3. I. J . Callander, T. A. Clark, and P.N. McFarlane, Environ. Tech. Lett., 7, 397 (1986).
4. R. I. Sax, M. Holz, and J. E. Roberts, Symp. Pap. Energ. Biomass, 5, 413 (1981).
5 . L. van den Berg, M. F. Hamoda, and K. J. Kennedy, Proceedings of the Third Bioenergy Seminar, Ottawa, Canada (National Research Council, Ottawa, 1981), p. 108.
6 . A. W. Lawrence and P. L. McCarty, 3. War. Polfut. Contr. Fed., 37, 392 (1965).
7. Metcalf and Eddy Inc., Wastewater Engineering: Treatment, Dis- posal, Reuse (McGraw Hill, New York, 1979).
8. K. C. Pette, R. de Vletter, E. Wind, and W. van Gils, Proceedings of the Thirty-Fifth Industrial Waste Conference, Purdue University (Ann Arbor Science, Ann Arbor, 1981), p. 635.
9. G. Lettinga, Proc. An. Dig. Conf. .. Recent Developments in Tech- nology and Control, University of Sydney, Australia (University of Sydney, Sydney, 1982), p. 49.
10. J. Fieschko and A.E. Humphrey, Biotechnol. Bioeng., 26, 394 (1984).
11. R. M. Sykes, i. War. Pollut. Contr. Fed., 47, 591 (1975). 12. M. Henze and P. Harremoes, Wat. Sci. Technol., 15 (8/9), 1 (1983). 13. G. K. Anderson and T. Donneliy, New Processes of Wastewater Treat-
ment and Recovery, G . Mattock, Ed. (Ellis Hanvood, Chichester, 1978), p. 75.
14. J . A. Oleszkiewicz and S . Koziarski, J . Environ. Eng. Div., A X E , 108 (EEZ), 367 (1982).
15. R. E. Speece and P.L. McCarty, Adv. War. Pollut. Res.. 2, 305 (1964).
16. P. M. Sutton, A. Li, R. R. Evans, and S. Korchin, Proceedings offhe Thirty-Seventh Industrial Waste Conference, Purdue University (Ann Arbor Science, Ann Arbor, 1982), p. 667.
17. A. W. Lawrence and P. L. McCarty, .I. War. Pollut. Contr. Fed., 41 (21, R1 (1969).
18. D. W. Tempest and 0. M. Neijssel, Ann. Rev. Microbiol., 38, 459 (1984).
19. I. J. Callander and J. P. Barford, Biotechnol. Bioeng., 25, 1959 (1983).
CALLANDER, CLARK, AND MCFARLANE: ANAEROBIC DIGESTION OF WOOD ETHANOL 907

20. R. E. Speece, Environ. Sci. Technol., 17, 416A (1983). 21. K. R. Sowers and J.G. Ferry, Arch. Microbiol., 142, 148 (1985). 22. P. Scherer and H. Sahm, Actu Biotechnol., 1, 57 (1981). 23. P. Schonheit, J. Moll, and R. K. Thauer, Arch. Microbiol., 123, 105
24. P. A. Murray and S. H. Zinder, Appl. Environ. Microbiol., 50, 49
25. J. B. Jones and T. C. Stadtman, J . Bucreriol., 130, 1404 (1977). 26. I. I. Callander, Waste Disposal from Acid HydrolysidFermentation of
(1979).
(1985).
Wood, Liquid Fuels Trust Board Report LF 5008, Wellington, New Zealand, 1985.
27. M. Henze and P. Harremoes, Wut. Sci. Tech., 15, 1 (1983). 28. S. E. Luria, in The Bacteria, Vol. 1, I. C. Gunsalus and R. Y. Stanier,
29. I. J. Callander and J. P. Barford, Biotechnol. Bioeng., 25, 1947
30. S. Heidinger, V. Braun, V. L. Pecoraro, and K. N. Raymond, J . Buc-
Eds. (Academic, New York, 1960). p. 15.
(1983).
teriol, 153, 109 (1983).
908 BIOTECHNOLOGY AND BIOENGINEERING, VOL. 30, NOVEMBER 1987