anaerobic digestion of simulated distillery waste using flocculated and fixed cell reactors
TRANSCRIPT

This article was downloaded by: [McGill University Library]On: 17 December 2014, At: 10:18Publisher: Taylor & FrancisInforma Ltd Registered in England and Wales Registered Number:1072954 Registered office: Mortimer House, 37-41 Mortimer Street,London W1T 3JH, UK
Journal of EnvironmentalScience and Health .Part A: EnvironmentalScience and Engineeringand Toxicology: Toxic/Hazardous Substances andEnvironmental EngineeringPublication details, including instructions forauthors and subscription information:http://www.tandfonline.com/loi/lesa19
Anaerobic digestion ofsimulated distillery wasteusing flocculated and fixedcell reactorsH.M. Kitsos a c , W.J. Jones b d , R.S. Roberts a
& T.G. Tornabene ba School of Chemical Engineering , GeorgiaInstitute of Technology , Atlanta, GA, 30332b School of Applied Biology , Georgia Instituteof Technology , Atlanta, GA, 30332c National Starch and Chemical Company ,Plainsfield, NJ, 07063d US‐EPA , Athens, GA, 30613Published online: 15 Dec 2008.
To cite this article: H.M. Kitsos , W.J. Jones , R.S. Roberts & T.G. Tornabene(1993) Anaerobic digestion of simulated distillery waste using flocculatedand fixed cell reactors, Journal of Environmental Science and Health .Part A: Environmental Science and Engineering and Toxicology: Toxic/Hazardous Substances and Environmental Engineering, 28:5, 1099-1121, DOI:10.1080/10934529309375931

To link to this article: http://dx.doi.org/10.1080/10934529309375931
PLEASE SCROLL DOWN FOR ARTICLE
Taylor & Francis makes every effort to ensure the accuracy of allthe information (the “Content”) contained in the publications on ourplatform. However, Taylor & Francis, our agents, and our licensorsmake no representations or warranties whatsoever as to the accuracy,completeness, or suitability for any purpose of the Content. Anyopinions and views expressed in this publication are the opinions andviews of the authors, and are not the views of or endorsed by Taylor& Francis. The accuracy of the Content should not be relied upon andshould be independently verified with primary sources of information.Taylor and Francis shall not be liable for any losses, actions, claims,proceedings, demands, costs, expenses, damages, and other liabilitieswhatsoever or howsoever caused arising directly or indirectly inconnection with, in relation to or arising out of the use of the Content.
This article may be used for research, teaching, and private studypurposes. Any substantial or systematic reproduction, redistribution,reselling, loan, sub-licensing, systematic supply, or distribution in anyform to anyone is expressly forbidden. Terms & Conditions of accessand use can be found at http://www.tandfonline.com/page/terms-and-conditions
Dow
nloa
ded
by [
McG
ill U
nive
rsity
Lib
rary
] at
10:
18 1
7 D
ecem
ber
2014

J. ENVIRON. SCI. HEALTH, A28(5), 1099-1121 (1993)
Anaerobic Digestion of Simulated DistilleryWaste Using Flocculated and Fixed Cell
Reactors
H.M. Kitsos*School of Chemical Engineering
Georgia Institute of Technology, Atlanta, GA 30332
W.J. JonestSchool of Applied Biology
Georgia Institute of Technology, Atlanta, GA 30332
R.S. RobertsSchool of Chemical Engineering
Georgia Institute of Technology, Atlanta, GA 30332
T.G. Tornabene*School of Applied Biology
Georgia Institute of Technology, Atlanta, GA 30332
Abstract
One- and two-stage reactors were used to investigate the reductionin chemical oxygen demand (COD) of simulated stillage waste from anethanol distillery. In both configurations, cells both flocculated and fixed
* Current address: National Starch and Chemical Company, Plainsfield, NJ 07063.† Current address: US-EPA, Athens, GA 30613.‡ To whom correspondence should be sent.
1099
Copyright © 1993 by Marcel Dekker, Inc.
Dow
nloa
ded
by [
McG
ill U
nive
rsity
Lib
rary
] at
10:
18 1
7 D
ecem
ber
2014

1100 KITSOSETAL.
on a support matrix were utilized. A COD removal above 90% andmethane production of about 4 L/L day were obtained in both the one-and two-staged reactors. Electron microscopy revealed differences in themicrobial structure and bacterial populations comprising the flocculentbiomass and the biofilm attached to the support matrix. Early detectionof hydrogen and propionic acid increases were an indicator of pendingreactor instability.
Introduction
Recent advances in understanding the microbiology of diverse anaerobic bac-teria [1-10], biofilm formation [9-11], and development of new reactor con-figurations [12-14] are providing fundamental information that is requiredfor the development of anaerobic methanogenic fermenters for the effec-tive treatment of liquid waste. Different anaerobic reactor systems haveevolved over the last decade varying from laboratory experimental to full-scale size [12-15]. Despite this progress, additional data on the growth kinet-ics, substrate utilization, mass transfer limitations, inoculation procedures,operational parameters, and control of bacterial flocculation/biofilm devel-opment are needed for rigorous design of efficient and reliable systems [15-30].
A series of experiments with one- and two-stage bioreactors was con-ducted in this laboratory to acquire the additional data required for the designof full-scale systems [31]. Different biofilm matrices were also tested in a spe-cially designed apparatus to measure biofilm development The experimentswere conducted to identify major operational parameters which enhance theattachment of anaerobic bacteria to matrices, reduce the start-up times ofanaerobic biofilm reactors, and achieve high productivity and operational sta-bility. The results reported in this manuscript are the operational parametersof a two-stage and one-stage reactor that culminated from this study. Theresults from the study on the biofilm development have been previously re-ported [32].
Methods and Materials
Reactor Systems
Two reactor systems were used in this study. The first was an 80-L, two-stagereactor consisting of two vertical columns with rectangular cross section di-
Dow
nloa
ded
by [
McG
ill U
nive
rsity
Lib
rary
] at
10:
18 1
7 D
ecem
ber
2014

SIMULATED DISTILLERY WASTE 1101
mensions of 18.5 cm x 18.8 cm and a volume ratio of stage 2/stage 1 of approx-imately 2.2 (approximate lengths of 79 cm and 158 cm, respectively, Figure 1).The ratio of 2.2 was estimated on the basis of the longer bioconversion timerequired for some fermentation products (propionate, butyrate) to CH4. Thereactor columns were constructed from plexiglas (1.27 cm thick). The bottomof each column consisted of an inverted pyramid with a 50° side inclinationfrom the horizontal. At the top of each column, removable covers were in-stalled with rubber gaskets and fastened with hexagonal bolts.
Continuous pH monitoring was accomplished with a pH probe coupled toa pH microprocessor. The pH was adjusted by alkali addition to the first stage.The immobilization matrix was a ceramic material (Johns Manville Corpora-tion, PPR-8623) in tubular configuration with cross-sectional dimensions of23.5 mm (o.d.) and 16 mm (i.d.). Thirty-six matrix tubes per cross section areawere placed in stainless steel cartridges and loaded into the reactor chambers.The immobilization cartridge did not extend into the bottom 10% of eitherstage nor the top 10% and 5% of stages 1 and 2, respectively. The overall spe-cific surface area of the support matrix was 110 m2/m3 of reactor. The totalempty liquid volume of the system was 74 L while the active liquid volume ofthe reactor containing the matrix was 62.5 L. The loading rates given in thetext were calculated on the basis of the internal reactor volume.
The two-stage reactor was operated in series in an upflow mode with anadditional, separate feed line to the second stage resulting in a parallel-plus-series feeding pattern. The reactor system was operated in a temperaturecontrolled room at 37 °C. The feed was delivered with a variable speed Mas-terflex peristaltic pump. A conical-shaped insert was installed at the reactorinlets to enhance feed distribution. A pressure gauge was connected at thefeed inlet of the first stage to monitor the head pressure of the reactor. Atthe exit of the second stage, a T-shaped glass tube was installed for mount-ing a liquid level controller for biogas removal and collection. The controlleractivated a pump for biogas removal when the liquid level fell below the setpoint due to the pressure buildup from the gas accumulation. A two-psi checkvalve was installed in the final effluent line to keep the system under positivepressure. The biogas was collected and its volume measured by water dis-placement.
The second test system was a single-stage reactor that closely resembledthe first stage of the two-stage reactor (Figure 1) with the exception that itwas made of glass and was water-jacketed for temperature control in a non-incubated room. The dimension of the column was 7.0 cm i.d. x 94 cm length
Dow
nloa
ded
by [
McG
ill U
nive
rsity
Lib
rary
] at
10:
18 1
7 D
ecem
ber
2014
1102 KTTSOS ET AL.
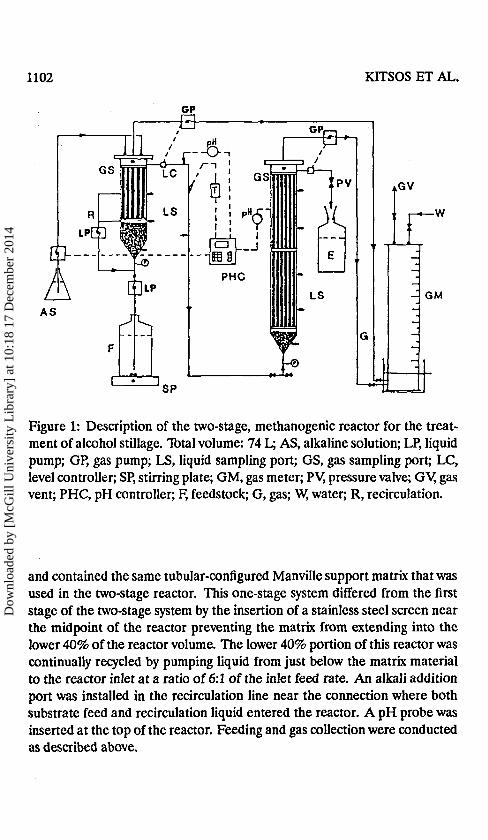
Figure 1: Description of the two-stage, methanogenic reactor for the treat-ment of alcohol stillage. Total volume: 74 L; AS, alkaline solution; LP, liquidpump; GP, gas pump; LS, liquid sampling port; GS, gas sampling port; LC,level controller; SP, stirring plate; GM, gas meter; PV, pressure valve; Gy gasvent; PHC, pH controller; F, feedstock; G, gas; W, water; R, recirculation.
and contained the same tubular-configured Manville support matrix that wasused in the two-stage reactor. This one-stage system differed from the firststage of the two-stage system by the insertion of a stainless steel screen nearthe midpoint of the reactor preventing the matrix from extending into thelower 40% of the reactor volume. The lower 40% portion of this reactor wascontinually recycled by pumping liquid from just below the matrix materialto the reactor inlet at a ratio of 6:1 of the inlet feed rate. An alkali additionport was installed in the recirculation line near the connection where bothsubstrate feed and recirculation liquid entered the reactor. A pH probe wasinserted at the top of the reactor. Feeding and gas collection were conductedas described above.
Dow
nloa
ded
by [
McG
ill U
nive
rsity
Lib
rary
] at
10:
18 1
7 D
ecem
ber
2014

SIMULATED DISTILLERY WASTE 1103
Table 1: Compositions of synthetic feedstocks for enrichment culture ex-periments and bioreactor operations.
Component
SucroseYeast autolysateSodium glutamateAcetic acidPropionic acidButyric acidEthanolMethanolIsobutanolIsoamyl alcoholn-propanoln-butanolCitric acidNH4CINa2HPO4
KC1Na2SO4MgCl2-6H2OCaCl2-2H2ONiCl2-6H2OTrace metals6
pH
Alcohol stillage"(perL)12.00 g8.00 g0.30 g1.05 g0.10 g0.19 g0.95 g0.55 g0.04 g0.04 g0.04 g0.04 g0.04 g0.25 g0.64 g1.40 g0.70 g1.20 g1.50 g0.02 g2.00 mL5.6
VFA mixture"(perL)
_0.10 g
-17.60 g4.60 g3.20 g
-—----—
2.10 g0.64 g1.40 g0.70 g1.20 g1.50 g0.02 g2.00 mL4.8
"Corresponds to 30,000 mg COD/L.^Composition according to Batch et al. [33].
Inoculation and Feeding Strategy
The microbial inocula for the 80-L reactor system was generated from twoseparate enrichment cultures. The first stage of the 80-L reactor was inocu-lated with a mesophilic enrichment cultivated for 45 days on synthetic alco-hol stillage (Table 1). This inoculum was enriched to a biomass concentra-tion of 10.6 g volatile solids/L with a methanogenic activity of 4.2 g acetateconsumed/L-day. The second stage of the 80-L reactor was inoculated with a
Dow
nloa
ded
by [
McG
ill U
nive
rsity
Lib
rary
] at
10:
18 1
7 D
ecem
ber
2014

1104 KITSOS ET AL.
methanogenic enrichment cultivated for 45 days at 37 °C with a volatile fattyacids (VFA) mixture (Table 1) as primary substrate. The enrichments werecontrolled to select predominantly for acetogens and methanogens. The eval-uations of the enrichments were determined by measuring the acetate con-sumption and methane production rates.
A fed-batch withdrawing procedure was used throughout the cultureenrichment process to enhance the accumulation of settling (fiocculent)biomass and to eliminate filamentous buoyant cell growth. This was achievedby periodically discontinuing the mixing of the enrichment culture for 30 minfollowed by withdrawal of the upper 20% of the liquid from the vessel. In thisway, floating and suspended biomass was withdrawn from the culture whilesettled biomass remained within the systems. The appropriate feedstock wasthen mixed with continuous stirring. At the time of inoculation into the 80-Lreactor, the enrichment culture had a biomass concentration of 6.2 g volatilesolids/L and a microbial (predominantly methanogenic) activity of 0.66 g ac-etate consumed/L-day. Each reactor stage was inoculated by circulating theinoculum throughout the reactor for 24 h prior to continuous addition of feed-stock.
The one-stage reactor was inoculated with flocculated biomass and mixedliquid from the lower 40% section of the first stage of the 80-L reactor. A 2:1ratio of feedstock/inoculum was used to maintain the cells in their physiolog-ical growth phase. The mixture was recycled internally for 24 h. After theinoculation period, continuous operation was begun with fresh feedstock.
The feedstock consisted of synthetic alcohol stillage (Table 1) which wasformulated from the mean composition of stillages produced in ethyl alcoholdistilleries [34] and known trace metal requirements of anaerobes [33]. Theessential ingredients were a soluble mixture of sucrose, yeast extract, gluta-mate, citric acid, volatile fatty acids, alcohols, and mineral salts. In thesestudies, the COD of the feed varied from 1 to 30 g/L.
Analytical Methods
The hydraulic retention time was determined by using a pulse-input/responsetechnique using Li+ tracing for flow distribution analysis [35]. Li+ was mea-sured with a Perkin-Elmer Model 2380 Atomic Emission Spectrometer.
Volatile organic acids were determined with a \&rian 3700 gas chromato-graph (GC) equipped with FID, a Varian 402 data system, and a 1.83-m x0.32-cm glass column packed with Porapack-Q, 80-100 mesh. Reactor sam-
Dow
nloa
ded
by [
McG
ill U
nive
rsity
Lib
rary
] at
10:
18 1
7 D
ecem
ber
2014

SIMULATED DISTILLERY WASTE 1105
pies were prepared for GC injection by centrifugation and then acidificationwith 0.05 mL of 18M H2SO4 per milliliter of supernatant. Gas compositionwas determined at room temperature using a thermal conductivity detectorand the following columns: a) 1.83-m x 0.32-cm molecular sieve 5A column,80-100 mesh for the analysis of CH4, N2 and O2; b) 1.83-m x 0.16-cm columnpacked with silica gel, 60-70 mesh for the analysis of CO2; and c) 1.83-m x0.32-cm column containing Porapack Q, 80-100 mesh for measuring H2. He-lium was the carrier gas at a flow rate of 30 mL/min but was replaced by N2for analysis of H2.
Total suspended solids (TS) and volatile suspended solids (VS) were de-termined by standard methods [36] with the modification that 10-mL sam-ples were centrifuged for 15 min at 15,000 rpm. The pellet was rinsed withdistilled water, recentrifuged and then transferred to preweighed aluminumdishes. The dishes were placed in an oven at 105 °C for 12 h, weighed, andtransferred to a muffle furnace at 550 °C for 30 min. The difference betweendried and ashed weights represented the VS while the difference between thedried and the empty dish weight gave the TS. Alkalinity was determined bystandard procedures [36]. The gas phase concentration of hydrogen sulfidewas determined by Cline's method [37] after trapping biogas in zinc acetatesolution (2N). Carbohydrate and protein were determined spectrophotomet-rically using the phenol-sulfuric acid [38] and Folin-Lowry [39] methods, re-spectively.
Scanning electron microscopy (SEM) was accomplished with a Cam-bridge SEM using 20 kV accelerating voltage and 10 kA current inten-sity. Preparatory procedures were essentially those described by Dawes [40].Transmission electron micrographs (TEMs) of thin sections of biomass weretaken with a Philips E-200 Electron Microscope. Biomass and biofilm ac-cumulation on matrix materials were estimated by liquid displacement tech-niques described by Characklis et al. [41]. The difference between the dis-placement of water by the original wetted-matrix and the biofilm covered ma-trix was determined as an estimate of biomass/biofilm accumulation duringthe course of the experiment. The bacterial flocs/granular biomass particleswere measured with a diagnostic microscope (x 10) and a Venier micrometerafter the samples were appropriately diluted in an isotonic buffer and spreadon a pyrex plate for single particle isolation. The granules/bacterial floes werealso examined by SEM, TEM, Light diffraction microscopy (LDM) and X-raydiffraction analysis.
Dow
nloa
ded
by [
McG
ill U
nive
rsity
Lib
rary
] at
10:
18 1
7 D
ecem
ber
2014

1106 KITSOS ET AL.
U g
100
80
60
40
20
COD Removal
COD Load
CH4-stage1
CH4-stage2
0 10 20 30 40 50 60 70
Time (days)
Figure 2: Profile of COD load, COD removal, and CH4 composition of thegas phase of the two stage methanogenic reactor.
Results
Performance of the TVvo-Stage Reactor
The two-stage bioreactor was designed to anaerobically treat a range of or-ganic loads. The reactor, containing a combined granular sludge-bed andimmobilization matrix, was operated for a period of 65 days on a syntheticwaste stream (Table 1). Fresh feedstock was supplemented to reactor stagetwo at a ratio of one part fresh feed to two parts of stage one effluent. Thisfeeding method was sufficient to maintain an active biomass in both reactorstages during start-up and periods of low substrate levels.
During the continuous operation with a hydraulic retention time (HRT) of45 h, the COD level of the feedstock was increased gradually from 1,500 mg/Lto 30,000 mg/L within a period of 53 days (Figure 2, Table 2), correspondingto an organic load of 0.5-14.6 g COD/L-day. The relative concentrations ofVFAs in the effluents of both reactor stages are given in Table 3. The dif-
Dow
nloa
ded
by [
McG
ill U
nive
rsity
Lib
rary
] at
10:
18 1
7 D
ecem
ber
2014

Table 2: Performance data of the two-stage 80-L reactor."
Time(days)
13814162022252628303234384044525364
Feed C O D(mg/L)
1500300030003000450045006000600090009000116001200015000150002000025000250003000030000
C O D load(g/L-day)
0.51.11.21.01.41.52.12.23.53.43.94.16.66.88.611.112.414.613.4
COD removal(%)
48.077.079.081.587.092.093.595.295.095.695.494.594.494.793.394.694.394.191.9
COD (mg/L)a
S-l
90084040029075054077553086589599010552080170023102450337041204810
S-2
78069064055559537539029045040053066084080013501345143017802440
Biogas yield(L/gCOD)
0.130.140.190.270.250.290.320.310.280.300.270.320.280.300.300.270.300.260.27
% MethaneS-l
77.474.088.589.083.590.790.986.076.282683.080.475.173.770.768.068.968.671.3
S-2
78.281.074.073.171.973.069.271.066.267.268.173.477.875.573.372.670.367.373.0
pHS-l
7.17.07.17.37.17.37.37.37.27.47.47.37.27.37.27.27.27.27.3
S-2
7.47.06.97.06.87.17.07.07.07.17.17.27.37.37.37.37.37.37.5
1OCO
p
*<
°S-1 and S-2 = stage 1 and stage 2 of the reactor, COD load on basis of total reactor internal volume.Dow
nloa
ded
by [
McG
ill U
nive
rsity
Lib
rary
] at
10:
18 1
7 D
ecem
ber
2014

1108 KTTSOS ET AL.
Table 3: Concentrations of volatile fatty acids exiting from each stage ofthe two-stage reactor. (See Table 2 for COD loads.)
Time(days)
138
14162022252628303234384044525364
First Stage (mM)Acetate
3.53.11.02.44.92.93.82.03.23.64.65.68.86.58.09.0
11.515.121.3
Propionate
0.71.30.70.70.90.51.11.31.71.61.61.85.74.56.76.28.6
11.615.7
Butyrate
0.10.20.00.00.00.00.00.00.30.20.40.20.70.40.40.51.01.21.7
Second Stage (mM)Acetate
1.43.73.32.92.40.50.40.30.60.71.41.73.92.45.55.26.2
11.510.2
Propionate
0.11.21.62.01.91.41.00.10.70.81.31.01.50.92.41.93.06.54.5
Butyrate
0.00.20.00.10.1tra
0.00.00.10.00.0t r a
0.00.00.10.1tra
0.50.6
"Tl-ace: less than 0.05 mM.
ferentiation of the bioconversion process within each stage is described inTable 4, with the final operational conditions summarized in Table 5. TheCOD removal was consistently above 90% following the initial 17 days ofoperation. At an organic load of 13.4 g COD/L-day, steady-state operationwas continued for twenty-eight additional days. Throughout the operation ofthe reactor, acidogenesis occurred only at the reactor inlet (see Table 4) andhigher pH values (and for the most part, lower VFA concentrations) persistedthroughout the reactor (Tables 3 and 4).
At a load rate of 13.4 g COD/l^day (64th day, Table 2), stage 1 accountedfor 64% of the total COD removal. The methane concentration of the gasphase of reactor stage 1 was consistently higher than in stage 2 during the
Dow
nloa
ded
by [
McG
ill U
nive
rsity
Lib
rary
] at
10:
18 1
7 D
ecem
ber
2014

SIMULATED DISTILLERY WASTE 1109
Table 4: Performance data from different zones in the 80-L, two-stage re-actor at the 58th day of operation.
Samplesite
InletBottom of
stage 1 (sludge)Middle of
stage 1 (biofilm)Exit of
stage 1Bottom of
stage 2 (sludge)Middle of
stage 2 (sludge)Exit of
stage 2
°ND = not determined.
5.3
7.5
7.3
7.3
7.5
7.5
7.5
COD(mg/L)
19,820
NDa
2,400
2,530
ND"
l,410±30
1,480
Volatile fatty acids
Acetate
20.2
1.1
9.4
10.5
1.3
6.2
6.0
Propionic
1.4
11.6
5.9
6.5
0.3
1.6
1.6
(mM)
Butyrate
1.4
0.0
0.7
0.5
0.1
0.4
1.0
Table 5: Final operational conditions and performances for the one- andtwo-stage reactors.
Property Value
80-L, two-stage 3.6-L, one-stage
Flow rate, Stage 1
Flow rate, Stage 2Feedstock CODHRTSubstrate load ratec
COD removal (soluble)COD removal (total)CH4 yieldCH4 productivityCH4 in biogas
960mL/h
1380 mL/h6
30g/L45 h
13.5 g COD/L-d93.0%88.0%
0.28 L/g COD fed3.8 L/L reactor-d
68.0%
4.3 cm/h (upper section)"25.8 cm/h (lower section)
NA20 g/L29 h
15.6 g COD/L-d92.1%88.3%
0.26 L/g COD fed4.1 L/L reactor-d
65.0%
"Liquid velocity; lower section value includes liquid recycle; there was no recycle in the80-L reactor.
61btal flow = effluent flow from stage 1 plus supplemental feed flow of 420 mL/h.cBased on COD load per total reactor internal volume.
Dow
nloa
ded
by [
McG
ill U
nive
rsity
Lib
rary
] at
10:
18 1
7 D
ecem
ber
2014

1110 KTTSOS ET AL.
En.a.ooX
O
SE
20 30 40 50
Time (Days)
60 70
Figure 3: Hydrogen concentration in the gas phase and organic acid profileof the exit of stage one of the two-stage methanogenic reactor.
initial 30 days of continuous operation (Figure 2, Table 2), which equalizedat the later periods of the operation. This result is explained by the highersolubility of CO2 in the more alkaline liquid phase of stage 1, which was car-ried over into the second stage. In the second stage, CO2 was less solublein the aqueous environment at the lower pH conditions which diluted thegaseous CH4 concentration. The alkalinity changed from 1290 mg and 935 mgCaCO3 equivalents (stage 1 and stage 2, respectively) in the earlier periodsof the reaction (day 25) to 3200 mg and 3280 mg CaCO3 equivalents in thelater periods of operation (day 52). As the organic load was increased to 10-14 g COD/L-day, little or no pH difference between the reactor stages wasnoted, and the methane concentrations in the reactor stages were approxi-mately equivalent in the 70-74% range (Figure 2).
In the later stages of this experiment (days 50-64), increased VFA lev-els were observed in the exit of the first stage (Figure 3, Table 3) which in-dicated substrate overloading despite consistent biogas formation and COD
Dow
nloa
ded
by [
McG
ill U
nive
rsity
Lib
rary
] at
10:
18 1
7 D
ecem
ber
2014

SIMULATED DISTILLERY WASTE 1111
u
a*w
§
fa
Acetate
- • • - - Propionate
Butyrate
Time (days)
Figure 4: Profile of volatile organic acids from the exit of the two-stagemethanogenic reactor.
removal. During this time period of highest COD load, the concentration ofacetate and propionate increased to 15-21 mM (Table 3), which correlatedwith a significant increase in the atmospheric hydrogen partial pressure (3x 10~3 atm). At slightly reduced COD loads (days 35-50), the atmospherichydrogen partial pressure was lower (1-1.5 x 10"3 atm) and the concentra-tion of propionate and gaseous methane remained relatively constant. Theconcentration of hydrogen (Figure 3) and the propionate concentration wereimmediate indicators of the reactor's performance and the stability of theinterrelated bioconversion processes even though no measurable H2 was de-tected in the biogas of reactor stage 2.
VFA analysis of effluent from reactor stage 2 (Figure 4, Tables 3 and 4)indicated that there was an initial lag period of approximately 15-20 days be-fore adequate bioconversion of VFAs occurred. The concentration of VFAswas higher than expected despite the low initial organic loading. It is likelythat this time period was necessary for adaptation of the inoculum to the con-ditions of continuous-flow operation (change in redox potential, increase of
Dow
nloa
ded
by [
McG
ill U
nive
rsity
Lib
rary
] at
10:
18 1
7 D
ecem
ber
2014

1112 KTTSOS ET AL.
syntrophic association). Between days 8 and 28 the methane yield increasedfrom 0.19 to 0.30 (Table 2) while the VFAs remained steady in stage 1 anddecreased significantly in stage 2 (Table 3). This occurred while loading wasincreased from 1.2 to 3.4 (Table 2). These data indicate an increase in themethanogenic biomass.
Steady-state data beyond the 28 days reported for the 80-L reactor (Ta-ble 2) was obtained with a comparable but smaller (4.6-L) two-stage reactor.The 4.6-L two-stage reactor received between 10 and 12 g COD/L-day witha average loading rate of 11.1 g COD/L-day for 117 consecutive days. Thetotal COD removal rate was comparable and ranged from 88.0-94.7% withan average of 91.0%.
Residence Time Distribution Analysis
To determine the residence time distribution analysis (RTD), the COD loadto the 80-L reactor was reduce and the reactor stabilized at the followingoperational conditions: feedstock COD, 15,000 mg/L; HRT, 30 h; loading,10.1 g COD/L-day; and linear flow velocity, approximately 8 cm/h. At steady-state conditions (day 87 of the continuous experimental run), a pulse of Li+
was added to the reactor inlet and the profiles of the effluent lithium con-centration were determined versus time for both reactor stages. The meanresidence time, the variance, and the dispersion coefficient (Table 7) werecalculated using the equations reported by Levenspiel [42]. The calculatedresidence time for reactor stage 1 (9.3 h) was slightly less than the theoreticalvalue (9.6 h), whereas the calculated residence time (23.2 h) for stage 2 wasslightly higher than the theoretical value (20.1 h). Ninety-three percent of theinjected lithium tracer was recovered.
Performance of the One-Stage Reactor
The one-stage reactor was constructed for studies on high loading rates. Thereactor was inoculated with granular sludge and liquid from the two-stage re-actor; continuous operation was maintained throughout this study with syn-thetic stillage as the feedstock. The reactor was initially operated with a load-ing rate of 5 g COD/L-day and the feedstock COD was gradually increased to22 g/L using the methane yield and the level of COD removal as the perfor-mance level indicators. The final operating conditions are presented in Ta-ble 5. The maximal substrate loading rate for long term stable operation was15.6 g COD/L-day. This sustainable loading rate was 2 g COD/L-day greater
Dow
nloa
ded
by [
McG
ill U
nive
rsity
Lib
rary
] at
10:
18 1
7 D
ecem
ber
2014

SIMULATED DISTILLERY WASTE 1113
Table 6: Estimation of biomass in the one-stage bioreactor using a liquiddisplacement technique.
Determination Value
Total surface area of the support matrix 3226 cm2
Total water displacement of support matrix(before inoculation) 446 cm3
Total water displacement of support matrixplus biofilm (10 months after inoculation) 895 cm3
Total biomass of the support matrix(as volatile solids) 30.2 g
Total granular biomass of bioreactor(as volatile solids) 43.6 g
than what was achieved in the two-stage reactor. The CH4 productivity inboth reactor systems was about the same at a rate of 4 L/L-day (Table 5).
At the end of the tenth month of continuous operation, the majority ofthe total biomass and the greatest amount of COD reduction occurred in thebottom 40% of the reactor. On a volume basis, the lower part of the reactorcontained 30.3 g VS/L and the upper part had 14 g VS/L. This difference wasattributed to the upflow feeding mode and the settling characteristics of theflocculated biomass. Measurement of bioparticle sizes of the lower granularbiomass showed that most (greater than 95%) had diameters smaller than2 mm, a small portion had diameters between 2 mm and 3 mm, and only few(less than 1%) of them had diameters between 3 mm and 4 mm. The max-imum aceticlastic activity of the flocculent biomass was 0.86 g acetate con-sumed/g VS-day. A significant amount of biomass was also found associatedwith the immobilization matrix in the upper section of the bioreactor. It wascalculated from the liquid displacement measurements presented in Table 6that an average biofilm thickness of 1.4 mm developed on the support matrix.
The RTD analysis of the single-stage reactor was performed with Li+
tracer as described previously for the two-stage reactor. The mean residencetime, the variance, and the dispersion coefficient are presented in Table 7.Based on the liquid volume of the system and the flow rates applied, the ac-
Dow
nloa
ded
by [
McG
ill U
nive
rsity
Lib
rary
] at
10:
18 1
7 D
ecem
ber
2014

1114 KITSOSETAL.
Table 7: Results of the RTD analysis of the two-stage and one-stagemethanogenic bioreactors.
Theoretical meanresidence time (h)
Calculated meanresidence time (h)
Actual mean residence
time (h)Variance (dimensionless)Dispersion coefficient
(dimensionless)
Two-stageStage 1
9.6
9.3
ND
0.93.1
reactorStage 2
20.1
23.2
ND
0.630.63
One-stagereactor
29.4
25.5
20.2
0.670.73
tual mean residence time measured was 20.2 h. This was significantly lessthan the calculated value of 25.5 h. The calculated mean residence time com-pared to the theoretical value (Table 7) suggested that 13% of the initial liquidreactor volume was inaccessible to the Li+ tracer. Based on the total liquidvolume before inoculation and the final liquid volume after the separationof the biomass (which accumulated during the 10-month operation), it wascalculated that 30% of the total reactor volume was occupied by biomass (Ta-ble 6).
The overall activity of the reactor's biomass was determined by measuringthe consumed COD/total biomass. This was achieved by taking 20-mL sam-ples from the culture vessels and measuring their utilization of 1 g/L of sucroseand/or acetate in 40-mL bottles under anaerobic conditions. A value of 0.49 gacetate consumed/g VS-day was calculated. This value was significantly lessthan the 0.86 g acetate consumed/g VS-day determined for the aceticlastic mi-crobes comprising the granular biomass. Assuming that the majority of theCH4 was derived from acetate, the reactor's biomass represented only 57% ofthe potential methanogenic activity. The suboptimal utilization of the acetateby the retained biomass could be attributed to either limitations of internalmass transfer of the substrate or to low substrate levels available in the bulkliquid phase.
Dow
nloa
ded
by [
McG
ill U
nive
rsity
Lib
rary
] at
10:
18 1
7 D
ecem
ber
2014

SIMULATED DISTILLERY WASTE 1115
Microscopic Examination of the Colonized and SupportMatrices
Samples of the immobilization matrix from the two-stage reactor were ex-amined after three months of operation. The matrix from stage one of thetwo-stage reactor had a visibly thick biofilm that became more prominent asthe matrix tube extended further into the lower region of the reactor. Thebiofilm on the support matrix from the second stage was less apparent
The SEM revealed different biofilm structures and bacterial populationsattached to the support matrix compared to the flocculent biomass (Figure 5).The immobilization matrix was densely coated with a network of long filamen-tous bacteria that are characteristic of the aceticlastic methanogen Methan-othrix soehngenii (Figure 5a). Very few other morphological bacterial forms(rod-like and coccoid bacteria) were observed associated with the matrixbiofilm. On the other hand, the surface of the granular biomass consisted ofshort, rod-shaped bacteria and other bacillus-like species (Figure 5b). Theseresults were observed for samples taken from both the two-stage and one-stage reactors.
Examination of the matrix-attached biofilm showed the prevalence of amore uniform population of Methanothrix-like cells in the upper part of thereactor, demonstrating another microbial stratification along the reactor ac-cording to the carbon source availability. The prevalence of M. soehngeniias the major acetate consumer agrees with the concept of preferential at-tachment of Methanothrix due to its lower reaction kinetic constants (lowerKm, higher affinity for the substrate), higher hydrophilicity, and filamentousstructure compared to the aceticlastic methanogen Methanosarcina barkeri.M. barkeri was detected only in low numbers and as suspended biomass nearthe bottom of the reactor; this was probably due to the presence of higher lev-els of acetate in that region of the reactor. X-ray diffraction analysis revealedthat Ca2+ and PO*" were the major inorganic compounds comprising thegranular biomass. The TEM showed examples of bacteria and their exopoly-meric material that possibly contributed to the attachment to the surfaces ofthe inert support matrix.
Scanning electron microscopy also revealed the morphology and bacterialdiversity of the interior of the granular biomass. Disintegrated biogranulesconsisted primarily of a dense network of Methanothrix-like cells. In addi-tion, interwoven bundles of Methanothrix-like filaments were found packedtightly within the granules. The exterior of the granules had the appearance
Dow
nloa
ded
by [
McG
ill U
nive
rsity
Lib
rary
] at
10:
18 1
7 D
ecem
ber
2014

Figure 5: Scanning electron micrograph of (A) the support matrix from theone-stage methanogenic reactor and (B) the surface of the granular biomassfrom the lower portion of the one-stage reactor.
Dow
nloa
ded
by [
McG
ill U
nive
rsity
Lib
rary
] at
10:
18 1
7 D
ecem
ber
2014

SIMULATED DISTILLERY WASTE 1117
of refractory particulates with small rod-like bacteria integrated within. Theway that these cells were packed into bundles within the granular bioparti-cles clearly demonstrated that a higher density of cells can be retained in animmobilized system compared to a suspended culture.
Discussion
The upflow systems, combining an upper, bacterial "fixed-film" section and alower, "granular-biomass" section, was effective in the treatment of simulatedalcohol stillage at feedstock concentrations of 1 g to 30 g COD/L. The resultsof COD removal above 90% and methane productivity of 4 L/L reactor-daydemonstrated, however, that the fundamental basis for the performance ofthe reactors was the quality and quantity of the biomass present relative tothe concentration of the organic load. The reactor's orientation with one ortwo stages was virtually independent of the loading rates, nor did it contributesignificantly to the spatial distribution of metabolic reactions within the biore-actor; that is, acidogenesis and methanogenesis occurred in equivalent zones.
There was no evidence that suggested there was a separation of the acido-genic reactions from methanogenesis. In fact, the two-stage system had sub-optimal metabolic activity in the second stage compared to the first stage andhad to be supplemented with organic feedstock to maintain active biomass inthe second stage. Thus, the two-stage reactor actually represented two reac-tors in sequence.
This study demonstrated, however, distinct advantages to using a com-bined flocculated-fixed biofilm cell system within one reactor. The granularbiomass which predominated in the lower section of the single-stage reac-tor was more than two times the biomass concentration found in the uppermatrix-supported biofilm section at the higher substrate load conditions. Theopposite levels of biomass accumulation occurred at the low feedstock loads.Thus, the hybrid system provided stability of the biomass in a reactor for arange of loading rates. At low loading rates, the biofilm prevailed and servedas the in situ inoculum for the development of the flocculation bed for bio-conversion of high loading rates.
In conclusion, it was demonstrated that having both a flocculated/granularbiomass and fixed biofilm was an effective arrangement for the treatment ofa simulated distillery waste stream. There was no clear evidence, however,that a two-stage reactor was superior or inferior to a one-stage reactor. Thesize and ratios of the sections for granular biomass and fixed biofilm develop-
Dow
nloa
ded
by [
McG
ill U
nive
rsity
Lib
rary
] at
10:
18 1
7 D
ecem
ber
2014

1118 KTTSOS ET AL.
ments are factors to be determined from the substrate concentration and/ororganic loads to be treated. The performance data clearly identified H2 andpropionate concentration increases as signs of over-loading and showed thatthey are detectable at mid-stream and before any H2 and changes in CH4production were detectable in the biogas eluting from the reactor.
Acknowledgments
This work was supported by Crown Technologies Ltd., New York, NY. Theauthors wish to thank Ms. Paula Brooks for her assistance in preparing thismanuscript.
NotationCODGCHRTid.LDMo.d.SEMTEMTSVFAVS
chemical oxygen demandgas chromatographhydraulic retention timeinside diameterlight diffraction microscopyoutside diameterscanning electron microscopytransmission electron microscopytotal suspended solidsvolatile fatty acidsvolatile suspended solids
References
[1] D. R. Boone and M. P. Bryant. Propionate-degrading bacterium, Syn-trophobacter wolinii sp. nov. gen. nov., from methanogenic ecosystems.Appl. Environ. Microbiol., 40:626-632, 1980.
[2] M. Chartrain, L. Bhatnagar, and J. G. Zeikus. Microbial ecophysiologyof whey biomethanation: comparison of carbon transformation parame-ters, species composition, and starter culture performance in continuousculture. Appl Environ. Microbiol, 53:1147-1156, 1987.
[3] B. Frostell. Process control in anaerobic wastewater treatment. Wat. Sci.Technol., 17:173-189, 1985.
Dow
nloa
ded
by [
McG
ill U
nive
rsity
Lib
rary
] at
10:
18 1
7 D
ecem
ber
2014
SIMULATED DISTILLERY WASTE 1119
[4] W. J. Jones, D. P. Nagle, and W. B. Whitman. Methanogens and thediversity of Archaebacteria. Microbiol. Rev., 51:135-177, 1987.
[5] F. A. MacLeod, S. R. Guiot, and J. W. Costerton. Layered structure ofbacterial aggregates produced in an upflow anaerobic sludge bed andfilter reactor. Appl Environ. Microbiol, 56:1598-1607, 1990.
[6] P. L. McCarty and D. P. Smith. Anaerobic wastewater treatment. Envi-ron. Sci. Technol., 20:1200-1206, 1986.
[7] M. J. McInerney, M. P. Bryant, and N. Pfennig. Anaerobic bacteriumthat degrades fatty acids in syntrophic association with methanogens.Arch. Microbiol., 122:129-135, 1979.
[8] M. R. Smith, S. H. Zinder, and R. A. Man. Microbial methanogenesisfrom acetate. Proc. Biochem., 15:34-39, 1980.
[9] J. H. Thiele, M. Chartrain, and J. G. Zeikus. Control of interspecieselectron flow during anaerobic digestion: role of floc formation in syn-trophic methanogenesis. Appl. Environ. Microbiol, 54:10-19, 1988.
[10] J. H. Thiele and J. G. Zeikus. Control of interspecies electron flow dur-ing anaerobic digestion: significance of formate transfer versus hydro-gen transfer during syntrophic methanogenesis in flocs. Appl Environ.Microbiol., 54:20-29, 1988.
[11] D. C. Savage and M. Fletcher. Bacterial Adhesion: Mechanisms and Phys-iological Significance. Plenum Press, NY, 1985. pp.476.
[12] G. Lettinga, A.F.M. Van Velsen, S.W. Hobma, W. de Zeeuw, and A.Klapwijk. Use of the upflow sludge blanket (USB) reactor conceptfor biological wastewater treatment, especially for anaerobic treatment.Biotechnol. Bioeng., 22:699-734, 1980.
[13] M. S. Switzenbaum and W. J. Jewell. Anaerobic attached-film expanded-bed reactor treatment. J. WPCF., 52:1953-1964, 1980.
[14] J. C. Young and P. L. McCarty. The anaerobic filter for waste treatment.J. WPCF., 41:R160-R173, 1969.
[15] A. Cohen, R. J. Zoetemeyer, A. van Deursen, and J. G. van Andel.Anaerobic digestion of glucose with separated acid production andmethane formation. Wat. Res., 13:571-580, 1979.
[16] R. G. Cail and J. P. Barford. The development of granulation in an up-flow floc digester and an upflow anaerobic sludge blanket digester treat-ing cane juice stillage. Biotechnol. Lett., 7:493-498, 1985.
[17] I.J. Callander and J. P. Barford. Recent advances in anaerobic digestiontechnology. Proc. Biochem., 18:24-30, 1983.
Dow
nloa
ded
by [
McG
ill U
nive
rsity
Lib
rary
] at
10:
18 1
7 D
ecem
ber
2014

1120 KTTSOS ET AL.
[18] M. Canovas-Diaz and J. A. Howell. Stratified ecology techniques in thestartup of an anaerobic downflow fixed film percolating reactor. Biotech-nol. Bioeng., 30:289-296, 1987.
[19] A. Cohen, A. M. Breure, J. G. van Andel, and A. van Deursen. Influenceof phase separation on the anaerobic digestion of glucose - II. Stabilityand kinetic responses to shock loadings. Water Res., 16:449-455, 1982.
[20] S. Ghosh, J. P. Ombregt, and P. Pipyn. Methane production from indus-trial wastes by two-phase anaerobic digestion. Wat. Res., 19:1083-1088,1985.
[21] E. R. Hall. Biofilm reactors in anaerobic wastewater treatment. Biotech.Adv., 5:257-269, 1987.
[22] S. R. Harper and F. G. Pohland. Enhancement of anaerobic treatmentefficiency through process modification. J. WPCF., 59:152-161, 1987.
[23] M. Henze and P. Harremoes. Anaerobic treatment of wastewater in fixedfilm reactors - a literature review. Wat. Sci. Technol., 15:1-101, 1983.
[24] K. J. Kennedy, M. F. Hamoda, and S. G. Guiot. Anaerobic treatmentof leachate using fixed film and sludge bed systems. J. WPCF., 60:1675-1683, 1988.
[25] K.J. Kennedy, M. Muzar, and G.H. Copp. Stability and performanceof mesophilic anaerobic fixed-film reactors during organic overloading.Biotechnol. Bioeng., 27:86-93, 1985.
[26] H.A. Kobayashi, E.C. de Macario, R.S. Williams, and A.J.L. Macario.Direct characterization of methanogens in two high-rate anaerobic bio-logical reactors. Appl. Environ. Microbiol., 54:693-698, 1988.
[27] G. Lettinga, S.W. Hobma, L.W.H. Pol, W. de Zeeuw, P. de Jong, P. Grin,and R. Roersma. Design operation and economy of anaerobic treat-ment. Wat. Sci. Technol., 15:177-195, 1983.
[28] J. H. Thiele and J. G. Zeikus. The anion-exchange substrate shuttleprocess: a new approach to two-stage biomethanation of organic andtoxic wastes. Biotechnol Bioeng., 31:521-535, 1988.
[29] P. Weiland. Development of anaerobic filters for treatment of highstrength agro-industrial wastewaters. Bioproc. Eng., 2:39-47, 1987.
[30] M. Yoda, S. W. Shin, A Watanabe, M. Watanabe, M. Kitagawa, and Y.Miyaji. Anaerobic fluidized bed treatment with a steady-state biofilm.Wat. Sci. Tech., 19:287-298, 1987.
[31] H.H. Kitsos. Development of a Two-Staged Immobilized Cell Bioreactorfor the Production of Methane from Organic Wastes. PhD thesis, GeorgiaInstitute of Technology, Atlanta, GA, 1989. pp. 371.
Dow
nloa
ded
by [
McG
ill U
nive
rsity
Lib
rary
] at
10:
18 1
7 D
ecem
ber
2014

SIMULATED DISTILLERY WASTE 1121
[32] H.M. Kitsos, R. Roberts, W.J. Jones, and T.G. Tornabene. An experi-mental study of mass diffusion and reaction rates in an anaerobic biofilm.Biotechnol. Bioeng., 39:1141-1146, 1992.
[33] W. E. Balch, G. E. Fox, L. J. Magrum, C. R. Woese, and R. S. Wolfe.Methanogens: re-evaluation of a unique biological group. Microbiol.Rev., 43:260-296, 1979.
[34] C. C. Ribeiro and J. R. C. Branco. Stillage: a resource disguised as anuisance. Proc. Biochem., 16:8-13, 1981.
[35] W. L. Bolle, J. van Breugel, G. C. van Eybergen, Kossen N. W. F., andR. J. Zoetemeyer. Modeling the liquid flow in upflow anaerobic sludgeblanket reactors. Biotechnol. Bioeng., 28:1615-1620, 1986.
[36] American Public Health Association. Standard Methods for the Exami-nation of Water and Wastewater. APHA, Washington, DC, 1981.
[37] J. D. Cline. Spectrophotometric determination of hydrogen sulphide innatural waters. Oceanography, 47:454-458, 1971.
[38] M. Dubois, D. A. Giles, J. K. Hamilton, P. A. Rebers, and I. Smith. Col-orimetric method for determination of sugars and related substances.Anal Chem., 28:350-356, 1956.
[39] O. H. Lowry, N. J. Rosebrough, A. L. Farr, and R. J. Randall. Proteinmeasurements with folin phenol reagent. J. Biol Chem., 193:265-275,1951.
[40] C. J. Dawes. Biological Techniques in Electron Microscopy. InternationalTextbook Series, Barnes and Noble, NY, 1971. pp. 193.
[41] W. G. Characklis, M. G. Trulear, J. D. Bryers, and Zelver. Dynamics ofbiofilm processes: methods. Water Res., 16:1207-1216, 1982.
[42] O. Levenspiel. Chemical Reaction Engineering. John Wiley and Sons,NY, 1972.
Received: May 1, 1992
Accepted: June 17, 1992
Dow
nloa
ded
by [
McG
ill U
nive
rsity
Lib
rary
] at
10:
18 1
7 D
ecem
ber
2014