anaerobic digestion of olive mill wastewater in a periodic anaerobic baffled reactor (pabr) followed...
TRANSCRIPT

90
9
Research ArticleReceived: 16 December 2008 Revised: 9 February 2009 Accepted: 9 February 2009 Published online in Wiley Interscience: 24 April 2009
(www.interscience.wiley.com) DOI 10.1002/jctb.2170
Anaerobic digestion of olive mill wastewater ina periodic anaerobic baffled reactor (PABR)followed by further effluent purification viamembrane separation technologiesK. Stamatelatou,a,b∗ A. Kopsahelis,a P.S. Blika,a,b C.A. Paraskevaa,b andG. Lyberatosa,b
Abstract
BACKGROUND: The combined treatment of olive mill wastewater (OMWW) by applying the anaerobic digestion process andfurther treatment in a system consisting of filters and membranes is presented. The anaerobic digestion of the OMWW tookplace in a high rate system, the periodic anaerobic baffled reactor (PABR). Application of the membrane system aimed atpurifying the anaerobic effluent.
RESULTS: An increase in the organic loading rate was achieved by increasing the influent chemical oxygen demand (COD) andalternatively by decreasing the hydraulic retention time (HRT). The first option caused process failure, since the volatile fattyacids accumulation resulted in negligible biogas production. In contrast, the second change (decrease in HRT) led to stableoperation that permitted the reduction of the HRT to 3.75 d and increase of the organic loading rate to 8.9 g tCOD L−1 d−1
with satisfactory total COD removal (72%). Higher total COD removal (up to 80%) was observed at lower organic loading rates(<3.5 g tCOD L−1 d−1). Further purification in the membrane units resulted in a final permeate of less than 0.1 g tCOD L−1. Themembrane systems proved to be more efficient on the anaerobic effluent than on the raw OMWW (the final permeate in thatcase contained 1g tCOD L−1).
CONCLUSIONS: The anaerobic digestion of OMWW in a PABR was stable even at high organic loading rates. Filtering andmembrane fractionation of the PABR effluent resulted in a final permeate stream of high quality, suitable for irrigation and/orreuse in the proposed operating scheme for diluting the OMWW prior to anaerobic digestion.c© 2009 Society of Chemical Industry
Keywords: olive mill wastewater; anaerobic digestion; periodic anaerobic baffled reactor (PABR); membrane separation
INTRODUCTIONOlive-mill wastewater (OMWW) is the by-product of olive oilproduction, a significant agricultural activity with high socialand economic impact on the population of olive-producingcountries, which are mainly located in the Mediterranean area.The characteristic properties of OMWW include its dark color,characteristic odour, acidic pH, high content of dissolved andsuspended solids as well as organic matter, mainly composedof lipids and polyaromatic compounds, such as polyphenols.Polyphenols are considered mainly responsible for the highphytotoxicity and antimicrobial properties of OMW.1,2
Various physicochemical methods, such as simple evaporation,3
flotation and settling,4 coagulation,5 oxidation by O3 and Fentonreagent,6 have been proposed for treating OMWW. In addition,reuse of the OMWW by spreading onto agricultural soil as anorganic fertilizer has been considered.7 Biological methods havealso been studied. Anaerobic digestion is commonly used toreduce the high organic content of OMWW,8,9 but it is limited bythe presence of lipids and phenolic compounds, which are toxicto methanogens.10 Pretreatment methods aimed at decreasing
the concentration of phenolics have also been developed11,12 inan effort to make OMWW more amenable to anaerobic digestion.Even with limitation of phenolic compounds, the presence of lipidsand long chain fatty acids (intermediate compounds resultingfrom the hydrolysis of lipids) are still inhibitory to the anaerobicmicroorganisms, decreasing their growth rates. As a result, longhydraulic retention times (HRT) are required for the operationof conventional, suspended growth bioreactors in order to allowfor the maintenance of the microbial biomass in the system.
∗ Correspondence to: K. Stamatelatou, Laboratory of Biochemical Engineeringand Environmental Technology, Department of Chemical Engineering,University of Patras, 1 Karatheodori st, 26504 Patras, Greece.E-mail: [email protected]
a Laboratory of Biochemical Engineering and Environmental Technology,Department of Chemical Engineering, University of Patras, 1 Karatheodorist, 26504 Patras, Greece
b Institute of Chemical Engineering and High Temperature Chemical Processes(FORTH/ICE-HT), 26504 Patras, Greece
J Chem Technol Biotechnol 2009; 84: 909–917 www.soci.org c© 2009 Society of Chemical Industry

91
0
www.soci.org K Stamatelatou et al.
The recycling of biomass has been proposed to control biomassretention time and enhance the removal of long chain fatty acidsin a two-stage anaerobic configuration for OMWW treatment.13
Bioreactors designed to concentrate the anaerobic biomass inorder to maximize the process efficiency are higher rate systems,such as the upflow anaerobic sludge blanket reactors (UASB)and anaerobic filters. These systems require some dilution of theOMWW to avoid operational problems.
The periodic anaerobic baffled reactor (PABR) is a novelbioreactor,14 designed to operate at high organic loading rates.The PABR resembles a simple anaerobic baffled reactor (ABR)with the compartments configured circularly. The feed entersthe bioreactor through all compartments sequentially, so thatthe organic strength of the wastewater is exposed equally to allbiomass retained in the bioreactor. This type of operation hasthe advantage that methanogens can be retained even in the
InOut
A
BC
D
(a)
(b)
Figure 1. (a) Front view of a four compartment PABR: the feed enters thecompartment through a port attached to the downflow section, comes upin the upflow section passing below the baffle, and then enters the nextcompartment through external tubes. (b) Top view of a four-compartmentPABR: 12 electronic valves positioned on tubes set outside the reactor. Thevalves vary the role of each compartment (influent, effluent or intermediate)over time at a pre-selected switching period. Note that the external tubesconnect the upflow section (
⊙) of the compartment with the downflow
section (⊗
) of the subsequent compartment.
first compartments, while this is not possible in a simple ABR,where only acidogenic bacteria prevail in the first compartmentsunder conditions of high organic loading rate. The biomassis concentrated in the lower part of the bioreactor due togravity, allowing for high chemical oxygen demand (COD) removalefficiency. Due to the compartmentalized structure of the PABR,the biomass is not required to be in the form of granules to beretained in the interior of the bioreactor (in contrast to the UASBreactors). The switching frequency (or equivalently the switchingperiod, that is, the interval for the influent point to switch toall compartments) allows flexibility in the operation of the PABR.The PABR can be operated as a simple ABR, if the switchingfrequency is set to zero, and, in the extreme case of very highswitching frequency, as a single-compartment upflow bioreactor.It has been found that under high organic loading rates, highswitching frequencies (or equivalently low values of the switchingperiod) lead to higher performance.15
On an experimental basis, the behavior of a 15 L PABR fedwith glucose was studied by Skiadas et al.14 at different switchingperiods (1, 1.5 and 2 d), but at a constant organic loading rate(4.55 g COD L−1 d−1). The transient behavior of the PABR fed ongelatin or glucose under increasing organic loading conditionshas also been studied.15 – 17 The PABR response was satisfactoryfor both types of substrate, when treated separately at organicloading rates of 6.25 and 12.5 g COD L−1 d−1, respectively. Othertypes of wastewaters treated in this novel bioreactor are acidifiedcheese whey18 and a typical pharmaceutal-containing industrialwastewater.19
The use of membrane systems has been reported as analternative method for the treatment of OMWW. However, despitethe optimal COD reduction by membranes, this technology is notsuited to the treatment of OMWW in small-scale oil mills, dueto the very high capital and operating costs, the high energydemand and the rather complex process control that requireshighly qualified personnel. Canepa et al.20 developed a combinedsystem of membrane processes to treat OMWW and showed thatthe organic load can be reduced significantly. They have alsoshown that the cost is affordable for olive mill enterprises. Turanoet al.21 proposed an integrated centrifugation–ultrafiltration (UF)system. In the centrifugation step, most of the suspended solids areremoved, while in ultrafiltration, a selective separation phase wascarried out. The pre-treatment step was necessary to decreasemembrane fouling and to increase UF efficiency. Paraskevaet al.22,23 suggested the utilization of a pretreatment step (filterpress) to remove solids and fats prior to the treatment of the filtratein a membrane system, i.e. ultrafiltration and reverse osmosis. Thefinal effluent of the proposed scheme was almost pure water,while the concentrates were tested further for their nutritiousvalue or phytotoxic properties. It was shown that the exploitationof the fractions collected from both ultrafiltration and reverseosmosis units can be used to reduce the high operational costs.Khoufi et al.24 applied ultrafiltration as the last step in a combinedprocess for OMWW treatment, including electro-Fenton oxidation,anaerobic digestion and ultrafiltration. The best performance ofthe ultrafiltration step, using a 25 kDa cut-off membrane, resultedin a final permeat COD of 5 g L−1, which is still far above thepermissible discharge limits. To the authors’ knowledge, althoughthe efficiency of various membrane systems has been evaluatedunder several operating conditions, there has not been anycomparative study on the performance of an ultrafiltration-reverseosmosis system treating OMWW and, as a post-treatment step,treating the anaerobically digested OMWW.
www.interscience.wiley.com/jctb c© 2009 Society of Chemical Industry J Chem Technol Biotechnol 2009; 84: 909–917
91
1
Combined anaerobic digestion and fractionation of OMWW www.soci.org
In this paper, the efficiency of the PABR to treat OMWW at variousorganic loading rates is demonstrated for the first time. The organicloading rate was increased by increasing the COD concentrationin the feed and/or decreasing the hydraulic retention time. In allcases, the performance of the PABR in terms of COD removal andbiogas production was recorded and evaluated. Moreover, filteringpress and membrane separation were applied for the treatment ofOMWW in a subsequent step (following the anaerobic digestionstep), or alone (for comparison). It was shown that the combinedanaerobic digestion in a PABR with further treatment in filteringand membrane units is a very effective and promising wastewaterpurification scheme.
MATERIALS AND METHODSFeedstockThe OMWW used in this study was collected from a local three-phase olive mill. The basic characteristics of OMWW and theirvariation while stored in vessels from November 2007 untilFebruary 2008 are listed in Table 1. The standard deviationcompared with the mean values in the last row of Table 1, indicatea variability of 10–15%. The wastewater, after collection fromthe olive mill, was separated into smaller vessels and kept in thefreezer (−20 ◦C). Prior to feeding, each vessel was left to settleand the supernatant collected. The supernatant was then dilutedwith tap water at a ratio 1 : 1 (except if mentioned otherwise),supplemented with 7 g L−1 (NH4)2HPO4 (as a source of nitrogenand phosphorous) and fed into a 15 L PABR. The solids, CODand phenolics concentration after solids removal and dilution arereported in Table 2. The removed solids were collected to befurther treated through appropriate waste stabilization methodsseparately (such as composting). NaHCO3 was also added in the
feed, as necessary, to sustain alkalinity of the bioreactor above4 gL−1.
Periodic anaerobic baffled reactor, PABRThe operating volume of the PABR (Fig. 1(a)) was 15 L and consistedof four compartments (each consisting of a downflow and anupflow part) arranged in a circular manner so that, for one quarterof a given period of time (typically 2 d) each compartment served asthe feed compartment, for half as an intermediate compartmentand for one quarter as the effluent compartment. A system of12 computer-controlled valves was used to change the role ofeach compartment periodically (Fig. 1(b)). The flow pattern fromthe influent to the effluent changes with time (t) within a givenswitching period T as follows: A-B-C-D for 0 < t < T/4, D-A-B-Cfor T/4 < t < T/2, C-D-A-B for T/2 < t < 3T/4 and B-C-D-A for3T/4 < t < T . The switching period (that is the interval for theinfluent point to switch to all four compartments) was selected tobe 2 d in this study. The PABR was equipped with sample ports inevery compartment, placed 10 cm from the surface of the mixedliquor. There were also two biogas vents on the top of the reactor.The PABR was immersed in a tank full of water maintained at 35 ◦Cthrough a temperature controller.
Membrane separationThe membrane separation system consisted of two units;ultrafiltration (UF) and reverse osmosis (RO) purchased from HydroAir Research SpA, Italy. The capacity of the membrane system was40 L h−1 for the permeate stream. The ultafiltration unit containeda ceramic tubular module with 19 tubes of 1034 mm length and4 mm diameter and membrane area 0.36 m2 and size of pores lessthan 100 µm. The clean water permeability was ca 1800 L h−1 m−2
bar, the flow rates were 3.44 and 4.30 m3 h−1 for cross-flow velocity
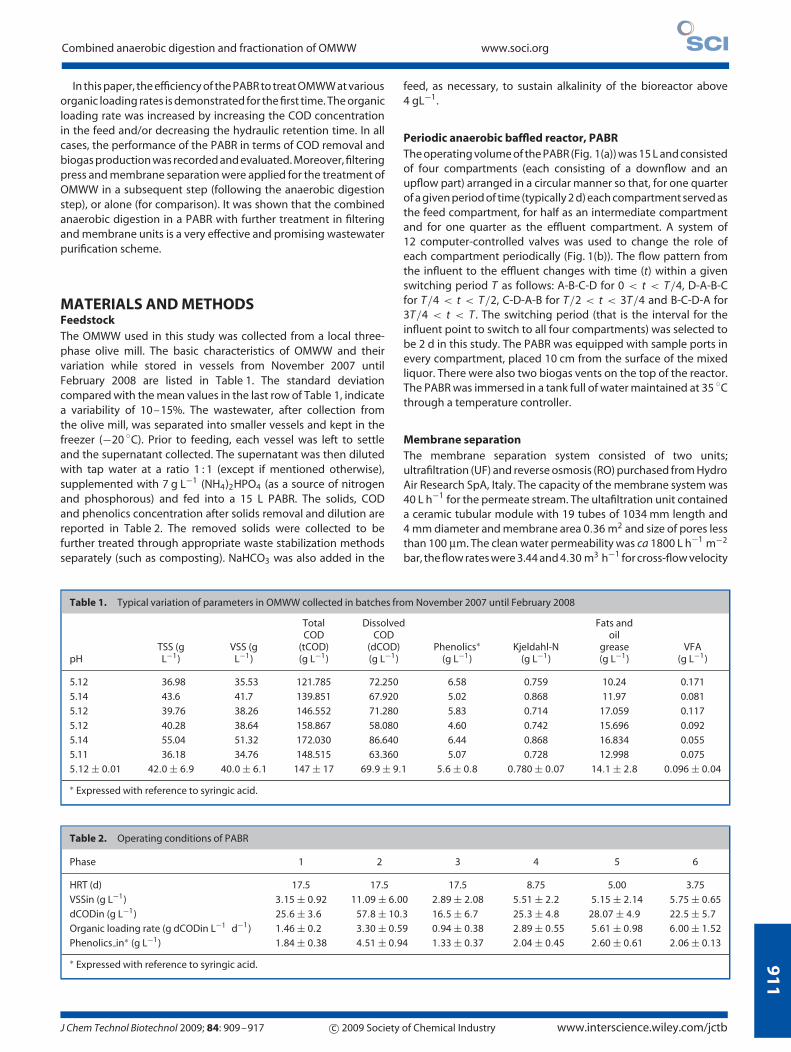
Table 1. Typical variation of parameters in OMWW collected in batches from November 2007 until February 2008
pHTSS (gL−1)
VSS (gL−1)
TotalCOD
(tCOD)(g L−1)
DissolvedCOD
(dCOD)(g L−1)
Phenolics∗(g L−1)
Kjeldahl-N(g L−1)
Fats andoil
grease(g L−1)
VFA(g L−1)
5.12 36.98 35.53 121.785 72.250 6.58 0.759 10.24 0.171
5.14 43.6 41.7 139.851 67.920 5.02 0.868 11.97 0.081
5.12 39.76 38.26 146.552 71.280 5.83 0.714 17.059 0.117
5.12 40.28 38.64 158.867 58.080 4.60 0.742 15.696 0.092
5.14 55.04 51.32 172.030 86.640 6.44 0.868 16.834 0.055
5.11 36.18 34.76 148.515 63.360 5.07 0.728 12.998 0.075
5.12 ± 0.01 42.0 ± 6.9 40.0 ± 6.1 147 ± 17 69.9 ± 9.1 5.6 ± 0.8 0.780 ± 0.07 14.1 ± 2.8 0.096 ± 0.04
∗ Expressed with reference to syringic acid.
Table 2. Operating conditions of PABR
Phase 1 2 3 4 5 6
HRT (d) 17.5 17.5 17.5 8.75 5.00 3.75
VSSin (g L−1) 3.15 ± 0.92 11.09 ± 6.00 2.89 ± 2.08 5.51 ± 2.2 5.15 ± 2.14 5.75 ± 0.65
dCODin (g L−1) 25.6 ± 3.6 57.8 ± 10.3 16.5 ± 6.7 25.3 ± 4.8 28.07 ± 4.9 22.5 ± 5.7
Organic loading rate (g dCODin L−1 d−1) 1.46 ± 0.2 3.30 ± 0.59 0.94 ± 0.38 2.89 ± 0.55 5.61 ± 0.98 6.00 ± 1.52
Phenolics in∗ (g L−1) 1.84 ± 0.38 4.51 ± 0.94 1.33 ± 0.37 2.04 ± 0.45 2.60 ± 0.61 2.06 ± 0.13
∗ Expressed with reference to syringic acid.
J Chem Technol Biotechnol 2009; 84: 909–917 c© 2009 Society of Chemical Industry www.interscience.wiley.com/jctb
91
2
www.soci.org K Stamatelatou et al.
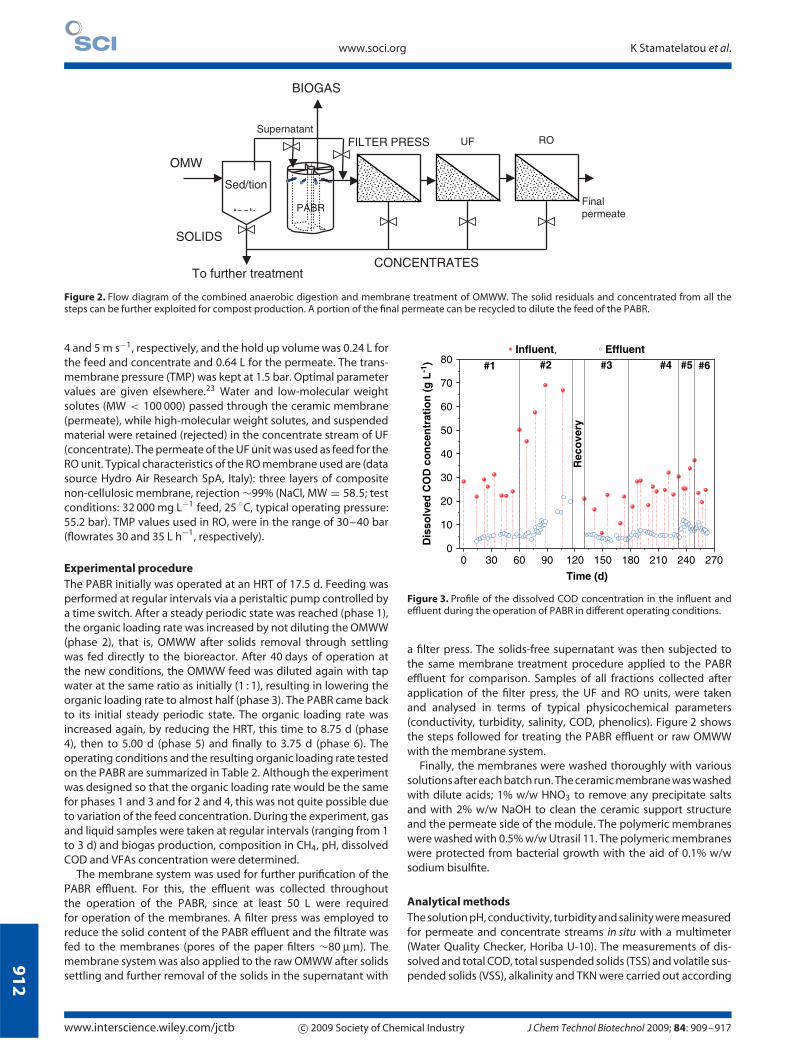
Supernatant
PABR
BIOGAS
FILTER PRESS UF RO
CONCENTRATESTo further treatment
SOLIDS
OMW
Sed/tion
tankFinalpermeate
Figure 2. Flow diagram of the combined anaerobic digestion and membrane treatment of OMWW. The solid residuals and concentrated from all thesteps can be further exploited for compost production. A portion of the final permeate can be recycled to dilute the feed of the PABR.
4 and 5 m s−1, respectively, and the hold up volume was 0.24 L forthe feed and concentrate and 0.64 L for the permeate. The trans-membrane pressure (TMP) was kept at 1.5 bar. Optimal parametervalues are given elsewhere.23 Water and low-molecular weightsolutes (MW < 100 000) passed through the ceramic membrane(permeate), while high-molecular weight solutes, and suspendedmaterial were retained (rejected) in the concentrate stream of UF(concentrate). The permeate of the UF unit was used as feed for theRO unit. Typical characteristics of the RO membrane used are (datasource Hydro Air Research SpA, Italy): three layers of compositenon-cellulosic membrane, rejection ∼99% (NaCl, MW = 58.5; testconditions: 32 000 mg L−1 feed, 25 ◦C, typical operating pressure:55.2 bar). TMP values used in RO, were in the range of 30–40 bar(flowrates 30 and 35 L h−1, respectively).
Experimental procedureThe PABR initially was operated at an HRT of 17.5 d. Feeding wasperformed at regular intervals via a peristaltic pump controlled bya time switch. After a steady periodic state was reached (phase 1),the organic loading rate was increased by not diluting the OMWW(phase 2), that is, OMWW after solids removal through settlingwas fed directly to the bioreactor. After 40 days of operation atthe new conditions, the OMWW feed was diluted again with tapwater at the same ratio as initially (1 : 1), resulting in lowering theorganic loading rate to almost half (phase 3). The PABR came backto its initial steady periodic state. The organic loading rate wasincreased again, by reducing the HRT, this time to 8.75 d (phase4), then to 5.00 d (phase 5) and finally to 3.75 d (phase 6). Theoperating conditions and the resulting organic loading rate testedon the PABR are summarized in Table 2. Although the experimentwas designed so that the organic loading rate would be the samefor phases 1 and 3 and for 2 and 4, this was not quite possible dueto variation of the feed concentration. During the experiment, gasand liquid samples were taken at regular intervals (ranging from 1to 3 d) and biogas production, composition in CH4, pH, dissolvedCOD and VFAs concentration were determined.
The membrane system was used for further purification of thePABR effluent. For this, the effluent was collected throughoutthe operation of the PABR, since at least 50 L were requiredfor operation of the membranes. A filter press was employed toreduce the solid content of the PABR effluent and the filtrate wasfed to the membranes (pores of the paper filters ∼80 µm). Themembrane system was also applied to the raw OMWW after solidssettling and further removal of the solids in the supernatant with
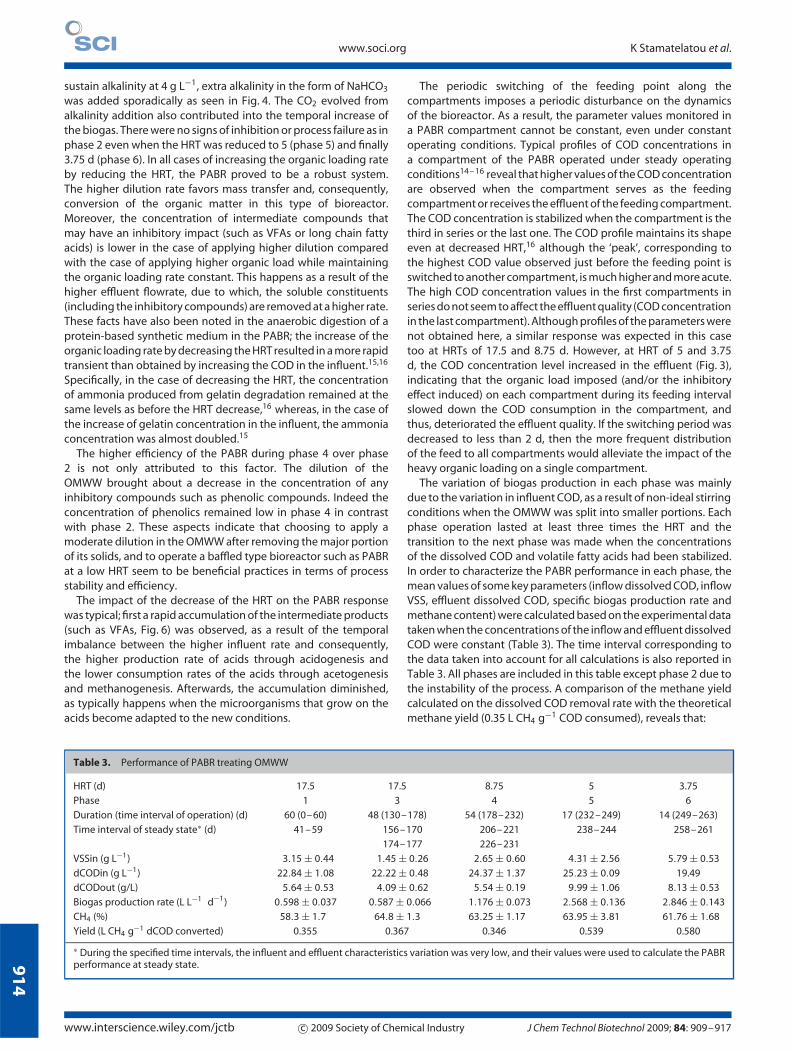
0 30 60 90 120 150 180 210 240 2700
10
20
30
40
50
60
70
80 #6#5
Rec
ove
ryTime (d)
Dis
solv
ed C
OD
co
nce
ntr
atio
n (
g L
-1)
Influent, Effluent#4#3#2#1
Figure 3. Profile of the dissolved COD concentration in the influent andeffluent during the operation of PABR in different operating conditions.
a filter press. The solids-free supernatant was then subjected tothe same membrane treatment procedure applied to the PABReffluent for comparison. Samples of all fractions collected afterapplication of the filter press, the UF and RO units, were takenand analysed in terms of typical physicochemical parameters(conductivity, turbidity, salinity, COD, phenolics). Figure 2 showsthe steps followed for treating the PABR effluent or raw OMWWwith the membrane system.
Finally, the membranes were washed thoroughly with varioussolutions after each batch run. The ceramic membrane was washedwith dilute acids; 1% w/w HNO3 to remove any precipitate saltsand with 2% w/w NaOH to clean the ceramic support structureand the permeate side of the module. The polymeric membraneswere washed with 0.5% w/w Utrasil 11. The polymeric membraneswere protected from bacterial growth with the aid of 0.1% w/wsodium bisulfite.
Analytical methodsThe solution pH, conductivity, turbidity and salinity were measuredfor permeate and concentrate streams in situ with a multimeter(Water Quality Checker, Horiba U-10). The measurements of dis-solved and total COD, total suspended solids (TSS) and volatile sus-pended solids (VSS), alkalinity and TKN were carried out according
www.interscience.wiley.com/jctb c© 2009 Society of Chemical Industry J Chem Technol Biotechnol 2009; 84: 909–917

91
3
Combined anaerobic digestion and fractionation of OMWW www.soci.org
to Standard Methods.25 Total phenolic compounds were deter-mined spectrophotometrically according to the Folin–Ciocalteumethod26 and the syringic acid was used as a reference forphenolics quantification. For volatile fatty acids (VFAs) quantifica-tion, acidified samples with 20% H2SO4 were analyzed on a gaschromatograph (Varian CP-30), equipped with a flame ionizationdetector and a capillary column (Agilent Technologies Inc., USA,30 m × 0.53 mm). The oven was programmed from 105 ◦C to160 ◦C at a rate of 15 ◦C min−1, and subsequently to 235 ◦C (heldfor 3 min) at a rate of 20 ◦C min−1 for VFAs analysis and from60 ◦C (held for 1 min) to 230 ◦C (held for 0.5 min) at a rate of 45 ◦Cmin−1 for alcohols analysis. Helium was used as the carrier gasat 15 mL min−1, the injector temperature was set at 175 ◦C andthe detector at 225 ◦C. The hydrogen and methane content ofbiogas was determined in a gas chromatograph (Varian Star 3600,USA) equipped with a thermal conductivity detector and a packedcolumn (Poropak Q, 80/100-mesh, SGE, Australia) with nitrogen ascarrier gas. The injector, column and detector temperatures wereset at 70 ◦C, 80 ◦C and 180 ◦C, respectively. The biogas productionrate was measured using a water displacement technique.
RESULTS AND DISCUSSIONAnaerobic digestion of OMWW in a PABRThe PABR operation was stable at an HRT of 17.5 days, withthe dissolved COD concentration in the influent varying around25 g L−1 (Fig. 3), while the VSS concentration remained less than5 g L−1 (Table 2). The stability of the process was also denotedby the steady specific biogas production rate (Fig. 4, phases 1and 3) and the negligible concentration of the VFAs (Fig. 5).The phenolics concentration remained low (Fig. 6). In contrast, asuspended growth system of CSTR type operated at lower organicloading rate (HRT = 30 d, COD in the effluent = 30 g L−1) wasnot stable and soured with volatile fatty acids being accumulatedand biogas production decreasing to zero (data not shown). Itseemed that the presence of volatile solids below 5 g L−1 did notaffect the operating efficiency of PABR, although the particulatematter is supposed in principle to have an adverse impact on theperformance of high rate systems.
During phase 2, the organic loading rate was increased, by notdiluting the OMWW after solids removal. As a result, the CODconcentration in the effluent was constantly increasing (Fig. 3),
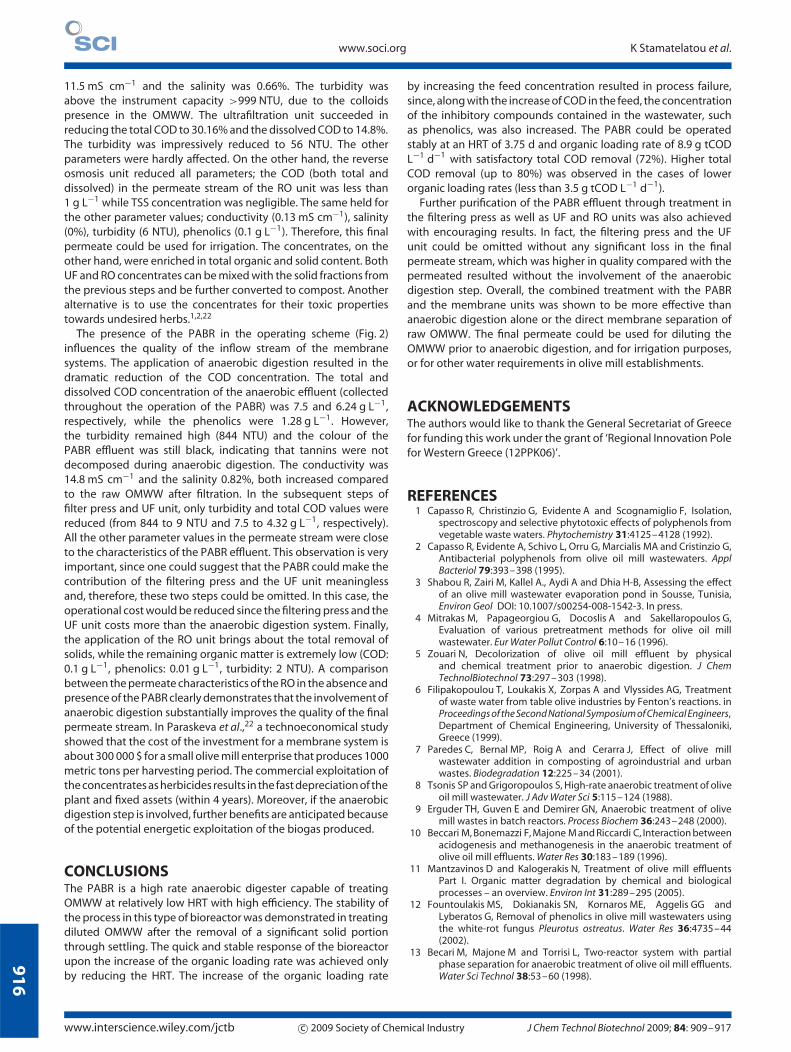
0 30 60 90 120 150 180 210 240 2700.00.51.01.52.02.53.03.54.04.55.05.56.0
0
10
20
30
40
50
60
70
80
90
100
Bio
gas
pro
du
ctio
n r
ate
(L L
-1d
-1)
Biogas, Methane content, Influent CODAlkalinity addition in the feed
#6#5
Time (d)
% C
H4
Rec
ove
ry
50607080#4#3#2#1
Infl
uen
t C
OD
co
nce
ntr
atio
n (
g L
-1)
Figure 4. Profile of the biogas volume and methane content producedduring operation of the PABR under different operating conditions. Thevariation of the influent COD concentration as well as the alkalinity additionare also given.
0 30 60 90 120 150 180 210 240 2700.0
0.2
0.4
0.6
0.8
1.0
3.5
4.0
4.5 #6#5
Rec
ove
ry
Time (d)
VF
As
con
cen
trat
ion
(g
L-1
)
acetate, propionate butyrate, valerate
#4#3#2#1
Figure 5. Profile of the VFAs concentration during the operation of PABRin different operating conditions.
0 30 60 90 120 150 180 210 240 2700
1
2
3
4
5
6
7 #6#5
Rec
ove
ry
Time (d)
Dis
solv
ed p
hen
olic
s co
nce
ntr
atio
n (
g L
-1) Influent, Effluent
#4#3#2#1
Figure 6. Profile of the phenolics concentration in the influent and effluentduring operation of the PABR under different operating conditions.
accompanied by a rapid increase in the acetic acid concentrationand a constant increase in the propionic acid, which is an indicatorof imbalance in the anaerobic digestion process (Fig. 5). Biogasproduction increased initially but finally dropped to zero. Thefailure of the process could be correlated with the increasein phenolics’ concentration to 3 g L−1 (Fig. 6) and the solidsaccumulation in the bioreactor (optical observation).
The recovery phase of the PABR after phase 2 included theremoval of a large portion of the acidified bioreactor content andaddition of an anaerobic inoculum taken from a sewage sludgeanaerobic digester. After reduction of the VFAs, the PABR wasfed again under similar operation conditions (phase 3) to thoseimposed during phase 1 and the bioreactor responded as stablyas in phase 1.
During phase 4, the organic loading rate was increased tosimilar levels as in phase 2, by feeding diluted OMWW at a lowerHRT this time. The decrease in HRT brought up a rapid increasein biogas production (compared with the increase in phase 2)and a temporal accumulation of the VFAs was observed. In orderto avoid a probable pH drop due to acid accumulation and to
J Chem Technol Biotechnol 2009; 84: 909–917 c© 2009 Society of Chemical Industry www.interscience.wiley.com/jctb
91
4
www.soci.org K Stamatelatou et al.
sustain alkalinity at 4 g L−1, extra alkalinity in the form of NaHCO3
was added sporadically as seen in Fig. 4. The CO2 evolved fromalkalinity addition also contributed into the temporal increase ofthe biogas. There were no signs of inhibition or process failure as inphase 2 even when the HRT was reduced to 5 (phase 5) and finally3.75 d (phase 6). In all cases of increasing the organic loading rateby reducing the HRT, the PABR proved to be a robust system.The higher dilution rate favors mass transfer and, consequently,conversion of the organic matter in this type of bioreactor.Moreover, the concentration of intermediate compounds thatmay have an inhibitory impact (such as VFAs or long chain fattyacids) is lower in the case of applying higher dilution comparedwith the case of applying higher organic load while maintainingthe organic loading rate constant. This happens as a result of thehigher effluent flowrate, due to which, the soluble constituents(including the inhibitory compounds) are removed at a higher rate.These facts have also been noted in the anaerobic digestion of aprotein-based synthetic medium in the PABR; the increase of theorganic loading rate by decreasing the HRT resulted in a more rapidtransient than obtained by increasing the COD in the influent.15,16
Specifically, in the case of decreasing the HRT, the concentrationof ammonia produced from gelatin degradation remained at thesame levels as before the HRT decrease,16 whereas, in the case ofthe increase of gelatin concentration in the influent, the ammoniaconcentration was almost doubled.15
The higher efficiency of the PABR during phase 4 over phase2 is not only attributed to this factor. The dilution of theOMWW brought about a decrease in the concentration of anyinhibitory compounds such as phenolic compounds. Indeed theconcentration of phenolics remained low in phase 4 in contrastwith phase 2. These aspects indicate that choosing to apply amoderate dilution in the OMWW after removing the major portionof its solids, and to operate a baffled type bioreactor such as PABRat a low HRT seem to be beneficial practices in terms of processstability and efficiency.
The impact of the decrease of the HRT on the PABR responsewas typical; first a rapid accumulation of the intermediate products(such as VFAs, Fig. 6) was observed, as a result of the temporalimbalance between the higher influent rate and consequently,the higher production rate of acids through acidogenesis andthe lower consumption rates of the acids through acetogenesisand methanogenesis. Afterwards, the accumulation diminished,as typically happens when the microorganisms that grow on theacids become adapted to the new conditions.
The periodic switching of the feeding point along thecompartments imposes a periodic disturbance on the dynamicsof the bioreactor. As a result, the parameter values monitored ina PABR compartment cannot be constant, even under constantoperating conditions. Typical profiles of COD concentrations ina compartment of the PABR operated under steady operatingconditions14 – 16 reveal that higher values of the COD concentrationare observed when the compartment serves as the feedingcompartment or receives the effluent of the feeding compartment.The COD concentration is stabilized when the compartment is thethird in series or the last one. The COD profile maintains its shapeeven at decreased HRT,16 although the ‘peak’, corresponding tothe highest COD value observed just before the feeding point isswitched to another compartment, is much higher and more acute.The high COD concentration values in the first compartments inseries do not seem to affect the effluent quality (COD concentrationin the last compartment). Although profiles of the parameters werenot obtained here, a similar response was expected in this casetoo at HRTs of 17.5 and 8.75 d. However, at HRT of 5 and 3.75d, the COD concentration level increased in the effluent (Fig. 3),indicating that the organic load imposed (and/or the inhibitoryeffect induced) on each compartment during its feeding intervalslowed down the COD consumption in the compartment, andthus, deteriorated the effluent quality. If the switching period wasdecreased to less than 2 d, then the more frequent distributionof the feed to all compartments would alleviate the impact of theheavy organic loading on a single compartment.
The variation of biogas production in each phase was mainlydue to the variation in influent COD, as a result of non-ideal stirringconditions when the OMWW was split into smaller portions. Eachphase operation lasted at least three times the HRT and thetransition to the next phase was made when the concentrationsof the dissolved COD and volatile fatty acids had been stabilized.In order to characterize the PABR performance in each phase, themean values of some key parameters (inflow dissolved COD, inflowVSS, effluent dissolved COD, specific biogas production rate andmethane content) were calculated based on the experimental datataken when the concentrations of the inflow and effluent dissolvedCOD were constant (Table 3). The time interval corresponding tothe data taken into account for all calculations is also reported inTable 3. All phases are included in this table except phase 2 due tothe instability of the process. A comparison of the methane yieldcalculated on the dissolved COD removal rate with the theoreticalmethane yield (0.35 L CH4 g−1 COD consumed), reveals that:
Table 3. Performance of PABR treating OMWW
HRT (d) 17.5 17.5 8.75 5 3.75
Phase 1 3 4 5 6
Duration (time interval of operation) (d) 60 (0–60) 48 (130–178) 54 (178–232) 17 (232–249) 14 (249–263)
Time interval of steady state∗ (d) 41–59 156–170 206–221 238–244 258–261
174–177 226–231
VSSin (g L−1) 3.15 ± 0.44 1.45 ± 0.26 2.65 ± 0.60 4.31 ± 2.56 5.79 ± 0.53
dCODin (g L−1) 22.84 ± 1.08 22.22 ± 0.48 24.37 ± 1.37 25.23 ± 0.09 19.49
dCODout (g/L) 5.64 ± 0.53 4.09 ± 0.62 5.54 ± 0.19 9.99 ± 1.06 8.13 ± 0.53
Biogas production rate (L L−1 d−1) 0.598 ± 0.037 0.587 ± 0.066 1.176 ± 0.073 2.568 ± 0.136 2.846 ± 0.143
CH4 (%) 58.3 ± 1.7 64.8 ± 1.3 63.25 ± 1.17 63.95 ± 3.81 61.76 ± 1.68
Yield (L CH4 g−1 dCOD converted) 0.355 0.367 0.346 0.539 0.580
∗ During the specified time intervals, the influent and effluent characteristics variation was very low, and their values were used to calculate the PABRperformance at steady state.
www.interscience.wiley.com/jctb c© 2009 Society of Chemical Industry J Chem Technol Biotechnol 2009; 84: 909–917

91
5
Combined anaerobic digestion and fractionation of OMWW www.soci.org
(a) the methane produced during phases 1, 3 and 4 originatedmainly from the dissolved COD removal.
(b) an extra source of COD, originating from the higher VSSconcentration of the feed and/or the VSS accumulation inthe reactor, was added to the pool of COD taken up by theanaerobic microorganisms during phases 5 and 6,
The COD balance could not be evaluated on a total COD removalbasis, because of the accumulation of solids (non-steady stateconditions with respect to the solid content of the bioreactor).The accumulation of solids in this type of configuration is afact, indicated by the low concentration of the solids in theeffluent (approximately 1.1 gTSS L−1, 0.9 gVSS L−1). It was notpossible to take proper homogenous samples to determine thesolids concentration in the bioreactor unless the PABR contentwas removed and collected in a tank to be homogenized.However, it was possible to estimate the solids retention time(solids concentration divided by the solids removal rate) based onexperimental data from previous studies. In the case of operationof PABR on a gelatin based synthetic medium16 at an organicloading rate of 6.25 gCOD L−1 d−1, the biomass accumulated inthe bioreactor was determined to be 12.84 gVSS L−1 while thesolids removal rate through the effluent were approximately 0.2gVSS L−1 d−1. The solids retention time based on these data iscalculated to be 64.2 d. In the case studied here, the solids removalrate was less than 0.24 gVSS L−1 d−1, while the solids concentrationin the bioreactor was expected to be more than 12.84 gVSS L−1
because of the solids presence in the feed. As a result, the solidsretention time was higher than 64.2 d.
Solids accumulation is a very crucial factor in this type ofbioreactor, since it enhances the solids hydrolysis, increasesthe microbial conversion rates due to the higher biomassconcentration, but also causes problems in the case of high solidloading rates. From optical observations, the solids concentrationin PABR was influenced by (a) the wall surface where biomassis attached and (b) the solids concentration in the feed. As amatter of fact, the increase in the solids inside the reactor duringphase 2 was directly related with the higher solids concentrationin the feed. The high HRT was anticipated to have a positiveimpact on the solids removal with the effluent. However, there
was no correlation between the HRT and the solids presence inthe effluent, probably indicating that the specific solids loadingrate applied in all phases but the second, did not have an adverseimpact on the solids retaining in the reactor. In a previous studyfocusing on the dynamic response of PABR fed on a gelatin basedsynthetic medium during the HRT decrease from 4 to 2 d, the VSSconcentration was hardly increased. On the other hand, the solidsentering with the feed (11.09 ± 6.00 g VSS L−1) during phase 2caused operating problems due to the increase of solids inside thereactor as well as the formation of a floating layer of flocs.
Based on the experimental data selected to represent the steadystate of PABR at each operating phase, it was estimated that thedissolved COD removal varied from 58% (HRT 3.75 d, OLR 5.2 gdCOD L−1 d−1) to 82% (HRT 17.5d, OLR 1.3 g dCOD L−1 d−1).However, in order to compare the performance of the PABR withthe performance of other high rate bioreactors, the total CODremoval should be calculated. The COD attributed to the volatilesolids in the feed was determined in repeated measurements oftotal, dissolved COD and VSS concentration in influent samples. Itwas found that each gram of VSS contained 2.4 gCOD. Taking intoaccount the VSS concentration in the feed during the steady stateof each phase, the organic loading rate based on the total CODwas estimated. Similarly, the VSS in the effluent ranged around1 g L−1 contributing to the total COD at a ratio of 1 gCOD g−1VSS,according to measurements done in effluent samples. Thereforethe estimated total COD removal from OMWW containing 26–36 gtCOD L−1, ranged from 70% to 80% at organic loading rates varyingfrom 1.5 to 8.9 g tCOD L−1 d−1. Table 4 refers to other high-rateconfigurations tested on OMWW. It is obvious that the PABRperformance on OMWW was satisfactory. Moreover, there wasno need for any special acclimation of the biomass, since theoperation of the PABR with OMWW started immediately at an HRTof 17.5 d in the conditions described in the present paper.
Membrane treatment of raw or anaerobically digested OMWWThe raw olive mill wastewater was allowed to rest and thesupernatant was filtered through an 80 µm filter. The filtratecontained total and dissolved COD at 92.9 and 72.24 g L−1,respectively, and phenolics at 5.08 g L−1. The conductivity was
Table 4. Overview of the operating conditions and performance of various anaerobic bioreactor configurations treating olive mill wastewater
ReactorCODin(g L−1) HRT (d)
OLR∗
(gCOD L−1 d−1)COD∗ removal
(%) Reference
UASBR 5.25–18.65 1 5.02 to 18.65 75 (dissolved) 27
15–22 0.83–2 9.8–21.9 70 (dissolved)
UASBR 40 5 8 80–85 28
UASBR 13–18 16–21.5 70 29
Hybrid (combination of filter and UASBR) 0.20 to 1.02 8 >89 30
17 76
Anaerobic filter (based on dissolved COD) 5.9–31.3 2–2.2 2.7–15.2 84–92 31
Anaerobic filter (after pretreatment through Fenton process) 40 4.5 10 75 24
PABR 3.75–17.5 Present paper
based on tCOD 26–36 1.5–8.9 70–80
based on dCOD 20–25 1.3–5.2 58–82
∗ COD refers to the total COD unless mentioned otherwise.UASBR: upflow anaerobic sludge blanket reactor.ABR: anaerobic baffled reactor.CSTR: continuous stirred tank reactor.PABR: periodic anaerobic baffled reactor.
J Chem Technol Biotechnol 2009; 84: 909–917 c© 2009 Society of Chemical Industry www.interscience.wiley.com/jctb
91
6
www.soci.org K Stamatelatou et al.
11.5 mS cm−1 and the salinity was 0.66%. The turbidity wasabove the instrument capacity >999 NTU, due to the colloidspresence in the OMWW. The ultrafiltration unit succeeded inreducing the total COD to 30.16% and the dissolved COD to 14.8%.The turbidity was impressively reduced to 56 NTU. The otherparameters were hardly affected. On the other hand, the reverseosmosis unit reduced all parameters; the COD (both total anddissolved) in the permeate stream of the RO unit was less than1 g L−1 while TSS concentration was negligible. The same held forthe other parameter values; conductivity (0.13 mS cm−1), salinity(0%), turbidity (6 NTU), phenolics (0.1 g L−1). Therefore, this finalpermeate could be used for irrigation. The concentrates, on theother hand, were enriched in total organic and solid content. BothUF and RO concentrates can be mixed with the solid fractions fromthe previous steps and be further converted to compost. Anotheralternative is to use the concentrates for their toxic propertiestowards undesired herbs.1,2,22
The presence of the PABR in the operating scheme (Fig. 2)influences the quality of the inflow stream of the membranesystems. The application of anaerobic digestion resulted in thedramatic reduction of the COD concentration. The total anddissolved COD concentration of the anaerobic effluent (collectedthroughout the operation of the PABR) was 7.5 and 6.24 g L−1,respectively, while the phenolics were 1.28 g L−1. However,the turbidity remained high (844 NTU) and the colour of thePABR effluent was still black, indicating that tannins were notdecomposed during anaerobic digestion. The conductivity was14.8 mS cm−1 and the salinity 0.82%, both increased comparedto the raw OMWW after filtration. In the subsequent steps offilter press and UF unit, only turbidity and total COD values werereduced (from 844 to 9 NTU and 7.5 to 4.32 g L−1, respectively).All the other parameter values in the permeate stream were closeto the characteristics of the PABR effluent. This observation is veryimportant, since one could suggest that the PABR could make thecontribution of the filtering press and the UF unit meaninglessand, therefore, these two steps could be omitted. In this case, theoperational cost would be reduced since the filtering press and theUF unit costs more than the anaerobic digestion system. Finally,the application of the RO unit brings about the total removal ofsolids, while the remaining organic matter is extremely low (COD:0.1 g L−1, phenolics: 0.01 g L−1, turbidity: 2 NTU). A comparisonbetween the permeate characteristics of the RO in the absence andpresence of the PABR clearly demonstrates that the involvement ofanaerobic digestion substantially improves the quality of the finalpermeate stream. In Paraskeva et al.,22 a technoeconomical studyshowed that the cost of the investment for a membrane system isabout 300 000 $ for a small olive mill enterprise that produces 1000metric tons per harvesting period. The commercial exploitation ofthe concentrates as herbicides results in the fast depreciation of theplant and fixed assets (within 4 years). Moreover, if the anaerobicdigestion step is involved, further benefits are anticipated becauseof the potential energetic exploitation of the biogas produced.
CONCLUSIONSThe PABR is a high rate anaerobic digester capable of treatingOMWW at relatively low HRT with high efficiency. The stability ofthe process in this type of bioreactor was demonstrated in treatingdiluted OMWW after the removal of a significant solid portionthrough settling. The quick and stable response of the bioreactorupon the increase of the organic loading rate was achieved onlyby reducing the HRT. The increase of the organic loading rate
by increasing the feed concentration resulted in process failure,since, along with the increase of COD in the feed, the concentrationof the inhibitory compounds contained in the wastewater, suchas phenolics, was also increased. The PABR could be operatedstably at an HRT of 3.75 d and organic loading rate of 8.9 g tCODL−1 d−1 with satisfactory total COD removal (72%). Higher totalCOD removal (up to 80%) was observed in the cases of lowerorganic loading rates (less than 3.5 g tCOD L−1 d−1).
Further purification of the PABR effluent through treatment inthe filtering press as well as UF and RO units was also achievedwith encouraging results. In fact, the filtering press and the UFunit could be omitted without any significant loss in the finalpermeate stream, which was higher in quality compared with thepermeated resulted without the involvement of the anaerobicdigestion step. Overall, the combined treatment with the PABRand the membrane units was shown to be more effective thananaerobic digestion alone or the direct membrane separation ofraw OMWW. The final permeate could be used for diluting theOMWW prior to anaerobic digestion, and for irrigation purposes,or for other water requirements in olive mill establishments.
ACKNOWLEDGEMENTSThe authors would like to thank the General Secretariat of Greecefor funding this work under the grant of ‘Regional Innovation Polefor Western Greece (12PPK06)’.
REFERENCES1 Capasso R, Christinzio G, Evidente A and Scognamiglio F, Isolation,
spectroscopy and selective phytotoxic effects of polyphenols fromvegetable waste waters. Phytochemistry 31:4125–4128 (1992).
2 Capasso R, Evidente A, Schivo L, Orru G, Marcialis MA and Cristinzio G,Antibacterial polyphenols from olive oil mill wastewaters. ApplBacteriol 79:393–398 (1995).
3 Shabou R, Zairi M, Kallel A., Aydi A and Dhia H-B, Assessing the effectof an olive mill wastewater evaporation pond in Sousse, Tunisia,Environ Geol DOI: 10.1007/s00254-008-1542-3. In press.
4 Mitrakas M, Papageorgiou G, Docoslis A and Sakellaropoulos G,Evaluation of various pretreatment methods for olive oil millwastewater. Eur Water Pollut Control 6:10–16 (1996).
5 Zouari N, Decolorization of olive oil mill effluent by physicaland chemical treatment prior to anaerobic digestion. J ChemTechnolBiotechnol 73:297–303 (1998).
6 Filipakopoulou T, Loukakis X, Zorpas A and Vlyssides AG, Treatmentof waste water from table olive industries by Fenton’s reactions. inProceedings of the Second National Symposium of Chemical Engineers,Department of Chemical Engineering, University of Thessaloniki,Greece (1999).
7 Paredes C, Bernal MP, Roig A and Cerarra J, Effect of olive millwastewater addition in composting of agroindustrial and urbanwastes. Biodegradation 12:225–34 (2001).
8 Tsonis SP and Grigoropoulos S, High-rate anaerobic treatment of oliveoil mill wastewater. J Adv Water Sci 5:115–124 (1988).
9 Erguder TH, Guven E and Demirer GN, Anaerobic treatment of olivemill wastes in batch reactors. Process Biochem 36:243–248 (2000).
10 Beccari M, Bonemazzi F, Majone M and Riccardi C, Interaction betweenacidogenesis and methanogenesis in the anaerobic treatment ofolive oil mill effluents. Water Res 30:183–189 (1996).
11 Mantzavinos D and Kalogerakis N, Treatment of olive mill effluentsPart I. Organic matter degradation by chemical and biologicalprocesses – an overview. Environ Int 31:289–295 (2005).
12 Fountoulakis MS, Dokianakis SN, Kornaros ME, Aggelis GG andLyberatos G, Removal of phenolics in olive mill wastewaters usingthe white-rot fungus Pleurotus ostreatus. Water Res 36:4735–44(2002).
13 Becari M, Majone M and Torrisi L, Two-reactor system with partialphase separation for anaerobic treatment of olive oil mill effluents.Water Sci Technol 38:53–60 (1998).
www.interscience.wiley.com/jctb c© 2009 Society of Chemical Industry J Chem Technol Biotechnol 2009; 84: 909–917
91
7
Combined anaerobic digestion and fractionation of OMWW www.soci.org
14 Skiadas IV and Lyberatos G, The periodic anaerobic baffled reactor.Water Sci Technol 38:401–408 (1998).
15 Stamatelatou K, Optimization of anaerobic digestion systems. Thesis,University of Patras, Greece, in Greek (1999).
16 Stamatelatou K and Lyberatos G, Simulation of a periodic anaerobicbaffled reactor (PABR): steady state and dynamic response. WaterSci Technol 45:81–86 (2002).
17 Stamatelatou K, Vavilin V and Lyberatos G, Performance of a glucosefed periodic anaerobic baffled reactor (PABR) under increasingorganic loading conditions: 1 experimental results. BioresourceTechnol 88:131–136 (2003).
18 Antonopoulou G, Stamatelatou K, Venetsaneas N, Kornaros M andLyberatos G, Biohydrogen and methane production from cheesewhey in a two-stage anaerobic process. Ind Eng Chem Res47:5227–5233 (2008).
19 Liu X, Ren N, and Yuan Y, Performance of a periodic anaerobic baffledreactor fed on Chinese traditional medicine industrial wastewater.Bioresource Technol 100:104–110 (2009).
20 Canepa P, Marignetti N, Rognoni U and Calgari S, Olive mill wastewatertreatment by combined membrane processes. Water Res22:491–1494 (1988).
21 Turano E, Curcio S, De Paola MG, Calabro V and Iorio G, An integratedcentrifugation-ultrafiltration system in the treatment of olive millwastewater. J Membrane Sci 209:519–531 (2002).
22 Paraskeva CA, Papadakis VG, Kanellopoulou DG, Koutsoukos PG andAngelopoulos KC, Membrane filtration of olive mill wastewater(OMW) and OMWW fractions’ exploitation. Water Environ Res79:421–429 (2007).
23 Paraskeva CA, Papadakis VG, Tsarouchi E, Kanellopoulou DG andKoutsoukos PG, Membrane processing for olive mill wastewaterfractionation. Desalination 213:218–229 (2007).
24 Khoufi S, Aloui F and Sayadi S, Pilot scale hybrid process for olive millwastewater treatment and reuse. Chem Eng Process 48:643–650(2009).
25 APHA, AWWA, WEF, Standard Methods for the Examination of Waterand Wastewater, 19th edn. American Public Health Association,Washington, DC (1995).
26 Waterman PG and Mole S, Analysis of phenolic plant metabolites.in Methods in Ecology, ed. by Lawton JH and Likens GE. BlackwellScientific Publications, Oxford (1994).
27 Ubay G and Ozturk I, Anaerobic treatment of olive mill effluents. WaterSci Technol 36:287–294 (1997).
28 Sabbah I, Marsook T and Basheer T, The effect of pretreatment onanaerobic activity of olive mill wastewater using batch andcontinuous systems. Process Biochem 39:1947–1951 (2004).
29 Boari G, Brunetti A, Passino R and Rozzi A, Anaerobic digestion of oliveoil mill wastewaters. Agric Wastes 10:161–171 (1984).
30 Borja R, Alba J and Banks CJ, Anaerobic digestion of wash watersderived from the purification of virgin olive oil using a hybridreactor combining a filter and a sludge blanket. Process Biochem31:219–224 (1996).
31 Rizzi A., Zucchi M., Borin S., Marzorati M., Sorlini C. and Daffonchio D,Response of methanogen populations to organic load increaseduring anaerobic digestion of olive mill wastewater. J Chem TechnolBiotechnol 81:556–1562 (2006).
J Chem Technol Biotechnol 2009; 84: 909–917 c© 2009 Society of Chemical Industry www.interscience.wiley.com/jctb