anaerobic co-digestion of glycerol and wastewater derived from biodiesel manufacturing
TRANSCRIPT

Bioresource Technology 101 (2010) 6315–6321
Contents lists available at ScienceDirect
Bioresource Technology
journal homepage: www.elsevier .com/locate /bior tech
Anaerobic co-digestion of glycerol and wastewater derived frombiodiesel manufacturing
J.A. Siles, M.A. Martín *, A.F. Chica, A. MartínDepartamento de Química Inorgánica e Ingeniería Química, Facultad de Ciencias, Universidad de Córdoba, Campus Universitario de Rabanales, Edificio C-3, Ctra. Madrid-Cádiz,km 396, 14071 Córdoba, Spain
a r t i c l e i n f o
Article history:Received 6 December 2009Received in revised form 5 March 2010Accepted 9 March 2010Available online 3 April 2010
Keywords:Biodiesel manufacturingGlycerol-containing wasteWastewaterAnaerobic co-digestionMesophilic temperature
0960-8524/$ - see front matter � 2010 Elsevier Ltd. Adoi:10.1016/j.biortech.2010.03.042
* Corresponding author. Tel.: +34 957 218586; fax:E-mail address: [email protected] (M.A. Martín).
a b s t r a c t
The anaerobic co-digestion of glycerol and wastewater derived from biodiesel manufacturing, inwhich COD was found to be 1054 and 428 g/L, respectively, was studied in batch laboratory-scalereactors at mesophilic temperature (35 �C). Glycerol was acidified with H3PO4 in order to recoverthe alkaline catalyst employed in the transesterification reaction (KOH) as agricultural fertiliser(potassium phosphates). Wastewater was subjected to an electrocoagulation process in order toreduce its oil content. After mixing, the anaerobic revalorisation of the wastewater was studiedemploying inoculum–substrate ratios ranging from 5.02 to 1.48 g VSS/g COD and organic loading ratesof 0.27–0.36 g COD/g VSS d. Biodegradability was found to be around 100%, while the methane yieldcoefficient was 310 mL CH4/g COD removed (1 atm, 25 �C). At the equilibrium time, the proportionalitybetween �r0 and the load was constant, showing 1.55 mL CH4/(g VSS g COD h). The results showed thatanaerobic co-digestion reduces the clean water and nutrient requirement, with the consequent eco-nomical and environmental benefit.
� 2010 Elsevier Ltd. All rights reserved.
1. Introduction
Biodiesel fuels have recently drawn much attention given thatthey have various advantages such as providing an alternative topetroleum-based fuel, renewable fuel, a favourable energy bal-ance, lower harmful emissions and non-toxic fuel (Ito et al.,2005). However, one of the main disadvantages of using biodie-sel is the high cost of the raw material, which leads to an expen-sive final product and the generation of impure and low-pricedglycerol as a by-product (Hazimah et al., 2003). For this reason,several studies have been carried out to optimise biodiesel pro-duction from used-cooking oils and improve the economic bal-ance (Zhang et al., 2003). Nevertheless, used-cooking oilsusually contain more than 0.5% of free fatty acids (FFA) andother products that are formed during frying, making it neces-sary to pre-treat this by-product when alkaline transesterifica-tion is employed to manufacture biodiesel (Ruiz-Méndez et al.,2008). On the other hand, according to the EN 14214 Standard(2002), the biodiesel obtained in this way requires purification.Although several purification strategies have been described inthe literature (Berrios and Skelton, 2008), the most frequent pro-
ll rights reserved.
+34 957 218625.
cess consists of washing with clean water, which leads to thegeneration of large amounts of highly polluted wastewater.
Consequently, the recent growth of the biodiesel industry hasnot only created a glycerol surplus resulting in a dramatic 10-folddecrease in crude glycerol prices over the last years, but has alsogiven rise to environmental concerns associated with wastewaterdisposal (Sandun et al., 2007).
Several strategies based on chemical and biological transforma-tions are being pursued to convert glycerol into more valuableproducts (Yazdani and Gonzalez, 2007). Anaerobic digestion is an-other alternative for revalorising this by-product. Anaerobic diges-tion may be defined as the biological conversion of organicmaterial into a variety of end products including ‘biogas’ whosemain constituents are methane (65–70%) and carbon dioxide (SilesLópez et al., 2009; Wheatley, 1990). The advantages of anaerobicdigestion include low levels of biological sludge, low nutrientrequirements, high efficiency and the production of methanewhich can be used as an energy source for on-site heating and elec-tricity (Nallathambi Gunaseelan, 2009). Anaerobic digestion is anattractive waste treatment practice in which both pollution controland energy recovery can be achieved. Many agricultural and indus-trial wastes are ideal candidates for anaerobic digestion becausethey contain high levels of easily biodegradable materials (Chenet al., 2008).
On the other hand, wastewater derived from biodiesel manufac-turing is rich in long-chain fatty acids that have been reported to

Nomenclature
Alk alkalinity (mg CaCO3/L)CODremoved removed chemical oxygen demand (mg/L)CODsoluble soluble chemical oxygen demand (mg/L)COD STO initial chemical oxygen demand (mg/L)CODtotal total chemical oxygen demand (mg/L)FAME fatty acid methyl estersG cumulative methane volume (mL)Gm cumulative methane volume at infinite time (mL)GT experimental maximum methane volume (mL)K 0G apparent kinetic constant (1/h)KG specific methane production kinetic constant (L/
g VSS h)MSS mineral suspended solids (mg/L)
OLR organic loading rate (g COD/g VSS d)r0 specific methane production rate (mL CH4/g VSS h)�r0 mean specific methane production rate (mL CH4/
(g VSS g COD h))Sremoved removed substrate (g COD)STO initial substrate (g COD)t time (h)TSS total suspended solids (mg/L)VA volatile acidity (mg acetic acid/L)VSS volatile suspended solids (mg/L)X biomass concentration (mg VSS/L)YCH4/S removed methane yield coefficient (mL CH4/g COD removed)
6316 J.A. Siles et al. / Bioresource Technology 101 (2010) 6315–6321
be inhibitors of the anaerobic digestion process. Hanaki et al.(1981) examined the inhibitory effect of these compounds on theanaerobic digestion process in batch experiments using syntheticsubstrates. Adding long-chain fatty acids to the anaerobic digesterscaused the appearance of a lag period in the production of methanefrom acetate and in the degradation of the long-chain fatty acidsand n-butyrate. The addition of calcium chloride reduced theinhibitory effect of long-chain fatty acids, but it did not do so afterthe culture had been exposed to these acids for several hours. Toreduce this effect, electrocoagulation has been proposed as a suc-cessful pre-treatment for oily wastewater with a subsequentanaerobic treatment. This pre-treatment consists of destabilisingsuspended, emulsified or dissolved contaminants in an aqueousmedium by introducing an electric current into the medium(Emamjomeh and Sivakumar, 2009). Calvo et al. (2003) conductedan electrocoagulation process to treat different soluble oily wasteswith very high COD. Electrocoagulation tests were initially con-ducted in a continuously operated laboratory-scale unit to reduceCOD in the 70–90% range. For different concentrations of solubleoils, the COD removal was found to be in the 49–78% range whenthe current rate was a constant 7 A. However, the removal of CODincreased to 90% when the current rate was increased to 10 A.Moreover, demulsification of oily wastewater by electrocoagula-tion in a batch cell with horizontally oriented electrodes was alsostudied by Fouad et al. (2009). This system could reduce oil con-centration in wastewater from 500 to 6 ppm within 30 min. Thispre-treatment would also reduce the polyphenol concentrationfrequently contained in oily wastewater which inhibits the activityof micro-organisms during biological oxidations (Panizza and Cer-isola, 2006).
In order to improve the performance of anaerobic digesters, theanaerobic co-digestion of different organic wastes together is acommon practice (Bolzonella et al., 2006). For this reason, theanaerobic co-digestion of glycerol together with the wastewatergenerated during biodiesel manufacturing, combined with pre-treatment processes, might be a potentially successful treatment.This research would form part of what is known as the biorefineryconcept; a relatively new term referring to the conversion of feed-stock into a host of valuable chemicals and energy. The main pur-pose of this study was to evaluate the performance, stability,biodegradability, methane yield coefficient, kinetics of methaneproduction, inoculum–substrate ratio and organic loading rate(OLR) of the anaerobic co-digestion of glycerol and wastewater de-rived from biodiesel manufacturing. The study was carried out inthree batch laboratory-scale reactors at mesophilic temperature(35 �C) and it can be considered of great interest to evaluate the via-bility of the process, determining the thresholds that inhibit it. Thisevaluation could be the key in the scale-up at pilot and full scale.
2. Materials
2.1. Experimental set-up
The experimental set-up used for the co-digestion of the biodie-sel-derived glycerol and wastewater consisted of three 1-L Pyrexreactors with four connections to load feedstock, ventilate the bio-gas, inject inert gas (nitrogen) to maintain the anaerobic conditionsand remove effluent. The content of the reactors was magneticallystirred and temperature was maintained by means of a thermo-static jacket containing water at 37 �C. The volume of methane pro-duced during the process was measured using 1-L Boyle-Mariottereservoirs connected to each reactor. To remove the CO2 producedduring the process, tightly closed bubblers containing a NaOHsolution (6 N) were connected between the two elements. Themethane volume displaced an equal measurable volume of waterfrom the reservoir. The reactors were inoculated with methano-genically-active granular biomass obtained from a full-scale anaer-obic reactor used to treat brewery wastewater from the HeinekenS.A. Factory (Jaen, Spain). The sludge contained 37,500 mg VSS/Land 31,875 mg MSS/L. The inoculum was selected on the basis ofits high methanogenic activity (Field et al., 1988), with values rang-ing from 0.87 to 0.99 g COD/g VSS d.
2.2. Substrate
The raw material used as substrate in this work consisted of amixture of glycerol-containing waste and wastewater derived fromthe manufacturing of biodiesel from used-cooking oil. The sub-strate was provided by the BIDA S.A. Factory of Fuentes de Andalu-cia (Seville, Spain).
2.2.1. GlycerolIn general, this substrate contained glycerol, water, methanol,
salts and fatty acids. Before anaerobic digestion, the glycerol wasacidified with phosphoric acid and centrifuged in order to recoverthe catalyst used in the transesterification reaction (KOH) as agri-cultural fertiliser (potassium phosphates). The final COD of this by-product was found to be 1054 ± 24 g/L.
2.2.2. WastewaterThe wastewater used as co-substrate in this study derived from
the biodiesel purification, washing of used-cooking oil employed assubstrate for the manufacture of biodiesel, from the distillationcolumn where the methanol utilised in the production process ispurified and from swilling-down. Consequently, this wastewaterwas rich in biodiesel, oil, glycerol, free fatty acids and methanol.Given that KOH was utilised as a catalyst in the transesterification

Table 1Composition and features of pre-treated wastewater and glycerol–wastewatermixture.
Parameter Pre-treatedwastewater
15% glycerol and 85%wastewater mixture
pH 6.80 ± 0.03 7.13 ± 0.05Alkalinity (mg CaCO3/L) 100 ± 5 125 ± 5Volatile acidity (mg
acetic acid/L)55 ± 5 80 ± 12
Conductivity (mS/cm) 3.27 ± 0.25 6.74 ± 0.38CODsoluble (g/L) 185 ± 5 300 ± 5TC (mg/L) 49,820 ± 24 82,410 ± 44TOC (mg/L) 49,770 ± 23 82,350 ± 42IC (mg/L) 50 ± 1 60 ± 2N–NH4
+ (mg/L) 1.16 ± 0.11 0.16 ± 0.02
P� PO3�4 (mg/L) <5 <5
J.A. Siles et al. / Bioresource Technology 101 (2010) 6315–6321 6317
reaction, the pH of this waste was found to be 10.35 ± 0.03, whilethe total COD was 428 ± 12 g/L.
With the aim of reducing its oily organic matter content, thewastewater was pre-treated. The wastewater was acidified by add-ing commercial sulphuric acid until a final pH 6 4 and centrifugedat 8000 rpm for 5 min. This step permitted the wastewater to bedemulsified and the oily phase (oil and biodiesel) to be recovered.This phase accounted for 3.80% (w/w) of the waste, whose FAMEcontent and acidity index were 44.00 ± 2.51% and 18.90 ± 0.62 mgKOH/g, respectively. Because the waste did not meet legal stan-dards to be sold as fuel, it was recirculated into the biodiesel man-ufacturing process. On the other hand, the aqueous phase, in whichtotal and soluble COD was found to be 252 ± 9 and 213 ± 7 g/L,respectively, was neutralised by adding NaOH and subjected toelectrocoagulation in accordance with the recommendations ofTezcan Un et al. (2009). A 5 L completely stirred tank reactor wasemployed for electrocoagulation. The reactor contained eight alu-minium electrodes with a surface area of 80.5 cm2 to which a di-rect current was applied for 30 min (12 V, 1.5 A). The aluminiumions generated during the process were hydrolysed in the electro-chemical cell to produce metal hydroxide ions according to the fol-lowing reactions (Tezcan Un et al., 2009):
At the anode : Al! Al3þðaqÞ þ 3e�
At the cathode :3H2Oþ 3e� ! 3=2H2ðgÞ þ 3OH�
In the solution :Al3þðaqÞ þ 3H2O! AlðOHÞ3 þ 3Hþ
Additionally, water electrolysis in the solution takes place:
2H2Oþ 2e� ! H2ðgÞ þ 2OH�
2H2O! O2 þ 4Hþ þ 4e�
Metal species react with negatively charged particles in the waterwhich efficiently precipitates and in a subsequent stage, Al(OH)3
flocs trap colloidal precipitates. The gases produced during the elec-trolysis of the water and the solubilisation of the metallic anode al-lows the resulting flocs to float, making it easier to separate thesolid content from the liquid. After this step, flocs were removedfrom the aqueous phase. The resulting aqueous phase was charac-terised and mixed with glycerol at a proportion of 85–15 (COD), un-til obtaining a final soluble COD of 300 g/L. The wastewater wasthen neutralised by adding sodium hydroxide in order to study itsco-digestion. In the biodiesel industry, lower amounts of glycerolare generated than wastewater. As a result, the percentage selectedfor the mixture allows the different flows to be absorbed, whilemaking it easier to load the digesters. Table 1 shows the analyticalcharacteristics of the pre-treated wastewater and the glycerol–wastewater mixture.
2.3. Anaerobic digesters. Experimental procedure
The anaerobic reactors were initially loaded with 12 g VSS ofgranular sludge as inoculum, and the anaerobic co-digestion ofglycerol and wastewater was studied. In all cases, the nutrientand trace element solutions described by Fannin (1987) and Fieldet al. (1988) were added when the sludge was loaded. Both solu-tions are very important for activating bacterial growth andmetabolism at the beginning of the process and for compensatingthe shortage of nutrients in the substrates.
In order to activate the biomass prior to the experiments, thereactors were first fed with a synthetic solution composed of glu-cose, sodium acetate and lactic acid (GAL solution) at concentra-tions of 50 g/L, 25 g/L and 20.8 mL/L, respectively. During thisinitial period, the organic load added to the reactors was graduallyincreased from 0.25 to 1.00 g COD over a 20 day period. After thisprevious stage, biomass acclimatisation was carried out. The reac-
tors were fed with 1 g COD, in which the percentage of mixtureused in the COD was increased from 25% to 100% after 4 loads. Dur-ing this acclimatisation period, the volume of methane was mea-sured as a function of time. Each assay lasted a maximum of48 h; the time interval required to completely biomethanise eachload. Once this preliminary acclimatisation step was finished, aseries of batch experiments were carried out using the mixture.During each set of experiments, the organic load added to the reac-tors was gradually increased from 1.0 to 2.0 and 3.0 g COD. In allcases, the volume of methane was measured as a function of timeand samples were taken and analysed before and after feeding. Theduration of each experiment was equal to the time interval re-quired for maximum gas production and COD removal, whichwas found to be in the range of 18–45 h. Each load was carriedout at least in duplicate and the results expressed as means.
2.4. Chemical analyses
The following parameters were determined in the effluents ofeach load: pH, CODtotal, CODsoluble, TSS, MSS, VSS, volatile acidity(VA) and alkalinity (Alk). All analyses were carried out in accor-dance with the Standard Methods of the APHA (APHA, 1989). Addi-tionally, conductivity, nitrogen, phosphorous, TOC, TIC, FAME andacid value were determined in the substrates. Conductivity, nitro-gen and phosphorous were also determined according to APHAstandards (1989). In order to determine TOC and TIC, a ShimadzuTotal Carbon analyser was used. The TOC analyser was calibratedwith a standard solution of potassium phthalate prior to the TOCanalyses. On the other hand, non-polar FAME content was deter-mined by gas chromatography using a method in accordance withthe EN 14103 Standard. For this purpose, a Varian 3900 chromato-graph equipped with a column (Supelco 24111 SP™ 238060 � 0.25 lm FILM. COLUMN 31827�02) and a flame ionisationdetector which operated at 150–250 and 250 �C respectively, wasemployed. Helium and nitrogen were used as carrier gas. Acid va-lue was determined by titration with KOH in accordance with theEN 14104 Standard.
2.5. Software
Sigma-Plot software (version 11.0) was used to design graphs,perform the statistical analysis and fit the experimental data pre-sented in this work.
3. Results and discussion
3.1. Electrocoagulation efficiency
Fig. 1 shows the evolution of the total and soluble COD of thewastewater with electrocoagulation time. As can be seen, total

6318 J.A. Siles et al. / Bioresource Technology 101 (2010) 6315–6321
COD decreased by 6.25%, while soluble COD decreased by 13.60%with this pre-treatment after 30 min of electrocoagulation,although 20 min of treatment were sufficient to reach these values.The overall reduction of total COD was found to be 45% with boththe acidification–centrifugation and electrocoagulation steps.These results are in line with those obtained by Chatzisymeonet al. (2009), who achieved a 30% reduction in COD in olive millwastewater working under similar conditions. Analogously, Fig. 1also shows the evolution of pH with electrocoagulation time. Log-ically, pH initially increased (from 8.31 to 9.08) due to the genera-tion of OH� at the cathode. However, because of the accumulationof H+ in the solution, the pH decreased after 10 min until reaching afinal value of 6.80. The highest pH corresponds to the generation ofthe flocs. These pH values were in the range of optimal pH de-scribed by Tezcan Un et al. (2009).
3.2. Stability of the anaerobic digestion process
The stability of the process was evaluated based on the evolu-tion of the pH, alkalinity, volatile acidity and volatile acidity/alka-linity ratio (VA/Alk) during the anaerobic digestion of the mixture.Table 2 shows the mean value and standard deviation of the pHand volatile acidity/alkalinity ratio before feeding and in the efflu-ents of the reactors for the different loads added. The pH wasapproximately constant across experiments, with a mean valueof 7.83 ± 0.20. This value remained within the optimal range formethanogenic bacteria (Fannin, 1987; Wheatley, 1990). The vola-
Time (min)
0 5 10 15 20 25 30 35
CO
D (
g/L
)
160
180
200
220
240
260
pH
5
6
7
8
9
10
COD totalCOD solublepH
Fig. 1. Evolution of total and soluble COD and pH with electrocoagulation time.
Table 3GT, Gm, K 0G, X and KG values obtained for all the loads studied.
Load (g COD) OLR (g COD/g VSS d) GT (mL CH4) Gm (mL CH4)
1.0 0.27 332 ± 11 333 ± 42.0 0.33 625 ± 12 639 ± 63.0 0.36 956 ± 43 1010 ± 24
Table 2pH, VA (eq acetic)/Alk (mg CaCO3) ratio and Alk (mg CaCO3/L) – 0.7 � VA (mg aceticacid/L) for the different loads studied.
Load(g COD)
pH VA/Alk (eq aceticacid/eq CaCO3)
Alk (mg CaCO3/L) – 0.7 � VA(mg acetic acid/L)
Initial 8.18 ± 0.09 0.11 ± 0.03 1579 ± 781.00 7.86 ± 0.11 0.08 ± 0.02 2374 ± 912.00 7.62 ± 0.23 0.06 ± 0.01 1937 ± 2843.00 8.01 ± 0.09 0.11 ± 0.03 1670 ± 123
tile acidity/alkalinity ratio values were always found to be lowerthan 0.30–0.40, thus indicating that the process operated favour-ably without the risk of acidification (Balaguer et al., 1992). Onthe other hand, Lane (1984) described that for stable digestionsit is imperative that a satisfactory ratio be maintained betweenVFA and alkalinity levels. This ratio is given by the empirical rela-tionship alkalinity (mg/L) – 0.7 � VFA (mg/L), which should not beless than 1500 for balanced digestion to occur. Table 2 also showsthe values calculated according to the ratio. The values were al-ways higher than 1500, although they decreased from 2374 to1670 with increasing loads.
3.3. Methane yield coefficient and biodegradability
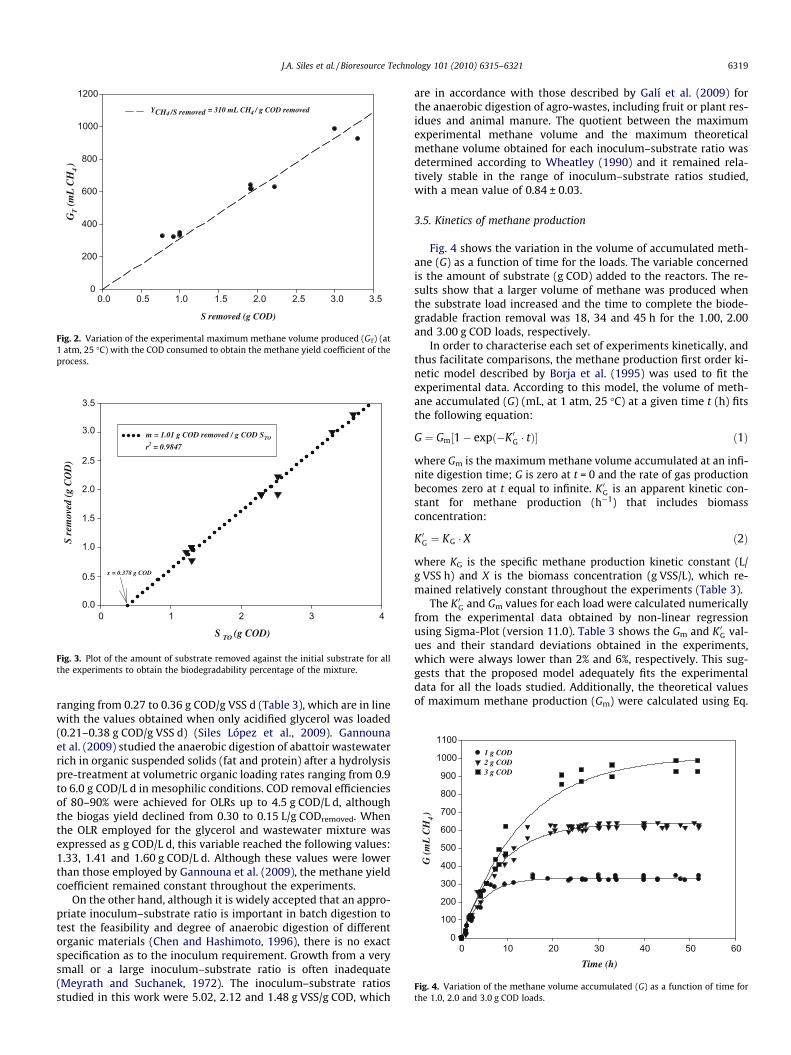
Methane yield coefficient was determined from the experimen-tal maximum methane volume produced (GT) (Table 3) and the re-moved COD, which were known in all loads. As shown in Fig. 2, byfitting the value pairs (GT, CODremoved) to a straight line, the meth-ane yield coefficient coincides with the slope of the regression lineand was found to be 310 mL CH4/g CODremoved (at 1 atm, 25 �C).According to Wheatley (1990) and considering the biomass growthand cell maintenance null, 382 mL of methane are theoreticallyproduced (at 1 atm, 25 �C) per gram of CODremoved. In experimentalterms, the effectiveness of the process was 81%, meaning that mostof the CODremoved is employed for methane production and themicrobial metabolism is chiefly oriented towards generating gas.In contrast, the biodegradability of the glycerol–wastewater mix-ture was calculated by plotting the amount of substrate removedagainst the initial substrate concentration for each experiment.These data are shown in Fig. 3 where the slope of the straight linedenotes the percentage biodegradability of the mixture, which wasfound to be around 100%. In all the cases, the reactors containedsoluble and non-biodegradable COD before adding the mixture,reaching a mean value of 0.378 g COD. These results showed thatthe anaerobic co-digestion of glycerol and wastewater derivedfrom biodiesel manufacturing improves the methane yield coeffi-cient as compared to the individual anaerobic treatment of acidi-fied glycerol employing granular sludge (292 mL CH4/g CODremoved) and that the biodegradability remained constantaround 100% (Siles López et al., 2009). This suggests that the co-digestion of glycerol with wastewater enhanced the volume ofmethane obtained, with the consequent energy benefit. Further-more, this process lowered the volume of clean water required todilute glycerol when only glycerol is employed as substrate, withthe consequent economical and environmental benefit as well.Similar results were obtained by Rodríguez et al. (2006), who dem-onstrated that the digestion of either winery wastewater or wasteactivated sludge in isolation generated less methane and removeda lower amount of COD than the digestion of the mixed wastes.This means that co-digestion reduces the negative effects of somesubstrates belonging to both wastes.
3.4. Organic loading rate (OLR) and inoculum–substrate ratio
The organic loading rate (OLR), which is expressed as g COD/g VSS d, takes into account both the biomass concentration andthe organic load added to the reactors. This variable reached values
K 0G (h�1) R2 X (g VSS/L) KG (L�g�1 h�1)
0.217 ± 0.012 0.9810 5.02 0.043 ± 0.0060.121 ± 0.005 0.9853 4.23 0.027 ± 0.0060.075 ± 0.005 0.9845 4.45 0.017 ± 0.001
S removed (g COD)
GT (
mL
CH
4 )
0
200
400
600
800
1000
1200YCH4 /S removed = 310 mL CH4 / g COD removed
0.0 0.5 1.0 1.5 2.0 2.5 3.0 3.5
Fig. 2. Variation of the experimental maximum methane volume produced (GT) (at1 atm, 25 �C) with the COD consumed to obtain the methane yield coefficient of theprocess.
S TO (g COD)
0 1 2 3 4
S re
mov
ed (
g C
OD
)
m = 1.01 g COD removed / g COD STO
r2 = 0.9847
x = 0.378 g COD
0.0
0.5
1.0
1.5
2.0
2.5
3.0
3.5
Fig. 3. Plot of the amount of substrate removed against the initial substrate for allthe experiments to obtain the biodegradability percentage of the mixture.
Time (h)
0 10 20 30 40 50 60
G (
mL
CH
4)
0
100
200
300
400
500
600
700
800
900
1000
11001 g COD2 g COD3 g COD
Fig. 4. Variation of the methane volume accumulated (G) as a function of time forthe 1.0, 2.0 and 3.0 g COD loads.
J.A. Siles et al. / Bioresource Technology 101 (2010) 6315–6321 6319
ranging from 0.27 to 0.36 g COD/g VSS d (Table 3), which are in linewith the values obtained when only acidified glycerol was loaded(0.21–0.38 g COD/g VSS d) (Siles López et al., 2009). Gannounaet al. (2009) studied the anaerobic digestion of abattoir wastewaterrich in organic suspended solids (fat and protein) after a hydrolysispre-treatment at volumetric organic loading rates ranging from 0.9to 6.0 g COD/L d in mesophilic conditions. COD removal efficienciesof 80–90% were achieved for OLRs up to 4.5 g COD/L d, althoughthe biogas yield declined from 0.30 to 0.15 L/g CODremoved. Whenthe OLR employed for the glycerol and wastewater mixture wasexpressed as g COD/L d, this variable reached the following values:1.33, 1.41 and 1.60 g COD/L d. Although these values were lowerthan those employed by Gannouna et al. (2009), the methane yieldcoefficient remained constant throughout the experiments.
On the other hand, although it is widely accepted that an appro-priate inoculum–substrate ratio is important in batch digestion totest the feasibility and degree of anaerobic digestion of differentorganic materials (Chen and Hashimoto, 1996), there is no exactspecification as to the inoculum requirement. Growth from a verysmall or a large inoculum–substrate ratio is often inadequate(Meyrath and Suchanek, 1972). The inoculum–substrate ratiosstudied in this work were 5.02, 2.12 and 1.48 g VSS/g COD, which
are in accordance with those described by Galí et al. (2009) forthe anaerobic digestion of agro-wastes, including fruit or plant res-idues and animal manure. The quotient between the maximumexperimental methane volume and the maximum theoreticalmethane volume obtained for each inoculum–substrate ratio wasdetermined according to Wheatley (1990) and it remained rela-tively stable in the range of inoculum–substrate ratios studied,with a mean value of 0.84 ± 0.03.
3.5. Kinetics of methane production
Fig. 4 shows the variation in the volume of accumulated meth-ane (G) as a function of time for the loads. The variable concernedis the amount of substrate (g COD) added to the reactors. The re-sults show that a larger volume of methane was produced whenthe substrate load increased and the time to complete the biode-gradable fraction removal was 18, 34 and 45 h for the 1.00, 2.00and 3.00 g COD loads, respectively.
In order to characterise each set of experiments kinetically, andthus facilitate comparisons, the methane production first order ki-netic model described by Borja et al. (1995) was used to fit theexperimental data. According to this model, the volume of meth-ane accumulated (G) (mL, at 1 atm, 25 �C) at a given time t (h) fitsthe following equation:
G ¼ Gm½1� expð�K 0G � tÞ� ð1Þ
where Gm is the maximum methane volume accumulated at an infi-nite digestion time; G is zero at t = 0 and the rate of gas productionbecomes zero at t equal to infinite. K 0G is an apparent kinetic con-stant for methane production (h�1) that includes biomassconcentration:
K 0G ¼ KG � X ð2Þ
where KG is the specific methane production kinetic constant (L/g VSS h) and X is the biomass concentration (g VSS/L), which re-mained relatively constant throughout the experiments (Table 3).
The K 0G and Gm values for each load were calculated numericallyfrom the experimental data obtained by non-linear regressionusing Sigma-Plot (version 11.0). Table 3 shows the Gm and K 0G val-ues and their standard deviations obtained in the experiments,which were always lower than 2% and 6%, respectively. This sug-gests that the proposed model adequately fits the experimentaldata for all the loads studied. Additionally, the theoretical valuesof maximum methane production (Gm) were calculated using Eq.

Load(g COD)0 1 2 3
mea
n r
' (m
L C
H4
/g V
SS
·h)
2
3
4
5
6teq
r 2 =0.9859TO
r'= 0.63·S + 3.03
Fig. 6. Mean of the maximum specific methane production kinetic with the initialsubstrate.
6320 J.A. Siles et al. / Bioresource Technology 101 (2010) 6315–6321
(1) and compared with their corresponding experimental values.The deviations obtained were lower than 5% in practically all cases;again suggesting that the proposed model can be used to accu-rately predict the behaviour of the process and that the kineticparameters obtained represent the behaviour of the micro-organ-isms affecting the anaerobic digestion of the glycerol and wastewa-ter mixture.
From the K 0G values, and once the biomass concentration valueswere determined, the values of the specific methane production ki-netic constant, KG, were calculated using Eq. (2). Table 3 also showsthese KG values. A marked decrease in the KG value was observedwhen the OLR was increased. The specific constant, KG, decreasedby 61.2%, which could be explained by the increasing load or theaccumulation of aluminium due to pre-treatment or even both ef-fects simultaneously. The effect of aluminium on anaerobic diges-tion was studied by Jackson-Moss and Duncan (1991). The abilityof methanogenic bacteria to adapt to high concentrations of alu-minium was investigated using a 9 L Upflow Anaerobic SludgeBlanket (UASB) reactor fed semi-continuously with a syntheticwaste containing glucose as the organic carbon source. They foundthat an influent concentration of 2500 mg/L Al3+ could be toleratedby acclimatised methanogenic bacteria. However, when the con-centration in the synthetic waste was increased further, the meth-anogens were inhibited, resulting in poorer digester performance.
In order to study if inhibition was due to the accumulation ofaluminium, the different loads were compared by defining the spe-cific methane production rate, r’ (mL CH4/g VSS h) based on Eq. (1),as the volume of methane generated per gram of volatile sus-pended solid and per hour for each set of experiments:
r0 ¼ 1X� dCH4
dt¼ Gm � KG � X � expð�KG � X � tÞ
X � t ð3Þ
From Eq. (3), the mean value of the specific methane productionrate, �r0, was calculated as follows:
�r0 ¼R t
0 r0dtR t
0 dt¼ Gm
t � X � ½1� expð�KG � X � tÞ� ð4Þ
Fig. 5 shows the evolution of �r0 according to load added andtime. As can be observed, the �r0 values, at equal times, are en-hanced when the substrate concentration is increased. Before theequilibrium methane production time, �r0 variation was non-linearwith the load. The �r0 values for the three loads added were calcu-lated at a higher time in order to reach the equilibrium at the high-
Load(g COD)
0 1 2 3
mea
n r'
(mL
CH
4 /g
VSS
·h)
0
2
4
6
8
10
12
14
16
1810 h15 h20 h25 h50 ht50 h
r2
=0.9975
TOr' 1.55·S - 0.18=
Fig. 5. Variation of the mean of the specific methane production rate with theinitial substrate and time.
est load (50 h). The linear fitting of (�r0, load) also shows anintersection point with the abscise axis which is different fromzero (0.12 g COD). This means that at substrate concentrationslower than the initial substrate concentration studied, methaneproduction is null since COD would be employed for the microbialmetabolism.
The minimum times required to reach the equilibrium for thedifferent loads were calculated from Fig. 4 and found to be 18,34 and 45 h. The �r0 values were obtained at these times and the lin-ear fitting of the (�r0, load) pair values were plotted, obtaining aslope of 0.63 mL CH4/(g VSS g COD h) as shown in Fig. 6. In fact,when the proportional ratio between �r0 and load were maintained,the methane production kinetic remained constant in the ORLrange studied. Hence, the accumulated aluminium concentrationdid not produce inhibition in the methane obtained.
4. Conclusions
The anaerobic co-digestion of glycerol and wastewater derivedfrom biodiesel manufacturing is a good alternative for treating andrevalorising both wastes. This mixture would reduce the cleanwater supply needed to dilute glycerol as well as the nutrientrequirements. Following the pre-treatment of glycerol by acidifi-cation and the electrocoagulation of the wastewater, the mixtureshowed a high level of anaerobic biodegradability (around 100%),permitting a substantial quantity of methane to be obtained(310 mL CH4/g CODremoved, at 1 atm and 25 �C). The methane pro-duction kinetic remained constant at 0.63 mL CH4/(g VSS g COD h)in the OLR range studied.
Acknowledgements
The authors are very grateful to the BIDA S.A. Factory (Fuentesde Andalucia, Seville, Spain) and the Spanish Ministry of Scienceand Innovation for funding José Ángel Siles López through ProjectCTM2005-01293 and Grant BES-2006-14074. This study was co-fi-nanced by the European Social Fund. We also wish to express ourgratitude to the laboratory technician Inmaculada Bellido Padillofor her help.
References
APHA (American Public Health Association), 1989. Standard Methods for theExamination of Water and Wastewater, 17th ed. Washington, DC, USA.

J.A. Siles et al. / Bioresource Technology 101 (2010) 6315–6321 6321
Balaguer, M.D., Vicent, M.T., Paris, J.M., 1992. Anaerobic fluidized bed reactor withsepiolite as support for anaerobic treatment of vinasses. Biotechnol. Lett. 14,433–438.
Berrios, M., Skelton, R.L., 2008. Comparison of purification methods for biodiesel.Chem. Eng. J. 144 (3), 459–465.
Borja, R., Martín, A., Alonso, V., García, C.J., Banks, C.J., 1995. Influence of differentpretreatments on the kinetics of anaerobic digestion of olive mill wastewater.Water Res. 29, 489–495.
Bolzonella, D., Pavan, P., Battistoni, P., Cecchi, F., 2006. Anaerobic co-digestion ofsludge with other organic wastes and phosphorus reclamation in wastewatertreatment plants for biological nutrients removal. Water Sci. Technol. 53 (8),177–186.
Calvo, L.S., Leclerc, J.P., Tanguy, G., Cames, M.C., Patemotte, G., Valentin, G., Rostan,A., Lapicque, F., 2003. An electrocoagulation unit for the purification of solubleoil wastes of high COD. Environ. Prog. 22 (1), 57–65.
Chatzisymeon, E., Dimou, A., Mantzavinos, D., Katsaounis, A., 2009. Electrochemicaloxidation of model compounds and olive mill wastewater over DSA electrodes:1. The case of Ti/IrO2 anode. J. Hazard. Mat. 167 (1–3), 268–274.
Chen, T.H., Hashimoto, A.G., 1996. Effects of pH and substrate:inoculum ratio onbatch methane fermentation. Bioresour. Technol. 56, 179–186.
Chen, Y., Cheng, J.J., Creamer, K.S., 2008. Inhibition of anaerobic digestion process: areview. Bioresour. Technol. 99, 4044–4064.
Emamjomeh, M.M., Sivakumar, M., 2009. Review of pollutants removed byelectrocoagulation and electrocoagulation/flotation processes. J. Environ.Manage. 90 (5), 1663–1679.
EN 14103. Fat and oil derivates. Fatty Acid Methyl Esters (FAME). Determination ofester and linolenic methyl ester contents.
EN 14104. Fat and oil derivates. Fatty Acid Methyl Esters (FAME). Determination ofacid value.
EN 14214. Automotive fuels – Fatty acid methyl esters (FAME) for diesel engines –Requirements and test methods. 2002.
Fannin, K.F., 1987. Start-up, operation, stability and control. In: Chynoweth, D.P.,Isaacson, R. (Eds.), Anaerobic digestion of biomass. Elsevier, London, pp. 171–196.
Field, J., Sierra, R., Lettinga, G., 1988. Ensayos anaerobios. In: Fdz.-Polanco, F., García,P.A., Hernando, S. (Eds.), 4 Seminario de Depuración Anaerobia de AguasResiduales. Secretariado de Publicaciones, Universidad de Valladolid, Valladolid,Spain, pp. 52–82.
Fouad, Y.O.A., Konsowa, A.H., Farag, H.A., Sedahmed, G.H., 2009. Performance of anelectrocoagulation cell with horizontally oriented electrodes in oil separationcompared to a cell with vertical electrodes. Chem. Eng. J. 145 (3), 436–440.
Galí, A., Benabdallah, T., Astals, S., Mata-Alvarez, J., 2009. Modified version of ADM1model for agro-waste application. Bioresour. Technol. 100, 2783–2790.
Gannouna, H., Bouallaguia, H., Okbia, A., Sayadib, S., Hamdia, M., 2009. Mesophilicand thermophilic anaerobic digestion of biologically pretreated abattoirwastewaters in an upflow anaerobic filter. J. Hazard. Mat. 170, 263–271.
Hanaki, K., O’Nagase, M., Matsuo, T., 1981. Mechanism of inhibition caused by long-chain fatty acids in anaerobic digestion process. Biotechnol. Bioeng. 23 (7),1591–1610.
Hazimah, A.H., Ooi, T.L., Salmiah, A., 2003. Recovery of glycerol and diglycerol fromglycerol pitch. J. Oil Palm. Res. 15, 1–5.
Ito, T., Nakashimada, Y., Senba, K., Matsui, T., Nishio, N., 2005. Hydrogen and ethanolproduction from glycerol-containing wastes discharged after biodieselmanufacturing process. J. Biosci. Bioeng. 100 (3), 260–265.
Jackson-Moss, C.A., Duncan, J.R., 1991. The effect of aluminium on anaerobicdigestion. Biotechnol. Lett. 13 (2), 143–148.
Lane, G., 1984. Laboratory-scale anaerobic digestion of fruit and vegetable solidwaste. Biomass. 5, 245–259.
Meyrath, J., Suchanek, G., 1972. Inoculation techniques-effects due to quality andquantity of inoculum. In: Norris, J.R., Ribbons, D.W. (Eds.), Methods inMicrobiology, vol 7B. Academic Press, New York (Chapter III).
Nallathambi Gunaseelan, V., 2009. Biomass estimates, characteristics, biochemicalmethane potential, kinetics and energy flow from Jatropha curcus on dry lands.Biomass. Bioen. 33 (4), 589–596.
Panizza, M., Cerisola, G., 2006. Olive mill wastewater treatment by anodic oxidationwith parallel plate electrodes. Water Res. 40 (6), 1179–1184.
Rodríguez, L., Villaseñor, J., Fernández, F.J., Buendía, I.M., 2006. Anaerobic Co-digestion of Biowastes Generated in Castilla-La Mancha (Spain): Batch Studies.Waste Management and the Environment III. WIT Press, Southampton, Boston.
Ruiz-Méndez, M.V., Marmesat, S., Liotta, A., Dobarganes, M.C., 2008. Analysis ofused frying fats for the production of biodiesel. Grasas y Aceites 59 (1), 45–50.
Sandun, F., Sushil, A., Kiran, K., Ranjitha, B., 2007. Glycerol based automotive fuelsfrom future biorefineries. Fuel 86 (17–18), 2806–2809.
Siles López, J.A., Martín Santos, M.A., Chica Pérez, A.F., Martín Martín, A., 2009.Anaerobic digestion of glycerol derived from biodiesel manufacturing.Bioresour. Technol. 100, 5609–5615.
Tezcan Un, U., Koparal, A.S., Bakir Ogutveren, U., 2009. Electrocoagulation ofvegetable oil refinery wastewater using aluminium electrodes. J. Environ.Manage. 90 (1), 428–433.
Wheatley, A., 1990. Anaerobic Digestion: A Waste Treatment Technology. Elsevier,London.
Yazdani, S.S., Gonzalez, R., 2007. Anaerobic fermentation of glycerol: a path toeconomic viability for the biofuels industry. Curr. Opin. Biotech. 18, 213–219.
Zhang, Y., Dubé, M.A., McLean, D.D., Kates, M., 2003. Biodiesel production fromwaste cooking oil: 1. Process design and technological assessment. Bioresour.Technol. 89, 1–16.