an unsupervised mva method to compare specific regions in
TRANSCRIPT

Analyst
PAPER
Cite this: Analyst, 2016, 141, 1947
Received 20th November 2015,Accepted 9th February 2016
DOI: 10.1039/c5an02406d
www.rsc.org/analyst
An unsupervised MVA method to compare specificregions in human breast tumor tissue samplesusing ToF-SIMS†
Blake M. Bluestein,a Fionnuala Morrish,b Daniel J. Graham,a Jamie Guenthoer,b
David Hockenbery,b Peggy L. Porterb and Lara J. Gamble*a
Imaging time-of-flight secondary ion mass spectrometry (ToF-SIMS) and principal component analysis
(PCA) were used to investigate two sets of pre- and post-chemotherapy human breast tumor tissue
sections to characterize lipids associated with tumor metabolic flexibility and response to treatment. The
micron spatial resolution imaging capability of ToF-SIMS provides a powerful approach to attain spatially-
resolved molecular and cellular data from cancerous tissues not available with conventional imaging tech-
niques. Three ca. 1 mm2 areas per tissue section were analyzed by stitching together 200 μm × 200 μmraster area scans. A method to isolate and analyze specific tissue regions of interest by utilizing PCA of
ToF-SIMS images is presented, which allowed separation of cellularized areas from stromal areas. These
PCA-generated regions of interest were then used as masks to reconstruct representative spectra from
specifically stromal or cellular regions. The advantage of this unsupervised selection method is a
reduction in scatter in the spectral PCA results when compared to analyzing all tissue areas or analyzing
areas highlighted by a pathologist. Utilizing this method, stromal and cellular regions of breast tissue
biopsies taken pre- versus post-chemotherapy demonstrate chemical separation using negatively-
charged ion species. In this sample set, the cellular regions were predominantly all cancer cells. Fatty
acids (i.e. palmitic, oleic, and stearic), monoacylglycerols, diacylglycerols and vitamin E profiles were dis-
tinctively different between the pre- and post-therapy tissues. These results validate a new unsupervised
method to isolate and interpret biochemically distinct regions in cancer tissues using imaging ToF-SIMS
data. In addition, the method developed here can provide a framework to compare a variety of tissue
samples using imaging ToF-SIMS, especially where there is section-to-section variability that makes it
difficult to use a serial hematoxylin and eosin (H&E) stained section to direct the SIMS analysis.
Introduction
Mass spectrometry imaging (MSI) is quickly emerging as a keyresearch tool in biological research areas such as neuro-science, drug delivery, and cancer.1–4 The combination of MSchemical and molecular specificity with imaging capabilitieshas provided a new perspective for biological sample analysisincluding localization and interactions of drugs in cells andtissues,5–9 proteomics,10,11 and lipidomics.12–14 Specifically,the MS imaging technique time-of-flight secondary ion massspectrometry (ToF-SIMS) is a label-free method with micronresolution imaging capabilities making it well suited for
imaging of cells,15,16 and key tissue regions.17,18 Utilizing themicron lateral resolution of SIMS can be crucial in the processof separating regions of interest within tumor microenviron-ments for cancer research. These microenvironments canregulate anticancer activities but can also promote cancerprogression and provide biological protection which limitstherapeutic efficacy and delivery.19 By combining micronresolution imaging with molecular information, it is possibleto observe and begin to interpret potential immune responserelated metabolic events that may associate with cancer pro-gression or regression within the tumor.
Breast cancer biopsies can vary in cellular density as well aspercent of cancer cell and stroma (connective tissue composedof fat and fibrous tissue) content. Pathological assessment istypically performed with histological staining to determine thelocation, type and grade of tumors, but does not always predictpatient outcome or response to chemotherapeutics.20–25
Stromal heterogeneity and tumor–stroma interactions provide†Electronic supplementary information (ESI) available. See DOI: 10.1039/c5an02406d
aUniversity of Washington, Dept. of Bioengineering, MolES Building, Box 351653,
Seattle, WA 98195-1653, USA. E-mail: [email protected] Hutchinson Cancer Research Center, Seattle, WA 98109, USA
This journal is © The Royal Society of Chemistry 2016 Analyst, 2016, 141, 1947–1957 | 1947
Ope
n A
cces
s A
rtic
le. P
ublis
hed
on 1
5 Fe
brua
ry 2
016.
Dow
nloa
ded
on 1
1/21
/202
1 1:
05:3
5 PM
. T
his
artic
le is
lice
nsed
und
er a
Cre
ativ
e C
omm
ons
Attr
ibut
ion-
Non
Com
mer
cial
3.0
Unp
orte
d L
icen
ce.
View Article OnlineView Journal | View Issue

prognostic indicators for invasive growth and metastasis.26–29
Previous studies indicate that stromal-cancer cell metaboliteinterchange aids tumor growth and progression.30,31 It ishypothesized that the stromal biochemical state may dictatesensitivity to chemotherapy.32 However, it is difficult to acquiremetabolic data specifically from cellular and stromal regions,as these regions can be difficult to isolate for metabolicprofiling due to the complexity of their spatial distribution.Separating out chemical information specifically from thestromal or cellular region can be useful to comparechemistries from different tissue areas that contain varyingamounts of these specific regions.
In this study, a combination of ToF-SIMS and multivariateimaging analysis techniques are used as an analytical tool toidentify chemical variation of specific cellular and stromalregions from breast cancer specimens and to compare thechemical variation between pre- and post-chemotherapy. Wedescribe different analysis methods to isolate and interpretmetabolic features of cancer cell regions within tissues includ-ing pathologist-driven selection of regions of interest (ROIs)using hematoxylin and eosin (H&E) stained tissue sections aswell as the use of an unsupervised imaging MVA method toseparate out stromal regions in the SIMS images. Hereinunsupervised refers both to the fact that principal componentanalysis (PCA) is an unsupervised MVA method (meaning noinput other than peak intensities are used), and to the factthat by using PCA to select ROIs we demonstrate that one canisolate cellular and stromal areas within breast tissue sectionsand reduce scatter within the resulting scores without introdu-cing human bias through hand-selected regions. This methodfurther provides improvement to isolate and analyze complexregions that consist of either cellular/tumor or stromal regionsthat cannot be selected by hand or the threshold of just onemass spectrometric image. The MVA method of PLS-DA hasbeen successfully used with InfraRed (IR) imaging data todiscern different regions in breast cancer tissue and identifytumor and non-tumor areas within a set of samples.33
However, to our knowledge, the method of using PCA to selectROIs for comparing different regions has not yet been appliedto ToF-SIMS imaging data. ToF-SIMS has been used previouslyto study diseased tissues and cells with a major focus onlipids,18,34–36 which are known to contribute to and also regu-late a range of metabolic and biochemical processes withincells. Furthermore, alteration in lipid metabolism is a hall-mark of carcinogenesis.37 The imaging data in this study isspecifically used to assess how lipid molecules relate to thedifferences found between tissue samples. One major distinc-tion, however, is that here we compare similar regions (e.g. cel-lular regions) of four different tissue samples to investigatechemical differences between untreated tumors and those thathave been exposed to chemotherapy treatments.33 In addition,the method developed here can provide a framework tocompare multiple tissue samples using imaging ToF-SIMSwhen there is difficulty using a region of interest marked on aserial (consecutive) section to direct the SIMS analysis due tosection-to-section variability. This novel approach utilizes the
high lateral resolution capability of imaging ToF-SIMS tocompare highly specific regions (e.g. just tumor cells) from onetissue to another and uses spectral PCA to highlight chemicaldifferences between those tissue specimens.
MethodsTissue sample preparation
Paired pre- and post-chemotherapy biopsy specimens wereobtained from patients consented according to institutionalreview board protocols. Both patients received standard pre-operative chemotherapy with doxorubicin at 60 mg m−2 IV andcyclophosphamide 600 mg m−2 IV on day 1 every 14 days for4 cycles and paclitaxel 80 mg m−2 IV weekly × 12 weeks. Thepatient with ‘Basal Like’ breast cancer received the paclitaxelfirst while the patient with Luminal A breast cancer receivedthe Doxorubicin and cyclophosphamide combination first, butthe order of therapy is known to not substantially affect treat-ment efficacy. Specimens were immediately embedded inTissue-Tek® (Fisher Scientific) optimum cutting temperature(OCT) compound, cryopreserved using liquid nitrogen andstored in a −80 °C freezer. Frozen tissue blocks were sectionedin a cryostat-microtome held at −23 °C at the Fred HutchinsonCancer Research Center (FHCRC). Each of the four tissuesamples was serially sectioned three times and each sectionwas ∼5 µm in thickness. The first and third sections werestained for optical imaging using hematoxylin and eosin(H&E), while the second section was analyzed by ToF-SIMS.The second slice of tissue was placed directly on a 2 cm2
silicon wafer that was previously cleaned with two successivesonications in dichloromethane, acetone, and methanol.38 Thesamples were then placed in a petri dish, sealed with Para-film® (VWR International), and transported to the Universityof Washington for immediate ToF-SIMS analysis. Each tissuewas sectioned on a different day and the time from tissuecutting to analysis was less than 90 minutes for any sample.
Gene expression subtype identification
Six to nine tissue sections were macrodissected to selectregions containing the highest proportion of invasive tumorcells to reduce contamination from non-tumor cells. RNA wasisolated using the AllPrep DNA/RNA Mini Kit (Qiagen Inc.,Valencia, CA) and gene/transcript expression was assessedusing the WG-DASL® (HumanHT-12 v4) Assay (Illumina, Inc.,San Diego, CA). Data processing and analysis were done in theR environment (v3.0.3). The raw expression data were pre-processed and median normalized using the Bioconductorlumi package,39 and gene expression intrinsic subtypes(Luminal A and Basal-like) were determined using the 50-genepanel described by Parker et al.40 with the software Bioconduc-tor genefu package.41
ToF-SIMS
ToF-SIMS experiments were performed using an ION-TOF TOF.SIMS 5-100 (ION-TOF GmbH, Münster, Germany) equipped
Paper Analyst
1948 | Analyst, 2016, 141, 1947–1957 This journal is © The Royal Society of Chemistry 2016
Ope
n A
cces
s A
rtic
le. P
ublis
hed
on 1
5 Fe
brua
ry 2
016.
Dow
nloa
ded
on 1
1/21
/202
1 1:
05:3
5 PM
. T
his
artic
le is
lice
nsed
und
er a
Cre
ativ
e C
omm
ons
Attr
ibut
ion-
Non
Com
mer
cial
3.0
Unp
orte
d L
icen
ce.
View Article Online

with a liquid metal ion gun (LMIG) for analysis and an elec-tron flood gun for charge neutralization. The LMIG was usedto generate a pulsed 25 keV Bi3
+ beam impacting the target atan angle of 45°. The Bi3
+ beam was set in spectroscopy modefor high mass resolution (HMR) to acquire spectra in bothpolarities and fast imaging mode to acquire high spatialresolution (HSR) negative polarity images. The Bi3
+ currentwas typically 0.13–0.15 pA for HMR and 0.05 pA for HSR.Target currents were measured before each data set using aFaraday cup. HSR mode ToF-SIMS images with micron spatialresolution were acquired and compared to features found inH&E images. Large area images of the entire tissue biopsywere created by manually stitching individual optical imagesof 800 µm × 800 µm from the video camera within theToF-SIMS before analysis of each tissue. These large opticalstitched images were then aligned to H&E images using thetissue borders to aid in selecting areas where analysis patcheswere to be acquired. For all data collection, HMR positive iondata was acquired followed immediately by HMR negative iondata on the same area. X and Y sample stage coordinates weresaved in the software to ensure data acquired was from thesame region in both polarities. HSR images were obtainedfrom each sample region after all HMR spectra werecompleted. In HMR mode, mass resolution (m/Δm) for theC2H3
+ ion was greater than 4500. Positive ion spectra werecalibrated to CH3
+, C2H3+, and C4H5
+. Negative ion spectrawere calibrated to CH−, OH−, and C2H
−. Spectra were acquiredfrom 1 mm × 1 mm or 1.6 mm × 0.6 mm “patches” comprisingof 25 or 24 200 µm × 200 µm “tiles” on each tissue, an exampleof positions is shown in Fig. 1. Each tile contains 256 × 256pixels, giving the patches a total pixel count of 1280 × 1280.Selecting to analyze three large patches rather than the entiretissue biopsy sample was chosen due to the time intensivenessrequired to analyze the samples. Long analysis times can leadto degradation of lipid signals or lipid migration.38,42 Thus,analyzing three patches results in a timely analysis, providing
the most relevant and reproducible data of the tissue’s nativechemical composition. The Bi3
+ dose was limited to ≤5.0 ×10¹¹ ions per cm2 for each tile in both positive and negativeion modes, resulting in a total Bi3
+ dose ≤1.0 × 10¹² ions percm2 per tile. SurfaceLab 6 software (ION-TOF GmbH, Münster,Germany) was used for all analyses.
Principal component analysis
Principal component analysis (PCA) was applied to ToF-SIMSimages acquired from the tissues using all pixels in the dataset (herein referred to as image data and displayed as images)and to summed spectral data from individual patches (hereinreferred to as spectral data and displayed as individual datapoints).
Data used in this study were pre-processed for PCA asfollows: (1) ToF-SIMS image data were Poisson scaled andmean centered, and (2) summed spectral data from individualtile images were normalized to the sum of the intensities of allof the peaks in the peak list, square-root transformed, andmean centered. Regions of exposed silicon substrate and OCT(e.g. holes or tears from cutting tissue and embeddingmedium surrounding tissue) were excluded from all analysesby applying a threshold to the pixels with a Si+ signal, wherem/z 27.9 was used to detect silicon and m/z 332.2 (C14H29
+, afragment of the benzalkonium additive in OCT)38 is used todetect OCT areas. All PCA was performed using the NBToolboxSpectraGUI and ImageGUI (Daniel Graham Ph.D., NESAC/BIO,University of Washington), that operate within MATLAB (Math-Works, Natick, MA). Peaks were chosen whose maximumintensity was twice or more than that of the average back-ground intensity. The spectra from all tissues were overlaidand then peaks were manually selected and integrated to fullwidth half max. All peaks below m/z 920 were selected, exclud-ing known salt, salt adducts, substrate and inorganic peaks. Atotal peak list of 846 and 807 peaks were chosen from the posi-tive and negative ion modes, respectively. All peaks in the listwere used for image PCA analysis while spectral PCA waslimited to peaks with m/z above 200 resulting in 391 and 329peaks for the positive and negative ions peak lists, respectively.
PCA, using the ImageGUI, is first applied to image data for-matted as .bif6 files from SurfaceLab 6. No peaks are excludedfrom this data except salts, substrate (Si and Si containingpeaks), and embedding medium (OCT). Normalization wasnot applied to imported image patches; image data were pre-processed by Poisson scaling and mean centering before PCA.
The presence of large fatty acid droplets, observed as welldefined high intensity areas of C16:1 (C16H29O2
−, palmitoleicacid, m/z 253.2),43,44 C16:0 (C16H31O2
−, palmitic acid, m/z255.2),44,45 C18:2 (C18H29O2
−, linoleic acid, m/z 279.2),44,46
C18:1 (C18H33O2−, oleic acid, m/z 281.2),44,45 and C18:0
(C18H35O2−, stearic acid, m/z 283.2),13,44,45,47 were occasionally
observed in different tissue sections. The strong signal fromthe fatty acid droplets would dominate PCA and the mainvariability between the samples would then be related to fattyacid droplets present in that particular tissue slice. Therefore,the fatty acid droplets were removed prior to PCA as manually
Fig. 1 (a) Chart of H&E stained images for pre and post chemotherapytreated tissues of luminal a type and basal-like from two patients (b) anincreased magnification optical H&E stained image of a selected analysisregion. (c) Summed CN− and CNO− ion image from the ToF-SIMS ana-lysis region corresponding to (b) showing the 25 200 × 200 µm tilescomprising of one stitched patch. White regions seen in the tissue slicescan indicate either tears or (most typically when round) fatty aciddroplets. All scale bars represent 1 mm.
Analyst Paper
This journal is © The Royal Society of Chemistry 2016 Analyst, 2016, 141, 1947–1957 | 1949
Ope
n A
cces
s A
rtic
le. P
ublis
hed
on 1
5 Fe
brua
ry 2
016.
Dow
nloa
ded
on 1
1/21
/202
1 1:
05:3
5 PM
. T
his
artic
le is
lice
nsed
und
er a
Cre
ativ
e C
omm
ons
Attr
ibut
ion-
Non
Com
mer
cial
3.0
Unp
orte
d L
icen
ce.
View Article Online

selected ROIs of the tissue image data, using the polyline func-tion within SurfaceLab 6, so sample comparison could befocused on specific tissue regions. Droplets were easily identi-fied in images as localized areas with characteristic fatty acidpeak intensities at least 5 times that of the fatty acids distribu-ted within the remaining tissue section. It is important to notethat breast tissue is a fatty tissue, therefore the prevalence offatty acid droplets within tissue sections can vary. Analysis ofother types of tissues (i.e. brain, heart, and liver) may or maynot contain these droplets.44,45,48,49 When analyzing chemicalvariances between patients or within one patient, includingthe fatty acid droplets present in breast tissue could cause mis-interpretation of the data due to the variability of droplet pres-ence (i.e. if there happened to be a droplet in that particularbiopsy sample and/or section).
Scores images that corresponded to cellular and stromalareas from serial H&E images were selected to be used asmasks. Using SurfaceLab 6, scores images were imported andspectra reconstructed by applying a 10% minimum, 90%maximum signal threshold to the pixels within the selectedscore image. The resulting data, in .bif6 format, were importedback into ImageGUI and the patch parsed into individual200 µm × 200 µm tiles, shown in Fig. 1, where each tile rep-resents one data point in the spectral PCA plots. The parseddata was then imported in .xlsx format into SpectraGUI forspectral analysis, where each individual tile represents onedata point in the PCA scores plots. Imported data were normal-ized to the sum of the intensities of all of the peaks in thepeak list, square-root transformed, and mean centered prior tospectral PCA.
Results and discussion
Paired pre- and post-chemotherapy tissue samples from twopatients were acquired for a total of four tissue samples. Thehematoxylin and eosin (H&E) stained sections for the fourtissue samples are shown in Fig. 1A and B. The hematoxylinstain, blue color, indicates the cellular nuclei while eosinstains the stromal or connective tissue in a lighter pink color.Three stitched patches (as described in Fig. 1) were taken pertissue for a total of 12 stitched patches. Each of the breastcancer specimens were classified into gene expression intrinsicsubtypes.40 The first pre/post-therapy specimen pair was classi-fied as a Luminal A breast cancer, characterized by havinggenetic expression patterns similar to the luminal epithelialcomponent of the normal breast.20,50 Generally, the Luminal Acancers are estrogen receptor (ER) and progesterone receptor(PgR) positive, and human epidermal growth factor receptor 2(HER2) negative with lower expression of proliferative genes.The second pre/post-therapy tissue pair was classified as aBasal-like breast cancer. The Basal-like subtype typically lacksexpression of ER, PgR, and shows low or no HER2 expression.Basal-like tumors are characterized by an expression patterncorresponding to that of the basal epithelial cells in the normalbreast and body and highly express proliferation genes.20,50
In order to ascertain chemical differences between pre- andpost-chemotherapy tissues, PCA was used to analyze ToF-SIMSspectral and image data. Three different methods are used toacquire information from different ROIs from different tissueslices. Specifically, (1) using the spectral data from all patcheswithin the region imaged from a given tissue, (2) using regionsindicated by pathologist on a H&E stained slice image and (3)using the spectral data from all patches after generating ROIsusing imaging PCA. The negative polarity ion data showed thebest correlation between the pre and post chemotherapy treat-ment samples and thus is used to compare the spectral PCAresults generated from the three different ROI methods. Thepositive ion PCA results did not show separation that corre-lated with pre- and post-chemotherapy treatment regardless ofthe method used. The positive polarity data are presented anddiscussed using the last method only.
MVA of all patches
As detailed in the methods section, each analysis patch wasseparated into individual tiles after removal of substrate,embedding medium, and large fatty acid deposits, followed bythe application of PCA. The spectral PCA results from the nega-tive ion polarity data with peaks above m/z 200 (key m/z values,deviations, and proposed biological molecule are shown in ESITable 1†) of the entire stitched patches (both pre and post forboth tissue types) are shown in Fig. 2. The lines above andbelow the data points indicate 95% confidence intervals. PC1data (not shown) indicates slight separation between tissuesfrom the two patients, rather than by pre- and post-therapypossibly identifying person-to-person chemical variation. InPC2, it is noticeable that the post-therapy tissues do indicate atrend with higher scores, which correspond to a high loadingvalue of fatty acid C16:0 (C16H31O2
−, palmitic acid, m/z 255.2),while the pre-therapy tissues trend with lower score values,corresponding to the strongest negative loading peak ofVitamin E (C29H49O2
−, m/z 429.3)46 and fatty acid C18:1(C18H33O2
−, oleic acid, m/z 281.2). Using the entire patch as aregion of interest, the scores exhibit a large spread betweenthe 95% confidence intervals signifying a high amount ofvariability within each patch as well as for different patcheswithin the tissue. It is possible that the large variability may bedue to comparison of the entire tissue areas rather than com-parison of specific tumor features within the analysis patch.
MVA analysis of H&E driven ROI selections
Due to the heterogeneity and complexity of the sample, asecond type of ROI selection was performed to focus on path-ologist-recommended regions, e.g. high density of cancer cells,from the serial H&E slice. These regions are outlined in lightblue in the H&E and black in the ToF-SIMS summed image ofCN− and CNO− (Fig. 3A and B), to provide a guide for a moreaccurate ToF-SIMS spectral comparison between cancer cellregions or “cancer cell nests” and stromal regions. Fig. S1†shows the pathologist-selected areas on the H&E images for allfour tissues.
Paper Analyst
1950 | Analyst, 2016, 141, 1947–1957 This journal is © The Royal Society of Chemistry 2016
Ope
n A
cces
s A
rtic
le. P
ublis
hed
on 1
5 Fe
brua
ry 2
016.
Dow
nloa
ded
on 1
1/21
/202
1 1:
05:3
5 PM
. T
his
artic
le is
lice
nsed
und
er a
Cre
ativ
e C
omm
ons
Attr
ibut
ion-
Non
Com
mer
cial
3.0
Unp
orte
d L
icen
ce.
View Article Online

It can be noted (in Fig. 3) that the H&E image of the tissuethat was examined by the pathologist is not identical to theToF-SIMS image. This is not surprising since there is at least a5 µm difference between these serial sections (including thesection thickness and frost buildup on the tissue sample priorto the slicing of the next section). In an effort to develop aminimally time consuming process, a rough estimate of thepathologist-selected areas were used, meaning that only tilesthat primarily corresponded with pathologist-selected areaswere selected for the analysis (Fig. 3C). The results using PCAon this more selective region of interest are shown in ESIFig. 2.† Comparing the method of a selective region to wholespot analysis (Fig. 2), it can be seen that the percentage of var-iance of PC2 as well as the loadings peaks look similar forboth types of ROI analyses. However, the scores separationbetween the pre- and post-therapy specimens from the Basal-like cancer are no longer observed while the pre and postspecimens from the Luminal A cancer now show a clearer sep-aration. While a hand drawn ROI to attempt to directly select
the regions selected by the pathologist may have slightlyimproved these results, the section-to-section variability notedduring the analysis likely plays the major role in incorrectlyselecting the ROIs on the ToF-SIMS image (since the regions ofinterest on the pathology section may not match those on theToF-SIMS section). For example, the image shown in Fig. 3 hasa large, obvious stromal feature (large pink region), whileother tissue slices such as the Basal-like post chemotherapytissue (ESI Fig. 1†) had very small, well separate regions thatwere difficult to correlate and identify on the ToF-SIMS image.This difference in separation could be due the following; (1)large stromal areas excluded by the pathologist in the Basal-like post-chemotherapy tissue, (2) small distributed cellularareas included by the pathologist within the Basal-like pre-chemotherapy tissue, (3) lowering the number of tiles used inPCA, and (4) larger cellular areas comprised of more tilesincluded by the pathologist within the Luminal A cancertissues.
Variations in serial tissue slices
Composition and localization of cellular areas within a tumorvary as you move serially through a tissue block. This variabil-ity increases the complexity of choosing the ToF-SIMS analysisregion of a tissue section by comparing to a region from aserial section. Fig. 4 illustrates an example of the heterogeneitybetween the three serial 5 µm sections. For accurate spotlocation on each section, images were aligned by overlay at thesame magnification and approximate spot location boxed. InFig. 4A and D, the initial H&E section reviewed by the patho-logist, a circular structure, noted by a black arrow, is presentwithin the 1 mm × 1 mm analysis area. It can also be seen that
Fig. 3 (a) An example of an analysis patch at higher magnification withpathologist selected areas on the H&E (blue) (b) pathologist selectedareas (black lines) projected onto sum ion image of CN− and CNO− (m/z26.0 and 42.0) (c) representative ion image of tiles removed, shown inblack, prior to PCA. All scale bars are 200 µm.
Fig. 2 (a) PC2 scores plot generated from whole patch data using the negative ions m/z 200. PC2 shows an overall variance of 13%. (b) PC2 load-ings displaying the chemical species that correspond to the whole patch scores. Pre-chemotherapeutic tissues shown as blue colored ○ and cyan ●,post-chemotherapeutic tissues shown as colored magenta □ and red ■. The lines above and below the data points indicate 95% confidenceintervals.
Analyst Paper
This journal is © The Royal Society of Chemistry 2016 Analyst, 2016, 141, 1947–1957 | 1951
Ope
n A
cces
s A
rtic
le. P
ublis
hed
on 1
5 Fe
brua
ry 2
016.
Dow
nloa
ded
on 1
1/21
/202
1 1:
05:3
5 PM
. T
his
artic
le is
lice
nsed
und
er a
Cre
ativ
e C
omm
ons
Attr
ibut
ion-
Non
Com
mer
cial
3.0
Unp
orte
d L
icen
ce.
View Article Online
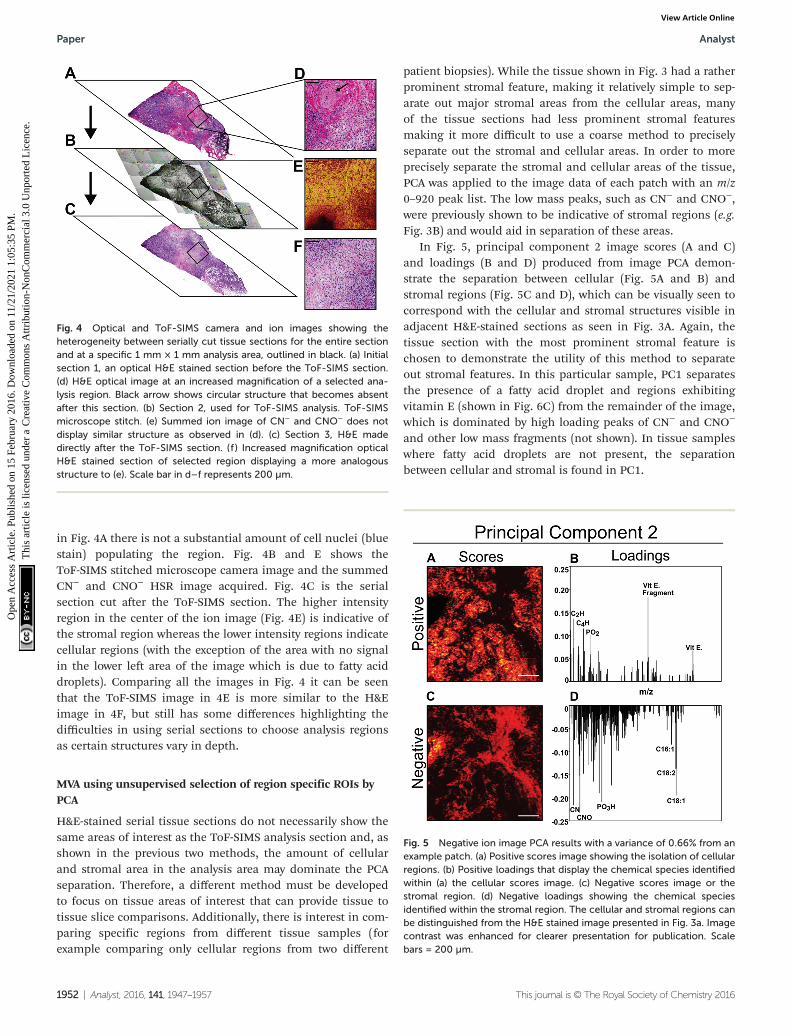
in Fig. 4A there is not a substantial amount of cell nuclei (bluestain) populating the region. Fig. 4B and E shows theToF-SIMS stitched microscope camera image and the summedCN− and CNO− HSR image acquired. Fig. 4C is the serialsection cut after the ToF-SIMS section. The higher intensityregion in the center of the ion image (Fig. 4E) is indicative ofthe stromal region whereas the lower intensity regions indicatecellular regions (with the exception of the area with no signalin the lower left area of the image which is due to fatty aciddroplets). Comparing all the images in Fig. 4 it can be seenthat the ToF-SIMS image in 4E is more similar to the H&Eimage in 4F, but still has some differences highlighting thedifficulties in using serial sections to choose analysis regionsas certain structures vary in depth.
MVA using unsupervised selection of region specific ROIs byPCA
H&E-stained serial tissue sections do not necessarily show thesame areas of interest as the ToF-SIMS analysis section and, asshown in the previous two methods, the amount of cellularand stromal area in the analysis area may dominate the PCAseparation. Therefore, a different method must be developedto focus on tissue areas of interest that can provide tissue totissue slice comparisons. Additionally, there is interest in com-paring specific regions from different tissue samples (forexample comparing only cellular regions from two different
patient biopsies). While the tissue shown in Fig. 3 had a ratherprominent stromal feature, making it relatively simple to sep-arate out major stromal areas from the cellular areas, manyof the tissue sections had less prominent stromal featuresmaking it more difficult to use a coarse method to preciselyseparate out the stromal and cellular areas. In order to moreprecisely separate the stromal and cellular areas of the tissue,PCA was applied to the image data of each patch with an m/z0–920 peak list. The low mass peaks, such as CN− and CNO−,were previously shown to be indicative of stromal regions (e.g.Fig. 3B) and would aid in separation of these areas.
In Fig. 5, principal component 2 image scores (A and C)and loadings (B and D) produced from image PCA demon-strate the separation between cellular (Fig. 5A and B) andstromal regions (Fig. 5C and D), which can be visually seen tocorrespond with the cellular and stromal structures visible inadjacent H&E-stained sections as seen in Fig. 3A. Again, thetissue section with the most prominent stromal feature ischosen to demonstrate the utility of this method to separateout stromal features. In this particular sample, PC1 separatesthe presence of a fatty acid droplet and regions exhibitingvitamin E (shown in Fig. 6C) from the remainder of the image,which is dominated by high loading peaks of CN− and CNO−
and other low mass fragments (not shown). In tissue sampleswhere fatty acid droplets are not present, the separationbetween cellular and stromal is found in PC1.
Fig. 4 Optical and ToF-SIMS camera and ion images showing theheterogeneity between serially cut tissue sections for the entire sectionand at a specific 1 mm × 1 mm analysis area, outlined in black. (a) Initialsection 1, an optical H&E stained section before the ToF-SIMS section.(d) H&E optical image at an increased magnification of a selected ana-lysis region. Black arrow shows circular structure that becomes absentafter this section. (b) Section 2, used for ToF-SIMS analysis. ToF-SIMSmicroscope stitch. (e) Summed ion image of CN− and CNO− does notdisplay similar structure as observed in (d). (c) Section 3, H&E madedirectly after the ToF-SIMS section. (f ) Increased magnification opticalH&E stained section of selected region displaying a more analogousstructure to (e). Scale bar in d–f represents 200 µm.
Fig. 5 Negative ion image PCA results with a variance of 0.66% from anexample patch. (a) Positive scores image showing the isolation of cellularregions. (b) Positive loadings that display the chemical species identifiedwithin (a) the cellular scores image. (c) Negative scores image or thestromal region. (d) Negative loadings showing the chemical speciesidentified within the stromal region. The cellular and stromal regions canbe distinguished from the H&E stained image presented in Fig. 3a. Imagecontrast was enhanced for clearer presentation for publication. Scalebars = 200 µm.
Paper Analyst
1952 | Analyst, 2016, 141, 1947–1957 This journal is © The Royal Society of Chemistry 2016
Ope
n A
cces
s A
rtic
le. P
ublis
hed
on 1
5 Fe
brua
ry 2
016.
Dow
nloa
ded
on 1
1/21
/202
1 1:
05:3
5 PM
. T
his
artic
le is
lice
nsed
und
er a
Cre
ativ
e C
omm
ons
Attr
ibut
ion-
Non
Com
mer
cial
3.0
Unp
orte
d L
icen
ce.
View Article Online

The PC2 loadings plot for this patch exhibit high negativeloadings for CN−, CNO−, and the fatty acids C18:2 (C18H29O2
−,linoleic acid, m/z 279.2) and C18:1 (C18H33O2
−, oleic acid, m/z281.2). These negative loading masses can be associated withthe negative PC2 scores image analogous to the stromal regionof the tissue. The high negative loading of the fatty acid peakscould be due to the fatty acid droplet located at the left edge ofthe patch, visible as a high intensity region in the negative PC2scores image. The composition of these fatty acid dropletregions, which appear as white (un-stained) ‘holes’ in thehistology image, are easily identified with ToF-SIMS imaging.Consistent trends generated by image PCA observed from theloadings plot show CN−, CNO−, and PO3H
− (m/z 79.9) loadingin the direction of the stromal region scores.
The positive loading masses can be associated with thepositive PC2 scores image, which is indicative of the cellularregions within the tissue sample. General trends observedwhile using image PCA indicated that cellular areas consist-ently had higher relative intensities of fragments related tovitamin E (C10H11O2
−, m/z 163.1 and C29H49O2−) and phos-
phoinositol (C9H16PO9−, m/z 299.05).51 Due to the section-to-
section variability in the samples, several cellular domainswere revealed in the imaging PCA analysis of the tissues thatwere not visible in the histology images.
The scores images that were representative of cellular andstromal areas were used to create an ROI threshold “mask”, toextract the imaging mass spectral information specificallyfrom stromal and cellular regions. Fig. 6 demonstrates theprocess used to create specific cellular and stromal ROIs usingthe image PCA scores as masks. First, the representative cellu-lar and stromal scores images are scaled to equal the samenumber of pixels acquired in the ToF-SIMS image (Fig. 6A andB). As previously discussed in the methods section, breasttissue is a fatty tissue and the presence of fatty acid droplets
may vary section-to-section and between patient specimens.When comparing the chemical variance between one patientor many, it is important that the data is not misinterpreted bythe presence or absence of fatty acid droplets in a particularspecimen. Before the mask is applied, fatty acid droplets mustbe removed from the scores image or the results from spectralPCA will be heavily influenced by their presence or absencewhen comparing sample chemistries. The droplet can be veri-fied by viewing the raw data images. Fatty acid droplets gener-ally separated from the tissue sample and are typically visiblein PC1 scores (Fig. 6C, white arrow). In order to remove thefatty acid droplets from these data sets, PC2 can be overlaidwith PC1 and the fatty acid droplet area can be subtractedfrom the PC2 scores image. Once the droplet area has beenremoved new cellular or stromal images can be generated.These new images can then be applied as ROI masks as pre-viously described. An example of completed masks are shownin teal in Fig. 6D and E.
After spectra were reconstructed using either the cellular orstromal ROI masks, the ROI patch areas were subjected to thesame process, parsing the patch into tiles for individual datapoints and followed by spectral PCA of the tiles as was done inthe previous datasets. Fig. 7 shows the resulting spectral PCAscores and corresponding loadings plots for PC2 of the re-constructed tiles of the cellular regions identified by imagePCA. The scores trends are similar to those seen in PC2 scoresof the pathologist-selected areas (ESI Fig. 2B†) as well as theanalysis of the entire patch (Fig. 2). As with the previous ana-lysis methods, the post-therapy tissues have positive scoresvalues and the pre-therapy tissues have negative scores.However, when data specifically from the cellular regions ofthe images are compared, the spread of the data between theconfidence intervals is reduced. The loadings plots for PC2 inFig. 2B and ESI Fig. 2B† are also similar to the loadings plotseen in Fig. 7B, where saturated fatty acids C16:0, C18:0(C18H35O2
−, stearic acid, m/z 283.2) and fragments of possiblesphingomyelin (C34H67NO6P
−, C36H69NO6P−, C38H76N2O6P
−,SM (34 : 1), m/z 616.5, 642.5, 687.6 respectively)44 have positiveloadings, while vitamin E and the unsaturated fatty acid C18:1load negatively, indicating different chemical profiles for cellu-lar regions within pre/post-therapy tissues. Key differences,however, include little to no contribution from PI fragments orC14. The PC1 vs. PC2 scores plot and corresponding loadingplots (Fig. 8) for the cellular specific ROIs shows both the sep-aration between pre- and post-chemotherapy tissues on PC2 aswell as some separation between the Basal-like subtype andLuminal A subtype tissues across PC1. There is large variabilityin the Luminal A pre-chemotherapy tumor tissue, where theconfidence interval slightly overlaps both post-chemotherapytissues. However, both the pre and post-chemotherapyLuminal tissues have largely negative scores on PC1, while theBasal-like tissues have largely positive scores. Phosphoinositolfragments (C6H1−PO8
−, m/z 241.01, and C6H12PO9−, m/z
259.02) and C18:0 trend with Luminal type tissues while C14:0(C14H27O2
−, m/z 227.2), C16:0, and C18:1 fragments arecorrelated with the Basal-like type tissues.
Fig. 6 Image PCA mask workflow. Using the scores images that isolatethe cellular (a) and stromal (b) areas and subtracting fatty acid (fa) dro-plets (c), if present within the sample, region specific threshold masks (dand e) can be generated. Images can then be reconstructed to containonly spectra representative of the (d) cellular or (e) stromal regions. Allscale bars are 200 µm.
Analyst Paper
This journal is © The Royal Society of Chemistry 2016 Analyst, 2016, 141, 1947–1957 | 1953
Ope
n A
cces
s A
rtic
le. P
ublis
hed
on 1
5 Fe
brua
ry 2
016.
Dow
nloa
ded
on 1
1/21
/202
1 1:
05:3
5 PM
. T
his
artic
le is
lice
nsed
und
er a
Cre
ativ
e C
omm
ons
Attr
ibut
ion-
Non
Com
mer
cial
3.0
Unp
orte
d L
icen
ce.
View Article Online
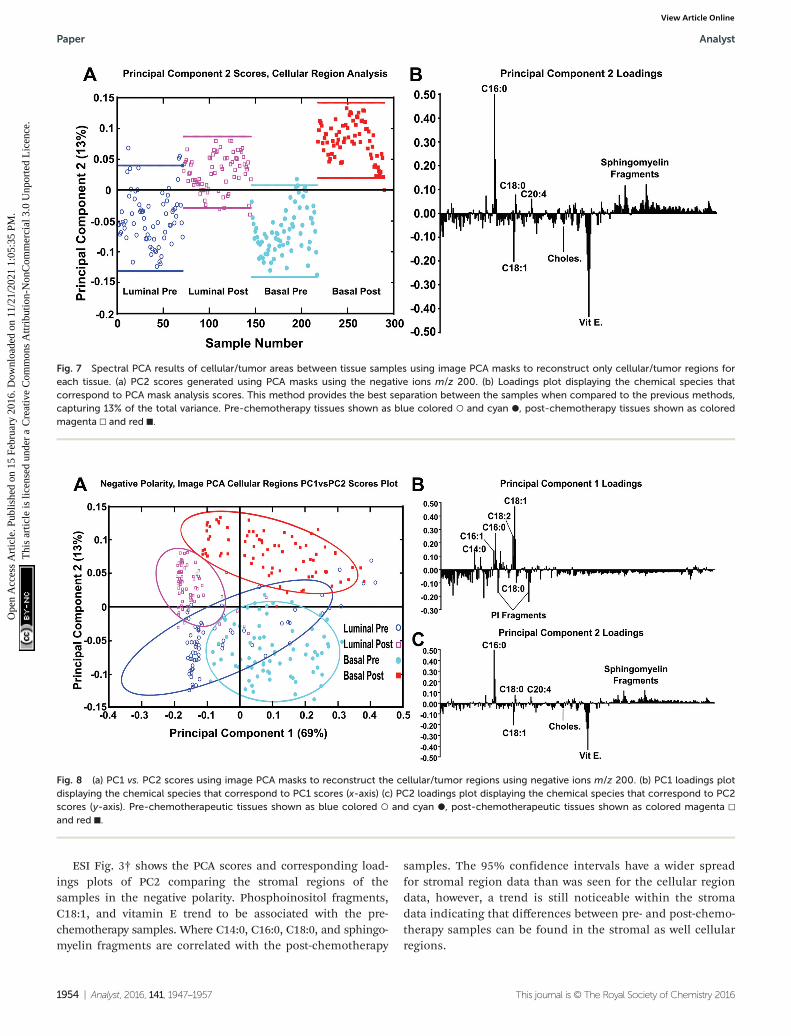
ESI Fig. 3† shows the PCA scores and corresponding load-ings plots of PC2 comparing the stromal regions of thesamples in the negative polarity. Phosphoinositol fragments,C18:1, and vitamin E trend to be associated with the pre-chemotherapy samples. Where C14:0, C16:0, C18:0, and sphingo-myelin fragments are correlated with the post-chemotherapy
samples. The 95% confidence intervals have a wider spreadfor stromal region data than was seen for the cellular regiondata, however, a trend is still noticeable within the stromadata indicating that differences between pre- and post-chemo-therapy samples can be found in the stromal as well cellularregions.
Fig. 8 (a) PC1 vs. PC2 scores using image PCA masks to reconstruct the cellular/tumor regions using negative ions m/z 200. (b) PC1 loadings plotdisplaying the chemical species that correspond to PC1 scores (x-axis) (c) PC2 loadings plot displaying the chemical species that correspond to PC2scores (y-axis). Pre-chemotherapeutic tissues shown as blue colored ○ and cyan ●, post-chemotherapeutic tissues shown as colored magenta □
and red ■.
Fig. 7 Spectral PCA results of cellular/tumor areas between tissue samples using image PCA masks to reconstruct only cellular/tumor regions foreach tissue. (a) PC2 scores generated using PCA masks using the negative ions m/z 200. (b) Loadings plot displaying the chemical species thatcorrespond to PCA mask analysis scores. This method provides the best separation between the samples when compared to the previous methods,capturing 13% of the total variance. Pre-chemotherapy tissues shown as blue colored ○ and cyan ●, post-chemotherapy tissues shown as coloredmagenta □ and red ■.
Paper Analyst
1954 | Analyst, 2016, 141, 1947–1957 This journal is © The Royal Society of Chemistry 2016
Ope
n A
cces
s A
rtic
le. P
ublis
hed
on 1
5 Fe
brua
ry 2
016.
Dow
nloa
ded
on 1
1/21
/202
1 1:
05:3
5 PM
. T
his
artic
le is
lice
nsed
und
er a
Cre
ativ
e C
omm
ons
Attr
ibut
ion-
Non
Com
mer
cial
3.0
Unp
orte
d L
icen
ce.
View Article Online
As was noted previously for ToF-SIMS investigation ofbreast cancer cells, the negative polarity ions provide theability to observe distributional changes of fatty acids andintact lipids, while the positive data has been shown toprovide the ability to observe changes in mono and diacyl-glycerides.47 While PCA analysis of the pre- and post-chemo-therapy tissues using negative polarity ions similarly shows atrend in the scores related to fatty acids and lipids, the positiveion data results in more overlap of the scores 95% confidenceintervals than found for the negative ion data. This is bestshown in ESI Fig. 4† where PC2 vs. PC4 scores and corres-ponding loadings are shown for the positive ion data. There isnear separation between the pre/post Basal-like samples inPC2, but separation between the Luminal A pre/post samplesis not observed until PC4. In summary, there does not appearto be a trend in the loadings peaks for the pre- and post-therapy tissues using positive ions, indicating that anychanges in the mono and diacylglyceride content as a result ofchemotherapy are not consistent across tissue types.
Conclusions
Current cancer research has indicated, primarily through geneexpression data, that specific microenvironments in breasttumors may provide signals and nutrients to promote cancercell survival and/or chemoresistance.27,28,52 However, due tothe heterogeneity of human breast cancer tissues, it remainsdifficult to acquire supportive metabolic data to aid in under-standing tumor growth and treatment efficacy. The regions ofinterest (ROIs) selected for such molecular characterizationrequire micron-level lateral resolution. Here we show thatimaging ToF-SIMS can be used to chemically identify distincttissue regions in tumors with high lateral resolution. In thiswork, we have presented an unsupervised methodology for iso-lating and analyzing specific tissue regions providing a way tocompare similar regions in multiple tissue slices. Theseresults demonstrate that the combination of imagingToF-SIMS and image principal component analysis (PCA) canbe used as an unsupervised method to select distinct ROIswithin tissues. Comparisons are made using the entire ana-lysis regions as well as hand-selected ROIs. When differenttissue samples are compared using imaging PCA-driven ROIsthere is less spread in the PCA scores. An advantage of usingthe imaging PCA-directed method is that it allows for likeregions to be compared in spectral PCA and thereby improveschemical separation when multiple tissue samples are com-pared. Here four different tissue sections from two differentpatients before and after chemotherapy were compared usingthe negative ion ToF-SIMS data and PCA-driven ROI selection.Trends are found for tissues breast cancer specimens that weretaken before chemotherapy treatment (pre) and those takenfrom the same patient after treatment (post). From the spec-tral PCA results it is seen that the unsaturated fatty acids C16:0and C18:0 and sphingomyelin correspond with the post-chemotherapy tissues. Deficiency of sphingomyelin is thought
to be related to the disruption of apoptosis in highly invasivecancer cells,53 therefore an increase in intensity in the post-treated samples compared to the pre-treated may correlatewith treatment response of the patient. C16:0 has been shownto generate apoptotic signals, some related to sphingolipids.54
Conversely, overexpression of fatty acid synthase in breastcancer, which is responsible for the synthesis of C16:0, hasbeen shown to contribute to drug resistance.55
Vitamin E and the unsaturated fatty acid C18:1 correspondwith the pre-chemotherapy tissues in the PCA analysis.Vitamin E may provide strong antioxidant protection of cancercells from lipid peroxidation, facilitating tumor growth whenin the presence of reactive oxygen species (ROS).56 That thevitamin E signal corresponds to the pre-treated and not thepost-treated tissues is consistent with several studies that haveshown that chemotherapy and radiation therapy are associatedwith increased formation of reactive oxygen species anddepletion of critical plasma and tissue antioxidants.57,58 TheC18:1 oleic acid is known to prevent cytotoxicity and decreasemitochondrial superoxide production induced by C16:0 palmi-tate.59 This provides a possible explanation for the trends seenwithin the pre-chemotherapy treated tissues for both C18:1and vitamin E. While these findings require further experi-mental investigation to gain a concrete understanding incancer biology, the results demonstrate the utility of PCA-driven ROI selection of ToF-SIMS data to compare metabolictrends of specific regions across multiple patients and tissuesections.
Acknowledgements
We would like to thank Kelly Wirtala at FHCRC for expert sec-tioning of tissue samples and helping with the development ofsample preparation protocols. We would also like to thankMichael Robinson for scientific discussions and data acqui-sition. We would also like to acknowledge our fundingsources: NESACBIO NIH P41 EB002027, SPORE NIH P50CA138293, and NSF-GRFP DGE-0718124/1256082.
References
1 F. Benabdellah, A. Seyer, L. Quinton, D. Touboul,A. Brunelle and O. Laprévote, Anal. Bioanal. Chem., 2009,396, 151–162.
2 L. A. McDonnell and R. M. Heeren, Mass Spectrom. Rev.,2007, 26, 606–643.
3 L. S. Eberlin, A. L. Dill, A. B. Costa, D. R. Ifa, L. Cheng,T. Masterson, M. Koch, T. L. Ratliff and R. G. Cooks, Anal.Chem., 2010, 82, 3430–3434.
4 R. Van de Plas, J. Yang, J. Spraggins and R. M. Caprioli,Nat. Methods, 2015, 12, 366–372.
5 S. S. Rubakhin, J. C. Jurchen, E. B. Monroe andJ. V. Sweedler, Drug Discovery Today, 2005, 10, 823–837.
Analyst Paper
This journal is © The Royal Society of Chemistry 2016 Analyst, 2016, 141, 1947–1957 | 1955
Ope
n A
cces
s A
rtic
le. P
ublis
hed
on 1
5 Fe
brua
ry 2
016.
Dow
nloa
ded
on 1
1/21
/202
1 1:
05:3
5 PM
. T
his
artic
le is
lice
nsed
und
er a
Cre
ativ
e C
omm
ons
Attr
ibut
ion-
Non
Com
mer
cial
3.0
Unp
orte
d L
icen
ce.
View Article Online

6 D. S. Cornett, S. L. Frappier and R. M. Caprioli, Anal.Chem., 2008, 80, 5648–5653.
7 M. K. Passarelli, C. F. Newman, P. S. Marshall, A. West,I. S. Gilmore, J. Bunch, M. R. Alexander and C. T. Dollery,Anal. Chem., 2015, 87, 6696–6702.
8 J. M. Wiseman, D. R. Ifa, Y. X. Zhu, C. B. Kissinger,N. E. Manicke, P. T. Kissinger and R. G. Cooks, Proc. Natl.Acad. Sci. U. S. A., 2008, 105, 18120–18125.
9 B. Prideaux and M. Stoeckli, J. Proteomics, 2012, 75, 4999–5013.
10 E. H. Seeley and R. M. Caprioli, Proc. Natl. Acad. Sci. U. S.A., 2008, 105, 18126–18131.
11 H. Nygren and P. Malmberg, Proteomics, 2010, 10, 1694–1698.12 N. Goto-Inoue, T. Hayasaka, N. Zaima and M. Setou,
Biochim. Biophys. Acta, 2011, 1811, 961–969.13 M. K. Passarelli and N. Winograd, Biochim. Biophys. Acta,
2011, 1811, 976–990.14 L. S. Eberlin, A. L. Dill, A. B. Costa, D. R. Ifa, L. Cheng,
T. Masterson, M. Koch, T. L. Ratliff and R. G. Cooks, Anal.Chem., 2010, 82, 3430–3434.
15 J. Brison, M. A. Robinson, D. S. Benoit, S. Muramoto,P. S. Stayton and D. G. Castner, Anal. Chem., 2013, 85,10869–10877.
16 M. A. Robinson, D. J. Graham and D. G. Castner, Anal.Chem., 2012, 84, 4880–4885.
17 J. W. Park, H. Jeong, B. Kang, S. J. Kim, S. Y. Park, S. Kang,H. K. Kim, J. S. Choi, D. Hwang and T. G. Lee, Sci. Rep.,2015, 5, 11077.
18 B. Cillero-Pastor, G. Eijkel, A. Kiss, F. J. Blanco andR. M. Heeren, Anal. Chem., 2012, 84, 8909–8916.
19 M. R. Junttila and F. J. de Sauvage, Nature, 2013, 501, 346–354.20 C. M. Perou, T. Sorlie, M. B. Eisen, M. van de Rijn,
S. S. Jeffrey, C. A. Rees, J. R. Pollack, D. T. Ross, H. Johnsen,L. A. Akslen, O. Fluge, A. Pergamenschikov, C. Williams,S. X. Zhu, P. E. Lonning, A. L. Borresen-Dale, P. O. Brownand D. Botstein, Nature, 2000, 406, 747–752.
21 T. Sorlie, C. M. Perou, R. Tibshirani, T. Aas, S. Geisler,H. Johnsen, T. Hastie, M. B. Eisen, M. van de Rijn,S. S. Jeffrey, T. Thorsen, H. Quist, J. C. Matese, P. O. Brown,D. Botstein, P. E. Lonning and A. L. Borresen-Dale, Proc.Natl. Acad. Sci. U. S. A., 2001, 98, 10869–10874.
22 S. Badve, D. J. Dabbs, S. J. Schnitt, F. L. Baehner, T. Decker,V. Eusebi, S. B. Fox, S. Ichihara, J. Jacquemier,S. R. Lakhani, J. Palacios, E. A. Rakha, A. L. Richardson,F. C. Schmitt, P. H. Tan, G. M. Tse, B. Weigelt, I. O. Ellisand J. S. Reis-Filho, Mod. Pathol., 2011, 24, 157–167.
23 K. R. Bauer, M. Brown, R. D. Cress, C. A. Parise andV. Caggiano, Cancer, 2007, 109, 1721–1728.
24 B. Weigelt and J. S. Reis-Filho, Nat. Rev. Clin. Oncol., 2009,6, 718–730.
25 M. L. Doria, C. Z. Cotrim, C. Simoes, B. Macedo,P. Domingues, M. R. Domingues and L. A. Helguero, J. Cell.Physiol., 2013, 228, 457–468.
26 A. H. Beck, A. R. Sangoi, S. Leung, R. J. Marinelli,T. O. Nielsen, M. J. van de Vijver, R. B. West, M. van de Rijnand D. Koller, Sci. Transl. Med., 2011, 3, 108ra113.
27 Y. Mao, E. T. Keller, D. H. Garfield, K. Shen and J. Wang,Cancer Metastasis Rev., 2013, 32, 303–315.
28 J. A. Joyce and J. W. Pollard, Nat. Rev. Cancer, 2009, 9, 239–252.
29 M. Egeblad, E. S. Nakasone and Z. Werb, Dev. Cell, 2010,18, 884–901.
30 U. E. Martinez-Outschoorn, R. M. Balliet,D. B. Rivadeneira, B. Chiavarina, S. Pavlides, C. Wang,D. Whitaker-Menezes, K. M. Daumer, Z. Lin,A. K. Witkiewicz, N. Flomenberg, A. Howell, R. G. Pestell,E. S. Knudsen, F. Sotgia and M. P. Lisanti, Cell Cycle, 2010,9, 3256–3276.
31 G. Bonuccelli, A. Tsirigos, D. Whitaker-Menezes,S. Pavlides, R. G. Pestell, B. Chiavarina, P. G. Frank,N. Flomenberg, A. Howell, U. E. Martinez-Outschoorn,F. Sotgia and M. P. Lisanti, Cell Cycle, 2010, 9, 3506–3514.
32 P. Farmer, H. Bonnefoi, P. Anderle, D. Cameron,P. Wirapati, V. Becette, S. Andre, M. Piccart, M. Campone,E. Brain, G. Macgrogan, T. Petit, J. Jassem, F. Bibeau,E. Blot, J. Bogaerts, M. Aguet, J. Bergh, R. Iggo andM. Delorenzi, Nat. Med., 2009, 15, 68–74.
33 M. Verdonck, A. Denayer, B. Delvaux, S. Garaud, R. DeWind, C. Desmedt, C. Sotiriou, K. Willard-Gallo andE. Goormaghtigh, Analyst, 2016, 141, 606–619.
34 N. Tahallah, A. Brunelle, S. De La Porte and O. Laprevote, J.Lipid Res., 2008, 49, 438–454.
35 Y. K. Magnusson, P. Friberg, P. Sjovall, J. Malm andY. Chen, Obesity, 2008, 16, 2745–2753.
36 M. J. Baker, E. Gazi, M. D. Brown, N. W. Clarke,J. C. Vickerman and N. P. Lockyer, Appl. Surf. Sci., 2008,255, 1084–1087.
37 C. R. Santos and A. Schulze, FEBS J., 2012, 279, 2610–2623.38 L. J. Gamble, D. J. Graham, B. Bluestein, N. P. Whitehead,
D. Hockenbery, F. Morrish and P. Porter, Biointerphases,2015, 10, 019008.
39 P. Du, W. A. Kibbe and S. M. Lin, Bioinformatics, 2008, 24,1547–1548.
40 J. S. Parker, M. Mullins, M. C. Cheang, S. Leung, D. Voduc,T. Vickery, S. Davies, C. Fauron, X. He, Z. Hu,J. F. Quackenbush, I. J. Stijleman, J. Palazzo, J. S. Marron,A. B. Nobel, E. Mardis, T. O. Nielsen, M. J. Ellis,C. M. Perou and P. S. Bernard, J. Clin. Oncol., 2009, 27,1160–1167.
41 D. M. Gendoo, N. Ratanasirigulchai, M. S. Schroder,L. Pare, J. S. Parker, A. Prat and B. Haibe-Kains, genefu:Computation of Gene Expression-Based Signatures inBreast Cancer. R package version 2.3.2, 2015, http://www.pmgenomics.ca/bhklab/software/genefu.
42 P. Sjövall, B. Johansson and J. Lausmaa, Appl. Surf. Sci.,2006, 252, 6966–6974.
43 P. Malmberg, H. Nygren, K. Richter, Y. Chen, F. Dangardt,P. Friberg and Y. Magnusson, Microsc. Res. Tech., 2007, 70,828–835.
44 D. Debois, M. P. Bralet, F. Le Naour, A. Brunelle andO. Laprevote, Anal. Chem., 2009, 81, 2823–2831.
Paper Analyst
1956 | Analyst, 2016, 141, 1947–1957 This journal is © The Royal Society of Chemistry 2016
Ope
n A
cces
s A
rtic
le. P
ublis
hed
on 1
5 Fe
brua
ry 2
016.
Dow
nloa
ded
on 1
1/21
/202
1 1:
05:3
5 PM
. T
his
artic
le is
lice
nsed
und
er a
Cre
ativ
e C
omm
ons
Attr
ibut
ion-
Non
Com
mer
cial
3.0
Unp
orte
d L
icen
ce.
View Article Online
45 Y. Magnusson, P. Friberg, P. Sjovall, F. Dangardt,P. Malmberg and Y. Chen, Clin. Physiol. Funct. Imaging,2008, 28, 202–209.
46 D. Touboul, A. Brunelle, F. Halgand, S. De La Porte andO. Laprevote, J. Lipid Res., 2005, 46, 1388–1395.
47 M. A. Robinson, D. J. Graham, F. Morrish, D. Hockenberyand L. J. Gamble, Biointerphases, 2015, 11, 02A303.
48 P. Sjovall, J. Lausmaa and B. Johansson, Anal. Chem., 2004,76, 4271–4278.
49 P. Malmberg, K. Borner, Y. Chen, P. Friberg, B. Hagenhoff,J. E. Mansson and H. Nygren, Biochim. Biophys. Acta, 2007,1771, 185–195.
50 J. D. Brenton, L. A. Carey, A. A. Ahmed and C. Caldas,J. Clin. Oncol., 2005, 23, 7350–7360.
51 M. L. Heien, P. D. Piehowski, N. Winograd andA. G. Ewing, in Mass Spectrometry Imaging, Springer, 2010,pp. 85–97.
52 G. Kroemer and J. Pouyssegur, Cancer Cell, 2008, 13, 472–482.
53 S. Wang, X. Chen, H. Luan, D. Gao, S. Lin, Z. Cai, J. Liu,H. Liu and Y. Jiang, Rapid Commun. Mass Spectrom., 2016,30, 533–542.
54 A. Kourtidis, R. Srinivasaiah, R. D. Carkner, M. J. Brosnan andD. S. Conklin, Breast Cancer Res. Treat., 2009, 11, R16–R16.
55 H. Liu, Y. Liu and J.-T. Zhang, Mol. Cancer Ther., 2008, 7,263–270.
56 Y. Ni and C. Eng, Clin. Cancer Res., 2012, 18, 4954–4961.57 N. Weijl, F. Cleton and S. Osanto, Cancer Treat. Rev., 1997,
23, 209–240.58 E. J. Ladas, J. S. Jacobson, D. D. Kennedy, K. Teel,
A. Fleischauer and K. M. Kelly, J. Clin. Oncol., 2004, 22,517–528.
59 B. Kwon, H.-K. Lee and H. W. Querfurth, Biochim. Biophys.Acta, Mol. Cell Res., 2014, 1843, 1402–1413.
Analyst Paper
This journal is © The Royal Society of Chemistry 2016 Analyst, 2016, 141, 1947–1957 | 1957
Ope
n A
cces
s A
rtic
le. P
ublis
hed
on 1
5 Fe
brua
ry 2
016.
Dow
nloa
ded
on 1
1/21
/202
1 1:
05:3
5 PM
. T
his
artic
le is
lice
nsed
und
er a
Cre
ativ
e C
omm
ons
Attr
ibut
ion-
Non
Com
mer
cial
3.0
Unp
orte
d L
icen
ce.
View Article Online