an overview of the north atlantic oscillation - cgd scientific research on the nao is rich, ... of...
TRANSCRIPT

An Overview of the North Atlantic Oscillation
James W. Hurrell1, Yochanan Kushnir2, Geir Ottersen3, and Martin Visbeck2
The North Atlantic Oscillation (NAO) is one of the most prominent and recur-rent patterns of atmospheric circulation variability. It dictates climate variabilityfrom the eastern seaboard of the United States to Siberia and from the Arctic to thesubtropical Atlantic, especially during boreal winter, so variations in the NAO areimportant to society and for the environment. Understanding the processes thatgovern this variability is, therefore, of high priority, especially in the context ofglobal climate change. This review, aimed at a scientifically diverse audience, pro-vides general background material for the other chapters in the monograph, and itsynthesizes some of their central points. It begins with a description of the spatialstructure of climate and climate variability, including how the NAO relates toother prominent patterns of atmospheric circulation variability. There is no uniqueway to define the spatial structure of the NAO, or thus its temporal evolution, butseveral common approaches are illustrated. The relationship between the NAOand variations in surface temperature, storms and precipitation, and thus the econ-omy, as well as the ocean and ecosystem responses to NAO variability, aredescribed. Although the NAO is a mode of variability internal to the atmosphere,indices of it exhibit decadal variability and trends. That not all of its variability canbe attributed to intraseasonal stochastic atmospheric processes points to a role forexternal forcings and, perhaps, a small but useful amount of predictability. Thesurface, stratospheric and anthropogenic processes that may influence the phaseand amplitude of the NAO are reviewed.
1
1. INTRODUCTION
Over the middle and high latitudes of the NorthernHemisphere (NH), especially during the cold season months(November-April), the most prominent and recurrent patternof atmospheric variability is the North Atlantic Oscillation(NAO). The NAO refers to a redistribution of atmosphericmass between the Arctic and the subtropical Atlantic, andswings from one phase to another produce large changes in
the mean wind speed and direction over the Atlantic, theheat and moisture transport between the Atlantic and theneighboring continents, and the intensity and number ofstorms, their paths, and their weather. Agricultural harvests,water management, energy supply and demand, and yieldsfrom fisheries, among many other things, are directly affect-ed by the NAO. Yet, despite this pronounced influence,many open issues remain about which climate processesgovern NAO variability, how the phenomenon has varied inthe past or will vary in the future, and whether it is at all pre-dictable. These and other topics are dealt with in detail in thefollowing chapters. Our intent is to provide general back-ground material for these chapters, as well as synthesizesome of the central points made by other authors.
The NAO is one of the oldest known world weather pat-terns, as some of the earliest descriptions of it were fromseafaring Scandinavians several centuries ago. The historyof scientific research on the NAO is rich, and Stephenson etal. [this volume] present a stimulating account of the majorscientific landmarks of NAO research through time. Theyalso note that, today, there is considerable renewed interest
_______________1National Center for Atmospheric Research, Boulder, Colorado2Lamont-Doherty Earth Observatory, Columbia University,
Palisades, New York3Institute of Marine Research, Bergen, Norway. Current
address: Department of Biology, Division of Zoology, Universityof Oslo, Oslo, Norway
The North Atlantic Oscillation:Climatic Significance and Environmental ImpactGeophysical Monograph 134Copyright 2003 by the American Geophysical Union10.1029/134GM01

2 OVERVIEW OF THE NAO
in the phenomenon. The NAO and its time dependence, forinstance, appear central to the global change debate. Surfacetemperatures over the NH are likely warmer now than at anyother time over the past millennium [Mann et al., 1999;Jones et al., 2001], and the rate of warming has been espe-cially high (~ 0.15°C decade-1) over the past 40 years or so[Folland et al., 2001; Hansen et al., 2002]. A substantialfraction of this most recent warming is linked to the behav-ior of the NAO [Hurrell, 1996; Thompson et al., 2000; alsosection 5.1], in particular a trend in its index from largeamplitude anomalies of one phase in the 1960s to largeamplitude anomalies of the opposite phase since the early1980s. This change in the atmospheric circulation of theNorth Atlantic accounts for several other remarkable alter-ations in weather and climate over the extratropical NH aswell, and it has added considerably to the debate over ourability to detect and distinguish between natural and anthro-pogenic climate change. Improved understanding of therelationship between the NAO and anthropogenic climatechange has emerged as a key goal of modern climateresearch [Gillett et al., this volume]. It has also made it crit-ical to better understand how the NAO and its influence onsurface climate has varied naturally in the past, either asmeasured from long instrumental records [Jones et al., thisvolume] or estimated through multi-century multi-proxyreconstructions [Cook, this volume].
While it has long been recognized that the North AtlanticOcean varies appreciably with the overlying atmosphere[Bjerknes, 1964], another reason for invigorated interest inthe NAO is that the richly complex and differential respons-es of the surface-, intermediate- and deep-layers of the oceanto NAO forcing are becoming better documented and under-stood [Visbeck et al., this volume]. The intensity of winter-time convective renewal of intermediate and deep waters inthe Labrador Sea and the Greenland-Iceland-Norwegian(GIN) Seas, for instance, is not only characterized by largeinterannual variability, but also by interdecadal variationsthat appear to be synchronized with fluctuations in the NAO[e.g., Dickson et al., 1996]. These changes in turn affect thestrength and character of the Atlantic thermohaline circula-tion (THC) and the horizontal flow of the upper ocean,thereby altering the oceanic poleward heat transport and thedistribution of sea surface temperature (SST).
On seasonal time scales, the upper North Atlantic Oceanvaries primarily in response to changes in the surface winds,air-sea heat exchanges and freshwater fluxes associated withNAO variations [Cayan, 1992a,b]. This does not mean,however, that the extratropical interaction is only one-way.The dominant influence of the ocean on the overlyingatmosphere is to reduce the thermal damping of atmospher-ic variations, and this influence becomes greater on longer
time scales. The extent to which the influence of the oceanextends beyond this local thermodynamic coupling to affectthe evolution and dynamical properties of the atmosphericflow is probably small, but the effect is non-zero [Robinson,2000; Kushnir et al., 2002]. The role of ocean-atmospherecoupling in determining the overall variability of the NAOis, therefore, a topic of much interest and ongoing research[Czaja et al., this volume].
That the ocean may play an active role in determining theevolution of the NAO is also one pathway by which somelimited predictability might exist [Rodwell, this volume].New statistical analyses have revealed patterns in NorthAtlantic SSTs that precede specific phases of the NAO byup to 9 months, a link that likely involves the remarkabletendency of the extratropical ocean to preserve its thermalstate throughout the year [Kushnir et al., 2002]. On longertime scales, recent modeling evidence suggests that theNAO responds to slow changes in global ocean tempera-tures, with changes in the equatorial regions playing a cen-tral role [Hoerling et al., 2001].
A second pathway that offers hope for improved pre-dictability of the NAO involves links through whichchanges in stratospheric wind patterns might exert somedownward control on surface climate [Thompson et al.,this volume]. A statistical connection between the month-to-month variability of the NH stratospheric polar vortexand the tropospheric NAO was established several yearsago [e.g., Perlwitz and Graf, 1995], and more recently ithas been documented that large amplitude anomalies inthe wintertime stratospheric winds precede anomalousbehavior of the NAO by 1-2 weeks [Baldwin andDunkerton, 2001], perhaps providing some useful extend-ed-range predictability. The mechanisms are not entirelyclear, but likely involve the effect of the stratospheric flowon the refraction of planetary waves dispersing upwardsfrom the troposphere [e.g., Hartmann et al., 2000].Similarly, processes that affect the stratospheric circula-tion on longer time scales, such as reductions in stratos-pheric ozone and increases in greenhouse gases, could fac-tor into the trend in Atlantic surface climate observed overthe past several decades [Gillett et al., this volume].Regardless of whether predictability arises from the influ-ence of the ocean or from processes internal to the atmos-phere, the salient point is that relatively little attention waspaid to the NAO, until recently, because changes in itsphase and amplitude from one winter to the next were con-sidered unpredictable. The possibility that a small, butuseful, percentage of NAO variance is predictable hasmotivated considerable recent research.
Finally, renewed interest in the NAO has come from thebiological community. Variations in climate have a profound

HURRELL ET AL. 3
influence on a variety of ecological processes and, conse-quently, patterns of species abundance and dynamics.Fluctuations in temperature and salinity, vertical mixing, cir-culation patterns and ice formation of the North AtlanticOcean induced by variations in the NAO [Visbeck et al., thisvolume] have a demonstrated influence on marine biologyand fish stocks through both direct and indirect pathways[Drinkwater et al., this volume]. This includes not onlylonger-term changes associated with interdecadal NAO vari-ability, but interannual signals as well. Responses of terrestri-al ecosystems to NAO fluctuations have also been docu-mented [Mysterud et al., this volume]. In parts of Europe, forexample, many plant species have been blooming earlier andlonger because of increasingly warm and wet winters, andvariations in the NAO are also significantly correlated withthe growth, development, fertility and demographic trends ofmany land animals. The NAO has a demonstrated influenceon the physics, hydrology, chemistry and biology of freshwa-ter ecosystems across the NH as well [Straile et al., this vol-ume]. Increasing awareness among and interactions betweenbiologists and climate scientists will undoubtedly further ourinsights into the critical issue of the response of ecosystemsto climate variability and climate change, and mutual interestin the NAO as a dominant source of climate variability isserving as an impetus for this interdisciplinary research.
For many reasons, then, there is broad and growinginterest in the NAO. Improved understanding of the phys-ical mechanisms that govern the NAO and its intraseason-al-to-interdecadal variability, and how modes of naturalvariability such as the NAO may be influenced by anthro-pogenic climate change, are research questions of criticalimportance. Setting the stage for the following moredetailed review chapters, we begin with a description ofthe spatial structure of climate and climate variability,including a brief discussion of how the NAO is definedand how it relates to other, prominent patterns of atmos-pheric circulation variability. The impacts of the NAO onsurface temperature, precipitation, storms, the underlyingocean and sea ice, and the local ecology are also brieflydescribed, as are the mechanisms that most likely governNAO variability. We conclude by expressing our thoughtson outstanding issues and future challenges.
2. THE SPATIAL STRUCTURE OF CLIMATE AND CLIMATE VARIABILITY
Climate variability is usually characterized in terms of“anomalies”, where an anomaly is the difference betweenthe instantaneous state of the climate system and the clima-tology (the mean state computed over many years represen-tative of the era under consideration). Since the spatial struc-
ture of climate variability in the extratropics is strongly sea-sonally dependent [Wallace et al., 1993], it is useful tobriefly examine the seasonal evolution of the mean stateupon which the climate variations are superimposed.
2.1. The Mean State and Planetary Waves
Large changes in the mean distribution of sea level pres-sure (SLP) over the NH are evident from boreal winter(December-February) to boreal summer (June-August,Figure 1). Perhaps most noticeable are those changes overthe Asian continent related to the development of theSiberian anticyclone during winter and the monsooncyclone over Southeast Asia during summer. Over thenorthern oceans, subtropical anticyclones dominate duringsummer, with the Azores high-pressure system coveringnearly all of the North Atlantic. These anticyclones weakenand move equatorward by winter, when the high-latitudeAleutian and Icelandic low-pressure centers predominate.
Because air flows counterclockwise around low pressureand clockwise around high pressure in the NH, westerlyflow across the middle latitudes of the Atlantic sectoroccurs throughout the year. The vigor of the flow is relat-ed to the meridional pressure gradient, so the surfacewinds are strongest during winter when they average near5 m s-1 from the eastern United States across the Atlanticonto northern Europe (Figure 2). These middle latitudewesterlies extend throughout the troposphere and reachtheir maximum (up to 40 m s-1) at a height of about 12 km.This “jet stream” roughly coincides with the path of storms(atmospheric disturbances operating on time scales ofdays) traveling between North America and Europe. Overthe subtropical Atlantic the prevailing surface northeaster-ly trade winds are relatively steady but strongest duringboreal summer.
In the middle troposphere (~ 5-6 km), the boreal wintermap of the geopotential height field reveals a westward tiltwith elevation of the high latitude surface cyclones and anti-cyclones (Figure 3). There is a clear “wavenumber two” con-figuration with low-pressure troughs over northeasternCanada and just east of Asia, and high-pressure ridges just tothe west of Europe and North America. These strong zonalasymmetries reflect the so-called “stationary waves” that areforced primarily by the continent-ocean heating contrastsand the presence of the Rocky and Himalayan mountainranges. In summer the flow is much weaker and more sym-metric, consistent with a much more uniform equator-to-pole distribution of solar radiation.
Although the planetary-scale wave patterns (Figure 3) aregeographically anchored, they do change in time eitherbecause the heating patterns in the atmosphere vary or

4 OVERVIEW OF THE NAO
because of internal (chaotic) processes. The amplitude andstructure of the variability of the seasonal mean 500 hPageopotential height field (Figure 4) is characterized by astrong longitudinal dependence with maximum temporalvariance over the northern oceans, especially during borealwinter. The frequency dependence of the winter pattern is
subtle: maps of the variability of monthly mean data, or datafiltered to retain fluctuations within specific frequencybands (e.g., 60-180 days), also exhibit distinct variancemaxima at 500 hPa over the Atlantic and Pacific Oceans,although the longitudinal contrasts become increasinglyapparent as longer time scales are examined [Kushnir andWallace, 1989]. In comparison, throughout most of the NH,the standard deviations of boreal summer 500 hPa heightsare only about half as large as those of the wintertime means(Figure 4) [see also Wallace et al., 1993].
2.2. Teleconnections: The PNA and the NAO
A consequence of the transient behavior of the atmos-pheric planetary-scale waves is that anomalies in climate onseasonal time scales typically occur over large geographicregions. Some regions may be cooler or perhaps drier thanaverage, while at the same time thousands of kilometersaway, warmer and wetter conditions prevail. These simulta-neous variations in climate, often of opposite sign, over dis-tant parts of the globe are commonly referred to as “tele-connections” in the meteorological literature [Wallace andGutzler, 1981; Esbensen, 1984; Barnston and Livezey,1987; Kushnir and Wallace, 1989; Trenberth et al., 1998].Though their precise nature and shape vary to some extentaccording to the statistical methodology and the data setemployed in the analysis, consistent regional characteristicsthat identify the most conspicuous patterns emerge.
Arguably the most prominent teleconnections over theNH are the NAO and the Pacific-North American (PNA)patterns. Both patterns are of largest amplitude during theboreal winter months, and their mid-tropospheric spatialstructure is illustrated most simply through one-point corre-lation maps (Figure 5). These maps are constructed by cor-relating the 500 hPa height time series at a “reference grid-point” with the corresponding time series at all gridpoints[e.g., Wallace and Gutzler, 1981]. That these two patterns“stand out” above a background continuum comprised of acomplete (hemispheric) set of one-point correlation maps is,of course, subjective [Wallace, 1996], but the strong con-sensus is that they do [e.g., Kushnir and Wallace, 1989].
The PNA teleconnection pattern has four centers ofaction. Over the North Pacific Ocean, geopotential heightfluctuations near the Aleutian Islands vary out-of-phasewith those to the south, forming a seesaw pivoted along themean position of the Pacific subtropical jet stream (Figure2). Over North America, variations in geopotential heightover western Canada and the northwestern U.S. are nega-tively correlated with those over the southeastern U.S., butare positively correlated with the subtropical Pacific center.The significance of the locations and the respective phases
Figure 1. Mean sea level pressure for (top) boreal winter(December-February) and (bottom) boreal summer (June-August).The data come from the NCEP/NCAR reanalysis project over 1958-2001 [Kalnay et al., 1996], and the contour increment is 4 hPa.

of the four centers of the PNA is their relation to the meanatmospheric circulation (Figure 3). As stated by Kushnir[2002], variations in the PNA pattern “represent variationsin the waviness of the atmospheric flow in the western half-hemisphere and thus the changes in the north-south migra-tion of the large-scale Pacific and North American air mass-es and their associated weather”.
On interannual time scales, atmospheric circulation anom-alies over the North Pacific, including the PNA, are linked to
changes in tropical Pacific sea surface temperatures associat-ed with the El Niño/Southern Oscillation (ENSO) phenome-non. This association reflects mainly the dynamical telecon-nection to higher latitudes forced by deep convection in thetropics [see Trenberth et al., 1998 for a review]. The PNApattern is sometimes viewed, then, as the extratropical arm ofENSO, as is the similar Pacific South American (PSA) tele-connection pattern in the Southern Hemisphere [SH; Kiladisand Mo, 1998]. Significant variability of the PNA occurs
HURRELL ET AL. 5
Figure 2. Mean vector winds for (top) boreal winter (December-February) and (bottom) boreal summer (June-August)for (left) 1000 hPa and (right) 200 hPa over 1958-2001. The scaling vectors are indicated in the boxes and are givenin units of m s-1.

even in the absence of ENSO, however, indicating that thePNA is an “internal” mode of atmospheric variability.
Similarly, the NAO does not owe its existence to coupledocean-atmosphere-land interactions [Thompson et al., thisvolume; Czaja et al., this volume], as is evident from obser-vations and climate model experiments that do not include
SST, sea ice or land surface variability (see section 6.1 andFigure 19). In contrast to the wave-like appearance of thePNA, the NAO is primarily a north-south dipole character-ized by simultaneous out-of-phase height anomaliesbetween temperate and high latitudes over the Atlantic sec-tor (Figure 5; section 3). Both the NAO and PNA are alsoreflected in the spatial patterns of the two leading empiri-cally-determined orthogonal functions (EOFs) of NH bore-
6 OVERVIEW OF THE NAO
Figure 3. Mean 500 hPa geopotential height for (top) boreal winter(December-February) and (bottom) boreal summer (June-August),indicated by the thick contours every 120 gpm, over 1958-2001. Thethin contours (every 20 gpm, zero contour excluded) indicate depar-tures from the zonal average: negative (positive) departures are indi-cated by dark (light) shading.
Figure 4. Interannual variability of 500 hPa geopotential height for(top) boreal winter (December-February) and (bottom) boreal sum-mer (June-August) over 1958-2001. The contour increment is 10gpm.

al winter 500 hPa height (not shown), but in order to seethem clearly it is necessary to rotate (i.e., to form linearcombinations of) the EOFs in a manner that tends to simpli-fy their spatial structure [e.g., Barnston and Livezey, 1987;Kushnir and Wallace, 1989]. This is less of an issue at the
surface, however, where the NAO dominates the leadingEOF of the NH SLP field [section 3.2; see also Kutzbach,1970; Rogers, 1981; Trenberth and Paolino, 1981;Thompson et al., this volume]. Analyzing SLP also allowsfor the longer-term behavior of the NAO to be evaluated, asa long series of SLP charts over the NH begin in 1899[Trenberth and Paolino, 1980], in contrast to 500 hPa heightcharts that are confined to after 1947. Moreover, even longerinstrumental records of SLP variations are available, espe-cially from European stations [Jones et al., this volume].Thus, in the following, we examine the spatial structure andtime evolution of the NAO in more detail from SLP records.
3. THE SPATIAL SIGNATURE OF THE NAO
There is no single way to “define” the NAO. Oneapproach is through conceptually simple one-point correla-tion maps (e.g., Figure 5), identifying the NAO by regionsof maximum negative correlation over the North Atlantic[Wallace and Gutzler, 1981; Kushnir and Wallace, 1989;Portis et al., 2001]. Another technique is EOF (or principalcomponent) analysis. In this approach, the NAO is identi-fied from the eigenvectors of the cross-covariance (or cross-correlation) matrix, computed from the time variations ofthe gridpoint values of SLP or some other climate variable.The eigenvectors, each constrained to be spatially and tem-porally orthogonal to the others, are then scaled according tothe amount of total data variance they explain. This linearapproach assumes preferred atmospheric circulation statescome in pairs, in which anomalies of opposite polarity havethe same spatial structure. In contrast, climate anomalies canalso be identified by cluster analysis techniques, whichsearch for recurrent patterns of a specific amplitude andsign. Clustering algorithms identify weather or climate“regimes”, which correspond to peaks in the probabilitydensity function of the climate phase space [Lorenz, 1963].Interest in this nonlinear interpretation of atmospheric vari-ability has been growing, and recently has found applica-tions within the climate framework [e.g., Palmer, 1999;Corti et al., 1999; Cassou and Terray, 2001a,b; see alsoMonahan et al., 2000; 2001]. In the following, we comparethe spatial patterns of the NAO as estimated from both tra-ditional EOF and clustering techniques.
3.1. EOF Analysis of North Atlantic SLP
The leading eigenvectors of the cross-covariance matrixcalculated from seasonal (3-month average) SLP anomaliesin the North Atlantic sector (20º-70ºN; 90ºW-40ºE) are illus-trated in Figure 6. The patterns are very similar if based onthe cross-correlation matrix (not shown). The patterns are
HURRELL ET AL. 7
Figure 5. One-point correlation maps of 500 hPa geopotentialheights for boreal winter (December-February) over 1958-2001. Inthe top panel, the reference point is 45ºN, 165ºW, corresponding tothe primary center of action of the PNA pattern. In the lower panel,the NAO pattern is illustrated based on a reference point of 65ºN,30ºW. Negative correlation coefficients are dashed, the contourincrement is 0.2, and the zero contour has been excluded.

displayed in terms of amplitude, obtained by regressing thehemispheric SLP anomalies upon the leading principal com-ponent (PC) time series from the Atlantic domain.
The largest amplitude anomalies in SLP occur during theboreal winter months; however, throughout the year theleading pattern of variability is characterized by a surface
pressure dipole, and thus may be viewed as the NAO,although the spatial pattern is not stationary [Barnston andLivezey, 1987; Hurrell and van Loon, 1997; Portis et al.,2001]. Since the eigenvectors are, by definition, structuredto explain maximum variance, it is expected that the “centersof action” of the leading EOFs will coincide with the
8 OVERVIEW OF THE NAO
Figure 6. Leading empirical orthogonal functions (EOF 1) of the seasonal mean sea level pressure anomalies in theNorth Atlantic sector (20º-70ºN, 90ºW-40ºE), and the percentage of the total variance they explain. The patterns are dis-played in terms of amplitude (hPa), obtained by regressing the hemispheric sea level pressure anomalies upon the lead-ing principal component time series. The contour increment is 0.5 hPa, and the zero contour has been excluded. Thedata cover 1899-2001 [see Trenberth and Paolino, 1980].

regions of strongest variability, and the movement of thoseregions through the annual cycle is reflected in Figure 6.
The NAO is the only teleconnection pattern evidentthroughout the year in the NH [Barnston and Livezey, 1987].During the winter season (December-February), it accountsfor more than one-third of the total variance in SLP over theNorth Atlantic, and appears with a slight northwest-to-south-east orientation. In the so-called positive phase (depicted),higher-than-normal surface pressures south of 55ºN combinewith a broad region of anomalously low pressure throughout
the Arctic to enhance the climatological meridional pressuregradient (Figure 1). The largest amplitude anomalies occurin the vicinity of Iceland and across the Iberian Peninsula.The positive phase of the NAO is associated with stronger-than-average surface westerlies across the middle latitudesof the Atlantic onto Europe, with anomalous southerly flowover the eastern U.S. and anomalous northerly flow acrossthe Canadian Arctic and the Mediterranean (Figure 7).
The NAO is well separated (and thus less likely to beaffected by statistical sampling errors) in all seasons from
HURRELL ET AL. 9
Figure 7. The difference in boreal winter (December-February) mean sea level pressure and 1000 hPa vector winds betweenpositive (hi) and negative (lo) index phases of the NAO. The composites are constructed from winter data (the NCEP/NCARreanalyses over 1958-2001) when the magnitude of the NAO index (defined as the principal component time series of theleading empirical orthogonal function of Atlantic-sector sea level pressure, as in Figures 6 and 10) exceeds one standarddeviation. Nine winters are included in each composite. The contour increment for sea level pressure is 2 hPa, negative val-ues are indicated by the dashed contours, and the zero contour has been excluded. The scaling vector is 3 m s-1.

the second eigenvector, according to the criterion of Northet al. [1982]. The second EOF, which resembles the EastAtlantic (EA) pattern during the winter and spring months[Wallace and Gutzler, 1981; Barnston and Livezey, 1987],generally accounts for about 15% of the total SLP variance(not shown). By boreal spring (March-May), the NAOappears as a north-south dipole with a southern center ofaction near the Azores. Both the spatial extent and theamplitude of the SLP anomalies are smaller than duringwinter, but not by much, and the leading EOF explains 30%of the SLP variance. The amplitude, spatial extent, and thepercentage of total SLP variability explained by the NAOreach minimums during the summer (June-August) season,when the centers of action are substantially north and eastrelative to winter. By fall (September-November), the NAOtakes on more of a southwest-to-northeast orientation, withSLP anomalies in the northern center of action comparablein amplitude to those during spring.
Most studies of the NAO focus on the NH winter months,when the atmosphere is most active dynamically and pertur-bations grow to their largest amplitudes. As a result, theinfluence of the NAO on surface temperature and precipita-tion (sections 5.1 and 5.2), as well as on ecosystems (section5.4), is also greatest at this time of year. As most of the otherchapters in this volume do as well, we focus hereafter on thewinter variations. But that coherent fluctuations of surfacepressure, temperature and precipitation occur throughout theyear over the North Atlantic, and decadal and longer-termvariability is not confined to winter, should not be lost on thereader. For instance, Hurrell et al. [2001; 2002] and Hurrelland Folland [2002] document significant interannual tomulti-decadal fluctuations in the summer NAO pattern(Figure 6), including a trend toward persistent anticyclonicflow over northern Europe that has contributed to anom-alously warm and dry conditions in recent decades [see alsoSexton et al., 2002; Rodwell, this volume]. Moreover, thevigorous wintertime NAO can interact with the slower com-ponents of the climate system (the ocean, in particular) toleave persistent surface anomalies into the ensuing parts ofthe year that may significantly influence the evolution of theclimate system [Czaja et al., this volume; Rodwell, this vol-ume]. Undoubtedly, further examinations of the annual cycleof climate and climate change over the Atlantic, as well asthe mechanisms responsible for those variations, are needed.
That the spatial pattern of the NAO remains largely simi-lar throughout the year does not imply that it also tends topersist in the same phase for long. To the contrary, it is high-ly variable, tending to change its phase from one month toanother (section 4), and its longer-term behavior reflects thecombined effect of residence time in any given phase and itsamplitude therein.
3.2. EOF Analysis of Northern Hemisphere SLP
A well-known shortcoming of EOF analysis is that eigen-vectors are mathematical constructs, constrained by theirmutual orthogonality and the maximization of variance overthe entire analysis domain. There is no guarantee, therefore,that they represent physical/dynamical modes of the climatesystem. An EOF analysis, for instance, will not clearlyreveal two patterns that are linearly superposed if those pat-terns are not orthogonal. Moreover, the loading values ofEOFs do not reflect the local behavior of the data: values ofthe same sign at two different spatial points in an EOF do notimply that those two points are significantly correlated. Thismeans that the pattern structure of any particular EOF mustbe interpreted with care [e.g., Dommenget and Latif, 2002].These issues have been at the center of a recent debate[Deser, 2000; Wallace, 2000; Ambaum et al., 2001] overwhether or not the NAO is a regional expression of a larger-scale (hemispheric) mode of variability known as the ArcticOscillation (AO) or, as it is more recently referred to, the NHAnnular Mode [NAM; Thompson et al., this volume].
The NAM is defined as the first EOF of NH (20º-90ºN)winter SLP data (shown in Figure 8, upper panel, based onthe cross-covariance matrix). It explains 23% of the extend-ed winter mean (December-March) variance, and it is clear-ly dominated by the NAO structure in the Atlantic sector.Although there are some subtle differences from the region-al pattern (Figure 8, lower panel) over the Atlantic andArctic, the main difference is larger amplitude anomaliesover the North Pacific of the same sign as those over theAtlantic. This feature gives the NAM an almost annular (orzonally-symmetric) structure that reflects a more hemi-spheric-scale meridional seesaw in SLP between polar andmiddle latitudes. Though first identified by Lorenz [1951] inzonally-averaged data and by Kutzbach [1970], Wallace andGutzler [1981], and Trenberth and Paolino [1981] in grid-ded data, Thompson and Wallace [1998; 2000] have recent-ly strongly argued that the NAM is a fundamental structureof NH climate variability, and that the “regional” NAOreflects the modification of the annular mode by zonally-asymmetric forcings, such as topography and land-oceantemperature contrasts. It would then follow that the annularmode perspective is critical in order to understand theprocesses that give rise to NAM (or NAO) variations [seealso Wallace, 2000; Hartmann et al., 2000].
The arguments for the existence of the NAM, described inmuch more detail by Thompson et al. [this volume], includethe following: (1) the zonally-symmetric component of theNAM is evident in the leading EOFs of heights and windsfrom the surface through the stratosphere, with variability inthe latter region being dominated by a truly annular mode;
10 OVERVIEW OF THE NAO

(2) the strong similarity of the NAM to the spatial pattern ofcirculation variability in the SH, known as the SouthernAnnular Mode (SAM); (3) the “signature” of the NAM inthe meridional profiles of the month-to-month variance ofthe zonally-averaged circulation; and (4) that the NAMseems to orchestrate weather and climate over the hemi-sphere, not just the Atlantic sector, on time scales fromweeks to decades. This point of view clearly suggests thatthe NAM reflects dynamical processes that transcend theAtlantic sector. It is not a view that is universally accepted,however [Kerr, 1999].
Deser [2000] has argued that the NAM is not a telecon-nection pattern in the sense that there are only weak corre-lations between the Atlantic and Pacific middle latitude cen-ters on both intraseasonal (month-to-month) and interannu-al time scales. In addition, while interannual fluctuations inSLP over the Arctic and Atlantic centers of action are sig-nificantly (negatively) correlated (e.g., Figure 5), the Arcticand Pacific centers are not. This leads her to conclude “theannular character of the AO is more a reflection of the dom-inance of its Arctic center of action than any coordinatedbehavior of the Atlantic and Pacific centers”. Ambaum et al.[2001] reach a similar conclusion, but also based on anassessment of the physical consistency between the NAMand NAO structures in SLP and the leading patterns of vari-ability in other, independent climate variables. In particular,they show that leading EOFs of SLP, lower troposphericwinds and temperature over the Atlantic sector are dynami-cally related and are clear representations of the NAO,while the same analysis applied to the hemispheric domainyields very different results and patterns that are not obvi-ously related. Rather, over the Pacific sector, they show thatdynamical consistency among fields emerges for the PNA.Ambaum et al. [2001] also note that NAM variability issuperposed upon a strongly zonally asymmetric climatology(Figures 1-3; note that the Icelandic and Aleutian low pres-sure centers occupy different latitudes), so that it does notcorrespond to a uniform modulation of the climatologicalfeatures. In the positive NAM phase (depicted in Figure 8),the North Atlantic tropospheric subtropical and polar jets(Figure 2) are strengthened, but the subtropical jet in thePacific is weakened.
While the above arguments suggest that the NAO para-digm may be more robust and physically relevant for NHvariability, the debate is not over. Recently, for instance,Wallace and Thompson [2002] suggest that the lack of tele-connectivity between the Atlantic and Pacific sectors is con-sistent with the NAM if a second mode is present that favorsout-of-phase behavior between these sectors. They suggestthis mode could be the PNA. Regardless, the important pointis that the physical mechanisms associated with annular
HURRELL ET AL. 11
Figure 8. Leading empirical orthogonal function (EOF 1) of thewinter (December-March) mean sea level pressure anomalies over(top) the Northern Hemisphere (20º-90ºN) and (bottom) the NorthAtlantic sector (20º-70ºN, 90ºW-40ºE), and the percentage of thetotal variance they explain. The patterns are displayed in terms ofamplitude (hPa), obtained by regressing the hemispheric sea levelpressure anomalies upon the leading principal component timeseries. The contour increment is 0.5 hPa, and the zero contour hasbeen excluded. The data cover 1899-2001 [see Trenberth andPaolino, 1980]. The dots in the bottom panel represent the loca-tions of Lisbon, Portugal and Stykkisholmur, Iceland used in thestation based NAO index of Hurrell [1995a] (see Figure 10).

mode behavior may be very relevant to understanding theexistence of the NAO, regardless of the robustness of theNAM paradigm. For instance, as previously noted, the lead-ing wintertime pattern of variability in the lower strato-sphere is clearly annular, but the SLP anomaly pattern thatis associated with it is confined almost entirely to the Arcticand Atlantic sectors and coincides with the spatial structureof the NAO [e.g., Perlwitz and Graf, 1995; Kodera et al.,1996; Thompson and Wallace, 1998; Deser, 2000].Thompson et al. [this volume] present a thorough overviewof the dynamics governing annular mode behavior, includ-ing a discussion of the mechanisms by which annular vari-ability in the stratosphere might drive NAO-like variationsin surface climate.
3.3. Cluster Analysis of North Atlantic SLP
The dynamical signature of interannual variability in theNorth Atlantic domain can also be examined through non-linear approaches, such as cluster analysis or non-linearprincipal component analysis [Monahan et al., 2000; 2001].Here we apply the former to 100 years of December-Marchmonthly SLP data using the procedures of Cassou andTerray [2001a,b], which are based on the clustering algo-rithm of Michelangeli et al. [1995]. The solutions are robustamong different algorithms and SLP data sets (not shown).
The clustering algorithm applied over the Atlantic domain(20º-70ºN; 90ºW-40ºE) identifies four winter climateregimes in SLP (Figure 9). Two of them correspond to thenegative and positive phases of the NAO, while the thirdand fourth regimes display a strong anticyclonic ridge andtrough, respectively, off western Europe and bear someresemblance to the EA teleconnection pattern [Wallace andGutzler, 1981; Barnston and Livezey, 1987]. Both the ridgeand negative NAO regimes occur in about 30% of all win-ter months since 1900, while both the positive NAO andtrough regimes occur in about 20% of all winter months.These numbers are sensitive to the period of analysis,reflecting that the dominance of certain regimes over othersvaries over time (section 4).
In contrast to the typical NAO pattern identified throughlinear approaches (e.g., Figures 5 and 6), some interestingspatial asymmetries are evident in Figure 9. Most striking isthe difference in the position of the middle latitude pressureanomalies between the two NAO regimes: in particular, theeastward shift (by ~30º longitude) in the positive relative tothe negative regime. The main difference in the northerncenter is the northeastward extension of SLP anomalies dur-ing positive NAO regime months. These spatial asymme-tries are not dependent on the analysis period: they are evi-dent in subperiods of the ~100-year long SLP data set [C.
Cassou, personal communication]. Similar results, indicat-ing a non-linearity in NAO variability, are found when thePC time series of the leading EOF of Atlantic SLP (Figure8) is used to define and average together positive and nega-tive index winters (like those used to construct Figure 7).
The robustness of the eastward displacement of the NAOin positive regime months has interesting implications forconclusions drawn recently from climate model studies onhow increasing greenhouse gas (GHG) concentrations mightaffect the spatial structure of the NAO [Gillett et al., this vol-ume]. Ulbrich and Christoph [1999], for instance, conclud-ed that future enhanced GHG forcing might result in an east-ward displacement of the NAO centers of action. The resultsfrom the regime analysis, however, suggest that longitudinalshifts could arise from the preferential excitement of positiveNAO regimes, which are intrinsically displaced eastward,rather than a static shift of the Atlantic pressure centers.Hilmer and Jung [2000] documented an eastward shift of thecenters of interannual NAO variability over the period 1978-1997 relative to 1958-1977, and they postulated that such achange could have arisen from a change in the occupationstatistics of fixed modes [see also Lu and Greatbatch, 2002].As we show below, this seems to be the case.
4. TEMPORAL VARIABILITY OF THE NAO
Since there is no unique way to define the spatial structureof the NAO, it follows that there is no universally acceptedindex to describe the temporal evolution of the phenome-non. Walker and Bliss [1932] constructed the first index ofthe NAO using a linear combination of surface pressure andtemperature measurements from weather stations on bothsides of the Atlantic basin [see also Wallace, 2000; Wanneret al., 2001; Stephenson et al., this volume]. In the mid-20th
century, indices of the “zonal index cycle” were popular[Namias, 1950; Lorenz, 1951 among others]. These indicescharacterize variations in the strength of the zonally aver-aged middle latitude surface westerlies and thus largelyreflect variations in the NAO [Wallace, 2000; Stephenson etal., this volume; Thompson et al., this volume]. Europeanscientists have introduced many others, all also stronglyrelated to the NAO but generally not well known.Stephenson et al. [this volume] describe several of them. Anexample is the “westerly index” of Lamb [1972], one of sev-eral indices associated with a set of circulation types rele-vant to the climate of the United Kingdom that are still usedin research today [C. Folland, personal communication].
Most modern NAO indices are derived either from thesimple difference in surface pressure anomalies betweenvarious northern and southern locations, or from the PCtime series of the leading (usually regional) EOF of SLP.
12 OVERVIEW OF THE NAO

HURRELL ET AL. 13
Many examples of the former exist, usually based on instru-mental records from individual stations near the NAO cen-ters of action [e.g., Rogers, 1984; Hurrell, 1995a; Jones etal., 1997; Slonosky and Yiou, 2001], but sometimes fromgridded SLP analyses [e.g., Portis et al., 2001; Luterbacheret al., 2002]. Jones et al. [this volume] discuss and comparevarious station-based indices in detail. They note that amajor advantage of most of these indices is their extensionback to the mid-19th century or earlier, and they even pres-ent a new instrumental NAO index from London and Parisrecords dating back to the late 17th century [see alsoSlonosky et al., 2001].
A disadvantage of station-based indices is that they arefixed in space. Given the movement of the NAO centers ofaction through the annual cycle (Figure 6), such indices canonly adequately capture NAO variability for parts of theyear [Hurrell and van Loon, 1997; Portis et al., 2001; Joneset al., this volume]. Moreover, individual station pressuresare significantly affected by small-scale and transient mete-orological phenomena not related to the NAO and, thus,contain noise [see Trenberth, 1984]. Hurrell and van Loon[1997] showed, for instance, that the signal-to-noise ratio of
commonly-used winter NAO station-based indices is near2.5, but by summer it falls to near unity.
An advantage of the PC time series approach is that suchindices are more optimal representations of the full NAO spa-tial pattern; yet, as they are based on gridded SLP data, theycan only be computed for parts of the 20th century, dependingon the data source. Below we compare a station-based indexto the PC time series of the leading EOF (PC1) of bothAtlantic-sector and NH SLP. We also present the time historyof occurrence of the NAO regimes identified in Figure 9. Allcomparisons are for the winter (December-March) season.Osborn et al. [1999], Wallace [2000], Wanner et al. [2001],Portis et al. [2001], and Jones et al. [this volume] presentquantitative comparisons of these and other NAO-relatedindices, the latter two papers for other seasons as well.
4.1. Time Series
Rogers [1984] simplified the NAO index of Walker andBliss [1932] by examining the difference in normalized SLPanomalies from Ponta Delgada, Azores and Akureyri,Iceland. Normalization is used to avoid the series being
Figure 9. Boreal winter (December-March) climate regimes in sea level pressure (hPa) over the North Atlantic domain(20º-70ºN, 90ºW-40ºE) using monthly data over 1900-2001. Shaded areas exceed the 95% confidence level using T andF statistics [see Cassou, 2001]. The percentage at the top right of each panel expresses the frequency of occurrence ofa cluster out of all winter months since 1900. The contour interval is 1 hPa.
dominated by the greater variability of the northern station(e.g., Figure 4). Hurrell [1995a] analyzed the important cou-pled modes of wintertime variability in SLP and surfacetemperature over the North Atlantic sector, and concludedthat the southern-node station of Lisbon, Portugal bettercaptured NAO-related variance (e.g., Figure 8). UsingLisbon also allowed him to extend the record a bit furtherback in time (to 1864), and Jones et al. [1997] subsequent-ly showed that an adequate index could be obtained usingthe even longer record from Gibraltar (to 1821). Jones et al.[this volume] show that all of these indices are highly cor-related on interannual and longer time scales, but that thechoice of the southern station does make some difference. Incontrast, the specific location of the northern node (amongstations in Iceland) is not critical since the temporal vari-ability over this region is much larger than the spatial vari-ability. For instance, December-March anomalies in SLP atStykkisholmur and Akureyri correlate at 0.98 [Hurrell andvan Loon, 1997].
The winter-mean index of Hurrell [1995a] is shown inFigure 10. Positive values of the index indicate stronger-than-average westerlies over the middle latitudes associatedwith pressure anomalies of the like depicted in Figures 6 and8. The station-based index for the winter season agrees wellwith PC1 of Atlantic-sector SLP. The correlation coefficientbetween the two is 0.92 over the common period 1899-2002, indicating that the station-based index adequately rep-resents the time variability of the winter-mean NAO spatialpattern. Moreover, it correlates with PC1 of NH SLP [theNAM index of Thompson and Wallace, 1998] at 0.85, whilethe correlation of the two PC1 time series is 0.95. Theseresults again emphasize that the NAO and NAM reflectessentially the same mode of tropospheric variability. Whenintraseasonal anomalies are considered by stringing togeth-er the individual winter months, the correlation coefficientbetween the two PC1 time series is reduced slightly to 0.89,but the correlations involving the station-based indexremain unchanged.
One conclusion from Figure 10 is that there is little evi-dence for the NAO to vary on any preferred time scale.Large changes can occur from one winter to the next, andthere is also a considerable amount of variability within agiven winter season [Nakamura, 1996; Feldstein, 2000; seealso Figure 11]. This is consistent with the notion that muchof the atmospheric circulation variability in the form of theNAO arises from processes internal to the atmosphere [sec-tion 6.1; Thompson et al., this volume], in which variousscales of motion interact with one another to produce ran-dom (and thus unpredictable) variations. There are, howev-er, periods when anomalous NAO-like circulation patternspersist over quite a few consecutive winters. In the subpolar
North Atlantic, for instance, SLP tended to be anomalouslylow during winter from the turn of the 20th century untilabout 1930 (positive NAO index), while the 1960s werecharacterized by unusually high surface pressure and severewinters from Greenland across northern Europe [negativeNAO index; van Loon and Williams, 1976; Moses et al.,1987]. A sharp reversal occurred from the minimum indexvalues in the late 1960s to strongly positive NAO index val-ues in the early and mid 1990s. Whether such low frequen-cy (interdecadal) NAO variability arises from interactions ofthe North Atlantic atmosphere with other, more slowly vary-ing components of the climate system such as the ocean[Czaja et al., this volume; Visbeck et al., this volume],whether the recent upward trend reflects a human influenceon climate [Gillett et al., this volume], or whether the longertime scale variations in the relatively short instrumentalrecord simply reflect finite sampling of a purely randomprocess [Czaja et al., this volume] driven entirely by atmos-pheric dynamics [Thompson et al., this volume] will be dis-cussed further in section 6.
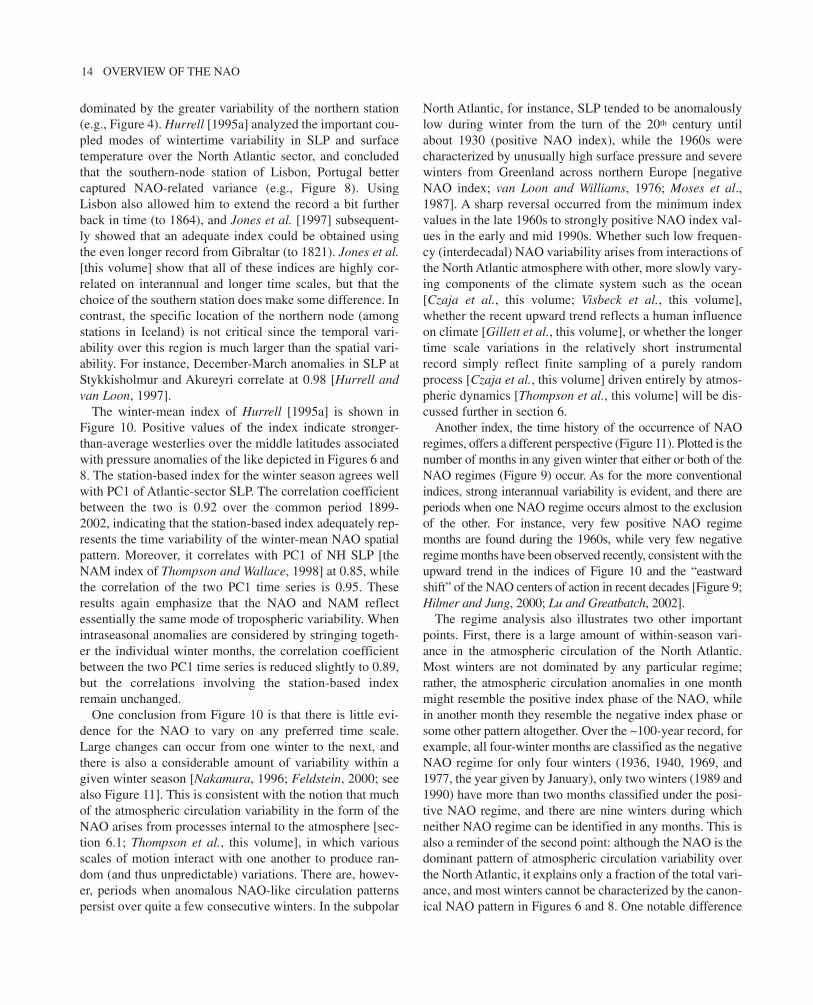
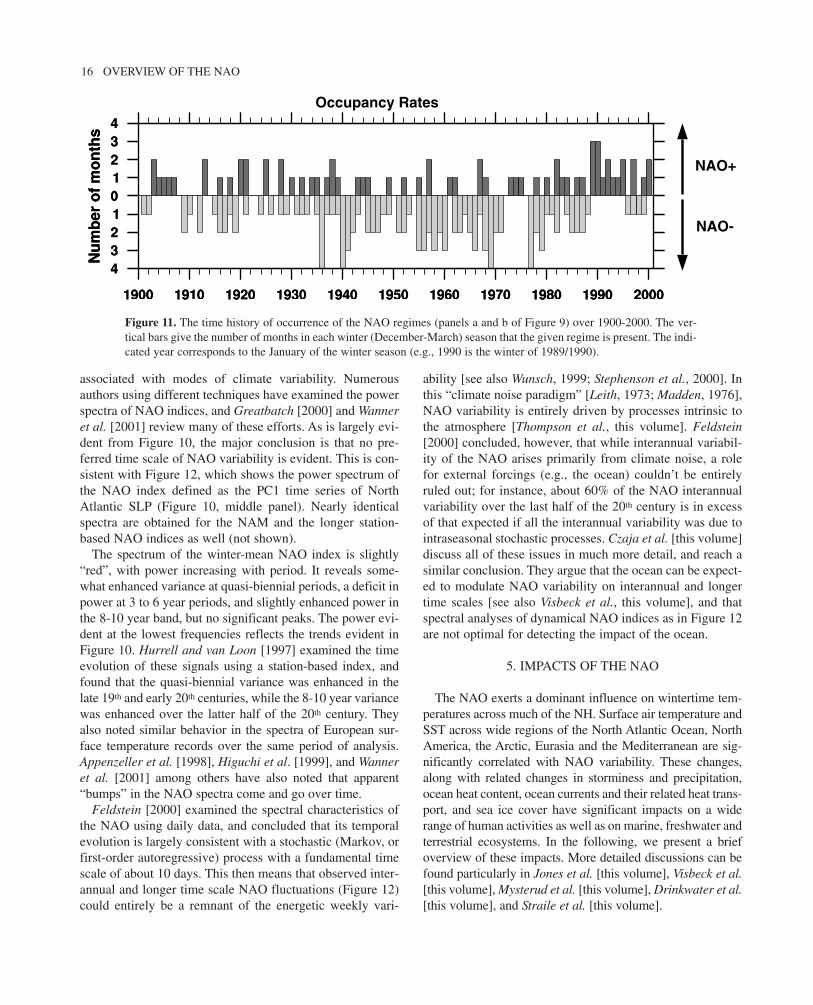
Another index, the time history of the occurrence of NAOregimes, offers a different perspective (Figure 11). Plotted is thenumber of months in any given winter that either or both of theNAO regimes (Figure 9) occur. As for the more conventionalindices, strong interannual variability is evident, and there areperiods when one NAO regime occurs almost to the exclusionof the other. For instance, very few positive NAO regimemonths are found during the 1960s, while very few negativeregime months have been observed recently, consistent with theupward trend in the indices of Figure 10 and the “eastwardshift” of the NAO centers of action in recent decades [Figure 9;Hilmer and Jung, 2000; Lu and Greatbatch, 2002].
The regime analysis also illustrates two other importantpoints. First, there is a large amount of within-season vari-ance in the atmospheric circulation of the North Atlantic.Most winters are not dominated by any particular regime;rather, the atmospheric circulation anomalies in one monthmight resemble the positive index phase of the NAO, whilein another month they resemble the negative index phase orsome other pattern altogether. Over the ~100-year record, forexample, all four-winter months are classified as the negativeNAO regime for only four winters (1936, 1940, 1969, and1977, the year given by January), only two winters (1989 and1990) have more than two months classified under the posi-tive NAO regime, and there are nine winters during whichneither NAO regime can be identified in any months. This isalso a reminder of the second point: although the NAO is thedominant pattern of atmospheric circulation variability overthe North Atlantic, it explains only a fraction of the total vari-ance, and most winters cannot be characterized by the canon-ical NAO pattern in Figures 6 and 8. One notable difference
14 OVERVIEW OF THE NAO

between the time history of NAO regime occurrences andmore conventional NAO indices occurs early in the 20th cen-tury. All three conventional indices have generally positivevalues from 1900 until about 1930 (Figure 10). However, theridge and trough regimes (Figure 9) were more dominantthan the NAO regimes over this period (as can be deduced bythe small occupancy rates in Figure 11; see Cassou [2001]for more discussion). This is also consistent with van Loonand Madden [1983], who show that the early 20th centurywas characterized by a southward displacement of the maxi-mum North Atlantic SLP variance from the Irminger Sea to
near Ireland (their Figures 1 and 3). That the ridge regimeprojects upon the positive index phase of the NAO (Figure 9)helps explain the strong positive values of the conventionalindices, but it also warns that reducing the complexities ofthe North Atlantic atmospheric circulation to one simpleindex can be misleading.
4.2. Power Spectrum
Spectral analysis is used to quantify periodicities in a timeseries and to gain insights into the dynamical processes
HURRELL ET AL. 15
Figure 10. Normalized indices of the mean winter (December-March) NAO constructed from sea level pressure data.In the top panel, the index is based on the difference of normalized sea level pressure between Lisbon, Portugal andStykkisholmur/Reykjavik, Iceland from 1864 through 2002. The average winter sea level pressure data at each stationwere normalized by division of each seasonal pressure by the long-term mean (1864-1983) standard deviation. In themiddle panel, the index is the principal component time series of the leading empirical orthogonal function (EOF) ofAtlantic-sector sea level pressure (bottom panel of Figure 8). In the lower panel, the index is the principal componenttime series of the leading EOF of Northern Hemisphere sea level pressure (top panel of Figure 8). The heavy solid linesrepresent the indices smoothed to remove fluctuations with periods less than 4 years. The indicated year corresponds tothe January of the winter season (e.g., 1990 is the winter of 1989/1990). See http://www.cgd.ucar.edu/~jhurrell/nao.htmlfor updated time series.
associated with modes of climate variability. Numerousauthors using different techniques have examined the powerspectra of NAO indices, and Greatbatch [2000] and Wanneret al. [2001] review many of these efforts. As is largely evi-dent from Figure 10, the major conclusion is that no pre-ferred time scale of NAO variability is evident. This is con-sistent with Figure 12, which shows the power spectrum ofthe NAO index defined as the PC1 time series of NorthAtlantic SLP (Figure 10, middle panel). Nearly identicalspectra are obtained for the NAM and the longer station-based NAO indices as well (not shown).
The spectrum of the winter-mean NAO index is slightly“red”, with power increasing with period. It reveals some-what enhanced variance at quasi-biennial periods, a deficit inpower at 3 to 6 year periods, and slightly enhanced power inthe 8-10 year band, but no significant peaks. The power evi-dent at the lowest frequencies reflects the trends evident inFigure 10. Hurrell and van Loon [1997] examined the timeevolution of these signals using a station-based index, andfound that the quasi-biennial variance was enhanced in thelate 19th and early 20th centuries, while the 8-10 year variancewas enhanced over the latter half of the 20th century. Theyalso noted similar behavior in the spectra of European sur-face temperature records over the same period of analysis.Appenzeller et al. [1998], Higuchi et al. [1999], and Wanneret al. [2001] among others have also noted that apparent“bumps” in the NAO spectra come and go over time.
Feldstein [2000] examined the spectral characteristics ofthe NAO using daily data, and concluded that its temporalevolution is largely consistent with a stochastic (Markov, orfirst-order autoregressive) process with a fundamental timescale of about 10 days. This then means that observed inter-annual and longer time scale NAO fluctuations (Figure 12)could entirely be a remnant of the energetic weekly vari-
ability [see also Wunsch, 1999; Stephenson et al., 2000]. Inthis “climate noise paradigm” [Leith, 1973; Madden, 1976],NAO variability is entirely driven by processes intrinsic tothe atmosphere [Thompson et al., this volume]. Feldstein[2000] concluded, however, that while interannual variabil-ity of the NAO arises primarily from climate noise, a rolefor external forcings (e.g., the ocean) couldn’t be entirelyruled out; for instance, about 60% of the NAO interannualvariability over the last half of the 20th century is in excessof that expected if all the interannual variability was due tointraseasonal stochastic processes. Czaja et al. [this volume]discuss all of these issues in much more detail, and reach asimilar conclusion. They argue that the ocean can be expect-ed to modulate NAO variability on interannual and longertime scales [see also Visbeck et al., this volume], and thatspectral analyses of dynamical NAO indices as in Figure 12are not optimal for detecting the impact of the ocean.
5. IMPACTS OF THE NAO
The NAO exerts a dominant influence on wintertime tem-peratures across much of the NH. Surface air temperature andSST across wide regions of the North Atlantic Ocean, NorthAmerica, the Arctic, Eurasia and the Mediterranean are sig-nificantly correlated with NAO variability. These changes,along with related changes in storminess and precipitation,ocean heat content, ocean currents and their related heat trans-port, and sea ice cover have significant impacts on a widerange of human activities as well as on marine, freshwater andterrestrial ecosystems. In the following, we present a briefoverview of these impacts. More detailed discussions can befound particularly in Jones et al. [this volume], Visbeck et al.[this volume], Mysterud et al. [this volume], Drinkwater et al.[this volume], and Straile et al. [this volume].
16 OVERVIEW OF THE NAO
Figure 11. The time history of occurrence of the NAO regimes (panels a and b of Figure 9) over 1900-2000. The ver-tical bars give the number of months in each winter (December-March) season that the given regime is present. The indi-cated year corresponds to the January of the winter season (e.g., 1990 is the winter of 1989/1990).

5.1. Surface Temperature
When the NAO index is positive, enhanced westerly flowacross the North Atlantic during winter (Figure 7) movesrelatively warm (and moist) maritime air over much ofEurope and far downstream, while stronger northerly windsover Greenland and northeastern Canada carry cold airsouthward and decrease land temperatures and SST over thenorthwest Atlantic (Figure 13). Temperature variations overNorth Africa and the Middle East (cooling), as well as NorthAmerica (warming), associated with the stronger clockwiseflow around the subtropical Atlantic high-pressure centerare also notable.
This pattern of temperature change is important. Becausethe heat storage capacity of the ocean is much greater thanthat of land, changes in continental surface temperatures are
much larger than those over the oceans, so they tend to dom-inate average NH (and global) temperature variability [e.g.,Wallace et al., 1995; Hurrell and Trenberth, 1996]. Giventhe especially large and coherent NAO signal across theEurasian continent from the Atlantic to the Pacific, it is notsurprising that NAO variability contributes significantly tointerannual and longer-term variations in NH surface tem-perature during winter. Jones et al. [this volume] show thatthe strength of this relationship can change over time, bothlocally and regionally. This aspect has implications forproxy-based reconstructions of past NAO variability [Cook,this volume].
Much of the warming that has contributed to the often-cited global temperature increases of recent decades hasoccurred during winter and spring over the northern conti-nents [Folland et al., 2001]. Since the early 1980s, winter
HURRELL ET AL. 17
Figure 12. Power spectrum of the mean winter (December-March) NAO index over 1899-2002, defined as in the mid-dle panel of Figure 10. Also shown is the corresponding red noise spectrum with the same lag one autocorrelation coef-ficient (0.24) and the 5 and 95% confidence limits.

temperatures have been 1-2ºC warmer-than-average overmuch of North America and from Europe to Asia, whiletemperatures over the northern oceans have been slightlycolder-than-average (Figure 14, upper panel). This pattern isstrongly related to changes in the atmospheric circulation,which are reflected by lower-than-average SLP over themiddle and high latitudes of the North Pacific and NorthAtlantic, as well as over much of the Arctic, and higher-than-average SLP over the subtropical Atlantic (Figure 14,lower panel). The Atlantic sector SLP changes clearly reflectthe predominance of the positive index phase of the NAOover this period (Figure 10), while the North Pacific changescorrespond to an intensification of the Aleutian low-pressuresystem (and an enhancement of the middle troposphericPNA pattern) driven, at least in part, by decadal variations inENSO [e.g., Trenberth and Hurrell, 1994].
Hurrell [1996] used multivariate linear regression toquantify the influence of atmospheric circulation variabilityassociated with the NAO and ENSO on NH winter-meansurface temperatures. He showed that much of the localcooling in the northwest Atlantic and the warming across
Europe and downstream over Eurasia (Figure 14) resulteddirectly from decadal changes in the North Atlantic atmos-pheric circulation in the form of the NAO [see alsoThompson et al., 2000], and that the NAO (ENSO) account-ed for 31% (16%) of the wintertime interannual variance ofNH extratropical temperatures over the latter half of the 20th
century. Moreover, changes in the atmospheric circulationassociated with the NAO and ENSO accounted (linearly) formuch, but not all, of the hemispheric warming through themid-1990s [Hurrell, 1996]. The warming of the most recentwinters, however, is beyond that that can be linearlyexplained by changes in the NAO or ENSO (not shown).Over 1999-2002, for instance, record warmth was recordedwhile generally cold conditions prevailed in the tropicalPacific and NAO-related circulation anomalies were weak.
5.2. Storms and Precipitation
Changes in the mean circulation patterns over the NorthAtlantic associated with the NAO are accompanied bychanges in the intensity and number of storms, their paths,
18 OVERVIEW OF THE NAO
Figure 13. Changes in mean winter (December-March) land surface and sea surface temperatures (x 10-1ºC) correspondingto a unit deviation of the NAO index (defined as in the middle panel of Figure 10) over 1900-2002. The contour incrementis 0.2ºC. Temperature changes > 0.2ºC are indicated by dark shading, and those < -0.2ºC are indicated by light shading.Regions of insufficient data (e.g., over much of the Arctic) are not contoured, and the zero contour has been excluded.

and their weather. During winter, a well-defined storm trackconnects the North Pacific and North Atlantic basins, withmaximum storm activity over the oceans (Figure 15). Thedetails of changes in storminess differ depending on theanalysis method and whether one focuses on surface orupper-air features. Generally, however, positive NAO indexwinters are associated with a northeastward shift in theAtlantic storm activity (Figure 15) with enhanced activityfrom Newfoundland into northern Europe and a modestdecrease in activity to the south [Rogers, 1990, 1997;Hurrell and van Loon, 1997; Serreze et al., 1997;Alexandersson et al., 1998]. Positive NAO index winters arealso typified by more intense and frequent storms in thevicinity of Iceland and the Norwegian Sea [Serreze et al.,1997; Deser et al., 2000].
The ocean integrates the effects of storms in the form ofsurface waves, so that it exhibits a marked response to longlasting shifts in the storm climate. The recent upward trendtoward more positive NAO index winters has been associatedwith increased wave heights over the northeast Atlantic anddecreased wave heights south of 40°N [Bacon and Carter,1993; Kushnir et al., 1997; Carter, 1999]. Such changes haveconsequences for the regional ecology, as well as for the oper-ation and safety of shipping, offshore industries such as oiland gas exploration, and coastal development.
Changes in the mean flow and storminess associated withswings in the NAO index are also reflected in pronouncedchanges in the transport and convergence of atmosphericmoisture and, thus, the distribution of evaporation (E) andprecipitation (P) [Hurrell, 1995a; Dickson et al., 2000].Evaporation exceeds precipitation over much of Greenlandand the Canadian Arctic during high NAO index winters(Figure 16), where changes between high and low NAOindex states are on the order of 1 mm day-1. Drier conditionsof the same magnitude also occur over much of central andsouthern Europe, the Mediterranean and parts of the MiddleEast, whereas more precipitation than normal falls fromIceland through Scandinavia [Hurrell, 1995a; Dai et al.,1997; Dickson et al., 2000; Visbeck et al., this volume].
This spatial pattern, together with the upward trend in theNAO index since the late 1960s (Figure 10), is consistentwith recent observed changes in precipitation over much ofthe Atlantic basin. One of the few regions of the worldwhere glaciers have not exhibited a pronounced retreat overthe past several decades is in Scandinavia [e.g., Hagen,1995; Sigurdsson and Jonsson, 1995) where more thanaverage amounts of precipitation have been typical of manywinters since the early 1980s. In contrast, over the Alps,snow depth and duration in many recent winters have beenamong the lowest recorded this century, and the retreat ofAlpine glaciers has been widespread [e.g., Frank, 1997].
HURRELL ET AL. 19
Figure 14. Twenty-two (1981-2002) winter (December-March)average (a) land surface and sea surface temperature anomaliesand (b) sea level pressure anomalies expressed as departures fromthe 1951-1980 means. Temperature anomalies > 0.25ºC are indi-cated by dark shading, and those < -0.10ºC are indicated by lightshading. The contour increment is 0.1ºC for negative anomalies,and the 0.25, 0.5, 1.0, 1.5, and 2.0ºC contours are plotted for pos-itive anomalies. Regions with insufficient temperature data are notcontoured. The same shading convention is used for sea level pres-sure, but for anomalies greater than 2 hPa in magnitude. The con-tour increment in (b) is 1 hPa.

Severe drought has persisted throughout parts of Spain andPortugal as well. As far eastward as Turkey, river runoff issignificantly correlated with NAO variability [Cullen anddeMenocal, 2000].
5.3. Ocean and Sea Ice
It has long been recognized that fluctuations in SST andthe strength of the NAO are related, and there are clear indi-cations that the North Atlantic Ocean varies significantlywith the overlying atmosphere. Visbeck et al. [this volume]describe in detail the oceanic response to NAO variability.
The leading pattern of SST variability during boreal win-ter consists of a tri-polar structure marked, in one phase, bya cold anomaly in the subpolar North Atlantic, a warm anom-aly in the middle latitudes centered off Cape Hatteras, and acold subtropical anomaly between the equator and 30°N[e.g., Cayan, 1992a,b; Visbeck et al., this volume]. Thisstructure suggests the SST anomalies are driven by changesin the surface wind and air-sea heat exchanges associatedwith NAO variations. The relationship is strongest when theNAO index leads an index of the SST variability by severalweeks, which highlights the well-known result that large-scale SST over the extratropical oceans responds to atmos-pheric forcing on monthly and seasonal time scales [e.g.,Battisti et al., 1995; Delworth, 1996; Deser and Timlin,1997]. Over longer periods, persistent SST anomalies alsoappear to be related to persistent anomalous patterns of SLP(including the NAO), although a number of different mecha-nisms can produce SST changes on decadal and longer timescales [e.g., Kushnir, 1994]. Such fluctuations could primari-ly be the local oceanic response to atmospheric decadal vari-ability. It is quite likely, for instance, that sustained NAOforcing results in a hemispheric SST response, in which thenorthern and subtropical parts of the tri-polar pattern merge[Visbeck et al., this volume]. On the other hand, non-localdynamical processes in the ocean could also be contributingto the SST variations [e.g., Visbeck et al., 1998;Krahmann et al., 2001; Eden and Willebrand, 2001].
Subsurface ocean observations more clearly depict long-term climate variability, because the effect of the annualcycle and month-to-month variability in the atmosphericcirculation decays rapidly with depth. These measurementsare much more limited than surface observations, but overthe North Atlantic they too indicate fluctuations that arecoherent with the low frequency winter NAO index todepths of 400 m [Curry and McCartney, 2001].
The oceanic response to NAO variability is also evident inchanges in the distribution and intensity of winter convec-tive activity in the North Atlantic. The convective renewalof intermediate and deep waters in the Labrador Sea and the
20 OVERVIEW OF THE NAO
Figure 15. In the top panel, mean storm tracks for 1958-1998winters (December-March) as revealed by the 300 hPa root meansquare transient geopotential height (gpm) bandpassed to include2-8 day period fluctuations. Values greater than 70 gpm are shad-ed and the contour increment is 10 gpm. In the lower panel,anomalies are expressed in terms of amplitude (gpm) by regres-sion onto the NAO index (defined as in the middle panel ofFigure 10). The contour increment is 2 gpm, and anomaliesgreater than 4 gpm in magnitude are shaded. The data come fromthe NCEP/NCAR reanalyses.

GIN Seas contribute significantly to the production andexport of North Atlantic Deep Water and, thus, help to drivethe global thermohaline circulation. The intensity of winterconvection at these sites is not only characterized by largeinterannual variability, but also interdecadal variations thatappear to be synchronized with variations in the NAO[Dickson et al., 1996]. Deep convection over the LabradorSea, for instance, was at its weakest and shallowest in thepostwar instrumental record during the late 1960s. Sincethen, Labrador Sea Water has become progressively colderand fresher, with intense convective activity to unprecedent-ed ocean depths (> 2300 m) in the early 1990s [Visbeck etal., this volume; their Figure 10]. In contrast, warmer andsaltier deep waters in recent years are the result of sup-pressed convection in the GIN Seas, whereas tracer evi-dence suggests that intense convection likely occurred dur-ing the late 1960s [Schlosser et al., 1991].
Some global warming scenarios have suggested that thenext decades might show a preferred positive index phase ofthe NAO [Gillett et al., this volume]. This would lead toincreased deep water formation in the Labrador Sea regionwhich might offset, or at least delay, the buildup of freshwater, which in many models leads to a sudden reduction ofthe thermohaline circulation [Delworth and Dixon, 2000;Cubasch et al., 2001].
For this reason there has also been considerable interest inthe past occurrences of low salinity anomalies that propa-gate around the subpolar gyre of the North Atlantic. Themost famous example is the Great Salinity Anomaly (GSA)[Dickson et al., 1988]. The GSA formed during the extremenegative index phase of the NAO in the late 1960s (Figure10), when clockwise flow around anomalously high pres-sure over Greenland fed record amounts of freshwater fromthe Arctic Ocean through the Fram Strait into the NordicSeas. From there some of the fresh water passed through theDenmark Strait into the subpolar North Atlantic Ocean gyre.There have been other similar events as well, and statisticalanalyses have revealed that the generation[Belkin et al., 1998] and termination [Houghton andVisbeck, 2002] of these propagating salinity modes areclosely connected to a pattern of atmospheric variabilitystrongly resembling the NAO.
The strongest interannual variability of Arctic sea iceoccurs in the North Atlantic sector. The sea ice fluctuationsdisplay a seesaw in ice extent between the Labrador andGreenland Seas. Strong interannual variability is evident inthe sea ice changes, as are longer-term fluctuations includ-ing a trend over the past 30 years of diminishing (increas-ing) ice concentration during boreal winter east (west) ofGreenland. Associated with the sea ice fluctuations are
HURRELL ET AL. 21
Figure 16. Difference in mean winter (December-March) evaporation (E) minus precipitation (P) between years whenthe NAO index exceeds one standard deviation. The NAO index is defined as in the middle panel of Figure 10, andnine winters enter into both the high index and the low index composites. The E-P field is obtained as a residual of theatmospheric moisture budget [see Hurrell, 1995a]. The calculation was based on the NCEP/NCAR reanalyses over1958-2001, and truncated to 21 wavenumbers. The contour increment is 0.3 mm day-1, differences greater than 0.3 mmday-1 (E exceeds P) are indicated by dark shading, and differences less than -0.3 mm day-1 (P exceeds E) are indicat-ed by light shading.

large-scale changes in SLP that closely resemble the NAO[Deser et al., 2000].
When the NAO is in its positive index phase, the LabradorSea ice boundary extends farther south while the GreenlandSea ice boundary is north of its climatological extent. This isqualitatively consistent with the notion that the atmospheredirectly forces the sea ice anomalies, either dynamically viawind-driven ice drift anomalies, or thermodynamically throughsurface air temperature anomalies. The relationship betweenthe NAO index and an index of the North Atlantic ice variationsis strong, although that it does not hold for all individual win-ters [Deser et al., 2000; Hilmer and Jung, 2000; Lu andGreatbatch, 2002] illustrates the importance of the regionalatmospheric circulation in forcing the extent of sea ice.
5.4. Ecology
Over the last couple of years interest in the ecologicalimpacts of NAO variability has increased markedly [e.g.,Ottersen et al., 2001; Walther et al., 2002; Stenseth et al.,2002]. Drinkwater et al. [this volume], Mysterud et al. [thisvolume] and Straile et al. [this volume] show the NAOaffects a broad range of marine, terrestrial and freshwaterecosystems across large areas of the NH, diverse habitatsand different trophic levels. Although such effects are far-reaching, the nature of the impacts varies considerably.
Ottersen et al. [2001] attempted to systematize the eco-logical effects of NAO variability, and they identified three
possible pathways. The first is relatively simple with fewintermediary steps, such as the effect of NAO-induced tem-perature changes on metabolic processes such as feeding andgrowth (Figure 17). Since the NAO can simultaneouslywarm ocean temperatures in one part of the Atlantic basinand cool them in another, its impact on a single species canvary geographically. An interesting example, described byDrinkwater et al. [this volume], is the out-of-phase fluctua-tions in year-class strength of cod between the northeast andnorthwest Atlantic. Alternatively, more complex pathwaysmay proceed through several physical and biological steps.One example is the intense vertical ocean mixing generatedby stronger-than-average westerly winds during a positiveNAO index winter. This enhanced mixing delays primaryproduction in the spring and leads to less zooplankton, whichin turn results in less food and eventually lower growth ratesfor fish [Drinkwater et al., this volume]. A third pathwayoccurs when a population is repeatedly affected by a partic-ular environmental situation before the ecological changecan be perceived (biological inertia), or when the environ-mental parameter affecting the population is itself modulatedover a number of years [physical inertia; Heath et al., 1999].
Mysterud et al. [this volume] demonstrate how the NAOinfluences a wide range of terrestrial animals and plants,including the intriguing example of red deer on the westcoast of Norway. These animals stay in low land regionsduring winter, while in summer they forage at higher eleva-tions. Altitude is a key factor determining whether precipi-tation comes as rain or snow, and it thereby explains whypositive NAO index conditions are favorable for these reddeer populations. Two separate mechanisms operate. First,warm and rainy conditions in the low-elevation winteringareas decrease energetic costs of thermoregulation andmovement while they increase access to forage in the fieldlayer during winter. Second, more winter snowfall at highelevations leads to a prolonged period of access of highquality forage during summer.
Although research on the influence of the NAO on fresh-water ecosystems is still in its early stages, Straile et al. [thisvolume] show that a pronounced effect on the physics, chem-istry and biology of many NH lakes and rivers is apparent. Toa large extent, the strong, coherent impact of the NAO onEuropean lakes through the year is set up in winter and earlyspring. This time of year is critical to lakes, as both springturnover and the onset of stratification occur. Thus, strongvariations in climate driven by the NAO exert a major impacton the distribution and seasonal development of temperatureand nutrients, as well as influence the time of onset, and therate, of plankton succession. But although the NAO stronglyinfluences a diversity of freshwater ecosystems, the actualeffects differ with altitude, latitude, size, and depth of a lake.
22 OVERVIEW OF THE NAO
Figure 17. An example of the ecological impact of the NAO,adapted from Stenseth et al. [2002]. It represents a simplified foodweb for the Barents Sea including phytoplankton, zooplankton,capelin (Mallotus villosus), herring (Clupea harengus), and cod(Gadus morhua). Positive index phases of the NAO affect theBarents Sea through increasing volume flux of warm water fromthe southwest, cloud cover and air temperature, all leading toincreased water temperature, which influences fish growth andsurvival both directly and indirectly [Ottersen and Stenseth, 2001].

The studies of the NAO impact on terrestrial [Mysterud etal., this volume] and freshwater [Straile et al., this volume]ecosystems are mainly from the eastern side of the Atlantic,and few results are available on several large groups of ani-mals and plants. Since the study of the ecological impacts ofthe NAO is still relatively new and conducted by only a fewscientists, it is not yet possible to determine if the NAOinfluences on ecology are more pronounced over Europe, orif the studies reflect more suitable European data sets andgreater interest initially by European scientists.Nevertheless, interest will no doubt continue to grow lead-ing to many new insights [Stenseth et al., 2002].
5.5. Economy
Significant changes in winter rainfall and temperature drivenby the NAO have the potential to affect the economy.Anecdotal evidence of this is plentiful, ranging from the eco-nomic costs of increased protection of coastal regions and theredesign of off shore oil platforms to cope with the recentNAO-driven increases in significant wave heights [e.g.,Kushnir et al., 1997] to altered tourism associated withchanged snow conditions in the Alps and winter weather innorthern Mediterranean countries (section 5.2). Some studieshave also suggested the likelihood of major hurricanes landfalling on the east coast of the U.S. depends on the phase ofthe NAO [e.g., Elsner and Kocher, 2000; Elsner et al., 2000].
Cullen and deMenocal [2000] studied the connectionbetween the NAO and stream flow of the Euphrates andTigris rivers. A major issue in this region involves watersupply shortages and surpluses for irrigation farming in theMiddle East. Decreases in rainfall associated with the longterm trend in the NAO index have had catastrophic effectson crop yields and have contributed to high level politicaldisputes on water withdrawals from the rivers betweenTurkey, where most of the rain falls, and Syria, a down-stream riparian neighbor.
A more recent study [J. Cherry, H. Cullen and others, per-sonal communication] investigated the economic impact ofNAO-induced changes in temperature and precipitation overScandinavia. Norway, and its energy trade with Sweden,was examined because the Norwegian energy sector hasqualities that are particularly useful for analyzing the rela-tionship between climate and energy commodities. Norwayis the leading Organization of Economic Cooperation andDevelopment (OECD) exporter of oil and gas, and it is thesecond largest oil exporter in the world. Norway’s climateand topography also make it ideal for hydroelectric powergeneration. More than 99% of electricity generation inNorway comes from hydropower, and Norway has the high-est electricity consumption per capita in the world. Sweden,
however, generates only 47% of its electricity fromhydropower, and another 47% comes from nuclear facilities.Sweden normally adjusts its nuclear electricity productiondownward during the period from March to Octoberbecause electricity consumption is low and water reservoirsproduce plenty of hydropower. Both Norway and Swedenunderwent market deregulation and increased privatizationduring the 1990s. This made international trade in electricityfeasible in Scandinavia. In 1993, Nord Pool was established asthe world’s first multinational exchange for electric powertrading.
In Norway the reservoir influx and level show a pro-nounced seasonal cycle with much month-to-month variabil-ity (Figure 18). The peak inflow in summer is associated withsnowmelt in the mountain ranges. At the inflow maximum inJune 1995, enough water to generate 10,000 GWh per weekof hydroelectric power flowed into Norwegian reservoirs,while only enough water to generate about 5,000 GWh perweek flowed into Swedish reservoirs. At the summer inflowpeak in 1996, the numbers dropped to 7,000 and 4,500 GWhper week for Norway and Sweden, respectively.
This dramatic reduction in Norwegian precipitation isreflected in the strongly negative NAO index value of theDecember 1995-March 1996 winter, which followed a longrun of wet winters (and hydropower surpluses) beginning inthe late 1980s associated with the positive index phase ofthe NAO (Figures 10 and 16). There is a strong correlationbetween the winter NAO index and the amount of rainfallover western Norway (Figure 18), for instance r ~ 0.8 atBergen [Hurrell, 1995a]. Rainfall anomalies are clearly evi-dent in reservoir levels, which for instance were 40% belowaverage in 1996 (Figure 18), and ultimately in hydroelectricpower generation. The approximate 6-month time lagbetween the winter precipitation and reservoir level anom-alies illustrates that much of the freshwater is stored in thewinter snow pack.
The large swing in the phase of the NAO between 1995 and1996 brought international attention to the physical connectionbetween the NAO and the availability of water in Scandinaviafor hydropower generation. Norwegian power producers soldcontracts during 1995 to end-users both locally and abroad.But, during the relatively dry conditions of 1996, these con-tracts could not be met with Norwegian hydropower alone:power had to be purchased on short-term markets at high costto the industry and consumers. Still embroiled in its energy cri-sis early in 1997, Norway imported a large amount of electric-ity from coal-fired power plants in Denmark, straining thecommitment both countries made under the Kyoto Protocol.
Because the climates in Norway and Sweden are impactedsomewhat differently by the NAO, and the electricity gener-ation sources are distributed differently between hydropow-
HURRELL ET AL. 23

er, nuclear power, and fossil fuels, each country may have anatural competitive advantage under particular climateevents. If the NAO is in a negative index phase and winterprecipitation is relatively low, power producers in Norwaycan meet supply contracts by buying nuclear power fromSweden. In contrast, when the NAO is in its positive indexphase and hydroelectric power is plentiful in Norway,Sweden may find it cheaper to buy hydropower from Norwaythan to produce that power itself. The existence of electricity
trade means that Norway can maintain its heavy reliance onhydropower instead of burning fossil fuels. Figure 18 showshow, in recent years, the NAO has influenced both the tradeamount and price of energy on the spot market.
6. MECHANISMS
Although the overwhelming indication is that the NAO isa mode of variability internal to the atmosphere, there is
24 OVERVIEW OF THE NAO
Figure 18. a) Monthly hydroelectric energy production in TWh per month for Norway (thin line). The heavy linedenotes the annual average. b) Difference between hydroelectric energy production and electric energy consumption inNorway. Positive values represent times when Norway is able to export energy to Sweden and negative values indicatea shortage in hydropower production. The heavy gray bars in the background show the winter mean NAO index for thisand all of the following graphs. c) Monthly time series of the first empirical orthogonal function of rainfall obtainedfrom a gridded station based data set for all of Scandinavia (thin line). Norway has the largest spatial loading in the areawhere most of the hydroelectric dams are located. The heavy line denotes the annual average. d) Monthly average reser-voir level for all hydroelectric dams in Norway in % (thin line). The heavy line denotes the departure from the meanannual cycle with the total time mean added back. e) Monthly price of electric energy on the Scandinavian energy spotmarket (thin line). The solid represents the annual average.

some evidence that external factors such as volcanicaerosols, anthropogenic influences on the atmosphericcomposition, and variations in solar activity can influenceits phase and amplitude. Moreover, it has been argued thatinteractions between the atmosphere and the underlyingsurface, or between the troposphere and stratosphere, canlend a “low-frequency” component to the NAO variability,such that limited prediction is plausible. At present there isno consensus on the relative roles such processes play inNAO variability, especially where long (interdecadal)times scales are concerned. Considering the significantimpact the NAO exerts on the climate of the NH, under-standing the mechanisms that control and affect the NAOis therefore crucial to the current debate on climate vari-ability and change. Thompson et al. [this volume], Czaja etal. [this volume], and Gillett et al. [this volume] providemore detailed discussions of external physical processesthought to affect the NAO in the context of thoroughoverviews of the dynamical factors that give rise to thehorizontal and vertical structure of NAO variability, aswell as its amplitude and time scales. Here we provide aquick look at these mechanisms and the debate surround-ing their importance.
6.1. Atmospheric Processes
Atmospheric general circulation models (AGCMs) pro-vide strong evidence that the basic structure of the NAOarises from the internal, nonlinear dynamics of the atmos-phere. The observed spatial pattern and amplitude of NAOanomalies are well simulated in AGCMs forced with clima-tological annual cycles (no interannual variations) of allforcings “external” to the atmosphere, like insolation, SST,sea ice, snow cover, and land surface moisture, as well asfixed atmospheric trace-gas composition [e.g., Barnett,1985; James and James, 1989; Kitoh et al., 1996; Osborn etal., 1999]. The results from one such integration are illus-trated in Figure 19. Thompson et al. [this volume] discuss indepth the governing atmospheric dynamical mechanisms, ofwhich interactions between the time-mean flow and thedepartures from that flow (the so-called transient eddies) arecentral and give rise to a fundamental time scale for NAOfluctuations of about 10 days [Feldstein, 2000]. Such intrin-sic atmospheric variability exhibits little temporal coherence(Figure 19), mostly consistent with the time scales ofobserved NAO variability (Figures 10 and 12) and the cli-mate noise paradigm discussed earlier (section 4.2).
A possible exception to this reference is the enhancedNAO variability over the latter half of the 20th century[Feldstein, 2000], including the apparent upward trend inthe boreal winter NAO index (Figure 19). Thompson et al.
[2000] concluded that the linear component of the observedupward trend of the index is statistically significant relativeto the degree of internal variability that it exhibits, andGillett et al. [2001] and Feldstein [2002] showed that theupward trend is statistically significant compared to appro-priate red noise models [Trenberth and Hurrell, 1999;although see Wunsch, 1999]. Osborn et al. [1999] showed,furthermore, that the observed trend in the winter NAOindex is outside the 95% range of internal variability gener-ated in a 1,400 year control run with a coupled ocean-atmos-phere climate model, and Gillett et al. [this volume] reachthe same conclusion based on their examination of multi-century control runs from seven different coupled climatemodels. This indicates that either the recent climate changeis due in part to external forcing, or all of the models aredeficient in their ability to simulate North Atlantic inter-decadal variability (although the simulated variability wassimilar to that observed in the instrumental record prior to1950). Comparisons to NAO indices reconstructed fromproxy data have also concluded the recent behavior isunusual, although perhaps not unprecedented [Jones et al.2001; Cook, this volume]; however, such extended proxyrecords are liable to considerable uncertainties [e.g.,Schmutz et al., 2000; Cook, this volume].
A possible source of the trend in the winter NAO indexcould be external processes that affect the strength of theatmospheric circulation in the lower stratosphere on longtime scales, such as increases in GHG concentrations[Gillett et al., this volume]. In contrast to the mean flow(Figures 1-3), the NAO has a pronounced “equivalentbarotropic” structure (i.e., it does not display a westward tiltwith elevation), and its anomalies increase in amplitude withheight in rough proportion to the strength of the mean zonalwind [Thompson et al., this volume]. In the lower strato-sphere, the leading pattern of geopotential height variabilityis characterized by a much more annular (zonally symmet-ric) structure than in the troposphere. When heights over thepolar region are lower than normal, heights at nearly all lon-gitudes in middle latitudes are higher than normal, and viceversa. In the former phase, the stratospheric westerly windsthat encircle the pole are enhanced and the polar vortex is“strong” and anomalously cold. Simultaneously at the sur-face, the NAO tends to be in its positive index phase [e.g.,Baldwin, 1994; Perlwitz and Graf, 1995; Kitoh et al., 1996;Kodera et al., 1996; Baldwin and Dunkerton, 1999].
The trend in the NAO phase and strength during the lastseveral decades has been associated with a stratospherictrend toward much stronger westerly winds encircling thepole and anomalously cold polar temperatures [e.g., Randeland Wu, 1999; Thompson et al., 2000]. There is a consider-able body of research and observational evidence to support
HURRELL ET AL. 25

the notion that variability in the troposphere can drive vari-ability in the stratosphere, but it now appears that somestratospheric control of the troposphere may also occur [e.g.,Baldwin and Dunkerton, 2001]. Thompson et al. [this vol-ume] review the evidence for such “downward control” andevaluate the possible mechanisms, which likely involve theeffect of the stratospheric flow on the refraction of planetarywaves dispersing upwards from the troposphere [e.g.,Hartmann et al., 2000; Shindell et al., 2001; Ambaum andHoskins, 2002], although more direct momentum forcingcould also be important [e.g., Haynes et al., 1991; Black,2002].
The atmospheric response to strong tropical volcaniceruptions provides some evidence for a stratospheric influ-ence on the surface climate [Gillett et al., this volume].Volcanic aerosols act to enhance north-south temperaturegradients in the lower stratosphere by absorbing solar radia-tion in lower latitudes, which produces warming. In the tro-posphere, the aerosols exert only a very small direct influ-ence [Hartmann et al., 2000]. Yet, the observed responsefollowing eruptions does not include only lower geopoten-tial heights over the pole with stronger stratospheric wester-lies, but also a strong, positive NAO-like signal in the tro-pospheric circulation [e.g., Robock and Mao, 1992; Kodera,1994; Graf et al., 1994; Kelley et al., 1996].
Reductions in stratospheric ozone and increases in GHGconcentrations also appear to enhance the meridional tem-perature gradient in the lower stratosphere, via radiativecooling of the wintertime polar regions. This change impliesa stronger polar vortex. It is possible, therefore, that theupward trend in the boreal winter NAO index in recentdecades (Figure 10) is associated with trends in either orboth of these trace-gases quantities. In particular, a declinein the amount of ozone poleward of 40°N has been observedduring the last two decades [Randel and Wu, 1999].
Shindell et al. [1999] subjected a coupled ocean-atmos-phere model to realistic increases in GHG concentrationsand found a trend toward the positive index phase of theNAO in the surface circulation. In similar experiments withdifferent coupled models, Ulbrich and Christoph [1999]and Fyfe et al. [1999] also found an increasing trend in theNAO index, although Osborn et al. [1999] and Gillett et al.[2000] did not. This led Cubasch et al. [2001] to concludethat there is not yet a consistent picture of the NAOresponse to increasing concentrations of greenhouse gases.Gillett et al. [this volume], however, examine 12 coupledocean-atmosphere models and find 9 show an increase inthe boreal winter NAO index in response to increasingGHG levels, although the results are somewhat sensitive tothe definition of the NAO index used (section 3). This ledthem to conclude that increasing GHG concentrations have
contributed to a strengthening of the North Atlantic surfacepressure gradient [see also Osborn, 2002]. Forcing fromstratospheric ozone depletion has generally been found tohave a smaller effect than GHG changes on the NAO [e.g.,Graf et al., 1998; Shindell et al., 2001], although Volodinand Galin [1999] claim a more significant influence.Gillett et al. [this volume] synthesize the diverse and grow-ing body of literature dealing with how the NAO mightchange in response to several anthropogenic forcings.
6.2. The Ocean’s Influence on the NAO
In the extratropics, the atmospheric circulation is thedominant driver of upper ocean thermal anomalies [section5.3; Visbeck et al., this volume]. A long-standing issue, how-ever, has been the extent to which the forced, anomalousextratropical SST field feeds back to affect the atmosphere[Kushnir et al., 2002]. Most evidence suggests this effect isquite small compared to internal atmospheric variability[e.g., Seager et al., 2000]. Nevertheless, the interactionbetween the ocean and atmosphere could be important forunderstanding the details of the observed amplitude of theNAO and its longer-term temporal evolution [Czaja et al.,this volume], as well as the prospects for meaningful pre-dictability [Rodwell et al., this volume].
The argument for an oceanic influence on the NAO goesas follows: while intrinsic atmospheric variability exhibitstemporal incoherence, the ocean tends to respond to it withmarked persistence or even oscillatory behavior. The timescales imposed by the heat capacity of the upper ocean, forexample, leads to low frequency variability of both SSTand lower tropospheric air temperature [Frankignoul andHasselmann, 1977; Manabe and Stouffer, 1996; Barsugliand Battisti, 1998]. Other studies suggest that basin-wide,spatially-coherent atmospheric modes such as the NAOinteract with the mean oceanic advection in the NorthAtlantic to preferentially select quasi-oscillatory SSTanomalies with long time scales [Saravanan andMcWilliams, 1998] and even excite selected dynamicalmodes of oceanic variability that act to redden the SSTspectrum [Griffies and Tziperman, 1995; Frankignoul etal., 1997; Capotondi and Holland, 1997; Saravanan andMcWilliams, 1997; 1998; Saravanan et al., 2000]. Thesetheoretical studies are supported by observations that win-ter SST anomalies, born in the western subtropical gyre,spread eastward along the path of the Gulf Stream andNorth Atlantic Current with a transit time of roughly adecade [Sutton and Allen, 1997; Krahmann et al., 2001]. Czaja et al. [this volume] offer a detailedexamination of all these possibilities of ocean-atmosphereinteraction.
26 OVERVIEW OF THE NAO
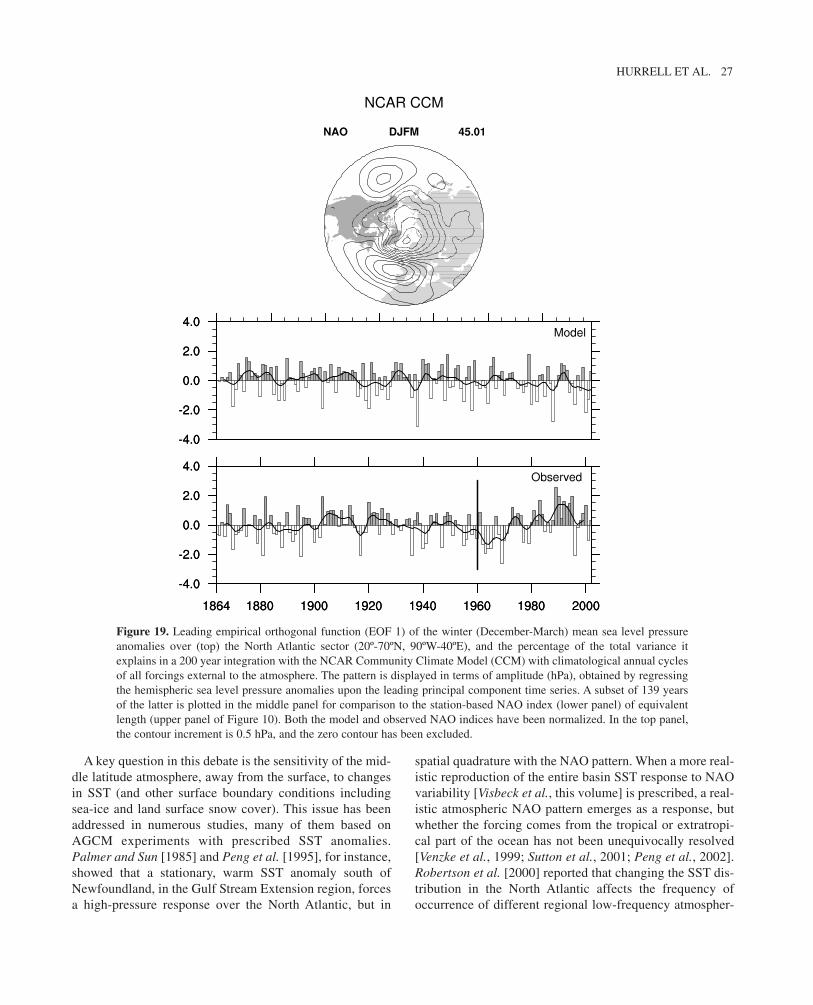
A key question in this debate is the sensitivity of the mid-dle latitude atmosphere, away from the surface, to changesin SST (and other surface boundary conditions includingsea-ice and land surface snow cover). This issue has beenaddressed in numerous studies, many of them based onAGCM experiments with prescribed SST anomalies.Palmer and Sun [1985] and Peng et al. [1995], for instance,showed that a stationary, warm SST anomaly south ofNewfoundland, in the Gulf Stream Extension region, forcesa high-pressure response over the North Atlantic, but in
spatial quadrature with the NAO pattern. When a more real-istic reproduction of the entire basin SST response to NAOvariability [Visbeck et al., this volume] is prescribed, a real-istic atmospheric NAO pattern emerges as a response, butwhether the forcing comes from the tropical or extratropi-cal part of the ocean has not been unequivocally resolved[Venzke et al., 1999; Sutton et al., 2001; Peng et al., 2002].Robertson et al. [2000] reported that changing the SST dis-tribution in the North Atlantic affects the frequency ofoccurrence of different regional low-frequency atmospher-
HURRELL ET AL. 27
Figure 19. Leading empirical orthogonal function (EOF 1) of the winter (December-March) mean sea level pressureanomalies over (top) the North Atlantic sector (20º-70ºN, 90ºW-40ºE), and the percentage of the total variance itexplains in a 200 year integration with the NCAR Community Climate Model (CCM) with climatological annual cyclesof all forcings external to the atmosphere. The pattern is displayed in terms of amplitude (hPa), obtained by regressingthe hemispheric sea level pressure anomalies upon the leading principal component time series. A subset of 139 yearsof the latter is plotted in the middle panel for comparison to the station-based NAO index (lower panel) of equivalentlength (upper panel of Figure 10). Both the model and observed NAO indices have been normalized. In the top panel,the contour increment is 0.5 hPa, and the zero contour has been excluded.

ic modes and substantially increases the interannual vari-ability of the NAO simulated by their AGCM. Rodwell et al.(1999) show that by forcing their AGCM with globally-varying observed SST and sea ice distributions, the phase(though not the full amplitude) of the long-term variabilityin the observed, wintertime NAO index over last half centu-ry can be captured, including about 50% of the observedstrong upward trend over the past 30 years [see also Mehtaet al., 2000; Hoerling et al., 2001].
The weakness of AGCM responses to SST anomalies andthe occasional confusing and inconsistent results [e.g.,Kushnir and Held, 1996] created a debate as to the impor-tance of oceanic forcing for climate anomalies in general andthe NAO in particular [Kushnir et al., 2002]. It is possible thatAGCM experiments with prescribed SST do not correctlyrepresent the processes in nature, where atmospheric fluctua-tions cause the SST variability, and it is the “back interaction”or feedback of the SST anomalies that is sought. Barsugli andBattisti [1998] argued that when the ocean responds to theatmosphere, the thermal damping on the latter is reduced,thereby contributing to stronger and more persistent anom-alies in both media. Kushnir et al. [2002] proposed a para-digm, based on North Pacific SST studies [Peng et al., 1997;Peng and Whitaker, 1999], in which the changes in SST dueto large scale circulation anomalies (such as the NAO) modi-fy the temperature gradient at the surface and, thus, the asso-ciated baroclinic transient activity, which in turn feeds backon the large scale flow anomalies [e.g., Hurrell 1995b]. Thismechanism may act together with reduced thermal dampingto explain why the NAO is more persistent during winter (andwell into March) than during the rest of the year, and whythere is a high correlation between late spring SST anomaliesand the NAO state in the ensuing fall and early winter [Czajaand Frankignoul, 2002; Rodwell, this volume].
In their review, Czaja et al. [this volume] explore the impli-cation of the reduced thermal damping paradigm, as well asevidence from coupled general circulation model experimentsthat the climate system exhibits quasi-oscillatory behaviordue to the long-term (multi-year) response of the ocean circu-lation to atmospheric forcing [e.g., Latif and Barnett, 1996;Grötzner et al., 1998; Timmermann et al., 1998]. These latterstudies argue that changes in the oceanic heat transport (per-haps driven by NAO variability) can lead to a negative feed-back on the atmosphere and thus reverse the phase of theatmospheric forcing phenomenon. Such behavior is obvious-ly conditioned on the ability of the atmosphere to respond toupper ocean heat content anomalies (see discussion above).The possibility that this delayed circulation response will leadto unstable, oscillatory modes of the climate system has alsobeen explored in simplified models [e.g., Jin 1997; Goodmanand Marshall, 1999; Weng and Neelin, 1998].
Adding to the complexity of ocean-atmosphere interactionis the possibility of remote forcing of the NAO from the trop-ical oceans. Several recent studies have concluded that NAOvariability is closely tied to SST variations over the tropicalNorth and South Atlantic [Xie and Tanimoto, 1998;Rajagopalan et al., 1998; Venzke et al., 1999; Robertson etal., 2000; Sutton et al., 2001]. SST variations in the tropicalAtlantic have large spatial dimension and occur on a widerange of time scales, from interannual to decadal. Theyinvolve changes in the meridional SST gradient across theequator, which affect the strength and location of tropicalAtlantic rainfall and thus possibly influence the NorthAtlantic middle latitude circulation. On the other hand,Hoerling et al. [2001] used carefully designed AGCM exper-iments to argue that the multi-year trend in North Atlantic cir-culation toward the positive index phase of the NAO since1950 has been driven by a commensurate warming of thetropical Indian Ocean and western Pacific surface waters.Although Hoerling et al. [2001] did not directly assess therole of the extratropical oceans in their paper, the fact thatmost of the low frequency behavior of the observed NAOindex since 1950 is recoverable from tropical SST forcingalone suggests a more passive role for extratropical NorthAtlantic SSTs [see also Peterson et al., 2002]. Sutton andHodson [2002] also find evidence of tropical Indian Oceanforcing of the NAO on long time scales, but in contrast toHoerling et al. [2001], they conclude this effect is secondaryto forcing from the North Atlantic itself. Clearly, the impor-tance of tropical versus extratropical ocean-atmosphere inter-action has not yet been fully determined.
Similarly, the impact of ENSO on the North Atlantic cli-mate, and the NAO in particular, remains open to debate,although most evidence suggests the effects are small butnon-trivial. Rogers [1984] concluded from an analysis of his-torical SLP data that simultaneous occurrences of particularmodes of ENSO and the NAO “seem to occur by chance”,and this is consistent with the fact that there is no significantcorrelation between indices of the NAO and ENSO on inter-annual and longer time scales. Pozo-Vázquez et al. [2001],however, composited extreme ENSO events and found forcold conditions in the tropical Pacific a statistically signifi-cant boreal winter SLP anomaly pattern resembling the pos-itive index phase of the NAO. Cassou and Terray [2001b]also argued for an influence of La Niña on the North Atlanticatmosphere, although they found an atmospheric responsethat more closely resembles the ridge regime of Figure 9.Sutton and Hodson [2002] point out, importantly, that theinfluence of ENSO most likely depends on the state of theNorth Atlantic itself [see also Venzke et al., 1999; Mathieu etal., 2002]. Moreover, the possibility of an indirect linkbetween ENSO and the NAO is suggested by numerous stud-
28 OVERVIEW OF THE NAO

ies that illustrate a direct impact of ENSO on tropical NorthAtlantic SSTs [e.g., Enfield and Mayer, 1997; Klein et al.,1999; Saravanan and Chang, 2000; Chiang et al., 2000;2002]. If this were a strong effect, however, it would bedetected by statistical analyses.
6.3. Sea Ice and Land Snow Cover
The role of sea ice and land snow cover in affecting atmos-pheric variability has received very little attention, especial-ly relative to the role of ocean anomalies. Here, too, the issueis whether changes in surface properties due to the NAO areable to modify its phase and amplitude in turn. As discussedin section 5.3, changes in sea-ice cover in both the Labradorand Greenland Seas as well as over the Arctic are well corre-lated with NAO variations [Deser et al., 2000]. Sincechanges in ice cover produce large changes in sensible andlatent heat fluxes, it is reasonable to ask if there is a subse-quent feedback onto the atmospheric circulation anomalies.Deser et al. [2000] suggest from observations that a localresponse of the atmospheric circulation to reduced sea icecover east of Greenland in recent years is apparent. However,more recent AGCM experiments, with imposed ice coveranomalies consistent with the observed trend of diminishing(increasing) ice concentration during winter east (west) ofGreenland, suggest a weak, negative feedback onto the NAO[C. Deser, personal communication].
Watanabe and Nitta [1999] suggested that land processesare responsible for decadal changes in the NAO. They find thatthe change toward a more positive wintertime NAO index in1989 was accompanied by large changes in snow cover overEurasia and North America. Moreover, the relationshipbetween snow cover and the NAO was even more coherentwhen the preceding fall snow cover was analyzed, suggestingthat the atmosphere may have been forced by surface condi-tions over the upstream land mass. Watanabe and Nitta [1998]reproduce a considerable part of the atmospheric circulationchanges by prescribing the observed snow cover anomalies inan AGCM. The debate on the importance of NAO interactionswith the earth land and ocean surface is thus far from over.
7. CONCLUSIONS AND CHALLENGES
The NAO is a large-scale atmospheric phenomenon pri-marily arising from stochastic interactions between atmos-pheric storms and both the climatological stationary eddiesand the time mean jet stream. As such, the month-to-monthand even year-to-year changes in the phase and amplitude ofthe NAO are largely unpredictable. But that external forcesmight nudge the atmosphere to assume a high or low NAOindex value over a particular month or season is important:
even a small amount of predictability could be useful con-sidering the significant impact the NAO exerts on the cli-mate of the NH, and a better understanding of how the NAOresponds to external forcing is crucial to the current debateon climate variability and change.
A number of different mechanisms that could influence thedetailed state of the NAO have been proposed. Within theatmosphere itself, changes in the rate and location of tropicalheating have been shown to influence the atmospheric circula-tion over the North Atlantic and, in particular, the NAO.Tropical convection is sensitive to the underlying SST distri-bution, which exhibits much more persistence than SST vari-ability in middle latitudes. This might lead, therefore, to somepredictability of the NAO phenomenon.
Interactions with the lower stratosphere are a second pos-sibility. This mechanism is of interest because it might alsoexplain how changes in atmospheric composition influencethe NAO. For example, changes in ozone, GHG concentra-tions and/or levels of solar output affect the radiative balanceof the stratosphere that, in turn, modulates the strength of thewinter polar vortex. Given the relatively long time scales ofstratospheric circulation variability (anomalies persist forweeks), dynamic coupling between the stratosphere and thetroposphere via wave mean flow interactions could yield auseful level of predictive skill for the wintertime NAO. Suchinteractions have also been used to rationalize the recenttrend in the winter NAO index in terms of global warming.
A third possibility is that the state of the NAO is influ-enced by variations in heat exchange between the atmos-phere and the ocean, sea-ice and/or land systems. A signifi-cant amount of numerical experimentation has been done totest the influence of tropical and extratropical SST anom-alies on the NAO, and these experiments are now beginningto lead to more conclusive and coherent results.
One of the most urgent challenges is to advance ourunderstanding of the interaction between GHG forcing andthe NAO. It now appears as though there may well be adeterministic relationship, which might allow for moderatelow frequency predictability and thus needs to be studiedcarefully. Also, while the predictability of seasonal to inter-annual NAO variability will most likely remain low, someapplications may benefit from the fact that this phenomenonleaves long-lasting imprints on surface conditions, in partic-ular over the oceans. At the same time, the response ofmarine and terrestrial ecosystems to a shift in the NAOindex might enhance or reduce the atmospheric carbon diox-ide levels and thus provide a positive or negative feedback.
Acknowledgments. The authors wish to thank C. Cassou for hishelpful comments, suggestions and use of his clustering algo-rithms, A. Phillips for his assistance with many of the figures, and
HURRELL ET AL. 29

L. Rothney for formatting the manuscript. The National Center forAtmospheric Research is sponsored by the National ScienceFoundation. Some of the work was supported by NOAA OGP CLI-VAR Atlantic grant NOAA-NA06GP0394.
REFERENCES
Alexandersson, H., T. Schmith, K. Iden, and H. Tuomenvirta,Long-term variations of the storm climate over NW Europe, TheGlobal Ocean Atmosphere System, 6, 97–120, 1998.
Ambaum, M. H., and B. J. Hoskins, The NAO troposphere-strato-sphere connection, J. Climate, 15, 1969–1978, 2002.
Ambaum, M. H. P., B. J. Hoskins, and D. B. Stephenson, ArcticOscillation or North Atlantic Oscillation?, J. Climate, 14,3495–3507, 2001.
Appenzeller, C., T. F. Stocker, and M. Anklin, North AtlanticOscillation dynamics recorded in Greenland ice cores, Science,282, 446–449, 1998.
Bacon, S., and D. J. T. Carter, A connection between mean waveheight and atmospheric pressure gradient in the North Atlantic,Int. J. Climatol., 13, 423–436, 1993.
Baldwin, M. P., X. Cheng, and T. J. Dunkerton, Observed correla-tions between winter-mean tropospheric and stratospheric circu-lation anomalies, Geophys. Res. Lett., 21, 1141–1144, 1994.
Baldwin, M. P., and T. J. Dunkerton, Propagation of the ArcticOscillation from the stratosphere to the troposphere, J. Geophys.Res., 104, 30937–30946, 1999.
Baldwin, M. P., and T. J. Dunkerton, Stratospheric harbingers ofanomalous weather regimes, Science, 294, 581–584, 2001.
Barnett, T. P., Variations in near-global sea level pressure, J. Atmos.Sci., 42, 478–501, 1985.
Barnston, A. G., and R. E. Livezey, Classification, seasonality andpersistence of low frequency atmospheric circulation patterns,Mon. Wea. Rev., 115, 1083–1126, 1987.
Barsugli, J. J., and D. S. Battisti, The basic effects of atmosphere-ocean thermal coupling on midlatitude variability, J. Atmos. Sci.,55, 477–493, 1998.
Battisti, D. S., U. S. Bhatt, and M. A. Alexander, A modeling studyof the interannual variability in the wintertime North AtlanticOcean, J. Climate, 8, 3067–3083, 1995.
Belkin, I. M., S. Levitus, J. I. Antonov, and S.-A. Malmberg,“Great Salinity Anomalies” in the North Atlantic, Prog.Oceanogr., 41, 1–68, 1998.
Bjerknes, J., Atlantic air-sea interactions, Advances in Geophysics,10, 1–82, 1964.
Black, R. X., Stratospheric forcing of surface climate in the ArcticOscillation, J. Climate, 15, 268–277, 2002.
Capotondi, A., and W. R. Holland, Decadal variability in an ideal-ized ocean model and its sensitivity to surface boundary condi-tions, J. Phys. Oceanogr., 27, 1072-1093, 1997.
Carter, D. J. T., Variability and trends in the wave climate of theNorth Atlantic: a review, in Proc. 9th ISOPE Conf., Brest Vol.III, pp 12–18, 1999.
Cassou, C., Role de l’ocean dans la variabilite basse frequence del’atmosphere sur la region Nord Atlantique-Europe. Ph.D disser-
tation, University of Paul Sabatier, Toulouse, France, 280 pp.,2001.
Cassou, C., and L. Terray, Oceanic forcing of the wintertime lowfrequency atmospheric variability in the North AtlanticEuropean sector: a study with the ARPEGE model, J. Climate,14, 4266–4291, 2001a.
Cassou, C., and L. Terray, Dual influence of Atlantic and PacificSST anomalies on the North Atlantic/Europe winter climate,Geophys. Res. Lett., 28, 3195–3198, 2001b.
Cayan, D. R., Latent and sensible heat flux anomalies over thenorthern oceans: Driving the sea surface temperature, J. Phys.Oceanogr., 22, 859–881, 1992a.
Cayan, D. R., Latent and sensible heat flux anomalies over thenorthern oceans: The connection to monthly atmospheric circu-lation, J. Climate, 5, 354–369, 1992b.
Chiang, J. C. H., Y. Kushnir, and A. Giannini, DeconstructingAtlantic intertropical convergence zone variability: Influence ofthe local cross-equatorial sea surface temperature gradient andremote forcing from the eastern equatorial Pacific, J. Geophys.Res., 107, 10.1029/2000JD000307, 2002.
Chiang, J. C. H., Y. Kushnir, and S. E. Zebiak, Interdecadalchanges in eastern Pacific ITCZ variability and its influence onthe Atlantic ITCZ, Geophys. Res. Lett., 27, 3687–3690, 2000.
Cook, E. R., Multi-proxy reconstructions of the North AtlanticOscillation (NAO) index: A critical review and a new well-veri-fied winter index reconstruction back to AD 1400, this volume.
Corti, S., F. Molteni, and T. N. Palmer, Signature of recent climatechange in frequencies of natural atmospheric circulationregimes, Nature, 398, 799–802, 1999.
Cubasch, U., and co-authors, Projections of future climate change,in Climate Change 2001, The Scientific Basis, J. T. Houghton, Y.Ding, D. J. Griggs, M. Noguer, P. J. van der Linden and D.Xiaosu, Eds., pp. 525–582, Cambridge Univ. Press, 2001.
Cullen, H., and P. B. deMenocal, North Atlantic influence onTigris-Euphrates streamflow, Int. J. Climatol., 20, 853–863,2000.
Curry, R. G., and M. S. McCartney, Ocean gyre circulation changesassociated with the North Atlantic Oscillation, J. Phys.Oceanog., 31, 3374–3400, 2001.
Czaja A., and C. Frankignoul, Observed impact of North AtlanticSST anomalies on the North Atlantic Oscillation, J. Climate, 15,606–623, 2002.
Czaja, A., A. W. Robertson, and T. Huck, The role of Atlanticocean-atmosphere coupling in affecting North AtlanticOscillation variability, this volume.
Dai, A., I. Y. Fung, and A. D. Del Genio, Surface observed globalland precipitation variations during 1900-88, J. Climate, 10,2943–2962, 1997.
Delworth, T. L., North Atlantic interannual variability in a coupledocean-atmosphere model, J. Climate, 9, 2356–2375, 1996.
Delworth, T. L., and K.W. Dixon, Implications of the recenttrend in the Arctic/North Atlantic Oscillation for the NorthAtlantic thermohaline circulation, J. Climate, 13, 3721–3727,2000.
Deser, C., On the teleconnectivity of the Arctic Oscillation,Geophys. Res. Lett., 27, 779–782, 2000.
30 OVERVIEW OF THE NAO

Deser, C., and M. S. Timlin, Atmosphere-ocean interaction onweekly time scales in the North Atlantic and Pacific. J. Climate,10, 393-408,1997.
Deser, C., J. E. Walsh, and M. S. Timlin, Arctic sea ice variabilityin the context of recent atmospheric circulation trends, J.Climate, 13, 617–633, 2000.
Dickson, R. R., J. Lazier, J. Meincke, P. Rhines, and J. Swift,Long-term co-ordinated changes in the convective activity of theNorth Atlantic, Prog. Oceanogr., 38, 241–295, 1996.
Dickson, R. R., J. Meincke, S. A. Malmberg, and A. J. Lee, The“Great Salinity Anomaly” in the northern North Atlantic1968–1982, Prog. Oceanogr., 20, 103–151, 1988.
Dickson, R. R., T. J. Osborn, J. W. Hurrell, J. Meincke, J.Blindheim, B. Adlandsvik, T. Vigne, G. Alekseev, and W.Maslowski, The Arctic Ocean response to the North AtlanticOscillation, J. Climate, 13, 2671–2696, 2000.
Dommenget D., and M. Latif, A cautionary note on the interpreta-tion of EOFs, J. Climate, 15, 216-225, 2002.
Drinkwater, K. F., and co-authors, The response of marine ecosys-tems to climate variability associated with the North AtlanticOscillation, this volume.
Eden, C., and J. Willebrand, Mechanism of interannual to decadalvariability of the North Atlantic circulation, J. Climate, 14,2266–2280, 2001.
Elsner, J. B., and B. Kocher, Global tropical cyclone activity: Alink to the North Atlantic Oscillation, Geophs. Res. Lett., 27,129–132, 2000.
Elsner, J. B., T. Jagger, and X. F. Niu, Changes in the rates of NorthAtlantic major hurricane activity during the 20th century,Geophys. Res. Lett., 27, 1743–1746, 2000.
Enfield, D. B., and D. A. Mayer, Tropical Atlantic sea surface tem-perature variability and its relation to El Niño-SouthernOscillation, J. Geophys. Res., 102, 929–945, 1997.
Esbensen, S. K., A comparison of intermonthly and interannualteleconnections in the 700 mb geopotential height field duringthe Northern Hemisphere winter. Mon. Wea. Rev., 112,2016–2032, 1984.
Feldstein, S. B., Teleconnections and ENSO: The timescale, powerspectra, and climate noise properties, J. Climate, 13, 4430–4440,2000.
Feldstein, S. B., The recent trend and variance increase of theAnnular Mode, J. Climate, 15, 88–94, 2002.
Folland, C. K., and co-authors, Observed climate variability andchange, in Climate Change 2001, The Scientific Basis, J. T.Houghton, Y. Ding, D. J. Griggs, M. Noguer, P. J. van derLinden and D. Xiaosu, Eds., pp. 99–181, Cambridge Univ.Press, 2001.
Frank, P., Changes in the glacier area in the Austrian Alps between1973 and 1992 derived from LANDSAT data. Max PlanckInstitute Report 242, 21 pp., 1997.
Frankignoul, C., and K. Hasselmann, Stochastic climate models,part II: application to sea-surface temperature variability andthermocline variability, Tellus, 29, 289–305, 1977.
Frankignoul, C., P. Muller, and E. Zorita, A simple model of thedecadal response of the ocean to stochastic wind forcing, J.Phys. Oceanogr., 27, 1533–1546, 1997.
Fyfe, J. C., G. J. Boer, and G. M. Flato, The Arctic and AntarcticOscillations and their projected changes under global warming,Geophys. Res. Lett., 26, 1601–1604, 1999.
Gillett, N. P., M. P. Baldwin, and M. R. Allen, Evidence for non-linearity in observed stratospheric circulation changes, J.Geophys. Res., 106, 7891–7901, 2001.
Gillett, N. P., H. F. Graf, and T. J. Osborn, Climate change and theNorth Atlantic Oscillation, this volume.
Gillett, N. P., G. C. Hegerl, M. R. Allen, and P. A. Stott,Implications of changes in the Northern Hemisphere circulationfor the detection of anthropogenic climate change, Geophys.Res. Lett., 27, 993–996, 2000.
Goodman J., and J. Marshall, A model of decadal middle-latitudeatmosphere-ocean coupled modes, J. Climate, 12, 621–641, 1999.
Graf, H. F., I. Kirchner, and J. Perlwitz, Changing lower stratos-pheric circulation: The role of ozone and greenhouse gases, J.Geophys. Res., 103, 11,251–11,261, 1998.
Graf, H. F., J. Perlwitz, and I. Kirchner, Northern Hemisphere tro-pospheric midlatitude circulation after violent volcanic erup-tions, Contrib. Atmos. Phys., 67, 3–13, 1994.
Greatbatch, R. J., The North Atlantic Oscillation, Stochastic andEnvironmental Risk Assessment, 14, 213–242, 2000.
Griffies, S. M., and E. Tziperman, A linear thermohaline oscillatordriven by stochastic atmospheric forcing, J. Climate, 8,2440–2453, 1995.
Grötzner, A., M. Latif, and T. P. Barnett, A decadal climate cycle inthe North Atlantic Ocean as simulated by the ECHO coupledGCM, J. Climate, 11, 831–847, 1998.
Hagen, J. O., Recent trends in the mass balance of glaciers inScandinavia and Svalbard, in Proceedings of the internationalsymposium on environmental research in the Arctic, Tokyo,Japan, National Institute of Polar Research, 343–354, 1995.
Hansen, J., R. Ruedy, M. Sato, and K. Lo, Global warming contin-ues, Science, 295, 275, 2002.
Hartmann, D. L., J. M. Wallace, V. Limpasuvan, D. W. J.Thompson, and J. R. Holton, Can ozone depletion and green-house warming interact to produce rapid climate change?, Proc.Nat. Acad. Sci., 97, 1412–1417, 2000.
Haynes, P. H., C. J. Marks, M. E. McIntyre, T. G. Shepherd, and K.P. Shine, On the “downward control” of extratropical diabaticcirculations by eddy-induced mean zonal forces, J. Atmos. Sci.,48, 651–678, 1991.
Heath M.R., and co-authors, Climate fluctuations and the springinvasion of the North Sea by Calanus finmarchicus, Fish.Ocean., 8, 163–176, 1999.
Higuchi, K., J. Huang, and A. Shabbar, A wavelet characterizationof the North Atlantic oscillation variation and its relationship tothe North Atlantic sea surface temperature, Int. J. Climatol., 19,1119–1129.
Hilmer, M., and T. Jung, Evidence for a recent change in the linkbetween the North Atlantic Oscillation and Arctic sea ice export,Geophy. Res. Lett., 27, 989–992, 2000.
Hoerling, M. P., J. W. Hurrell, and T. Xu, Tropical origins for recentNorth Atlantic climate change, Science, 292, 90–92, 2001.
Houghton, B., and M. Visbeck, Quasi-decadal salinity fluctuationsin the Labrador Sea, J. Phys. Oceanogr., 32, 687–701, 2002.
HURRELL ET AL. 31

Hurrell, J. W., Decadal trends in the North Atlantic oscillation:Regional temperatures and precipitation, Science, 269, 676–679,1995a.
Hurrell, J. W., An evaluation of the transient eddy forced vorticitybalance during northern winter, J. Atmos. Sci., 52, 2286–2301,1995b.
Hurrell, J. W., Influence of variations in extratropical wintertimeteleconnections on Northern Hemisphere temperature, Geophys.Res. Lett., 23, 665–668, 1996.
Hurrell, J. W., and C. K. Folland, A change in the summer atmos-pheric circulation over the North Atlantic, CLIVAR Exchanges,25, 52–54, 2002.
Hurrell, J. W., and K. E. Trenberth, Satellite versus surface estimatesof air temperature since 1979. J. Climate, 9, 2222–2232, 1996.
Hurrell, J. W., and H. van Loon, Decadal variations in climate asso-ciated with the North Atlantic Oscillation, Climatic Change, 36,301–326, 1997.
Hurrell, J. W., M. P. Hoerling, and C. K. Folland, Climatic vari-ability over the North Atlantic. Meteorology at the Millennium.R. Pearce, Ed., Academic Press, London, 143–151, 2001.
Hurrell, J. W., C. Deser, C. K. Folland, and D. P. Rowell, The rela-tionship between tropical Atlantic rainfall and the summer cir-culation over the North Atlantic. Proc. U. S. CLIVAR Atlanticmeeting, D. Legler, Ed., Boulder, CO., 108–110, 2002.
James, I. N., and P. M. James, Spatial structure of ultra-low fre-quency variability of the flow in a simple atmospheric circu-lation model, Quart. J. Roy. Meteor. Soc., 118, 1211–1233,1992.
Jin F., A theory of interdecadal climate variability of the North PacificOcean-atmosphere system, J. Climate, 10, 1821–1835, 1997.
Jones, P. D., T. Jónsson, and D. Wheeler, Extension to the NorthAtlantic Oscillation using early instrumental pressure observa-tions from Gibraltar and south-west Iceland, Int. J. Climatol.,17, 1433–1450, 1997.
Jones, P. D., T. J. Osborn, and K. R. Briffa, The evolution of cli-mate over the last millennium, Science, 292, 662–667, 2001.
Jones, P. D., T. J. Osborn, and K. R. Briffa, Pressure-based meas-ures of the North Atlantic Oscillation (NAO): A comparison andan assessment of changes in the strength of the NAO and in itsinfluence on surface climate parameters, this volume.
Kalnay, E., et al. The NCEP/NCAR 40-year reanalysis project,Bull. Amer. Meteor. Soc., 77, 437-471, 1996.
Kelly, P. M., P. D. Jones, and J. I. A. Pengquin, The spatial responseof the climate system to explosive volcanic eruptions, Intl. J.Climatol., 16, 537–550, 1996.
Kerr, R. A., A new force in high-latitude climate Science, 284,241–242, 1999.
Kiladis, G. N., and K. C. Mo, Interannual and intraseasonal vari-ability in the Southern Hemisphere, in Meteorology of theSouthern Hemisphere, D. J. Karoly and D. G. Vincent, Eds.,Meteorological Monographs, 49, American MeteorologicalSociety, Boston, MA, 1–46, 1998.
Kitoh, A., H. Doide, K. Kodera, S. Yukimoto, and A. Noda,Interannual variability in the stratospheric- tropospheric circula-tion in a coupled ocean-atmosphere GCM. Geophys. Res. Lett.,23, 543-546, 1996.
Klein, S. A., B. J. Soden, and N.-C. Lau, Remote sea surface tem-perature variations during ENSO: Evidence for a tropical atmos-pheric bridge, J. Climate, 12, 917–932, 1999.
Kodera, K., Influence of volcanic eruptions on the tropospherethrough stratospheric dynamical processes in the northern hemi-sphere winter, J. Geophys. Res., 99, 1273–1282, 1994.
Kodera, K., M. Chiba, H. Koide, A. Kitoh, and Y. Nikaidou Y,Interannual variability of the winter stratosphere and tropo-sphere in the Northern Hemisphere, J. Meteorol. Soc. Jpn., 74,365–382, 1996.
Krahmann, G., M. Visbeck, and G. Reverdin, Formation and prop-agation of temperature anomalies along the North AtlanticCurrent, J. Phys. Oceanogr., 31, 1287–1303, 2001.
Kushnir, Y., Interdecadal variations in North Atlantic sea surfacetemperature and associated atmospheric conditions, J. Climate,7, 142–157, 1994.
Kushnir, Y., Pacific North American pattern. In Encyclopedia ofEnvironmental Change, in press, 2002.
Kushnir, Y., and I. Held, Equilibrium atmospheric responses toNorth Atlantic SST anomalies, J. Climate, 9, 1208–1220, 1996.
Kushnir, Y., and J. M. Wallace, Low frequency variability in theNorthern Hemisphere winter: Geographical distribution, struc-ture and time dependence, J. Atmos. Sci., 46, 3122–3142, 1989.
Kushnir, Y., V. J. Cardone, J. G. Greenwood, and M. Cane, On therecent increase in North Atlantic wave heights, J. Climate, 10,2107–2113, 1997.
Kushnir, Y., W. A. Robinson, I. Bladé, N. M. J. Hall, S. Peng, and R.T. Sutton, Atmospheric GCM response to extratropical SSTanomalies: Synthesis and evaluation, J. Climate, 15, 2233–2256,2002.
Kutzbach, J. E., Large-scale features of monthly mean NorthernHemisphere anomaly maps of sea-level pressure Mon. Wea.Rev., 98, 708–716, 1970.
Lamb, H. H., British Isles weather types and a register of the dailysequence of circulation patterns, Geophysical Memoirs, Vol. 16,116, 85 pp, 1972.
Latif, M., and T. P. Barnett, Decadal climate variability over theNorth Pacific and North America: dynamics and predictability,J. Climate, 9, 2407–2423, 1996.
Leith, C. E., The standard error of time-averaged estimates of cli-matic means, J. Appl. Meteor., 12, 1066–1069, 1973.
Lorenz, E. N., Seasonal and irregular variations of the NorthernHemisphere sea-level pressure profile, J. Meteorol., 8, 52–59, 1951.
Lorenz, E. N., Deterministic nonperiodic flow, J. Atmos. Sci., 20,130–141, 1963.
Lu, J., and R. J. Greatbatch, The changing relationship between theNAO and Northern Hemisphere climate variability, Geophys.Res. Lett., 29, 10.1029/2001GL014052, 2002.
Luterbacher, J., et al. Extending North Atlantic Oscillation recon-structions back to 1500, Atmos. Sci. Lett., 2, 114-124,10.1006/asle.2001.0044, 2002.
Madden, R. A., Estimates of the natural variability of time-aver-aged sea-level pressure, Mon. Wea. Rev., 104, 942–952, 1976.
Manabe, S., and R. Stouffer, Low frequency variability of surfaceair temperature in a 1000-year integration of a coupled ocean-atmosphere-land model, J. Climate, 9, 376–393, 1996.
32 OVERVIEW OF THE NAO

Mann, M. E., R. S. Bradley, and M. K. Hughes, NorthernHemisphere temperatures during the past millennium:Inferences, uncertainties, and limitations, Geophys. Res. Lett.,26, 759–762, 1999.
Mathieu, P.-P., R. T. Sutton, and B. W. Dong, Impact of individualEl Niño events on the North Atlantic European region, CLIVARExchanges, 25, 49–51, 2002.
Mehta, V., M. Suarez, J. V. Manganello, and T. D. Delworth,Oceanic influence on the North Atlantic Oscillation and associ-ated Northern Hemisphere climate variations: 1959–1993,Geophys. Res. Lett., 27, 121–124, 2000.
Michelangeli, P. A., R. Vautard, and B. Legras, Weather regimeoccurrence and quasi stationarity, J. Atmos. Sci., 52, 1237–1256,1995.
Monahan, A. H., J. C. Fyfe, and G. M. Flato, A regime view ofnorthern hemisphere atmospheric variability and change underglobal warming, Geophys. Res. Lett., 27, 1139–1142, 2000.
Monahan, A. H., L. Pandolfo, and J. C. Fyfe, The preferred struc-ture of variability of the Northern Hemisphere atmospheric cir-culation, Geophys. Res. Lett., 28, 1019–1022, 2001.
Moses, T., G. N. Kiladis, H. F. Diaz, and R. G. Barry,Characteristics and frequency reversals in mean sea level pres-sure in the North Atlantic sector and their relationships to long-term temperature trends, J. Climatol., 7, 13–30, 1987.
Mysterud, A., N. C. Stenseth, N. G. Yoccoz, G. Ottersen, and R.Langvatn, The response of terrestrial ecosystems to climate vari-ability associated with the North Atlantic Oscillation, this volume.
Nakamura, H., 1996: Year-to-year and interdecadal variability inthe activity of intraseasonal fluctuations in the Northern Hemispherewintertime circulation. Theor. Appl. Climatol., 55, 19-32.
Namias, J., The index cycle and its role in the general circulation,J. Meteorol., 7, 130–139, 1950.
North, G. R., T. L. Bell, R. F. Cahalan, and F. J. Moeng, Samplingerrors in the estimation of empirical orthogonal functions, Mon.Wea. Rev., 110, 699–706, 1982.
Osborn, T. J., The winter North Atlantic oscillation: roles of inter-nal variability and greenhouse gas forcing, CLIVAR Exchanges,25, 54–57, 2002.
Osborn, T. J., K. R. Briffa, S. F. B. Tett, P. D. Jones, and R. M.Trigo, Evaluation of the North Atlantic oscillation as simulatedby a climate model, Clim. Dyn., 15, 685–702, 1999.
Ottersen, G., B. Planque, A. Belgrano, E. Post, P. C. Reid, and N.C. Stenseth, Ecological effects of the North Atlantic Oscillation,Oecologia, 128, 1–14, 2001.
Ottersen, G., and N. C. Stenseth, Atlantic climate governs oceano-graphic and ecological variability in the Barents Sea, Limn.Ocean., 46, 1774-1780, 2001.
Palmer, T. N., A nonlinear dynamical perspective on climate pre-diction, J. Climate, 12, 575–591, 1999.
Palmer, T. N., and Z. Sun, A modeling and observational study ofthe relationship between sea surface temperature in the northwest Atlantic and the atmospheric general circulation, Quart. J.Roy. Meteor. Soc., 111, 947–975, 1985.
Peng, S., and J. S. Whitaker, Mechanisms determining the atmos-pheric response to midlatitude SST anomalies, J. Climate, 12,1393–1408, 1999.
Peng, S., A. Mysak, H. Ritchie, J. Derome, and B. Dugas, The dif-ference between early and middle winter atmospheric responseto sea surface temperature anomalies in the northwest Atlantic,J. Climate, 8, 137–157, 1995.
Peng, S., W. A. Robinson, and M. P. Hoerling, The modeled atmos-pheric response to midlatitude SST anomalies and its depend-ence on background circulation states, J. Climate, 10, 971–987,1997.
Peng, S., W. A. Robinson, and S. Li, North Atlantic SST forcing ofthe NAO and relationships with intrinsic hemispheric variabili-ty, Geophys. Res. Lett., 29(8), 10.1029/2001GL014043, 2002.
Perlwitz, J., and H. -F. Graf, The statistical connection between tro-pospheric and stratospheric circulation of the NorthernHemisphere in winter, J. Climate, 8, 2281–2295, 1995.
Peterson, K. A., R. J. Greatbatch, J. Lu, H. Lin, and J. Derome,Hindcasting the NAO using diabatic forcing of a simple AGCM,Geophys. Res. Lett., 29, 10.1029/2001GL014502, 2002.
Portis, D. H., J. E. Walsh, M. El Hamly, and P. J. Lamb, Seasonalityof the North Atlantic Oscillation, J. Climate, 14, 2069-2078,2001.
Pozo-Vázquez, D., M. J. Esteban-Parra, F. S. Rodrigo, and Y.Castro-Díez, The association between ENSO and winter atmos-pheric circulation and temperature in the North Atlantic region,J. Climate, 14, 3408–3420, 2001.
Rajagolapan, B., Y. Kushnir, and Y. Tourre, Observed decadal mid-latitude and tropical Atlantic climate variability, Geophys. Res.Lett., 25, 3967–3970, 1998.
Randel, W. J., and F. Wu, Cooling of the Arctic and Antarctic polarstratospheres due to ozone depletion, J. Climate, 12, 1467-1479,1999.
Robertson, A. W., C. R. Mechoso, and Y. J. Kim, The influence ofAtlantic sea surface temperature anomalies on the North AtlanticOscillation, J. Climate, 13, 122–138, 2000.
Robinson, W. A, Review of WETS-The workshop on extra-tropi-cal SST anomalies. Bull. Am. Meteorol. Soc., 81, 567–577, 2000.
Robock, A., and J. P. Mao, Winter warming from large volcaniceruptions, Geophys. Res. Lett., 19, 2405–2408, 1992.
Rodwell, M. J., On the predictability of North Atlantic climate, thisvolume.
Rodwell, M. J., D. P. Rowell, and C. K. Folland, Oceanic forcingof the wintertime North Atlantic Oscillation and European cli-mate, Nature, 398, 320–323, 1999.
Rogers, J. C., Spatial variability of seasonal sea-level pressure and500-mb height anomalies, Mon. Wea. Rev., 109, 2093–2106, 1981.
Rogers, J. C., The association between the North AtlanticOscillation and the Southern Oscillation in the NorthernHemisphere, Mon. Wea. Rev., 112, 1999–2015, 1984.
Rogers, J. C., Patterns of low-frequency monthly sea level pressurevariability (1899-1986) and associated wave cyclone frequen-cies, J. Climate, 3, 1364–1379, 1990.
Rogers, J. C., North Atlantic storm track variability and its associ-ation to the North Atlantic Oscillation and climate variability ofNorthern Europe, J. Climate, 10, 1635–1645, 1997.
Saravanan, R., and P. Chang, Interaction between tropical Atlanticvariability and El Niño-Southern Oscillation, J. Climate, 13,2177–2194, 2000.
HURRELL ET AL. 33
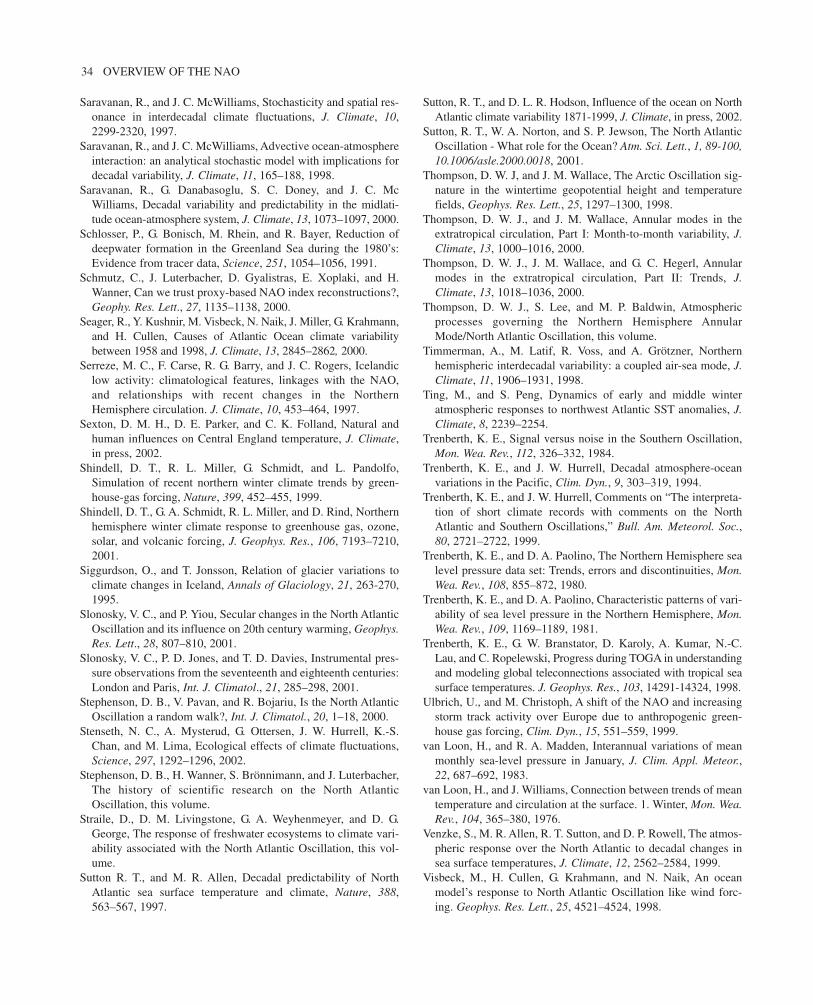
Saravanan, R., and J. C. McWilliams, Stochasticity and spatial res-onance in interdecadal climate fluctuations, J. Climate, 10,2299-2320, 1997.
Saravanan, R., and J. C. McWilliams, Advective ocean-atmosphereinteraction: an analytical stochastic model with implications fordecadal variability, J. Climate, 11, 165–188, 1998.
Saravanan, R., G. Danabasoglu, S. C. Doney, and J. C. McWilliams, Decadal variability and predictability in the midlati-tude ocean-atmosphere system, J. Climate, 13, 1073–1097, 2000.
Schlosser, P., G. Bonisch, M. Rhein, and R. Bayer, Reduction ofdeepwater formation in the Greenland Sea during the 1980’s:Evidence from tracer data, Science, 251, 1054–1056, 1991.
Schmutz, C., J. Luterbacher, D. Gyalistras, E. Xoplaki, and H.Wanner, Can we trust proxy-based NAO index reconstructions?,Geophy. Res. Lett., 27, 1135–1138, 2000.
Seager, R., Y. Kushnir, M. Visbeck, N. Naik, J. Miller, G. Krahmann,and H. Cullen, Causes of Atlantic Ocean climate variabilitybetween 1958 and 1998, J. Climate, 13, 2845–2862, 2000.
Serreze, M. C., F. Carse, R. G. Barry, and J. C. Rogers, Icelandiclow activity: climatological features, linkages with the NAO,and relationships with recent changes in the NorthernHemisphere circulation. J. Climate, 10, 453–464, 1997.
Sexton, D. M. H., D. E. Parker, and C. K. Folland, Natural andhuman influences on Central England temperature, J. Climate,in press, 2002.
Shindell, D. T., R. L. Miller, G. Schmidt, and L. Pandolfo,Simulation of recent northern winter climate trends by green-house-gas forcing, Nature, 399, 452–455, 1999.
Shindell, D. T., G. A. Schmidt, R. L. Miller, and D. Rind, Northernhemisphere winter climate response to greenhouse gas, ozone,solar, and volcanic forcing, J. Geophys. Res., 106, 7193–7210,2001.
Siggurdson, O., and T. Jonsson, Relation of glacier variations toclimate changes in Iceland, Annals of Glaciology, 21, 263-270,1995.
Slonosky, V. C., and P. Yiou, Secular changes in the North AtlanticOscillation and its influence on 20th century warming, Geophys.Res. Lett., 28, 807–810, 2001.
Slonosky, V. C., P. D. Jones, and T. D. Davies, Instrumental pres-sure observations from the seventeenth and eighteenth centuries:London and Paris, Int. J. Climatol., 21, 285–298, 2001.
Stephenson, D. B., V. Pavan, and R. Bojariu, Is the North AtlanticOscillation a random walk?, Int. J. Climatol., 20, 1–18, 2000.
Stenseth, N. C., A. Mysterud, G. Ottersen, J. W. Hurrell, K.-S.Chan, and M. Lima, Ecological effects of climate fluctuations,Science, 297, 1292–1296, 2002.
Stephenson, D. B., H. Wanner, S. Brönnimann, and J. Luterbacher,The history of scientific research on the North AtlanticOscillation, this volume.
Straile, D., D. M. Livingstone, G. A. Weyhenmeyer, and D. G.George, The response of freshwater ecosystems to climate vari-ability associated with the North Atlantic Oscillation, this vol-ume.
Sutton R. T., and M. R. Allen, Decadal predictability of NorthAtlantic sea surface temperature and climate, Nature, 388,563–567, 1997.
Sutton, R. T., and D. L. R. Hodson, Influence of the ocean on NorthAtlantic climate variability 1871-1999, J. Climate, in press, 2002.
Sutton, R. T., W. A. Norton, and S. P. Jewson, The North AtlanticOscillation - What role for the Ocean? Atm. Sci. Lett., 1, 89-100,10.1006/asle.2000.0018, 2001.
Thompson, D. W. J, and J. M. Wallace, The Arctic Oscillation sig-nature in the wintertime geopotential height and temperaturefields, Geophys. Res. Lett., 25, 1297–1300, 1998.
Thompson, D. W. J., and J. M. Wallace, Annular modes in theextratropical circulation, Part I: Month-to-month variability, J.Climate, 13, 1000–1016, 2000.
Thompson, D. W. J., J. M. Wallace, and G. C. Hegerl, Annularmodes in the extratropical circulation, Part II: Trends, J.Climate, 13, 1018–1036, 2000.
Thompson, D. W. J., S. Lee, and M. P. Baldwin, Atmosphericprocesses governing the Northern Hemisphere AnnularMode/North Atlantic Oscillation, this volume.
Timmerman, A., M. Latif, R. Voss, and A. Grötzner, Northernhemispheric interdecadal variability: a coupled air-sea mode, J.Climate, 11, 1906–1931, 1998.
Ting, M., and S. Peng, Dynamics of early and middle winteratmospheric responses to northwest Atlantic SST anomalies, J.Climate, 8, 2239–2254.
Trenberth, K. E., Signal versus noise in the Southern Oscillation,Mon. Wea. Rev., 112, 326–332, 1984.
Trenberth, K. E., and J. W. Hurrell, Decadal atmosphere-oceanvariations in the Pacific, Clim. Dyn., 9, 303–319, 1994.
Trenberth, K. E., and J. W. Hurrell, Comments on “The interpreta-tion of short climate records with comments on the NorthAtlantic and Southern Oscillations,” Bull. Am. Meteorol. Soc.,80, 2721–2722, 1999.
Trenberth, K. E., and D. A. Paolino, The Northern Hemisphere sealevel pressure data set: Trends, errors and discontinuities, Mon.Wea. Rev., 108, 855–872, 1980.
Trenberth, K. E., and D. A. Paolino, Characteristic patterns of vari-ability of sea level pressure in the Northern Hemisphere, Mon.Wea. Rev., 109, 1169–1189, 1981.
Trenberth, K. E., G. W. Branstator, D. Karoly, A. Kumar, N.-C.Lau, and C. Ropelewski, Progress during TOGA in understandingand modeling global teleconnections associated with tropical seasurface temperatures. J. Geophys. Res., 103, 14291-14324, 1998.
Ulbrich, U., and M. Christoph, A shift of the NAO and increasingstorm track activity over Europe due to anthropogenic green-house gas forcing, Clim. Dyn., 15, 551–559, 1999.
van Loon, H., and R. A. Madden, Interannual variations of meanmonthly sea-level pressure in January, J. Clim. Appl. Meteor.,22, 687–692, 1983.
van Loon, H., and J. Williams, Connection between trends of meantemperature and circulation at the surface. 1. Winter, Mon. Wea.Rev., 104, 365–380, 1976.
Venzke, S., M. R. Allen, R. T. Sutton, and D. P. Rowell, The atmos-pheric response over the North Atlantic to decadal changes insea surface temperatures, J. Climate, 12, 2562–2584, 1999.
Visbeck, M., H. Cullen, G. Krahmann, and N. Naik, An oceanmodel’s response to North Atlantic Oscillation like wind forc-ing. Geophys. Res. Lett., 25, 4521–4524, 1998.
34 OVERVIEW OF THE NAO

Visbeck, M., E. .P. Chassignet, R. G. Curry, T. L. Delworth, R. R.Dickson, and G. Krahmann, The ocean’s response to NorthAtlantic Oscillation variability, this volume.
Volodin, E. M., and V. Y. Galin, Interpretation of winter warmingon Northern Hemisphere continents in 1977-94, J. Climate, 12,2947–2955, 1999.
Walker, G. T., and E. W. Bliss, World Weather V, Mem. Roy. Met.Soc., 4, 53–84, 1932.
Wallace, J. M., Observed climate variability: Spatial structure, inDecadal Variability and Climate, D.L.T. Anderson and J.Willebrand, Eds., Springer, Berlin, 31–81, 1996.
Wallace, J. M., North Atlantic Oscillation/annular mode: Two par-adigms - one phenomenon, Quar. J. Roy. Meteorol. Soc., 126,791–805, 2000.
Wallace, J. M., and D. S. Gutzler, Teleconnections in the geopo-tential height field during the Northern Hemisphere winter, Mon.Wea. Rev., 109, 784–812, 1981.
Wallace, J. M., and D. W. J. Thompson, The Pacific center ofaction of the Northern Hemisphere Annular Mode: Real or arti-fact?, J. Climate, 15, 1987-1991, 2002.
Wallace, J. M., Y. Zhang, and K.-H. Lau, Structure and seasonali-ty of interannual and interdecadal variability of geopotentialheight and temperature fields in the Northern Hemisphere tro-posphere, J. Climate, 6, 2063–2082, 1993.
Wallace, J. M., Y. Zhang, and J. A. Renwick, Dynamic contributionto hemispheric mean temperature trends, Science, 270, 780–783,1995.
Walther, G.-R., E. Post, P. Convey, A. Menzel, C. Parmesan, T. J.C. Beebee, J.-M. Fromentin, O. Hoegh-Guldberg, and F.Bairlein, Ecological responses to recent climate change, Nature,416, 389–395, 2002.
Wanner, H., S. Brönnimann, C. Casty, D. Gyalistras, J.Luterbacher, C. Schmutz, D. B. Stephenson, and E. Xoplaki,North Atlantic Oscillation- concepts and studies, SurveyGeophys., 22, 321–381, 2001.
Watanabe, M. and T. Nitta, Relative impact of snow and sea sur-face temperature anomalies on an extreme phase in the winteratmospheric circulation, J. Climate, 11, 2837-2857, 1998
Watanabe, M. and T. Nitta, Decadal changes in the atmospheric cir-culation and associated surface climate variations in theNorthern Hemisphere winter, J. Climate, 12, 494-510, 1999.
Weng, W., and J. D. Neelin, On the role of ocean-atmosphere inter-action in midlatitude interdecadal variability, Geophys. Res.Lett., 25, 167–170, 1998.
Wunsch C., The interpretation of short climate records, with com-ments on the North Atlantic Oscillation and SouthernOscillations, Bull. Am. Meteorol. Soc., 80, 245–255, 1999.
Xie, S.-P., and Y. Tanimoto, A pan-Atlantic decadal climate oscil-lation, Geophys. Res. Lett., 25, 2185–2188, 1998.
____________James W. Hurrell, National Center for Atmospheric Research,
Climate Analysis Section, P. O. Box 3000, Boulder, CO 80307-3000, [email protected]
Yochanan Kushnir, Lamont-Doherty Earth Observatory ofColumbia University, 61 Route 9W, Palisades, New York, 10964,[email protected]
Geir Ottersen, Institute of Marine Research, P.O. Box 1870Nordnes, 5817 Bergen, Norway Current address:
Department of Biology, Division of Zoology, University ofOslo, P.O. Box 1050 Blindern, N-0316 Oslo, Norway [email protected]
Martin Visbeck, Lamont-Doherty Earth Observatory ofColumbia University, Department of Earth and EnvironmentalSciences, 204D Oceanography, 61 Route 9W, Palisades, NewYork, 10964, [email protected]
HURRELL ET AL. 35