an investigation of the motives in going-private
TRANSCRIPT

Louisiana State UniversityLSU Digital Commons
LSU Historical Dissertations and Theses Graduate School
1997
An Investigation of the Motives in Going-PrivateTransactions: The Case of Re-LBOs.Arman KosedagLouisiana State University and Agricultural & Mechanical College
Follow this and additional works at: https://digitalcommons.lsu.edu/gradschool_disstheses
This Dissertation is brought to you for free and open access by the Graduate School at LSU Digital Commons. It has been accepted for inclusion inLSU Historical Dissertations and Theses by an authorized administrator of LSU Digital Commons. For more information, please [email protected].
Recommended CitationKosedag, Arman, "An Investigation of the Motives in Going-Private Transactions: The Case of Re-LBOs." (1997). LSU HistoricalDissertations and Theses. 6429.https://digitalcommons.lsu.edu/gradschool_disstheses/6429

INFORMATION TO USERS
This manuscript has been reproduced from the microfilm master. UMI
films the text directly from the original or copy submitted. Thus, some
thesis and dissertation copies are in typewriter face, while others may be
from any type of computer printer.
The quality of this reproduction is dependent upon the quality of the copy submitted. Broken or indistinct print, colored or poor quality
illustrations and photographs, print bleedthrough, substandard margins,
and improper alignment can adversely afreet reproduction.
In the unlikely event that the author did not send UMI a complete
manuscript and there are missing pages, these will be noted. Also, if
unauthorized copyright material had to be removed, a note will indicate
the deletion.
Oversize materials (e.g., maps, drawings, charts) are reproduced by
sectioning the original, beginning at the upper left-hand comer and
continuing from left to right in equal sections with small overlaps. Each
original is also photographed in one exposure and is included in reduced
form at the back of the book.
Photographs included in the original manuscript have been reproduced
xerographically in this copy. Higher quality 6” x 9” black and white
photographic prints are available for any photographs or illustrations
appearing in this copy for an additional charge. Contact UMI directly to
order.
UMIA Bell & Howell Information Company
300 North Zeeb Road, Ann Arbor MI 48106-1346 USA 313/761-4700 800/521-0600
Reproduced with permission of the copyright owner. Further reproduction prohibited without permission.

Reproduced with permission of the copyright owner. Further reproduction prohibited without permission.

AN INVESTIGATION OF THE MOTIVES IN GOING-PRIVATE TRANSACTIONS: THE CASE OF Re-LBOs
A Dissertation
Submitted to the Graduate Faculty of the Louisiana State University and
Agricultural and Mechanical College in partial fulfillment of the
requirements for the degree of Doctor of Philosophy
in
The Interdepartmental Programs in Business Administration
byArman Kosedag
B.S., Istanbul University, 1986 M.S., Louisiana State University, 1990
May 1997
Reproduced with permission of the copyright owner. Further reproduction prohibited without permission.

UMI Number: 9736024
UMI Microform 9736024 Copyright 1997, by UMI Company. All rights reserved.
This microform edition is protected against unauthorized copying under Title 17, United States Code.
UMI300 North Zeeb Road Ann Arbor, MI 48103
Reproduced with permission of the copyright owner. Further reproduction prohibited without permission.

ACKNOWLEDGMENTS
Throughout the completion of this dissertation, I have, one way or another, benefited from the contributions of many people in various forms. This fact, however, does not free me from assuming the responsibility of any error that may still be present. The members of my dissertation committee, Profs. G. Geoffrey Booth, Faik Koray, and William R. Lane, must be distinguished by their direct contributions to this project in the form of invaluable comments and suggestions. Also among direct contributors are Ms. Yvonne L. Day who did an excellent editing job in putting together such a gigantic text, and Mr. David Kwateng and Prof. Chris J. Muscarella who kindly assisted in constructing the data set.
I have a particular debt of gratitude to Prof. George M. Frankfurter, the chairman of the committee, not only for his generosity in sharing his knowledge and experience that reshaped my area of interest in Finance but also for his encouragement, patience, and faith during the completion of this task. As such, he remains the only person whose contributions to my accomplishment are both direct and indirect.
A wonderful circle of family and friends share the indirect, but unquestionably the most important, contributions made to this dissertation. I would like to thank my sister, my brother and his spouse, and my parents for their
ii
Reproduced with permission of the copyright owner. Further reproduction prohibited without permission.

persistence in supporting me with love, understanding, and sacrifices, and my wife for always standing by me. Finally, I would like to dedicate this work to the memory of my grandfather, Ni§an Koseda£j, who not only taught me to love but also taught me many lessons of life that cannot be learned in the most prestigious universities of the world, and to my daughter, Nadin Melissa K5seda§, who refreshed the meaning of love.
iii
Reproduced with permission of the copyright owner. Further reproduction prohibited without permission.

TABLE OF CONTENTSACKNOWLEDGEMENTS................................. iiLIST OF TABLES................................... viiLIST OF FIGURES................................... ixABSTRACT ......................................... XCHAPTER
1 INTRODUCTION AND PURPOSE................. I1.1 Notes to chapter 1 ...................... 5
2 LITERATURE REVIEW........................ 72.1 Characteristics of going-private
transactions........................ 72.2 Explanations for leveraged buyouts (LBOs). . 92.2.1 Cost savings on shareholder relations. . . . 92.2.2 Tax savings.............................. 102.2.3 Wealth transfer from bondholders......... 122.2.4 Management incentives and performance
improvement s........................ 132.2.5 Free cash flow hypothesis................. 162.2.6 Undervaluation of the firm's stock....... 192.2.7 Management manipulation hypothesis ....... 202.3 Reverse leveraged buyouts................ 222.3.1 Characteristics and performance
of reverse LBOs.................... 222.3.2 Decision to return to public markets . . . . 252.4 Conclusion............................. 262.5 Notes to chapter 2 ...................... 27
3 AN APPLICATION OF THE FREE CASH FLOWHYPOTHESIS TO Re-LBOs.................... 29
3.1 Introduction............................ 293.2 Free cash flows and LBOs (HI)............. 313.2.1 The Lehn and Poulsen study............... 313.3 Discussion of method of analysis
and proxy variables................. 333.3.1 Logit analysis.......................... 333.3.2 Bootstrap algorithm for statistical
significance tests................... 373.3.3 Ordinary least-squares regression......... 383.4 Empirical findings...................... 393.4.1 Re-LBO sample characteristics............. 393.4.2 The announcement effect of second LBO
transactions: an event study......... 42
iv
Reproduced with permission of the copyright owner. Further reproduction prohibited without permission.

3.4.3 Comparison of the effect of re-LBOannouncements with the effect of LBO announcements documented in previous studies........................... 46
3.4.4 A preliminary comparison of re-LBO andcontrol samples .................... 48
3.4.5 Determinants of the likelihood of goingprivate: logit analysis ............. 51
3.4.6 Determinants of the premiums paidin going-private transactions:ordinary least-sguares analysis . . . . 53
3.5 A comparison of results obtainedfrom the re-LBO sample withLehn and Poulsen's results........... 57
3.6 Chapter summary and conclusion .......... 593.7 Notes to chapter 3 ...................... 61
4 MANAGEMENT'S PERCEPTION OF BUYOUTS:A SURVEY............................... 63
4.1 Introduction........................... 634.2 The undervaluation hypothesis (H2)....... 664.2.1 Questionnaire design.................... 664.2.2 Construction of the survey sample........ 724.3 Results and discussion.................. 744.3.1 Factor analysis and clustering .......... 834.3.2 LBO group versus reverse LBO group....... 934.3.3 Buyout decisions in value versus
glamour stocks...................... 974.4 Chapter summary and conclusion .......... 1004.5 Notes to chapter 4 ..................... 102
5 UNDERVALUATION AS AN INCENTIVE FOR LBOs:HYPOTHESES TESTS USING MARKET DATA 105
5.1 Introduction 1055.2 Reverse LBO sample characteristics 1065.3 The profit motive in the reverse LBO (H3). . 1095.3.1 Implications of H 3 ...................... 1105.3.2 A discussion of the proxy variable....... Ill5.3.3 The control sample.............. 1135.3.4 Empirical test of H 3 .................... 1155.3.5 An extension of H3: Industry hypothesis. . . 1165.3.6 Empirical test of industry hypothesis. . . . 1175.3.7 Results and discussion.................. 1195.4 Application of learning curve concept
to LBOs........................... 1205.4.1 The learning curve hypothesis (H4)....... 1215.4.2 Empirical findings and discussion of H4. . . 1215.4.3 The sharing of wealth between pre- and
post-buyout shareholders (H5) ....... 1235.4.4 Empirical findings and discussion of H5. . . 124
v
Reproduced with permission of the copyright owner. Further reproduction prohibited without permission.

5.4.5 Premiums paid to pre-buyoutshareholders in the first andthe second buyouts (H6)............. 125
5.4.6 Empirical findings and discussion of H6. . . 1265.5 Chapter summary and conclusion........... 1275.6 Notes to chapter 5 ...................... 129
6 SUMMARY AND CONCLUSION .................. 130
REFERENCES....................................... 133APPENDIX......................................... 139VITA............................................ 141
vi
Reproduced with permission of the copyright owner. Further reproduction prohibited without permission.
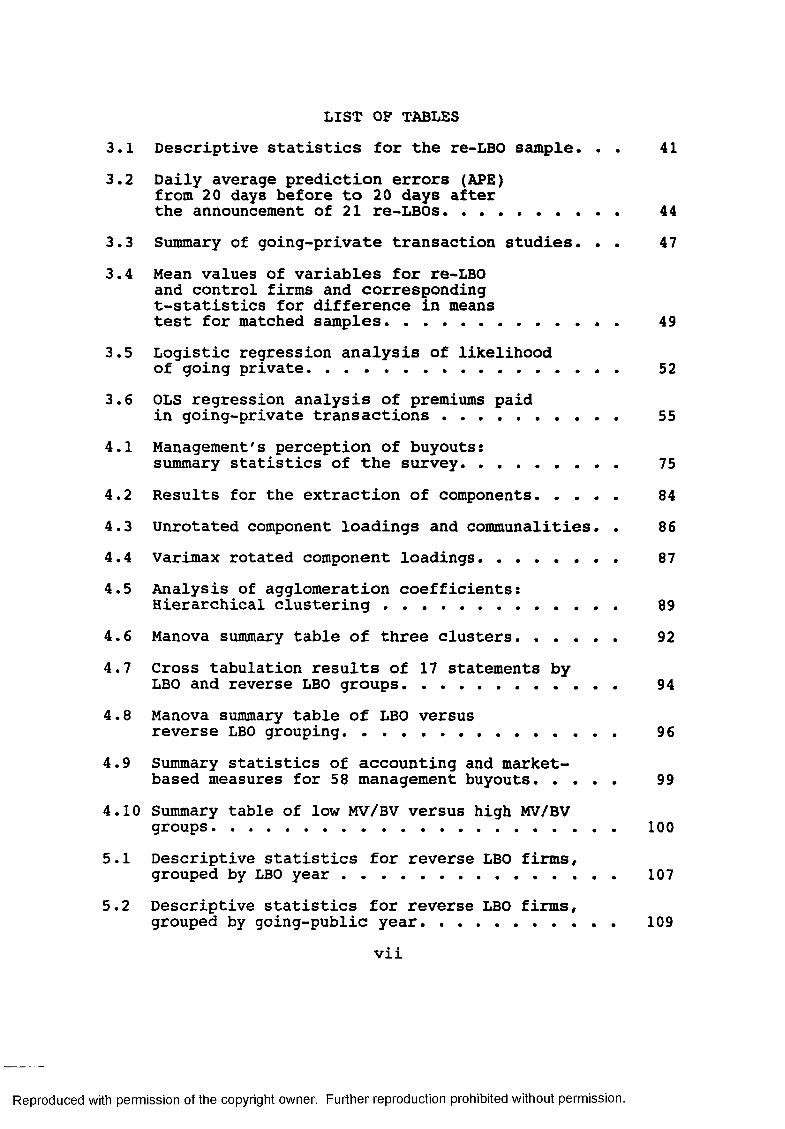
LIST OF TABLES3.1 Descriptive statistics for the re-LBO sample. . . 413.2 Daily average prediction errors (APE)
from 20 days before to 20 days afterthe announcement of 21 re-LBOs................ 44
3.3 Summary of going-private transaction studies. . . 473.4 Mean values of variables for re-LBO
and control firms and corresponding t-statistics for difference in meanstest for matched samples...................... 49
3.5 Logistic regression analysis of likelihoodof going private.............................. 52
3.6 OLS regression analysis of premiums paidin going-private transactions................ 55
4.1 Management's perception of buyouts:summary statistics of the survey............... 75
4.2 Results for the extraction of components....... 844.3 Unrotated component loadings and communalities. . 864.4 Varimax rotated component loadings............. 874.5 Analysis of agglomeration coefficients:
Hierarchical clustering ...................... 894.6 Manova summary table of three clusters......... 924.7 Cross tabulation results of 17 statements by
LBO and reverse LBO groups.................... 944.8 Manova summary table of LBO versus
reverse LBO grouping.......................... 964.9 Summary statistics of accounting and market-
based measures for 58 management buyouts........ 994.10 Summary table of low MV/BV versus high MV/BV
groups...................................... 1005.1 Descriptive statistics for reverse LBO firms,
grouped by LBO year.......................... 1075.2 Descriptive statistics for reverse LBO firms,
grouped by going-public year.................. 109vii
Reproduced with permission of the copyright owner. Further reproduction prohibited without permission.

5.3 Mean reverse LBO buyout value andmean control firm market value................. 114
5.4 Performance tests for the reverse LBO firms . . . 1165.5 Industrial distribution of 104 reverse
LBO firms................................... 1185.6 Mean values of performance variables:
An industrial comparison...................... 1205.7 Comparison of value gains for re>LBOs
and successful reverse LBO firms............... 1235.8 Comparison of management's return and
shareholders' return in reverse LBOtransactions................................. 125
5.9 Comparison of [-20/+20] window CAPEs forfirst and second LBO announcements............. 127
Reproduced with permission of the copyright owner. Further reproduction prohibited without permission.

LIST OF FIGURES3.1 Cumulative average prediction errors
for the [-20,+20] event window................ 454.1 Scree curve of eigen values.................. 855.1 Time table of a reverse L B O.................. 112
ix
Reproduced with permission of the copyright owner. Further reproduction prohibited without permission.

ABSTRACTThe commonly understood and traditional forms of termination for a public firm are the takeover and bankruptcy. "Going private" is a new and interesting third alternative. once the "going public" option— a significant number of observed reverse leveraged buyout (LBO) cases— is taken into account, however, the fundamental difference between this newalternative and traditional ways becomes apparent. Even more fascinating than the "public-to-private private-to- public" move is the fact that some companies go private again.
This dissertation examines the phenomenon of re-LBOs; that is, the practice of going private via management buyout, then reobtaining public status through a new initial public offering, and then going private a second time. Thedissertation encompasses various dimensions that should, in addition to explaining re-LBOs, provide new evidence for existing theories of going-private transactions.
First, the dissertation investigates the applicability of the leading theoretical and empirical issues of LBOs to a re- LBO sample, thus providing a comparative analysis of LBOs and re-LBOs. Specifically, it challenges the free cash flowargument of LBOs by replicating the Lehn and Poulsen (1989) study of going-private transactions with the re-LBO sample.
Second, the dissertation proposes an information asymmetry hypothesis to going-private transactions. This part
x
Reproduced with permission of the copyright owner. Further reproduction prohibited without permission.

of the dissertation reports the results of a survey of the views of management in 600 LBOs. The results of the survey are substantiated by tests of a set of hypotheses that exploit either reverse LBO or re-LBO samples to provide additional statistical evidence on the information asymmetry issue. Although reverse LBOs have been examined in the finance literature to some degree, the use of re-LBO firms to study management buyouts is original.
xi
Reproduced with permission of the copyright owner. Further reproduction prohibited without permission.
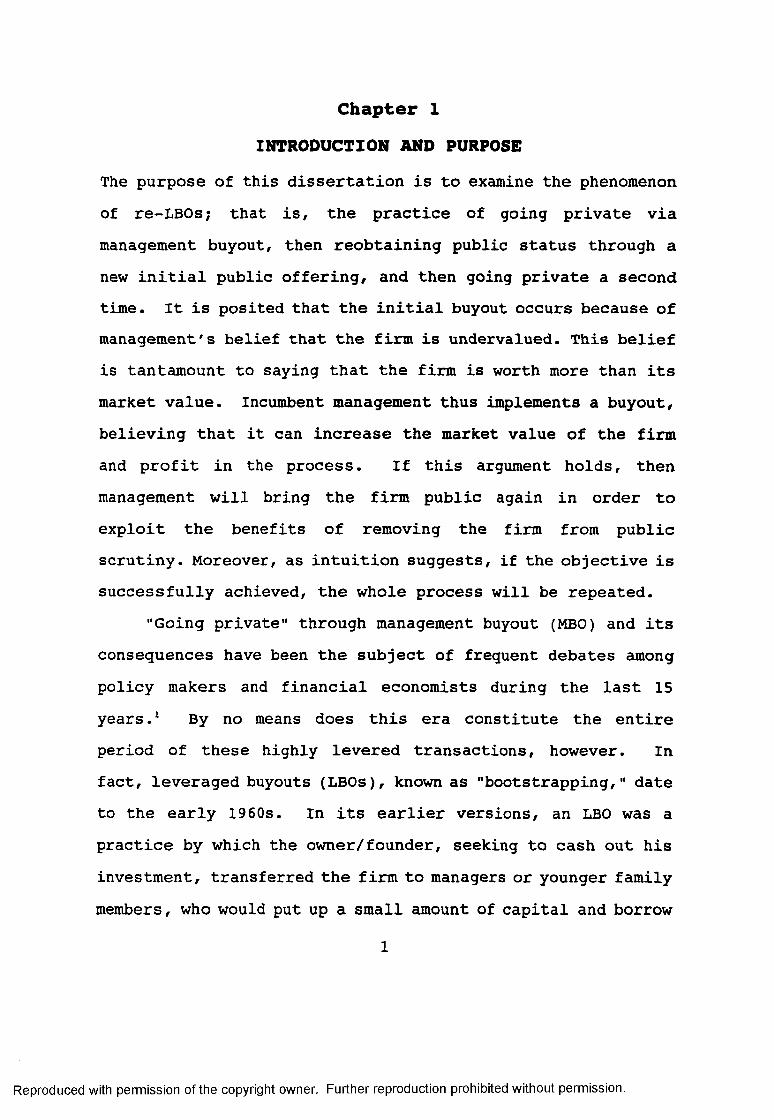
Chapter 1INTRODUCTION AND PURPOSE
The purpose of this dissertation is to examine the phenomenon of re-LBOs; that is, the practice of going private via management buyout, then reobtaining public status through a new initial public offering, and then going private a second time. It is posited that the initial buyout occurs because of management's belief that the firm is undervalued. This belief is tantamount to saying that the firm is worth more than its market value. Incumbent management thus implements a buyout, believing that it can increase the market value of the firm and profit in the process. If this argument holds, then management will bring the firm public again in order to exploit the benefits of removing the firm from public scrutiny. Moreover, as intuition suggests, if the objective is successfully achieved, the whole process will be repeated.
"Going private" through management buyout (MBO) and its consequences have been the subject of frequent debates among policy makers and financial economists during the last 15 years.1 By no means does this era constitute the entire period of these highly levered transactions, however. In fact, leveraged buyouts (LBOs), known as "bootstrapping," date to the early 1960s. In its earlier versions, an LBO was a practice by which the owner/founder, seeking to cash out his investment, transferred the firm to managers or younger family members, who would put up a small amount of capital and borrow
1
Reproduced with permission of the copyright owner. Further reproduction prohibited without permission.

2the rest. Today, LBOs differ from their earlier appearance in that they have been applied to those companies that are not only large, but also publicly traded.2
The going-private transaction encompasses a number of inextricably connected theoretical issues: the capitalstructure of a firm (which translates into tax savings, signaling, and wealth transfers among parties), agency theory, dividend policy, and ownership structure. MBOs thus provide a single case that incorporates various unresolved issues in corporate finance. This fact makes MBOs even more interesting to study than any one component alone.
Research on the subject has generated several hypotheses that seek both to justify buyout activities and to explain the source of significant premiums paid to shareholders. Although they fail to provide a single precise source of gain for the value creation of LBOs, findings tend to support the elimination of public reporting expenses and agency costs, alignment of managerial interests with company objectives, monitoring by sponsors/buyout specialists, and tax effects. This agreement among studies mitigated the public criticism of the LBO phenomenon until the appearance of reverse LBOs (i.e., LBO firms that subsequently return to capital markets). The enormous returns earned by some buyout investors served to heighten the public skepticism associated with buyout transactions. If indeed the sources of the gains were those mentioned above, why would LBO firms become public companies
Reproduced with permission of the copyright owner. Further reproduction prohibited without permission.

3again? Even more fascinating than the previous question is why some of these reverse LBOs would go private a second time (i.e., become re-LBOs).
This dissertation seeks to provide an answer to these questions. Accomplishing this objective extends the empirical work on buyout transactions in two ways.
First, this dissertation uses a re-LBO sample to replicate the Lehn and Poulsen (1989) study of free cash flow and stockholders' gains in going-private transactions. Lehn and Poulsen find a significant relation between undistributed cash flow and a firm's decision to go private. Parallel with this conclusion, they report that a major source of stockholder gains in going-private transactions is the mitigation of agency problems associated with free cash flow, an hypothesis introduced by Jensen (1986). Lehn and Poulsen's study is certainly not the only one analyzing certain characteristics of going-private firms; however, it appears to be the eminent work on the direct test of the free cash flow hypothesis, which has already been scrutinized.3 Inconsistencies in the Jensen's free cash flow theory and conflicting results from its empirical investigation suggest that additional research is needed on the subject. This dissertation, hence, examines the relevance of the free cash flow hypothesis to MBOs by using the re-LBO sample. As such, this section of the dissertation can be also viewed as a
Reproduced with permission of the copyright owner. Further reproduction prohibited without permission.

4search for the explicit similarities or differences between LBOs and re-LBOs.
Second, this dissertation explores the role of information asymmetry as a rationale for buyouts. In theory, especially in the settings of a Modigliani and Miller (henceforth, MM) world, an LBO is merely a change in the organizational and capital structure of a firm and should provide no additional gains to the parties. Observation of a significant number of LBOs suggests, however, that corporate managers view corporate restructuring activities differently than has been suggested by theory and may have other reasons for initiating these activities.
Proposing the asymmetric information for LBO transactions is not new. In fact, both Smith (1990) and Ofek (1994) cast doubt on the information asymmetry hypothesis in that their findings associate performance improvements to completed buyout proposals only. Although existing evidence cannot empirically substantiate the asymmetric information hypothesis, conclusions are based on a limited study only and lack evidence that can come only from a more meaningful sample.
This dissertation takes a different path. It uses a survey of the views of management in 600 LBO cases to determine the main motivation for the buyout, and draws on a sample of firms that experienced an LBO twice (in other words, were re-LBOs) to test related hypotheses. This original
Reproduced with permission of the copyright owner. Further reproduction prohibited without permission.

5sample may contribute much to the continuing debate about various explanations of going-private transactions. In the present setting, the re-LBO sample, together with the use of a reverse LBO sample, is expected to provide additional insights into the asymmetric information explanation for MBOs through tests of several hypotheses.
Chapter 2 contains a more detailed discussion and review of the prior work on both LBOs and reverse LBOs. Chapter 3 replicates Lehn and Poulsen's (1989) study, using a re-LBO sample to show the irrelevance of free cash flow hypothesis as a general explanation for going-private transactions. Chapter 4 presents the results of a survey of management's perception of buyouts. Chapter 5 studies remaining hypotheses that are intended to provide additional insights into the asymmetric information explanation of MBOs by using market data. Summary, conclusions, and avenues for future research are discussed in chapter 6.1.1 Notes to Chapter 11. In the following, the terms management buyout (MBO) and
leveraged buyout (LBO) are used interchangeably to define a buyout transaction implemented by the management team of the company.
2. The RJR-Nabisco buyout, with a bid of $24.9 billion, is known as the biggest going-private deal.
Reproduced with permission of the copyright owner. Further reproduction prohibited without permission.

63. The free cash flow hypothesis in general (see Reiter,
1994) and its application to rationalize LBO transactions in particular (see Frankfurter and McGoun, 1996) have been questioned in the recent literature.
Reproduced with permission of the copyright owner. Further reproduction prohibited without permission.

Chapter 2LITERATURE REVIEW
This review of literature relating to MBOs is divided into three parts. The first two parts include a brief discussion of the characteristics of going-private transactions (2.1) and presents various explanations and evidence associated with these transactions (2.2). The third part (2.3) gives an overview of previous studies on reverse LBOs (return to public ownership).2.1 Characteristics of Going-Private TransactionsDespite the lack of an applicable theory to explain the phenomenon of MBOs, there exists a number of hypotheses justifying buyout activities on the basis of economic rationales. These hypotheses are neither conclusive nor mutually exclusive. Before discussing each hypothesis and its relevant empirical findings in detail, it is helpful to review the main characteristics of MBO transactions.
Going-private deals differ from other corporate control transactions primarily in that they do not combine two previously separate entities into a single public economic unit, but, instead, create a privately held company with a limited number of investors. Since incumbent management often appears as the bidder and since such transactions are usually financed largely with debt, these activities are called MBOs, LBOs, or (more descriptive, but used less frequently) leveraged management buyouts (LMBOs). There is a tendency for
7
Reproduced with permission of the copyright owner. Further reproduction prohibited without permission.

8management's equity ownership to increase as a result of the MBO. To secure the loans, management pledges the assets and future cash flows of the subject company as collateral.
Another characteristic of MBOs is the participation of large-block equity investors, who in most cases are buyout specialists. These large-block investors are usually appointed to the board of directors and maintain an active role in monitoring management's activity and performance. A third characteristic of these transactions is the absence of registration and other public ownership expenses, owing to the new organizational form. A fourth characteristic of MBOs is the considerable reduction in the liquidity of a firm's claims (especially equity claims) because of lost or limited access to public equity markets after the buyout.
Studies by DeAngelo, DeAngelo and Rice (1984), Marais, Schipper, and Smith (1989), Lehn and Poulsen (1989), and Kaplan (1989a, 1989b) report a 30% to 40% premium paid to the shareholders over the pre-buyout market price. In view of such gains, it is not surprising that MBOs raise several issues that are worth studying, particularly with regard to the effect of MBOs on the efficiency and market value of firms. In fact, the issue of excess gains accruing to prebuyout stockholders has, in itself, been the subject of several studies. For example, Torabzadeh and Bertin (1987) do not test any specific hypothesis, but show significant positive abnormal returns of 23.26% realized by target
Reproduced with permission of the copyright owner. Further reproduction prohibited without permission.

9shareholders as a result of the buyout announcement. Torabzadeh and Bertin view this result as justification of the economic rationality of MBOs, when in fact it could simply be a means of wealth transfer.2.2 Explanations for Leveraged Buyouts (LBOs)This section presents seven possible explanations or hypotheses for LBOs. These include cost savings, tax savings, wealth transfer, management incentives, free cash flow, undervaluation of stock, and management manipulation.2.2.1 Cost Savings on Shareholder Relations An immediate gain that going-private can generate is the saving of registration, listing, and other public ownership expenses, such as disclosure requirements, which can be especially significant for smaller firms. DeAngelo, DeAngelo, and Rice (1984) are first in proposing and examining this potential source of value. In their hypothetical setting, an annual potential saving of $100,000 from such items translates into a present value of $1,000,000 at a 10% discount rate. The importance of this example is strengthened by the findings of Maupin (1987), who estimates the direct costs (excluding management time and indirect costs such as additional audit fees) of public ownership to range between $60,000 and $250,000 per year. By itself, however, this explanation is sufficient only for the smallest scale MBOs.
At least two drawbacks of this explanation are in order: (1) cost savings on shareholder relations cannot rationalize
Reproduced with permission of the copyright owner. Further reproduction prohibited without permission.

10the reverse LBO phenomena observed by Cummings (1989), Muscarella and Vetsuypens (1989, 1990), and Ainina and Mohan (1991); and, (2) this rationale ignores the fact that LBOs with outstanding debt continue to incur some public relations costs since they must still file 10Q and 10K reports with the SEC. In fact, even in the absence of public debt, buyout firms may seek some costly means to disseminate the information about their financial performance to the market. They do this because greater uncertainty about the firm results in a lower price when they go public again. Muscarella and Vetsuypens (1989) argue, for example, that the public knows more about firms re-entering the capital markets (reverse LBOs) than firms entering the market for the first time. In support of their argument, they report statistically significant less underpricing for the reverse LBO firms at their "second" initial public offering than for those firms that go public for the first time. It seems necessary, therefore, to keep the market informed so that the LBO can command a higher price when it goes public again.2.2.2 Tax SavingsThe most frequently cited benefit of going-private is the tax saving. In fact, both Lowenstein (1985) and Frankfurter and Gunay (1993) argue that the use of debt in buyout deals is attributable to tax subsidy only. In addition to the tax shield of higher interest costs, buyout reduces the tax
Reproduced with permission of the copyright owner. Further reproduction prohibited without permission.

11liability through the increased depreciation deduction associated with the write-up of assets following the buyout.
The evidence presented by Lehn and Poulsen (1988), Marais, Schipper and Smith (1989), Kaplan (1989a), and Muscarella and Vetsuypens (1990) supports the tax advantages of LBOs. For example, using a sample of 76 management-led going-private transactions undertaken in the period 1980 to 1986, Kaplan (1989a) estimates a median value of tax-driven benefits (both from interest and depreciation deductions) that is between 21% and 142.6% of the premium paid to shareholders. Similarly, Schipper and Smith (1988) find a strong correlation between tax benefits and the premium paid. Kaplan (1989a) also reports that the excess return to pre-buyout shareholders is significantly related to potential tax benefits generated by the buyout. He does not find any significant relation between the excess return to post-buyout shareholders and potential tax benefits of the buyout, however.
All the above studies agree, nevertheless, that the total value created in an LBO cannot be explained by tax advantages only. This point is confirmed by one of the advocates of debt (due to the interest tax shield it creates) in a firm's capital structure. Miller (1991) states, " . . . tax savings alone cannot plausibly account for the observed LBO premiums." In this vein, Frankfurter and Gunay (1993) take the previous literature one step further and, in a partial-equilibrium, asymmetric-information setting, show that the major forces
Reproduced with permission of the copyright owner. Further reproduction prohibited without permission.

12behind the premium paid to pre-buyout shareholders are the anticipated tax subsidy and management's desire to divest.2.2.3 Wealth Transfer from BondholdersLeverage is not without its cost. Large increments of additional debt can increase the potential for bankruptcy and hence raise the cost of debt financing. Moreover, in an option-pricing framework, any risk-increasing activity of the firm will enhance the position of the stockholders at the expense of bondholders. Lehn and Poulsen (1988), Marais, Schipper, and Smith (1989), Asquith and Wizman (1990), and Cook, Easterwood, and Martin (1992) consider the wealth transfers from the bondholders of the target firm to stockholders (due to the substantial increase in debt-equity ratio) as a possible portion of premiums paid to shareholders.1
Lehn and Poulsen (1988) report an average price decline of 1.42% based on 13 bonds (of various LBO firms) traded on the exchange during the 20-day period centered on the LBO announcement date. This decline is considerably smaller than the 7.21% average drop in the 20-bond index (reported daily in The Wall Street Journal) for the same period. Marais, Schipper, and Smith (1989) also find minimal effects of going- private transactions on debt claims. In fact, the negative average abnormal return for a period from the buyout announcement to the completion of transaction is both statistically insignificant and limited to nonconvertible bondholders.
Reproduced with permission of the copyright owner. Further reproduction prohibited without permission.

13Asquith and Wizman (1990) report a loss of 6.8% of the
gain accruing to the equity holders experienced by bondholders with no protective covenants accounts only. Consistent with this result, Cook, Easterwood, and Martin (1992) find (depending on restrictive covenants) the presence of significant bondholder losses that, on average, are 3% of the market value of bonds. Overall, the evidence provided by these studies is inconclusive, and the magnitude of the bondholders' losses is insufficient to explain shareholders' gains. This result, not surprisingly, necessitates (and generates) the consideration of other factors as the sources of gains.2.2.4 Management Incentives and Performance ImprovementsChange in ownership structure brought about by an MBO provides a good fit to the agency theory. Specifically, within the agency theory, management no longer shares the costs of its shirking and its consuming perquisites that may provide incentives to improve the firm's operating and management performance. With a substantially increased stake by management, managerial and stockholder interests are presumably aligned more closely.2 Moreover, a closermonitoring of managers' actions is conducted by other major investors, compared with that of a diffused ownership structure. These explanations are in keeping with the view prevalent in recent literature that there is a tendency to get away from finance and provide more micro-economic-oriented
Reproduced with permission of the copyright owner. Further reproduction prohibited without permission.

14explanations for going-private transactions.3 Researchers following this line of logic also have a positive view of LBOs and document substantial efficiency gains stemming from organizational changes and asset control.
Kaplan (1989b), Smith (1990), Muscarella and Vetsuypens (1990), Lichtenberg and Siegel (1990), Opler (1992), and Ofek (1994) provide comparable results characterized, after LBOs, by increases in industry-adjusted operating profit/sales, operating profits per employee, and operating cash flow/operating assets. Kaplan (1989b) analyzes the postbuyout operating performance of 48 MBOs completed between 1980 and 1986. His results indicate that 76% of the sample firms experienced an average increase in operating income of 40% within two years of going private. Over a three-year postbuyout period, average operating income was 42% higher than that for the year preceding the buyout. Moreover, operating income measured net of industry changes remained essentially unchanged in the first two post-buyout years and became 24% higher in the third year. Kaplan's conclusion that efficiency gains constitute a major source of pre-buyout shareholders' gains is driven by the high correlation found between the premiums paid to pre-buyout shareholders and post-buyout performance improvements.
Smith's (1990) examination of 58 MBOs, completed during the period 1977 to 1986, provides results consistent with Kaplan's (1989b); that is, operating cash flow per employee
Reproduced with permission of the copyright owner. Further reproduction prohibited without permission.

15and the operating cash flow per dollar book value of assets increase relative to the year preceding the buyout. Like Kaplan, Smith finds that cash flow improves under private ownership. Smith attributes this finding to better management of working capital, which is reflected as a reduction in the inventory-holding period and in the accounts-receivable- collection period.
Unlike Kaplan (1989b) and Smith (1990), who analyze company-level data, Lichtenberg and Siegel (1990) examine total factor productivity (output per unit of total input) of approximately 1,000 plants involved in LBOs during the period 1981 to 1986. They find an improvement in plant productivity, which moves from 2.0% above the industry mean in the three pre-buyout years to 8.3% above the mean in the three postbuyout years.
At the case study level, Baker and Wruck (1989) credit organizational changes, characterized by heavy debt load and management equity ownership, for the improved operating performance of the company, O.M. Scott & Sons. They view a stronger incentive compensation plan, a reorganization and decentralization of decision making, and monitoring by sponsors as equally important. The role of these factors becomes more apparent in Denis' (1994) comparison of Kroger's recapitalization and Safeway's LBO. Although both transactions resulted in debt levels of more than 90%, Kroger's managers were not as successful as Safeway's in
Reproduced with permission of the copyright owner. Further reproduction prohibited without permission.

16improving profits and cash flows. Denis attributes this result to Kroger's lack of increased managerial shareholding, sponsor's ownership and monitoring, and the close linking of managerial compensation to company performance.2.2.5 Free Cash Flow HypothesisJensen (1986, 1988) extends the agency-theory-based management incentive and compensation hypothesis of LBOs by assigning debt a special role in these transactions. His argument differs from the conventional view of debt as a tax advantage. According to Jensen, many of the benefits in going-private transactions stem from debt's "control function" on managers with respect to free cash flow. Free cash flow is defined as cash flow in excess of that required to fund all positive net present value (NPV) projects of a firm.
The payout of free cash flow to shareholders is consistent with the value maximization principle. Strangely, however, debt is thought to be the sole candidate to fit the role in distributing the free cash flow through periodic interest payments. A permanent increase in dividends does not achieve a similar result because such a promise is considered weak since dividends can be cut in the future (i.e., there is no contractual obligation to make promised dividend payments). Management, therefore, selects the debt option instead so that if they default they can lose everything, both their ownership in the firm as well as their jobs. This story cannot be accepted without admitting that managers are acting in the
Reproduced with permission of the copyright owner. Further reproduction prohibited without permission.

17best interest of the shareholders, contradicting the "me-first rule" of agency theory.
There are, however, several other behaviors consistent with "me-first rule" management. One of these is retaining the free cash flow to fund new (but not positive NPV) projects without a need for external financing. This action protects managers from the scrutiny of the capital markets. There is also evidence that increases in executive pay are strongly related to increases in sales growth (Murphy, 1985), suggesting that management wants to have control of the free cash flow to increase corporate size even at the expense of suboptimal acquisitions.4
Logical inconsistencies in the theoretical arguments surrounding free cash flow hypothesis are mirrored in empirical studies that produce conflicting results. The following discussion covers only those studies of going- private transactions that provide evidence about pre-buyout characteristics of LBOs.
An implication of the free cash flow argument for going- private transactions is that, in order to be an LBO candidate, a firm must have substantial free cash flow at the discretion of management. Accordingly, firms or divisions of large firms that have stable business histories and low growth prospects are more likely to be subject to LBOs. Empirical studies make observations consistent with these predictions. Most LBOs take place in mature industries (Lehn and Poulsen, 1988; and
Reproduced with permission of the copyright owner. Further reproduction prohibited without permission.

18Kieschnik, 1989), and the growth rates and capital expenditures of LBO firms are lower than those of comparable firms in the same industry (Kaplan, 1989a; and Lehn and Poulsen, 1988, 1989).
The study by Maupin, Bidwell, and Ortegren (1984) is probably the first to explicitly analyze the pre-buyout characteristics of LBOs. They use discriminant analysis to compare 63 LBO firms during the period 1972 to 1983 with a control sample matched by size and industry classification. Although their study is descriptive and is not intended to test any hypotheses about the motivation of LBOs, it produces findings contradictory to the free cash flow hypothesis. They report a significantly higher dividend yield variable for the LBO firms. This finding, even in the presence of higher cash flow variables for the buyout firms, is inconsistent with the free cash flow hypothesis since ". . . it [i.e., positive and significant dividend yield variable] indicates that whatever free cash flows are generated by the firm are distributed to stockholders” (Kieschnik, 1989).
Lehn and Poulsen (1988) show that, consistent with Jensen's theory, their proxy for free cash flow and the premium paid in LBOs are positively related. Consistent with their previous finding, Lehn and Poulsen (1989) use a logistic regression equation and obtain a significantly positive relationship between undistributed cash flow and a firm's decision to go private.
Reproduced with permission of the copyright owner. Further reproduction prohibited without permission.

19Kieschnik's results (1989), on the other hand, are
unsupportive of the free cash flow argument, although he uses the same method of analysis. He finds that the free cash flow variable is statistically insignificant and that it has a negative sign. In a more recent study, Opler and Titman(1993) conclude that the main characteristics of firms initiating LBOs are unfavorable investment opportunities (low Tobin's q) and high cash flows. Inconsistencies in Jensen's free cash flow theory and conflicting results from its empirical investigation suggest that additional research is needed on the subject.2.2.6 Undervaluation of the Firm's StockThere is an apparent conflict of interest in a management buyout, since the managers making the purchase have an information advantage over both current stockholders and other potential purchasers. It is plausible, therefore, to posit information asymmetry as an explanation for going-private transactions. The rationale behind this assertion is that going-private transactions are, in a sense, an extreme form of corporate stock repurchase by a management team that possesses private and valuable information about the future prospects of the firm's cash flows. This contention is in line with Myers and Majluf's (1984) suggestion that common stock issuance (purchase) will be chosen by management if it believes the stock price is too high (low).5
Reproduced with permission of the copyright owner. Further reproduction prohibited without permission.

20Both Smith (1990) and Ofek (1994) cast doubt on the
information asymmetry hypothesis. Their findings attribute performance improvements to completed buyout proposals only. Specifically, Smith (1990) reports no increase in cash flows following a failed buyout proposal, and she reports a similar performance for completed management-proposed buyouts and for buyouts initiated by a takeover threat or by outsiders. Ofek(1994) reinforces Smith's findings and reports that, at cancellation announcements (of MBO proposals), returns drop to 2% (from 27% measured for the period extending from one month before the buyout announcement to the day after the MBO offer announcement), which is insignificantly different from zero, and persist there for the following two years. Ofek attributes poor performance of uncompleted MBO offers to the absence of organizational changes in the completed buyouts rather than to information asymmetry. That is, if a buyout is motivated by undervaluation, then abnormal returns should remain positive regardless of the outcome of the buyout offer. The very fact that Ofek's study finds no evidence of improvements in operating performance in unwillingly canceled offers rules out the possibility that the cancellation results from bad information, and, hence, strengthens the doubts about the information advantage hypothesis.2.2.7 Management Manipulation HypothesisIt is also often indicated in the literature that managers may even distort the operating data through manipulations of
Reproduced with permission of the copyright owner. Further reproduction prohibited without permission.

21accounting information to reduce the acquisition price.6 Evidence supporting the manipulation hypothesis is limited. Kaplan (1989b), although indirectly, casts doubts on management's manipulation. He reports that post-buyout operating performance in the first two years after the buyout is below the projections provided to prospective lenders by managers in the buyout proxy statements. This finding is contrary to the view that buyout company managers purposely mislead public shareholders by understating the projections.
DeAngelo (1986) explicitly considers the management manipulation issue and also fails to support it. She studies the accounting decisions made by managers of 64 firms that proposed to go private during the period 1973 to 1982. Her findings give no indication that managers of sample firms systematically understate earnings in periods before an MBO proposal. As a possible explanation, DeAngelo suggests that outside scrutiny by public shareholders and their financial advisers deters management manipulation.
Wu (1992), on the other hand, argues that DeAngelo's results may also be due to the fact that she ignores the macroeconomic factors, or that management manipulates other information in addition to earnings that depress stock prices prior to the MBO announcement. For a sample of 107 MBO firms, he finds that managers manipulated earnings to depress stock prices before the announcement. This practice enabled them to pay a lower premium to pre-buyout shareholders. He also
Reproduced with permission of the copyright owner. Further reproduction prohibited without permission.

22documents that smaller institutional shareholdings are associated with greater earnings decreases, and hence with smaller premiums. U.S. companies are not the only ones subject to the management manipulation hypothesis. Wright and Coyne (1985) use data from the United Kingdom and find support for the management manipulation hypothesis.2.3 Reverse Leveraged BuyoutsAlthough a precise source of gain has not been found for the value creation of LBOs, findings tend to support the elimination of public reporting expenses and agency costs, alignment of managerial interests with company objectives, and tax gains. This agreement among studies mitigated the public criticism of the LBO phenomenon until the appearance of the reverse LBOs. The enormously large returns earned by some buyout investors served to heighten public skepticism associated with buyout transactions.7 If indeed the sources of the gains were those mentioned above, why would LBO firms become public companies again?2.3.1 Characteristics and Performance of Reverse LBOsReverse LBOs have received some measure of attention in the recent literature. For example, Muscarella and Vetsuypens (1989) use a sample of 74 such firms to examine the underpricing phenomenon of initial public offerings (IPOs). Their study supports the information asymmetry explanation of underpricing in IPOs because average initial returns for firms re-entering the public markets (which presumably are better
Reproduced with permission of the copyright owner. Further reproduction prohibited without permission.

23known by the public) are lower than those of IPOs. * The importance of their study for this research, however, is that they report an average life of only 34.2 months (median = 29 months) for private ownership. As Muscarella and Vetsuypens (1989) state,
The relatively short period during which several of the sample firms remained in private hands is noteworthy, given the substantial transactions costs associated with such a public- private-public ownership structure. One firm returned to public capital markets only four months after its LBO, and nine firms reconverted to public ownership less than one year after completing their going private transaction.In a follow-up study on the same sample, Muscarella and
vetsuypens (1990) examine the performance of these companiesduring the period the firm was privately held. For the fullsample, they report a 268.4% median annualized rate of returnon equity, based on comparisons of the going-private price andgoing-public price. Overall, their study tends to credit theincentive effects of high leverage and concentrated ownership,but fails to provide any evidence that can refute the claimthat buyout investors exploit inside information. In theirwords, "It is also possible that the efficiency gains wedocument would have occurred anyway, and that managers timedthe buyout to exploit favorable inside information" (ibid., p.1404).
A notable finding of Muscarella and Vetsuypen's (1990) study is that leverage declines under private ownership. For their sample of reverse LBOs, the median leverage value decreased from 93.4% prevalent after the buyout to 78.6% prior to the IPO. Coupled with the fact that only a few companies
Reproduced with permission of the copyright owner. Further reproduction prohibited without permission.

24in the sample intend to use the IPO proceeds for capital expenditures, their finding suggests that going public lowers a company's leverage rather than expands its asset base. Indeed, Muscarella and Vetsuypens (1990) report a median post- IPO leverage of 55.5%.9
Mohan (1990) also provides a similar conclusion with respect to reduction in leverage while the firm was private. She interprets the significantly higher capital expenditures of the second initial public offering (SIPO) firms in the first fiscal year as correcting for the postponement of capital expenditures (perhaps due to debt service requirements) during the private period.
With respect to the changes in insider ownership following a firm's going public again, Muscarella and Vetsuypens (1990) report that the median ownership of executive officers and directors in reverse LBOs drops from 63.4% prior to the IPO to 44.5% after the IPO. Similarly, DeAngelo and Zeckhauser (1993) find that, on average, insiders sell 10% of their holdings in the IPO associated with the reverse LBO. Note that, although findings on both leverage and management ownership in the going-private/going-public cycle are consistent with a possible information advantage of insiders, they are in stark contrast with agency costs and free cash flow explanations of the LBO transactions. That is, as pointed out by Van de Gucht (1994), Jensen's (1986, 1988) argument would be supported only under the conditions that
Reproduced with permission of the copyright owner. Further reproduction prohibited without permission.

25"reverse LBOs continue to exhibit the typical post-buyout characteristics, such as high debt and insider ownership levels."
Using 85 firms in their sample, Mian and Rosenfeld (1993) report 31% cumulative abnormal returns in 25 months after LBO firms went public. Further examination of the sample reveals that the long-term positive abnormal performance following the reverse LBOs is mainly due to takeover premiums. They conclude that going public provides initial liquidity and a showcase (to buyout specialists) that facilitates a subsequent sale to an outside party.2.3.2 Decision to Return to Public MarketsThe study by DeGeorge and Zeckhauser (1993) differs from the previous ones by explicitly focusing on the decision to return to public ownership (re-entry decision). In an asymmetric information framework, they provide a model that predicts superior performance before the IPO.
Information asymmetry, in their setting, translates into management's manipulation of performance, their extraordinary effort before the IPO, or performance borrowing from the future (i.e., discounting prices to boost the sales or deferring R&D expenses) . Superior performance before the IPO is also consistent with pure selection, which refers to the tendency of firms to go to market when their performance is extraordinarily good relative to other firms and to previous years. Although both of these hypotheses predict distinct
Reproduced with permission of the copyright owner. Further reproduction prohibited without permission.

26performance in the period before the offer, they differ in their predictions of performance in the following periods. The pure selection hypothesis suggests an average performance in the next period, but the information asymmetry hypothesis predicts a sharp deterioration in performance, compared with that of other firms.
By using a sample of 62 reverse LBOs, the study finds that reverse LBOs display superior performance in the preoffering year (compared with other firms and continuing LBOs) and a disappointing performance in the following year (compared with their own previous year and with theperformance of control firms). This result is consistent with the authors' information asymmetry hypothesis.2.4 ConclusionTo date, the findings cluster around the following factors proposed to explain the premiums paid to pre-buyout shareholders in going-private transactions: cost savings on shareholder relations, tax benefit of debt financing, alignment of managerial interests with company objectives, and reduction in agency costs. The evidence shows that going private leads to operating efficiency gains and increased cash flows that are commonly attributed to the reduction of agency costs. High insider ownership, monitoring by LBO specialists, and the control function of debt on free cash flow arebelieved to be combined in a buyout transaction only.Accordingly, any other form of reorganization (such as a
Reproduced with permission of the copyright owner. Further reproduction prohibited without permission.

27leveraged recapitalization) or any other direct form of cash distribution (such as increased dividend payments) are not viewed capable of producing similar results. What cannot be ruled out, however, is that the reported accounting performance improvements might also have occurred even without these firms going private and may in fact reflect the information advantage of management.
Moreover, as the studies on reverse LBOs suggest, the improved performance under private ownership appears to be temporary. This observation, combined with the fact that insider ownership and leverage declines after coming back to the public, suggests that managers may be exploiting their information privileges.
Finally, one of the popular explanations of LBOs— Jensen's free cash flow theory— is found to have logical inconsistencies, which are reflected in the conflicting results produced by empirical investigation. All these observations suggest that additional research is needed on going-private transactions.2.5 Notes to Chapter 21. Surrounding the first announcement of RJR Nabisco's LBO,
RJR Nabisco's common stock price increased 61.8%, while the price of one of its outstanding bonds declined 16.5% (Wallace, 1988).
2. Kaplan (1989) estimates a median post-buyout equity ownership by management as 22.6%. According to Muscarella and Vetsuypens (1990), it is 63.4%— far higher than in public companies.
3. Specifically, Miller (1991) states, "The source of the major gains in value achieved in the LBO's of the 1980's
Reproduced with permission of the copyright owner. Further reproduction prohibited without permission.
28lies, in fact, not in our newly-recognized field of finance at all, but in that older, and long-established field of economics, industrial organization. Perhaps industrial reorganization might be an apter term."
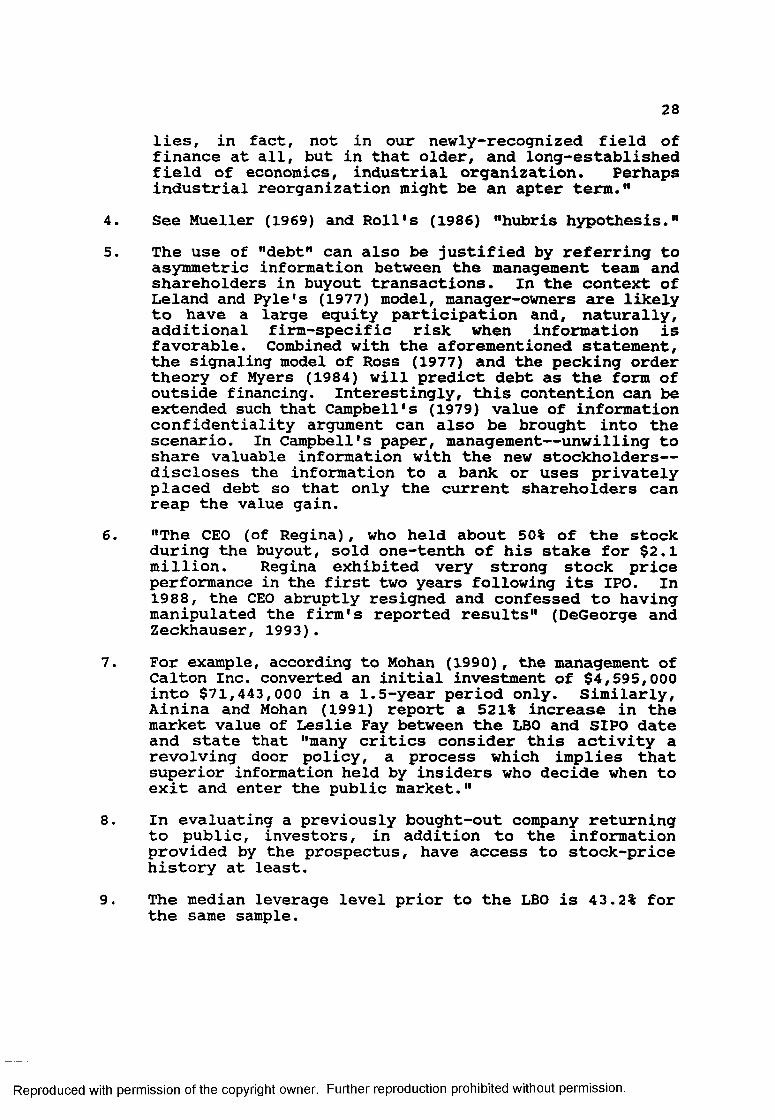
4. See Mueller (1969) and Roll's (1986) "hubris hypothesis."5. The use of "debt" can also be justified by referring to
asymmetric information between the management team and shareholders in buyout transactions. In the context of Leland and Pyle's (1977) model, manager-owners are likelyto have a large equity participation and, naturally,additional firm-specific risk when information is favorable. Combined with the aforementioned statement, the signaling model of Ross (1977) and the pecking order theory of Myers (1984) will predict debt as the form of outside financing. Interestingly, this contention cam be extended such that Campbell's (1979) value of information confidentiality argument can also be brought into the scenario. In Campbell's paper, management— unwilling to share valuable information with the new stockholders— discloses the information to a bank or uses privately placed debt so that only the current shareholders can reap the value gain.
6. "The CEO (of Regina) , who held about 50% of the stock during the buyout, sold one-tenth of his stake for $2.1 million. Regina exhibited very strong stock price performance in the first two years following its IPO. In 1988, the CEO abruptly resigned and confessed to having manipulated the firm's reported results" (DeGeorge and Zeckhauser, 1993).
7. For example, according to Mohan (1990), the management of Calton Inc. converted an initial investment of $4,595,000 into $71,443,000 in a 1.5-year period only. Similarly, Ainina and Mohan (1991) report a 521% increase in the market value of Leslie Fay between the LBO and SIPO date and state that "many critics consider this activity a revolving door policy, a process which implies that superior information held by insiders who decide when to exit and enter the public market."
8. In evaluating a previously bought-out company returning to public, investors, in addition to the information provided by the prospectus, have access to stock-price history at least.
9. The median leverage level prior to the LBO is 43.2% for the same sample.
Reproduced with permission of the copyright owner. Further reproduction prohibited without permission.

Chapter 3AN APPLICATION OF THE FREE CASH FLOW HYPOTHESIS
TO Re-LBOs3.1 IntroductionThis section of the dissertation examines the validity of the free cash flow hypothesis to the re-LBO sample. The free cash flow hypothesis, first proposed by Jensen (1986, 1988), is simply a variation of agency theory. It has found widespread application in various areas of finance, including LBOs.
Jensen argues that LBOs help solve the free cash flow problem faced by cash-rich firms in industries with low growth opportunities. His argument is that higher debt service obligations stemming from the buyout transaction preclude management's abuse of free cash flow by investing in negative net present value (NPV) projects. In other words, management is forced to pay out free cash flow in the form of debt- service payments on a regular basis. Furthermore, a high- equity stake provides incentives to improve cash flow, which is necessary to meet debt payments and maximize the company's value. It is not clear, however, why management decides to give up exploiting the free cash flow and assume the burden of excessive debt. This is only one of the questions to which Jensen's free cash flow argument cannot provide a clear answer.
29
Reproduced with permission of the copyright owner. Further reproduction prohibited without permission.

30If debt creation is vital to bond their promise to pay
out future cash flows, management could pay out the excess cash in the form of a dividend increase, a stock repurchase, or even a leveraged recapitalization. The free cash flow hypothesis in general (see Reiter, 1994) and its applications to rationalize LBO transactions in particular (see Frankfurter and McGoun, 1996) have been questioned in recent finance literature. The return of LBO firms to public ownership puts the free cash flow explanation of LBO transactions in serious doubt, as does the fact that both management ownership and leverage tend to decline following the IPOs (see Muscarella and vetsuypens, 1990; and Mohan, 1990). The latter facts are in striking contrast to agency costs and free cash flow explanations of LBO transactions. Jensen's (1986, 1988)argument is supported only if reverse LBOs continue to exhibit the typical post-buyout characteristics, such as high debt and insider ownership levels (Van de Gucht, 1994).
In light of the above discussion, it is believed that the applicability of free cash flow explanation to the re-LBO sample is a real challenge for Jensen's (1986) infamous argument. That is, if indeed Jensen's argument is correct, then free cash flow must be the main driving force behind the buyout transaction regardless of a firm's past experience with LBOs. Therefore, the free cash flow explanation must hold for re-LBOs as well.
Reproduced with permission of the copyright owner. Further reproduction prohibited without permission.

313.2 Free Cash Flows and LBOs (Hx)The objective of this chapter is to investigate the free cash flow hypothesis as the motivation for LBOs. Accordingly, the following hypothesis is tested:
Hypothesis 1: The free cash flow explanation is
irrelevant to the LBO transactions.
To test Ht, free cash flow measures in the re-LBO firms are compared with those in a control sample (non-LBO firms). If the free cash flow in re-LBO firms is significantly higher than that in the control sample, one might conclude that free cash flow may indeed be the reason for the re-LBO. Similarly, the absence of a significant difference between the two groups should lead to the conclusion that free cash flow is not a motive for going-private transactions, at least not for re- LBOs. A similar study has been done by Lehn and Poulsen (1989) on LBOs. Since the present study and the Lehn and Poulsen study differ only in terms of buyout samples, the same method of analysis is used in the current study.3.2.1 The Lehn and Poulsen StudyLehn and Poulsen (1989) analyze a sample of 263 successful going-private transactions completed between 1980 and 1987 to test the free cash flow hypothesis on two grounds:(1) Do firms that go private have significantly greater
undistributed free cash flow than similar firms that have not gone private?
Reproduced with permission of the copyright owner. Further reproduction prohibited without permission.

32(2) Is undistributed free cash flow an important determinant
of premiums paid in going-private transactions?For the 244 transactions in the sample for which
sufficient data were available, they report the following average cumulative abnormal returns (all being statistically significant at 1% level) associated with their announcements: 16.3% over the [-1,1] window, 19.9% over the [-10,+10] window, and 20.5% over the [-20,+20] window. They also measure the average premium paid in these transactions, computed as the non-market-adjusted return (including dividends paid) from 20 days before the buyout announcement to the final price at which the firm's shares traded. The average value of the premium is 36.1% (t-statistic » 22.4). It is the premium, rather than abnormal returns, that they use in searching the determinants of gains accruing to shareholders in buyouts.
In examining the free cash flow hypothesis, Lehn and Poulsen use two statistical methods of analysis. The first is a logistic regression analysis that attempts to determine the role of certain variables, particularly those proxying for the free cash flow hypothesis, in determining the likelihood of going private. The second is an ordinary least-squares regression, which intends to explain the cross-sectional variations in premiums paid in going-private transactions.
Following Lehn and Poulsen's work, this study examines the free cash flow hypothesis on the same two grounds by using
Reproduced with permission of the copyright owner. Further reproduction prohibited without permission.

33a sample of 21 re-LBO firms. Lehn and Poulsen find a significant relationship between undistributed cash flow and a firm's decision to go private. Parallel with this result/ they also report a statistically significant positive relationship between free cash flow and the premium paid in LBOs. This observation leads them to conclude that a major source of stockholder gains in going-private transactions is the mitigation of agency problems associated with free cash flow. Whether this conclusion can be generalized to re-LBO firms is the concern of the current study.3.3 Discussion of Method of Analysis and Proxy Variables3.3.1 Logit AnalysisLogistic regression functions, like the other regression functions, are used to describe the nature of the relation between the dependent variable and one (or more) independent variable(s). They differ from regular regression models, however, in that they use a binary dependent variable. The value of the dependent variable indicates to which prespecified groups a subject belongs.
The predicted values of the dependent variable are expected to fall mainly in the interval between 0 and 1. The convention then is to interpret the predicted value of the dependent variable as the probability of that subject's being a member of the pre-specified group, given its characteristics (i.e., the values of explanatory variables). In the present context, for example, such a prediction would be to see
Reproduced with permission of the copyright owner. Further reproduction prohibited without permission.

34whether a firm is an MBO target or not. The main interest of this study, however, is to investigate the explanatory power of the hypothesized firm characteristics in distinguishing between buyout and non-buyout firms, rather than predicting the probability of buyout for a hold-out sample.
The logistic regression model is of the following form:Prob (yx=l) = Fffl'XJ, (1)
where yL is a binary variable with "1" for re-LBO firms and "0" for the control sample; F(/3'X) is the logistic function, with F(/3'X) = e 'Vfl+e*'*); /3'X is a linear function ofseveral characteristics of subjects being studied; /3' is the vector of unknown parameters; and X is the matrix of independent variables.
In this study, the logit analysis contrasts the firms that go private with a control sample of public firms to explain the determinants of the likelihood of going private. The matching criteria in creating the control sample are as follows: (a) four-digit SIC code1, and (b) market value ofequity at the end of the fiscal year preceding the year of the going-private transaction.
Free cash flow hypothesis suggests that the proportion of a firm's assets consisting of free cash flow should directly relate to the likelihood of a firm's going private. Accordingly, for each firm in both samples, a measure of undistributed cash flow (CF), for the year immediately preceding the year of the going-private transaction, is
Reproduced with permission of the copyright owner. Further reproduction prohibited without permission.

35calculated. CF, assuming that all positive NPV projects are undertaken, should measure post-tax cash flow that was not distributed to security holders in the form of interest or dividend payments. Therefore, CF is defined as
CF = INC - TAX - INTEXP - PFDDIV - COMDIV, (2)where:
INC = Operating income before depreciation (Compustat item #13)TAX = Total income taxes (Compustat item #16), minus change in deferred taxes from the previous year to the current year (change in Compustat item #35)INTEXP = Gross interest expense on short- and long-term debt (Compustat item #15)PFDDIV = Total amount of preferred dividend requirement on cumulative preferred stock and dividends paid on noncumulative preferred stock (Compustat item #19) COMDIV = Total dollar amount of dividends declared on common stock (Compustat item #21)Average annual percentage increases in net sales
(Compustat item #12) during the years (4, 3, and 2 years and 1 year) preceding the going-private transactions proxy for growth prospects of each firm. These variables are referred to as SALESGRn, where n is the number of years included in the calculation of average growth value. The sales growth variable is intended to proxy for profitable reinvestment opportunities of cash flow. Low growth prospects imply that
Reproduced with permission of the copyright owner. Further reproduction prohibited without permission.

36firms have few opportunities to reinvest the cash flow profitably in their current lines of business.
Effective tax liability of each company, TAX, is also included in the analysis. Both the CF and TAX variables are expressed as a percentage of EQUITY, the market value of common stock at the end of the year immediately preceding the year of the transaction. TAX/EQ is expected to approximate the maximum potential tax benefits associated with the going- private transaction since tax considerations may also affect the likelihood of buyout transactions. TAX/EQ may be highly correlated, however, with a firm's undistributed cash flow, CF/EQ. The Pearson correlation coefficient between these two variables, although not really large, is positive 0.41, but not statistically significant at the 5% level.
The final variable included in the logistic regression is THREAT, which takes the value of 1 if the firm received a competing bid or was the subject of takeover speculation in The Wall Street Journal, and 0 otherwise. The role of this qualitative variable is to test the importance of takeover threats in going-private transactions. The free cash flow hypothesis predicts that the threat of hostile takeover is an important impetus for going-private transactions.
The variables discussed above form the independent variables of the logit models to test whether any or all of them will increase the probability of having an LBO. The dependent variable of the models takes the value of 0 for the
Reproduced with permission of the copyright owner. Further reproduction prohibited without permission.

37control firms and 1 for LBO firms. All the explanatory variables are expected to have positive coefficient estimates except for SALESGR, which should have a negative sign if the free cash flow argument is in effect.3.3.2 Bootstrap Algorithm for Statistical Significance TestsA major problem exists with respect to the use of logistic regression analysis in this study: the sample size. In the case of small samples, such as here, the estimates of standard errors may not be reliable, thus leading to questionable asymptotic t-tests. To remedy this problem, the bootstrap method introduced by Efron (1979) is used.3
The bootstrap algorithm randomly (with replacements) picks a fixed number of observations from the original sample. "By repeating this random sampling procedure, the bootstrap can approximate the unknown true distribution of the estimator with the empirical 'bootstrap' distribution" (Jeong and Maddala, 1993). Bootstrapping is a tool to determine whether asymptotic properties seem to hold in the small sample being studied. On average, the standard error of an estimator estimated by a bootstrap algorithm is greater than the nominal standard error (the one given by SAS, for example). In essence, what bootstrapping does is to capture finite sample variability, which is larger than the asymptotic sample variability. Therefore, bootstrap standard errors of the estimator are used for the sake of a reliable t-test.
Reproduced with permission of the copyright owner. Further reproduction prohibited without permission.

38The following steps are taken in the bootstrap algorithm
in estimating the standard errors and t-statistics of the logistic regression coefficients*(1) Estimate the coefficients of the explanatory variables by
using the original sample in the logistic regression.(2) Draw 1,000 random samples of the same size from the
original sample with replacement.(3) Estimate the coefficients of the explanatory variables
for each of the 1,000 samples.(4) Estimate the standard deviation of each coefficient by
using 1,000 observations of each estimator.The resulting set of standard errors (steps 2 through 4)
and the coefficient estimates (step 1) are then used to compute "bootstrap" t-statistics.3.3.3 Ordinary Least-Squares RegressionThe objective of this additional analysis is to ascertain determinants of premiums paid in going-private transactions. If free cash flow is an explanation for buyout transactions, it (in addition to explaining variation in the likelihood of going private) should explain cross-sectional variation in premiums paid in going-private transactions. Specifically, premiums paid in these transactions should be directly related to the level of the target's free cash flow.
As explained above, the average premium paid in these transactions is computed as the non-market-adjusted return (including dividends paid) from 20 days before the buyout
Reproduced with permission of the copyright owner. Further reproduction prohibited without permission.

39announcement to the final price at which the firm's shares traded. Three of the variables— CF/EQ, TAX/EQ, and SALESGR— are used as independent variables to explain the variation in the premium. As before, the expected signs are positive and negative for CF/EQ and SALESGR, respectively, for the free cash flow hypothesis to be a valid explanation of going- private transactions. Similarly, the sign of TAX/EQ should be positive if potential tax savings are a source of premiums paid to shareholders.3.4 Empirical Findings3.4.1 Re-LBO Sample CharacteristicsTwenty one re-LBO cases, discovered from going-private transactions that occurred between 1980 and 1995, are used to test Ht. A re-LBO firm is defined as one that converts a publicly traded corporation (one that experienced a prior LBO or divisional LBO with a subsequent return to public markets) into a privately held corporation.
In constructing the re-LBO sample, various issues of the following publications were first used to identify reverse LBO firms: Going Public-The IPO Reporter (a publication ofInvestment Dealers Digest); Mergers & Acquisitions; W.T. Grimm's Mergerstat Review; and The Yearbook on Corporate Mergers, Joint Ventures and Corporate Policy. In addition, Investment Dealers Digest (IDD) Information Services provided a comprehensive updated list of reverse LBOs that occurred in the period 1980 to 1996. Also, Professor Chris J. Muscarella
Reproduced with permission of the copyright owner. Further reproduction prohibited without permission.

40supplied a list of reverse LBOs generated by Kidder, Peabody & Co. in 1988.
A careful examination of the above sources provided 450 reverse LBO firms. Next, The Wall Street Journal Index was searched for each individual reverse LBO firm (starting at its reverse LBO date up to the current date) to see whether the firm experienced a second management buyout following its return to public markets. This search process yielded 21 re- LBO firms for the current study.
Table 3.1 reports various characteristics, grouped by year, for the 21 re-LBO firms. Full sample results are presented in the last row of the table. The year in which the second LBO occurs is given in the first column, which is followed by the total number of going-private transactions that qualify as re-LBOs for that year. The third column presents the average period that firms spend as a freestanding public firms before their second going-private transaction; i.e., time span between their second initial public offerings and their second LBOs. The last two columns display average value of equity and total value of equity. Equity values are computed as the number of common shares outstanding times the closing price of common stock at the end of the fiscal year immediately preceding the re-LBO year.
Although the study covers a wide period, 1980 to 1995, re-LBO firms are clustered in the years 1986 through 1989, reaching a peak of nine transactions in 1988. Total equity
Reproduced with permission of the copyright owner. Further reproduction prohibited without permission.

41
Table 3.1DESCRIPTIVE STATISTICS FOR TBE Re-LBO SAMPLE
Year Number of Re-LBOsAverage* Public Life (months)
Equity Value6 (Millions of Dollars)Mean Total
1986 2 17.66 50.122 100.2441987 3 33.38 162.814 488.4421988 9 24.69 49.753 447.7831989 4 41.73 99.260 397.0411990 1 41.16 99.416 99.4161991 1 71.26 31.341 31.3411994 1 16.58 635.000 635.000Full 31.12 104.738 2,199.498Sample 21 (27.29)c (82.356)d
(a) Average time that the firm spent in the public markets after the buyout firm is brought back to the market.
(b) Equity values are computed as the product of the common shares outstanding and the closing price of common stock at the end of the fiscal year immediately preceding the calendar year of the going- private transaction.
(c) Corresponding median value of public life for the full sample.(d) Corresponding median value of equity for the full sample.
value for the full sample is $2,199,498,000, with a corresponding median equity value of $82,356,000.
The majority of the re-LBOs occurred during the period when the threat of hostile takeovers was extensive. This observation suggests that the 21 re-LBO transactions are the result, at least partly, by the hostile takeover threat. On the other hand, it may also be due to the fact that 1986 is a reasonable year to start seeing re-LBO firms since leveraged buyout transactions mainly started in the early '80s, and the average time of private ownership for a reverse LBO firm is 34 months (Muscarella and Vetsuypens, 1990). The average private
Reproduced with permission of the copyright owner. Further reproduction prohibited without permission.

42life found in the present sample of 21 re-LBOs, 30.83 months, is also consistent with Muscarella and Vetsuypens' reporting. Moreover, the average public life of these firms following their reappearance in the market is 31.12 months (median = 27.29 months), also comparable with their private life.
To examine empirically whether hostile takeover threats have a role in the occurrence of re-LBOs, The Wall Street Journal Index is searched to identify the sample firms that either received a competing bid or were subject to takeover speculation. The qualitative variable THREAT should capture the role of the takeover danger in the following logit analysis.3.4.2 The Announcement Effect of Second LBO Transactions:
An Event StudyA conventional market model event study is used to measure the prediction errors in stock returns as follows:
PEi.t= Ri,t - (&i + b ^ ) , (3)where Rift and R*,,. are daily returns for the stock of firm i and of the market portfolio at time t, respectively. Returns data are obtained from the CRSP (Center for Research in Security Prices) tape. Market return is proxied by the return on the CRSP value-weighted index. For each firm, parameters a* and bx are estimated using OLS regression for the period -170 to -21 relative to the announcement day. The market model is then used to compute prediction errors for the period beginning 20 days before the event day and ending 20 days after, as shown in the above equation. The
Reproduced with permission of the copyright owner. Further reproduction prohibited without permission.

43relevant null hypotheses are that the average prediction error (mean of prediction errors on any day across all 21 firms of the sample) and cumulative average prediction errors (summed average prediction errors across time for any event subperiod) are zero.
To test whether prediction errors are significantly different from zero, the following statistical tests are used: the standardized residual z-test of Patell (1976), traditional t-test proposed by Brown and Warner (1980), and the standardized cross-sectional t-test suggested by Boehmer, Musumeci, and Poulsen [BMP] (1991).5 The BMP-t test enhances the efficiency and the power of the earlier tests as follows: it allows for event-induced variance changes and the heteroscedastic event-day residuals, and it is adjusted for out-of-sample prediction error. The average prediction errors associated with the announcement of a going-private proposal reported in The Wall Street Journal for the 21 transactions are reported in Table 3.2.
On the announcement day, day 0, the average of prediction errors is 27.88%— definitely an economically significant number. All three statistical tests support the statistical significance of the announcement day effect at 1% level. In addition, 100% of the events (i.e., 21 re-LBO announcements) have positive returns. This evidence supports the view that target shareholders realize a value gain in the LBO transactions.
Reproduced with permission of the copyright owner. Further reproduction prohibited without permission.

44Table 3.2
DAILY AVERAGE PREDICTION ERRORS (APE) FROM 20 DAYS BEFORE TO 20 DAYS AFTER THE ANNOUNCEMENT OF 21 Re-LBOs
Day APE PercentagePositive Sign-test*Statistic Traditionalt-statistic Patell-Z BMP-t-20 -0.002552 47.6 -0.21822 -0.31454 -0.78725 -0.94789-19 0.020178 47.6 -0.21822 2.48662** 0.62490 0.34558-18 -0.005478 42.8 -0.65465 -0.67517 -0.62286 -0.97986-17 0.014784 61.9 1.09109 1.82188*** 1.98618** 1.91286***-16 0.032313 61.9 1.09109 3.98210* 5.57741* 2.04943***-15 -0.003524 42.8 -0.65465 -0.43436 -0.25949 -0.18902-14 -0.007618 33.3 -1.52753 -0.93881 -1.03202 -0.82621-13 -0.003524 42.8 -0.65465 -0.43428 -0.29310 -0.24104-12 -0.006866 42.8 -0.65465 -0.84623 -0.77878 -0.73514-11 0.011952 61.9 1.09109 1.47293 2.12496** 2.22730**-10 0.003678 57.1 0.65465 0.45326 0.70338 1.08312-9 -0.018775 28.6 -1.96396** -2.31370** -1.50853 -1.09541-8 -0.012052 57.1 0.65465 -1.48521 -0.80252 -0.58476-7 0.022095 57.1 0.65465 2.72286** 1.81530*** 1.14691-6 0.006457 38.1 -1.09109 0.79575 0.08292 0.06427-5 0.002090 47.6 -0.21822 0.25758 0.48796 0.36127-4 0.007733 38.1 -1.09109 0.95306 0.91213 0.84525-3 -0.002380 42.8 -0.65465 -0.29331 -0.29331 -0.04429-2 -0.001020 33.3 -1.52753 -0.12571 -0.29903 -0.24038-1 0.003041 38.1 -1.09109 0.37476 0.87108 0.603850 0.278840 100.0 4.58258* 34.36340* 44.96070* 5.30307*
+1 0.008972 57.2 0.65465 1.10567 1.21003 1.83301***+2 -0.001467 61.9 1.09109 -0.18083 -0.36350 -0.53020+3 0.004602 52.4 0.21822 0.56722 0.66606 0.78365+4 0.001163 42.8 -0.65465 0.14339 0.21262 0.55302+5 0.008598 52.4 0.21822 1.05960 0.87494 1.28254+6 0.028391 71.4 1.96396** 3.49876* 2.18885** 1.07134+7 -0.004784 33.3 -1.52753 -0.58962 -0.69894 -1.47760+8 -0.008632 33.3 -1.52753 -1.06383 -1.41372 -2.78438**+9 0.001410 42.8 -0.65465 0.17379 0.17582 0.35581+ 10 0.003277 57.1 0.65465 0.40388 0.81825 1.64618+11 -0.002585 38.1 -1.09109 -0.31866 -0.29596 -0.68261+12 0.002853 47.6 -0.21822 0.35159 0.30484 0.74948+13 -0.013584 47.6 -0.21822 -1.70736 -0.77522 -0.51267+14 0.004238 57.1 0.65465 0.52231 -0.07084 -0.07794+15 0.003405 47.6 -0.21822 0.41972 0.37759 0.91431+ 16 0.000306 23.8 -2.40040** 0.03780 -0.06008 -0.12314+17 -0.000428 52.4 0.21822 -0.05279 0.05589 0.13939+ 18 -0.002313 52.4 0.21822 -0.28511 0.11265 0.15996+ 19 0.005311 57.1 0.65465 0.65453 0.66859 1.42204+20 -0.006324 42.8 -0.65465 -0.77939 -0.48414 -0.81464(a) Associated z-values testing the null hypothesis that percentage positive is equal to 0.5.***, **, and * mark 10%, 5%, and 1% level of statistical significance, respectively, for two tailed tests.
Reproduced with permission of the copyright owner. Further reproduction prohibited without permission.

45The announcement; date reaction by the market is well
above that reported by the earlier studies of LBOs. This discrepancy might be due to the fact that a re-LBO transaction is quite different from a typical LBO; hence, its initiation may contain additional information that is not present in usual LBOs. The reader should recognize that this result is in line with the prediction of hypothesis 6, which is discussed in Chapter 5.
Figure 3.1 shows the cumulative average prediction errors (CAPE) for the event window from day -20 to day +20. This figure allows for a clear observation of the instantaneous response of the market to the re-LBO announcements; i.e., the
0.4
e 0.3 -
o0.2 -
<Do>
O
-0.1
-20 - 18 - 16- 14 - 12-10 -8 -6 -4 -2 0 2 4 6 8 10 12 14 16 18 20Day
Figure 3.1CUMULATIVE AVERAGE PREDICTION ERRORS
FOR THE [-20, +20] EVENT WINDOW
Reproduced with permission of the copyright owner. Further reproduction prohibited without permission.

46CAPE experiences a sudden and significant jump on the event date. Moreover, there seems to be no information leakage nor any associated gradual stock price build-up during the preannouncement period.
Stockholders certainly do realize a significant wealthincrease, as reflected by the 27.88% APE upon the initiationof the buyout. The average premium paid in these transactionsis a better measure, however, of wealth increase sincepremiums are measured directly (i.e., not as an excess oversome predicted value) and over the full period (i.e., not onlyat the announcement, but also including afterward) of thegoing-private transactions. In fact, the average premium is48.44%, well above the APE at the announcement date, anddifferent from 0 at 1% level of statistical significance. Inthe following OLS regression analysis, premiums, rather thanAPE, are used as the independent variable while searching forthe determinants of the premiums in re-LBO transactions.3.4.3 Comparison of the Effect of re-LBO Announcements with
the Effect of LBO Announcements Documented in Previous Studies
In general, findings of the present study are consistent with those reported in prior studies. Table 3.3 shows the main results of selected papers. The results are conclusive: announcements of going-private transactions are associated with significant positive excess returns. As a result, target shareholders receive an economic gain from the implementation
Reproduced with permission of the copyright owner. Further reproduction prohibited without permission.

47
Table 3.3SUMMARY OF GOING-PRIVATE TRANSACTION STUDIES
Study Period of Study Number of buyouts EventWindow* CAPE1’(%>
This study 1986-1994 21 [-U [0] [-1,0] t-1,+1] [-10,0] [-10,+10] [-20,0] [-20,+20]
.3027.8828.1929.0828.9733.1233.9437.15
Frankfurter and Gunay (1992)1979-1984 110 [-1][0][-1,0]
10.127.1217.24
Amihud (1989) 1983-1986 15 [-20,0] 19.60Lehn and Poulsen (1989) 1980-1987 244 [-1,+1] [-10,+10] [-20,+20]
16.3019.9020.50Lehn and Poulsen (1988) 1980-1984 93 [-1,0] [-10,+10] 13.9320.76Marais, Schipper, and Smith (1989) 1974-1985 79 [-1,0] 13.00
Travlos and Millon (1987) 1975-1983 56 [-1,0] [-10,+10] 16.2019.24Torabzadeh and Bertin (1987) 1982-1985 48 [Month 0] 18.64
Grammatikos and Swary (1986) 1975-1984 131 [-1,0][-10,0] 14.0419.52DeAngelo, DeAngelo, and Rice (1984) 1973-1980 72 [-1,0]
[-10,+10] 22.2728.05
(a) Day 0 is the event day, first announcement of the buyout offer commonly retrieved from. The Wall Street Journal. The event window is the event day plus and/or minus some number of days where the sign on the day is relative to day 0.(b) Cumulative average prediction errors.
of the leveraged buyouts. Management, therefore, is not the sole beneficiary in this potentially value-enhancing activity.
The gain accruing to target shareholders suggests that they are not fully exploited by the initiators of these transactions. The target shareholders' gain may be capturing
Reproduced with permission of the copyright owner. Further reproduction prohibited without permission.

48less than the total value of the firm after the LBO. Note that results of our study differ in that they indicate, for any event window, a greater market reaction to the going- private announcements compared with the earlier studies. In the absence of an accompanying statistical test, it is difficult to make a statement about this difference. However, this observation may be an indication of market participants' revised expectations. That is, if market participants think that they were fooled (in terms of splitting the gain with managers) in the first deal of the re-LBOs, they expect a higher premium for the second buyout. The larger cumulative average prediction errors of the current study may simply reflect, therefore, the market's retaliation in second buyouts.3.4.4 A Preliminary Comparison of Re-LBO and Control SamplesThe matching criteria in creating the control sample are as follows: (a) four-digit SIC code, and (b) market value ofequity at the end of the fiscal year preceding the year of the going-private transaction. Firms that have the same fourdigit SIC code and whose market value of equity most closely matches the re-LBO sample firm's equity are selected for the control firms. Table 3.4 lists the mean value of the above variables for both the going-private and control samples. The fourth column reports the mean difference in the value of each variable for each matched pair of going-private firm and corresponding control firm.
Reproduced with permission of the copyright owner. Further reproduction prohibited without permission.

49
Table 3.4MEAN VALUES OF VARIABLES FOR Re-LBO AND CONTROL FIRMS AND CORRESPONDING t-STATISTICS FOR DIFFERENCE IN MEANS TEST
FOR MATCHED SAMPLESVariable Re-LBO Firms
ControlFirms
MeanDifference t-Statistic
EQUITY (Million $)
104.730 89.788 14.938 0.847
CF/EQ 0.192 0.139 0.052 1.377SALESGR1 0.338 0.149 0.189 0.851SALESGR2 0.224 0.134 0.090 0.876SALESGR3 0.285 0.137 0.148 1.288SALESGR4 0.251 0.871 -0.620 -0.907TAX/EQ 0.099 0.039 0.060 3.032*THREAT* 0.286 0.095 1.620***(a) A z-statistic testing the difference between the proportions of two groups in THREAT is listed instead of a t-statistic. Twonon-parametric tests, Fisher's exact test and chi-square tests,also provided p-values slightly higher than 0.10.* Statistically significant at a 1% level.*** Statistically significant at a 10% level.
The associated t-statistic for difference in means test is given in the last column. This comparison should provide an initial feel for the free cash flow hypothesis. The mean difference in equity value is not significant. This is an expected result since the control sample is matched, in addition to four-digit SIC code, by equity value. Contrary to the prediction of free cash flow hypothesis, however, the most important variable of interest of the study, CF/EQ, does not convey a significantly larger mean value for the going-private sample than for the control sample. Average values of CF/EQ are 0.192 and 0.139 for going-private and control samples,
Reproduced with permission of the copyright owner. Further reproduction prohibited without permission.

50respectively. The average difference across the matched pairs is 0.052, not different from 0 at the conventional levels of statistical significance.
The mean values of the sales growth variables range from0.224 to 0.338 for the re-LBO sample, and from 0.134 to 0.871 for the control group. With the exception of SALESGR4, the going-private sample is characterized by systematically higher growth rates than the control group: a finding contrary to Jensen's argument. This finding is especially notable since the control group is formed from the same industries as the going-private sample. These differences in the mean values of the growth variables, however, are not statistically significant across the two samples.
The finding of no significant differences in undistributed cash flow and growth rates across the two samples is a serious challenge to Jensen's assertion that free undistributed cash flow and relatively low growth rates are the main characteristics of LBO targets. TAX/EQ, on the other hand, is significantly larger in the going-private sample than in the control sample. Average TAX/EQ is 0.099 for going- private firms and 0.039 for the control sample. The average difference across the matched pairs is 0.060, significantly different from 0 at the 1% level. To the extent that TAX/EQ measures approximate the maximum potential tax benefits associated with going private, this result supports the tax savings argument of LBOs documented in the literature.
Reproduced with permission of the copyright owner. Further reproduction prohibited without permission.

51The last variable, THREAT, takes the value of 1 for 28.6%
of the going-private firms and for 9.5% of the control group. This difference is hardly significant statistically (i.e., 10% level), suggesting that going-private transactions, at least re-LBOs, are not induced by the threat of takeovers. This casts another shadow of doubt on Jensen's free cash flow hypothesis.3.4.5 Determinants of the Likelihood of Going Private:
Logit AnalysisTable 3.5 reports results from four logit models in which the dependent variable is 1 for the firms in re-LBO sample and 0 for the firms in the control sample. The only difference in each equation is the growth variable that is included as an independent variable. The remaining independent variables of the models are CF/EQ, TAX/EQ, and THREAT. Coefficients for all four equations are estimated for the original sample. Two different test statistics are reported for each coefficient. The first is the asymptotic statistic reported by SAS; the second is based on the standard error of each coefficient obtained from the bootstrap algorithm. As expected, all bootstrap t-statistics (except for the intercept term in model 3) are lower because of their higher standard errors.
The results reveal a direct relationship between TAX/EQ and the likelihood of going private. Moreover, this relationship is statistically significant at the 5% level for all four equations. This systematic significant association between TAX/EQ and the likelihood of going private persists
Reproduced with permission of the copyright owner. Further reproduction prohibited without permission.
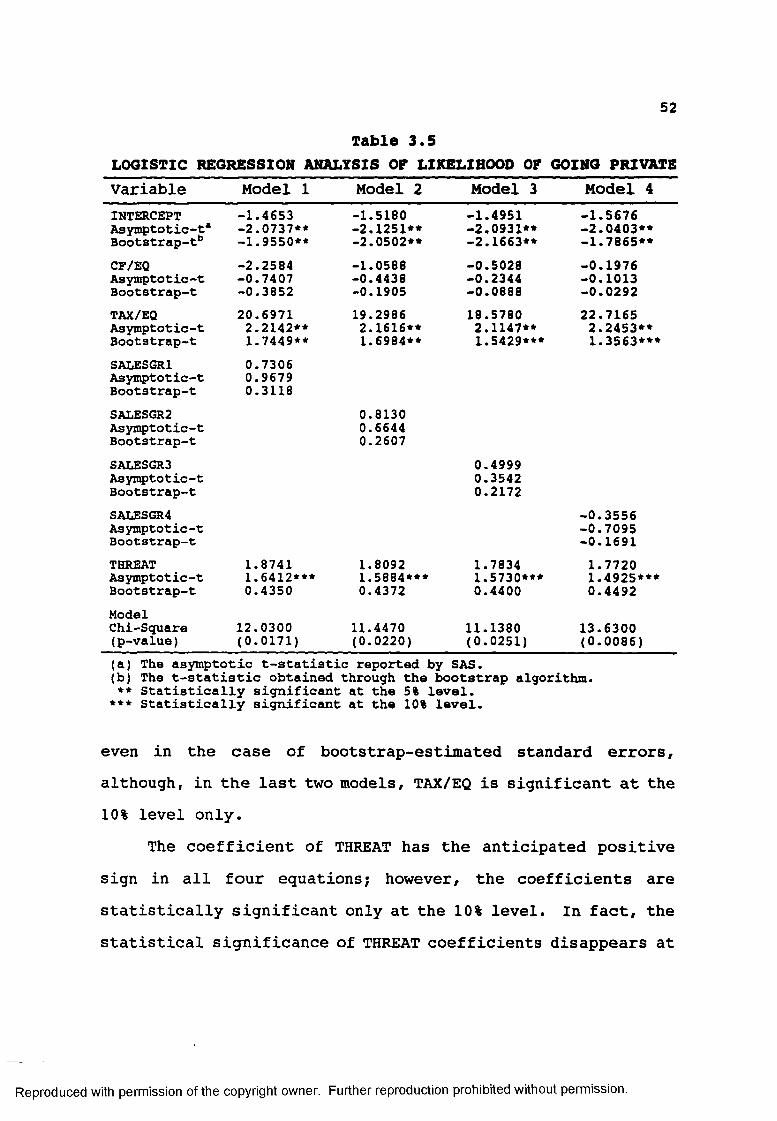
52Table 3.5
LOGISTIC REGRESSION ANALYSIS OF LIKELIHOOD OF GOING PRIVATEVariable Model 1 Model 2 Model 3 Model 4INTERCEPTAsymptotic-t*Bootstrap-tb
-1.4653-2.0737**-1.9550**-1.5180-2.1251**-2.0502**
-1.4951-2.0931**-2.1663**-1.5676-2.0403**-1.7865**
CF/EQAsymptotic-tBootstrap-t-2.2584-0.7407-0.3852
-1.0588-0.4438-0.1905-0.5028-0.2344-0.0888
-0.1976-0.1013-0.0292TAX/EQAsymptotic-tBootstrap-t
20.69712.2142**1.7449**19.29862.1616**1.6984**
18.57802.1147**1.5429***22.71652.2453**1.3563***
SALESGR1Asymptotic-tBootstrap-t0.73060.96790.3118
SALESGR2Asymptotic-tBootstrap-t0.81300.66440.2607
SALESGR3Asymptotic-tBootstrap-t0.49990.35420.2172
SALESGR4Asymptotic-tBootstrap-t-0.3556-0.7095-0.1691
THREATAsymptotic-tBootstrap-t1.87411.6412***0.4350
1.80921.5884***0.43721.78341.5730***0.4400
1.77201.4925***0.4492ModelChi-Square(p-value) 12.0300(0.0171) 11.4470(0.0220) 11.1380(0.0251) 13.6300(0.0086)(a) The asymptotic t-statistic reported by SAS.(b) The t-statistic obtained through the bootstrap algorithm. ** Statistically significant at the 5% level.*** Statistically significant at the 10% level.
even in the case of bootstrap-estimated standard errors, although, in the last two models, TAX/EQ is significant at the 10% level only.
The coefficient of THREAT has the anticipated positive sign in all four equations; however, the coefficients are statistically significant only at the 10% level. In fact, the statistical significance of THREAT coefficients disappears at
Reproduced with permission of the copyright owner. Further reproduction prohibited without permission.

53any conventional levels once t-statistics are calculated by bootstrap standard errors. Perhaps the most disappointing result for the free cash flow hypothesis is the coefficient estimates of CF/EQ and of four growth variables (SALESGR). All these variables are associated with statistically insignificant coefficients; moreover, the signs of coefficients, with the exception of SALESGR4, are all inconsistent with the prediction of free cash flow hypothesis. That is, CF/EQ produces a negative sign and SALESGR yields a positive sign (except for SALESGR4, which has an anticipated negative sign) in all four equations.
Overall, the results are discouraging for the Jensen's free cash flow argument. None of the estimated coefficients on CF/EQ and SALESGR are significant, and all but SALESGR4 carry signs inconsistent with the free cash flow hypothesis. The estimated coefficients of THREAT, on the other hand, all have the expected positive sign, but none are significantly different from 0.
The results support the tax savings rationale for buyouts, however. TAX/EQ enters four equations with an expected positive sign and is statistically significant in all the equations.3.4.6 Determinants of the Premiums Paid in
Going-Private Transactions: OLS Regression AnalysisThe prediction of the free cash flow hypothesis is not limitedto explaining variations in the likelihood of going private.Consequently, a conclusion, based on the previous section's
Reproduced with permission of the copyright owner. Further reproduction prohibited without permission.

54finding/ would be incomplete. One should also examine the ability of the free cash flow hypothesis to explain cross- sectional variation in premiums paid in these transactions. If the mitigation of agency problems associated with free cash flows is a major source of stockholders' gains in buyout transactions, then premiums paid in these transactions should be directly related to the level of the target's free cash flow. A similar argument holds for the target's tax obligation if tax savings are indeed an important source of stockholders' gains in going-private transactions.
Hence, in the following paragraphs, the premiums paid in 21 re-LBO transactions are estimated as a function of CF/EQ, TAX/EQ, and SALESGR. Table 3.6 reports the results from ordinary least-squares regressions of the premiums on the three explanatory variables.4 As in logistic regression analysis, a different SALESGR variable is used in each model.
The results are inconsistent with both the free cash flow and the tax savings hypothesis. The coefficient on CF/EQ is significant only for the equation where SALESGR1 proxies the reinvestment opportunities of the firms. It does, however, have a negative sign contrary to Jensen's explanation. In all the remaining equations, CF/EQ appears to have no statistically significant explanatory power for the premiums and carries mixed signs.
Reproduced with permission of the copyright owner. Further reproduction prohibited without permission.

55Table 3.6
OLS REGRESSION ANALYSIS OF PREMIUMS PAID IN GOING-PRIVATE TRANSACTIONS
Variable Model 1 Model 2 Model 3 Model 4INTERCEPT 0.4128(3.0730)* 0.3451(2.1700)** 0.5333(3.2270)* 0.4218(2.4300)**CF/EQ -1.2984(-2.1380)** -0.4489(-0.7090) 0.0293(0.0660) 0.1448(0.2890)TAX/EQ 1.3540(1.1660) 0.4761(0.3440) -3.0678(-1.6980)*** -1.5995(-0.8600)SALESGR1 0.5488(3.8240)*SALESGR2 0.7932(2.2070)**SALESGR3 0.8812(2.9240)*SALESGR4 0.7722(1.8950)**R-Square 0.5263 0.3150 0.4137 0.2725Adj R-Square 0.4427 0.1941 0.3102 0.1442*, **, and *** denote statistical significance at the 1% level, 5% level, and 10% level, respectively.
In contrast to its clear victory in explaining the likelihood of going private, coefficient estimates for TAX/EQ are not promising. TAX/EQ enters the third equation as a significantly (at 10% level) signed coefficient, but with an economically incorrect sign. The remaining coefficient estimates for this variable also carry mixed signs and are not significant.
Despite the fact that two major variables provide almost no explanatory power, R-square values of the models (especially for the first and the third models) are notably high. Model 1 has an R-square value of 52.63% (adjusted for degrees of freedom R-square value of 44.27%), and model 3 has
Reproduced with permission of the copyright owner. Further reproduction prohibited without permission.

56an R-square value of 41.37% (adjusted R-square value of 31.02). This finding suggests that the third explanatory variable of the model, SALESGR, is responsible for explaining the cross-sectional variation in the premiums paid in second buyouts.
This is indeed the case. SALESGR enters all the equations with a significant estimated coefficient. The coefficients of the SALESGR variable are statistically significant at the 1% level for equations 1 and 3f and at the 5% level for equations 2 and 4.
The most intriguing aspect of the findings with respect to SALESGR is that it has a positive estimated coefficient in all four equations. This result is inconsistent with the free cash flow hypothesis. In a similar case, Lehn and Poulsen (1989) argue that SALESGR may actually proxy for the tendency of managers to expend free cash flow on value-diminishing projects that expand the size of their firm. If so, the direct relationship between the PREMIUM and SALESGR can be interpreted as consistent with the free cash flow hypothesis. In this explanation, however, it is not clear why managers are willing to pay (and, by the same token, how stockholders can demand) higher premium for a firm whose cash flows are already wasted in value-reducing projects.
As an alternative explanation, it is possible that SALESGR may be proxying for the future growth potential. Recall that these firms are experiencing their second buyouts
Reproduced with permission of the copyright owner. Further reproduction prohibited without permission.

57after spending a relatively short period in the public arena following their first buyout. Accordingly, they might have gone through various organizational changes that could have enlarged their investment opportunity set both in the firm's current or diversified line of business. In essence, they are new firms. The upward trend in sales, combined with the fact that management wants to buy out the company, may therefore be a reflection of management's confidence in the future prospect and growth potential of the firm. Assuming that this fact has not been reflected in the stock price of the firm already, the positive relationship between the SALESGR and PREMIUM represents a revaluation of the firm's future growth prospects (or future cash flows).3.5 A Comparison of Results Obtained from the re-LBO Sample
with Lehn and Poulsen's ResultsRecall that the only difference between the Lehn and Poulsenstudy and the present one is the buyout samples. The samplesdiffer not only in terms of the time period they cover, butalso in terms of the nature of buyouts. That is, this studyuses a sample of re-LBOs rather than a sample of pure LBOs.Therefore, our sample (21 observations) is noticeably smallerthan the sample of Lehn and Poulsen (244 observations). Theperiod that Lehn and Poulsen cover is 1980 to 1987. Thegoing-private transactions of our sample, on the other hand,are spread through over the period 1986 to 1994.
Both studies investigate the relevance of Jensen's free cash flow hypothesis to LBOs. With the differences in the two
Reproduced with permission of the copyright owner. Further reproduction prohibited without permission.

58samples, these two studies produce noticeably different results. First, the announcements of second LBO transactions generate a higher CAPE than those of first LBOs. For the event window -1 to +1, for example, the present study finds a CAPE of 29.08%. The corresponding figure is 16.30% in Lehn and Poulsen's study.
Second, Lehn and Poulsen find that the likelihood of going private is directly related to the ratio of free cash flow to equity value, and inversely related to the growth rates in sales. The same analysis is applied to our re-LBO sample and produces statistically insignificant coefficients for all the free cash flow proxies in explaining the likelihood of going private. The only variable that appears to have a significant role in the going-private decision is the one that proxies for the tax savings potential of a firm as a result of buyout, TAX/EQ. This result is consistent with the tax savings explanation of buyouts. That is, the wealth transfer from the IRS through reduced tax payments appears to be a driving force behind re-LBOs as well. The same cannot be concluded for the free cash flow hypothesis. The findings of the present study suggest that the irrelevancy of the free cash flow hypothesis to going-private transactions cannot be rejected.
Third, Lehn and Poulsen find a positive significant relation between the premium paid to shareholders and the free cash flow variable. They find the growth variable to be
Reproduced with permission of the copyright owner. Further reproduction prohibited without permission.

59generally insignificant. It is significant, however, in one of the equations where it carries a positive sign contrary to the prediction of the free cash flow hypothesis. The results of the present study suggest that the premiums paid in the second buyouts are positively related to the growth rate in sales. This finding also contradicts Jensen's free cash flow hypothesis.3.6 Chapter Summary and ConclusionThis chapter examines the free cash flow hypothesis in management buyouts. If Jensen's free cash flow argument is an explanation for going-private transactions in general, it must be a major driving force behind re-LBOs as well. That is, regardless of a firm's past experience with LBOs, the free cash flow argument must also hold for the second LBOs.
Based on the examination of 21 re-LBO firms, the study finds no empirical support for the free cash flow hypothesis of going-private transactions. A comparison of these firms with a control sample suggests that the likelihood of going private is not related to the variables proxying the free cash flow. The tax savings argument of going-private transactions still holds, however, for the re-LBOs. The likelihood of going private for the second time is positively related to the tax savings potential of the firm. This relationship is statistically significant at the 5% level for all equations. This systematic significant association between TAX/EQ and the
Reproduced with permission of the copyright owner. Further reproduction prohibited without permission.

60likelihood of going private is robust to bootstrap-estimated standard errors.
As opposed to its power in explaining the likelihood of going private, TAX/EQ fails to explain the variation in the premiums in a cross-sectional analysis. The only variable that appears to have explanatory power in explaining cross- sectional variation is sales growth (SALESGR). The most intriguing aspect of the findings with respect to SALESGR is that it has a positive estimated coefficient in all equations. This result is also inconsistent with the free cash flow hypothesis.
Lehn and Poulsen (1989) argue that the indirect relationship between the premium and sales growth may actually exist and they support Jensen's argument. They try to justify this argument by noting that the sales growth variable may be reflecting the tendency of managers to expend free cash flow on value-diminishing projects that expand the size of their firm. In this explanation, however, it is not clear why managers are willing to pay (and, by the same token, how stockholders can demand) higher premiums for a firm whose cash flows are already wasted in value-reducing projects.
As an alternative explanation, it is possible that SALESGR may be proxying for the future growth potential. Recall that these firms are experiencing their second buyouts after spending a relatively short period in the public arena following their first buyout. Accordingly, they might have
Reproduced with permission of the copyright owner. Further reproduction prohibited without permission.

61gone through various organizational changes that could have enlarged their investment opportunity set both in the firm's current or diversified line of business. In essence, they are new firms. The upward trend in sales, combined with the fact that management wants to buy out the company, may therefore be a reflection of management's confidence in the future prospects and growth potential of the firm. Assuming that this fact has not been reflected in the stock price of the firm already, the positive relationship between the SALESGR and PREMIUM represents a revaluation of the firm's future growth prospects (or future cash flows) by the market.
Finally, the findings of the present study are consistent with those reported in earlier event studies of LBOannouncements. That is, the announcement of second LBOs is associated with positive average prediction errors. Theaverage magnitude of the reaction by the market, however, is somewhat above that reported by the prior LBO studies. This discrepancy might be due to the fact that a re-LBO transaction is quite different from a typical LBO. The initiation of a re-LBO transaction may contain additional information that is not present in LBOs.3.7 Notes to Chapter 31. The use of SIC codes in defining industries is a widely
used practice in both accounting and finance literature.It should be noted, however, that this classificationscheme is not perfect, and its accuracy has beenquestioned frequently in the recent literature. Forexample, Kahle and Walkling (1996) study differences in primary SIC codes for firms on Compustat and CRSP. They
Reproduced with permission of the copyright owner. Further reproduction prohibited without permission.

62report that SIC classifications for the same firms differ on CRSP and Compustat for approximately 80% at the fourdigit level. Guenther and Rosman (1994) also find differences in SIC codes reported by Compustat and CRSP and conclude that these differences may affect the outcome of empirical research. Given such differences between the two major sources of SIC codes (Standard & Poor's Compustat and the University of Chicago's CRSP databases), it is difficult to rely on the premise that SIC classifications produce homogeneous industries.
2. See Jeong and Haddala (1993) for a discussion ofbootstrap applications in econometrics.
3. For a compact description of these test statistics, see Boehmer, Musumeci, and Poulsen (1991).
4. The use of event-day prediction errors instead ofpremiums did not provide any meaningful improvement on the estimated coefficients or their interpretations.
Reproduced with permission of the copyright owner. Further reproduction prohibited without permission.

Chapter 4MANAGEMENT'S PERCEPTION OF BUYOUTS * A SURVEY
4.1 IntroductionManagement's belief that it can increase the market value of a firm through the buyout transaction reduces to an information asymmetry issue in an MM world where the MBO by itself cannot create value. As discussed in Frankfurter and Gunay (1993), managers and market participants perceive a different value for the firm. With the assumption that the firm is undervalued, ". . . management also expects realeconomic gains from the buyout" (ibid, p. 33).
A gap between market value and true value may persist if management's information about a firm's operation is not (or may not be) credibly conveyed to shareholders. In the current study, management, the acquirer, is viewed as possessing valuable information that can be transformed into efficient changes in the firm's investment, production, and organizational activities. The asymmetric information hypothesis also implies increased operating income following the buyout (a finding that is attributed in earlier studies solely to increased efficiency due to private ownership). That is, because of their information advantage, managers might, before the buyout, see an opportunity to increase the value of the firm via operating improvements. But they defer implementation of these improvements until after the buyout, thereby reserving most of the gains for themselves. This,
63
Reproduced with permission of the copyright owner. Further reproduction prohibited without permission.

64then, justifies the risk of paying too high a price and/or using massive leverage, obtained at high interest rates (see Madden et al., 1990).
Since the focus of this research is to investigate the information advantage of insiders, gains expected and realized by managers deserve particular attention. To capture the gains from investment, management seeks a way out of the LBO through one of the following exit mechanisms: liquidation, acquisition by an external party, private placing of shares, or issuance of stock. Since the consequences of each exit route may differ substantially, the eventual exit mechanism requires careful examination, presumably at the initiation stage of the buyout. This study focuses on only one exit route: issuance of stock.
In the reverse LBO, management, having achieved a substantial paper gain in the value of its equity after significantly increasing cash flow, sells the company back to the public. In addition to reducing the financial risk of the firm by lowering the leverage, reversing the LBO through stock market flotation affords the buyout investors, particularly managers, the opportunity to reduce their personal risk via portfolio diversification. This constitutes the first stage of the turnaround and is undertaken within a relatively short period of the initial buyout. Fuqua (1988) estimates the time of the first stage to be three to five years.
Reproduced with permission of the copyright owner. Further reproduction prohibited without permission.
65According to Ferenbach (1987), on the other hand, private
ownership lasts only one to two years. The transitory nature of the buyout might result from, among other things, the fact that the mechanism was undertaken to exploit the private information advantage. This point is also noted by Kaplan(1991) who reports that, for the sample of 183 LBOs completed between 1979 and 1986, the median time spent as a private firm was 6.8 years. All of these indicate that buyouts are not permanent, but are transitory. This finding supports the view of the current study.
Re-LBO, in the context of the current study, refers to the whole cycle initiated with the buyout of a public company, followed by a public offering (reverse LBO), and ending with a second buyout. The re-LBO, or re-leveraging, owes much of its growing popularity to the existence of parties (financiers) to invest in deals. Of course, this situation is aided by the fact that the company, which has already successfully accomplished one round of leveraging, attracts these investors. As Cummings (1989) states, ". . . it has a track record for managing successfully in a mode that features high debt and a maximization of cash flow." The cycle implies that managers, with their information advantage, take the firm private when it is undervalued and bring it back to the market when it achieves an acceptable market value.
Reproduced with permission of the copyright owner. Further reproduction prohibited without permission.

664.2 The Undervaluation Hypothesis (H2)As stated earlier, the purpose of this research is to investigate an observed phenomenon characterized by going private via MBO, reobtaining public status through an SIPO, and then going private a second time. Under the assumption that management possesses more information than shareholders, a company is taken private through an LBO and eventually brought back to the market. The initial buyout occurs because management, for whatever reason, believes that the market undervalues the firm. Hence, management sees an opportunity to come back with a price more consistent with its perceived value of the firm. This proposition is expressed as the first testable hypothesis:
Hypothesis 2: LBOs are done because management
believes that the firm is undervalued.
4.2.1 Questionnaire DesignTo discover the main incentive for an LBO, a survey of management's motivations regarding the buyout transaction was conducted. The objective of the survey was to investigate the CFO's perceptions of certain specific issues involved in buyouts. The statements used in the questionnaire, therefore, were drawn from interviews with managers of LBO firms in a variety of business publications as well as from previous research on MBOs.
The main point of interest in this survey is management's beliefs about the divergence between the "true" value and the
Reproduced with permission of the copyright owner. Further reproduction prohibited without permission.

67market value of their firms. This so-called asymmetric information explanation of buyouts suggests that insiders have more or better information than the market. Several questions are used in the questionnaire to investigate this point. Statement 6, for example, asks respondents whether thedivergence between the market value and the "true" value of the firm's stock was the main motivation for the buyout. Statement 10 seeks opinions on whether managers view the firm as less valuable as a whole than as the sum of its parts. (In the absence of information asymmetries, either form should make no difference.)
Statements 3, 4, 15, and 16 also seek to ascertain the role of management's subjective beliefs in buyouts. In statement 15, CFOs are asked whether their company wasperforming better than industry peers. In prior evidence, a common characteristic of buyout targets appears to be a successful past but recent inferior performance compared to a group of control firms.1 Statement 3 is essentially a portion of statement 10, and, hence, should provide complementary information. Statement 16 also fits into this group and has relevance for hypotheses 5 and 6 (in Chapter 5), since both hypotheses are based essentially on the premium paid to prebuyout shareholders. Statement 4 focuses on the role oftakeover specialists in an effort to determine whether their participation is necessary to determine and realize the gains in a buyout.2 A disagreement with this statement contradicts
Reproduced with permission of the copyright owner. Further reproduction prohibited without permission.

68the view that buyout specialists are one of the driving forces behind improved efficiency in private organizations and may be considered another piece of indirect evidence of managers' information advantage.3
In reverse LBOs, management, having achieved a substantial paper gain in the value of its equity, sells the company back to the public. This cycle may indicate that managers, with their information advantage, take the firm private when it is undervalued and bring it back to the market when it achieves a market value acceptable to them. This happens, presumably, within a relatively short period, possibly decided at the initiation stage of the buyout. The transitory nature of the buyout might result from the fact that the mechanism was undertaken to exploit the private information advantage. Statements 13 and 14 explicitly deal with these issues, and again seek to gather information for H2 and the remaining hypotheses in this study.
It is often indicated in the literature that managers may even distort the operating data through manipulation of accounting information to reduce the acquisition price. For example, Wu (1992), with a sample of 107 firms that were subject to an MBO proposal between 1980 and 1987, finds that managers depress operating income in the year before they propose the buyout. A corresponding decline in the stock price enables managers to buy the firm for a lower price. In an attempt to explore the management manipulation hypothesis,
Reproduced with permission of the copyright owner. Further reproduction prohibited without permission.

69statement 7 is included in the questionnaire. The question is whether CFOs believe that there is any relation between thepremium offered and recent trends in reported earnings pershare.
Another reason for management's desire to take the firm private may be a takeover threat. Statement 5 asks theopinion of respondents regarding the incumbent managementteam's destiny in a target firm after a third-party hostile takeover, statement 12 further examines the "takeover threat" by asking managers whether their firm was subject to a takeover by an outside group. Note that a disagreement with statement 12 strengthens the role of other possible motives, including information asymmetry, in buyout transactions. That is, a management buyout initiated by a takeover threat is a self-preservation mechanism and attempts to block the hostile takeover attempt rather than exploit an information advantage. Shleifer and vishny (1988) argue that this is particularly true for very large firms where ". . . the primary impetus behind the MBO is often not the prospect of making a large acquisition profit, but rather the threat that someone will do so at management's expense" (ibid., p. 92).
There has been a growing debate about MBOs from a number of ethical perspectives (see Filatotchev et al., 1994; Jones and Hunt, 1991; Bruner and Paine, 1988; and Houston and Howe, 1987, for example). Jones and Hunt (1991), in opposition to the utilitarian defense of buyouts, argue that such
Reproduced with permission of the copyright owner. Further reproduction prohibited without permission.

70transactions do not maximize the net utility of all stakeholders affected by the deal or the net utility of society as a whole. In fact, a generally negative effect on social mores has been suggested. According to Filatotchev et al. (1994), this negative effect ". . .is epitomized in the description of corporate raiders as individuals who know the price of everything and the value of nothing!" This makes management motivation in buyouts suspect, at least from a moral perspective.
Statement 17 is drawn from Magowan's article (1989) on Safeway's LBO experience. (Magowan was the company's CEO and president.) Statement 17 seeks to determine whether managers accept the clear conflict in MBOs as opposed to an outside takeover. Managers may be well aware that the company's activities could be organized profitably, but they may be reluctant to do so without capturing the whole reward for their substantial efforts. Withholding the privileged information about potential value-additive activities and hence the true value of the firm allows them to bid a lower price in buying out the company. So, the ethical issues involved in buyouts and the undervaluation (asymmetric information) hypothesis are essentially linked.
Statements 2 and 11 also focus on ethical issues involved in buyout transactions. Statement 11 seeks to confirm the findings of Frankfurter and Gunay (1993) by directly asking managers whether the premium in a buyout is larger, ceteris
Reproduced with permission of the copyright owner. Further reproduction prohibited without permission.

71paribus, when incumbent management also sells off some of its shares. Statement 2 makes the point that, in a buyout, management acts on both sides of the deal. On one side, it is the agent acting on behalf of the shareholders to determine whether both the sale of the firm and the offer price are in their best interest. On the other side, management acts according to "me-first" rules. This is clearly a conflict of interest stemming from a principal-agent relationship.
Statements 1, 8, and 9 focus on another conflict of interest that may be present between management and shareholders of publicly held companies. Statement 1 asserts that a buyout allows management to focus on long-term growth and profitability, whereas statement 8 states that outside shareholders exert pressure to increase earnings figures for the next quarters. Presumably, a buyout frees management from responsibility to, and demands from, stockholders. Management is no longer concerned about market pressures or short-term prospects. Without the obligation to create satisfying shortterm reports for stockholders, management can focus on longterm growth and profitability.
For a sample of large MBOs, Lowenstein (1985) reports a median value of 10.4% management ownership following the buyout, compared with a median 3.8% before the transaction. This 10.4% management ownership is consistent with the findings of Morck, Shleifer, and Vishny (1988) who report a 5% to 10% range of management ownership for the best performing
Reproduced with permission of the copyright owner. Further reproduction prohibited without permission.
72firms. The conventional wisdom is that increased percentage ownership raises management's personal benefit from improving efficiency, and hence, induces management to squeeze additional value out of the firm's assets. Statement 9 seeks to determine whether the incentive of managers increases after the buyout.4.2.2 Construction of the Survey SampleThe survey sample is constructed from 600 companies that have gone through an MBO. For the purposes of this study, an MBO is defined as the purchase of a corporation or a division by a group that includes some members of management; e.g., the board of directors and the top officers of the corporation.
The study covers the period 1980 to 1995. Several sources are used in constructing the sample:(1) Going Public-The IPO Reporter, a publication of
Investment Dealers Digest. The January 18, 1988, issue had a list of 45 reverse LBO firms.
(2) Mergers & Acquisitions. Various issues include a selected set of LBO companies that have gone public. The November/December 1987, November/December 1990, and November/December 1991 issues listed 44, 14, and 21 such firms, respectively.
(3) W.T. Grimm's Mergerstat Review. Eleven annual editions between 1985 and 1995 were used to identify MBO firms. Nine additional MBO firms were identified from pages 14- 29 and page 77 in the 1990 edition.
Reproduced with permission of the copyright owner. Further reproduction prohibited without permission.

73(4) The Yearbook on Corporate Mergers, Joint Ventures and
Corporate Policy. This is an excellent source for the purpose at hand, but it was available for the years 1985, 1986, and 1988 only.
(5) Investment Dealers Digest (IDD) Information Services. Mr. David Kwateng at IDD in New York provided a comprehensive, updated list of reverse LBOs that occurred in the period 1980 to 1996.
(6) Previous studies in the literature on MBOs. These identify a number of LBOs: 278 in Lehn and Poulsen (1989); 33 in Liebeskind, Wiersema, and Hansen (1992); and 51 in Opler (1992).
(7) Professor Chris J. Muscarella. He supplied a list of 90 reverse LBOs generated by Kidder, Peabody & Co. in 1988. The final sample of MBOs includes those transactions that
satisfy the following criteria: The Wall Street Journalcontains an announcement that the company proposed to go private, wherein at least one member of the incumbent management team will have an equity interest. This search process yielded a sample of 600 firms eligible for the survey.
A mail questionnaire (see Appendix) including the 17 closed-end statements discussed above was used to survey one of the following individuals in each company: the chieffinancial officer, treasurer, or the vice president of finance.4 The possible response to each statement ranges, on a continuous scale, from strong disagreement (0) to strong
Reproduced with permission of the copyright owner. Further reproduction prohibited without permission.

74agreement (4). The middle of the scale (2) represents the respondent's neutrality with regard to the statement, and the lack of a response entirely is interpreted to mean the statement is irrelevant for that firm. In order to improve the response rate and reduce potential non-response bias, a second mailing was sent within 4 to 6 weeks to those who did not reply initially.
Of the 600 firms originally selected for the sample, 33 were excluded because of insufficient addresses, resulting in an initial sample of 567. The two completed mailings yielded a total of 131 valid responses, a 23% response rate. Table4.1 (pages 75 and 76) presents a simple tabulation of the responses.4.3 Results and DiscussionTable 4.1 shows the statements and the summary statistics derived from the responses. To provide an easy interpretation, statements are presented in the order of functional clusters discussed in Section 4.2.1 rather than in the order in which they appeared in the questionnaire. The first number attached to each statement indicates its order in the questionnaire. The number in parentheses, on the other hand, shows the rank of the statements sorted in descending order according to the rate of agreement. The first three columns following the statement present the frequency (as a percentage of all responses to that statement) of responses expressing disagreement (scale values smaller than 2), neutrality (scale
Reproduced with permission of the copyright owner. Further reproduction prohibited without permission.

Reproduced
with perm
ission of the
copyright ow
ner. Further
reproduction prohibited
without
permission.
Table 4.1MANAGEMENT'S PERCEPTION OF BUYOUTS: SUMMARY STATISTICS OF THE SURVEY
STATEMENT® DISAGREE NEUTRAL AGREE RATIOb MEAN MEDIAN MODE z-value0
6.(U)Information AsymmetryThe main motivation for our buyout waa our opinion that prebuyout market prices of our stock did not reflect their "true* value.
34.4 11.5 54.1 1.57 2.23 2.45 3.00 1.38*
10.(5) A buyout la an appropriate strategy In a firm for which the partB are worth more than the whole.
13.1 16.9 70.0 5.35 2.68 3.00 3.00 6.99***
3.(4) It la easier for a private firm to Bell assetB or divisions than It Is for a publicly held company.
18.3 11.5 70.2 3.83 2.66 3.00 3.00 6.31***
4.(14)
It is necessary to rely on outside consultants and takeover specialists to determine the gains of a buyout.
55.7 14.5 29.6 0.53 1.56 1.40 1.00 -3.21***
15.(12) Before the buyout my company was performing
better than comparable firms within the same industry.
29.9 16.5 53.5 1.79 2.20 2.20 2.00 2.48***
16.<7)
Premiums paid to shareholders In a buyout are not necessarily indicative of the difference between the market value of the stock and management's belief about the "true" value of the stock.
13.1 20.0 66.9 5.12 2.51 2.65 3.00 6.73***
13.(3)
The equity investors in a buyout usually go public again in three to five years. 6.2 20.0 73.8 12.00 2.68 3.00 3.00 8.49***
14.(2) The equity Investors receive a return on
their investment commensurate with the risk they take.
10.0 13.1 76.9 7.69 2.84 3.00 3.00 8.05***
7.(9) The premium offered is affected by the recent trend in reported earnings per share. 27.3 15.6 57.0 2.09 2.25 2.35 3.00 3.32***
(a)The number that, appears within parentheses attached to each statement displays the rank of the statements if they were sorted in descending order according to their agreement rate.(b)Ratio for each statement is computed as followsi Number of Agreeing Respondents/Number of Disagreeing Respondents.(c)z-value is the test statistic for hypothesis that the proportions of agreeing and disagreeing respondents for each statement are equal.* Significant at 10% level, ** significant at 5% level, and *** significant at 1% level.(Table cont'd.)
^1U1

Reproduced
with perm
ission of the
copyright ow
ner. Further
reproduction prohibited
without
permission.
STATEMENT* DISAGREE NEUTRAL AGREE RATIOb MEAN MEDIAN MODE z-value°Takeover Threat
5.(6)
In a hostile takeover, Incumbent management of the target firm is replaced. 13.2 18.6 68.2 5.18 2.62 3.00 3.00 6.67***
12.(16)
The main motivation in our buyout was that the firm was subject to a ho&tile takeover.Ethical Issues
72.2 5.6 22.2 0.31 1.08 0.45 0.00 -6.11***
17.(15)
There is an element of disloyalty in a management-led buyout since it amounts to admitting that management will do a better job for themselves than they did for shareholders.
53.5 18.9 27.6 0.51 1.54 1.70 2,00 -3.58***
2.(13)
In management buyouts there is a conflict of interest on the part of the management in that it is acting on both sidea of the transaction as buyer and seller of a company.
37.7 19.2 43.1 1.14 2.02 2.00 2.00 0.58
11.(17)
The premium in a buyout is larger, other things being equal, when incumbent management also sells off some of its shares.Conflict of Interest
46.4 32.8 20.8 0.45 1.70 2.00 2.00 -4.00***
1.(10)
A buyout allows management to focus on longterm growth and profitability.
26.7 19.1 54.2 2.03 2.28 2.30 2.00 3.49***
8.(1)
Outside shareholders exert pressure in a publicly held company to increase or at least maintain previous quarters' earnings figures.
5.3 5.3 89.3 16.71 3.15 3.20 3.00 9.88***
9.(8)
Firm performance improves after a buyout because of a closer relation between management action and rewards.
22.1 13.7 64.1 2.90 2.57 2.80 3.00 5.17***
(a)Ths number that appeara within parentheaea attached to each atateaent diaplaya the rank of the statements if they were aorted in descending order according to their agreement rate.(b)Ratio for each atateaent la computed aa followai Number of Agreeing Respondents/Number of Diaagreeing Respondents.(c)z-value is the teat statistic for hypothesis that the proportions of agreeing and disagreeing respondents for each statement are equal.* Significant at 108 level, ** significant at 58 level, and *** significant at 1% level.
o\

77value 2), and agreement (scale values greater than 2), respectively. Also displayed in columns 5 through 8 are the ratio of agreement to disagreement responses, the mean, the median, and the mode for each statement. The last column provides test statistics and associated table values for the hypothesis that the proportion of agreeing and disagreeing respondents is equal. Put another way, agreeing respondents expressed as the percentage of agreeing plus disagreeing respondents is hypothesized to be equal to 0.5. Since the following discussion focuses on the agreement versus disagreement rate for each statement, it might be informative to note that, except for statements 2 and 6, all the statements are associated with a significant z-value.
Evidence of underpricing of the firm's equity relative to fundamental value is tenuous, possibly because it "runs counter to the efficient market hypothesis, which has been the bedrock of financial economics for many years" (Shleifer and vishny, 1988). Of particular interest are those statements that attempt to determine the undervalued stock/firm perception by management.
The statistics for statements 6 and 10 show that, in the making of buyout decisions, divergence between the market and perceived value of the firm plays an important role. The majority of respondents agree with both of these statements. In fact, statement 10, having an agreement rate of 70%, is among those showing the highest percentage of agreement.
Reproduced with permission of the copyright owner. Further reproduction prohibited without permission.

78There is a very close agreement rate for statement 3 (70.2%) which/ as discussed before, was introduced as a complement to statement 10.
Statements 15 and 16 are also in agreement, which is particularly substantial for statement 16 (a 66.9% agreement frequency and a ratio of 5.12). Proponents of LBOs argue that, in new private organization, there is a significant efficiency improvement. This, in turn, is realized as a value gain, part of which accrues to pre-buyout shareholders in the form of premium (somewhere around 50%) over the prevailing market price of the stock. Of course, a sudden enormous gain is definitely desirable by shareholders and fits one of the core assumptions of corporate finance in that the objective of management is to increase the value of the stock/firm. However, as reflected in statement 16, managers do not deny that they do not let all the potential gain flow to shareholders.
As far as statement 15 is concerned, recall that a successful past, followed by a recent inferior performance, is a common characteristic of buyout targets. Moreover, Wu(1992) reports a management-induced depression in operating income, with a corresponding decline in stock price in the year before the buyout proposal. These facts suggest that management's opinion that the company is performing better than industry peers is formed mainly by their "subjective beliefs" and/or private information rather than stock market
Reproduced with permission of the copyright owner. Further reproduction prohibited without permission.

79or publicly available financial measures; or, they want to hide their intention. It would be useful to study, separately, the responses at the two extremes, using accounting and market data.
Many, if not all, the questions discussed above are designed to address the undervaluation hypothesis, which seems to be supported by the analysis so far. That is, the firm is perceived to be more valuable as parts than as a whole, the pre-buyout market price does not reflect the "true" value of the stock, and the premiums paid to pre-buyout shareholders do not exhaust the gains to be realized by managers. In fact, as the results for statement 14 indicate, 76.9% of the respondents view management buyouts as highly profitable strategies, providing them with a sufficient return to cover not only their effort but also the risk they face.
Statement 13 ties in with statement 14 and provides support for both the first and second hypotheses. Combined, these two hypotheses can be restated as follows: LBOs areinduced by perceived undervaluation of the firm by management whose intention is to realize a profit with the company going public again. Three to five years' life expectancy for the private form (emphasized in statement 13) receives an agreement rate of 73.8%, which is the third highest among the 17 questions covered in the survey, and has an agreement-to- disagreement ratio of 12. This result supports the idea put forth by Ainina and Mohan (1991) that the buyout is ". . .a
Reproduced with permission of the copyright owner. Further reproduction prohibited without permission.

80process which implies that superior information is held by the insiders who decide when to exit and enter the public market" (ibid., p. 394). Such a strategy definitely runs counter to the many explanations for going-private transactions given in earlier studies because their strong argument on the behalf of going private transactions has no room for a quick return to public markets. These explanations include, for example, savings of public-ownership expenses, increased managerial ownership (convergence of interest), and buyout specialist monitoring.
The highest rate of disagreement, 72.2% and 55.7%, is with statements 12 and 4, respectively. Contrary to common belief and previous empirical findings, statement 4, with a 0.53 agreement-to-disagreement ratio, indicates that outside consultants and/or takeover specialists are not considered important to the success of a buyout. Responses to statement 12 indicate that a third-party hostile takeover attempt is not the main reason for an MBO. This finding strengthens other possible explanations for a buyout, including the information advantage of managers. It also removes any potential bias that might have been brought in by the dominance of "hostile takeover" MBOs in the survey group. As reflected in a 68.2% agreement frequency and a 5.18 agreement-to-disagreement ratio, the response to statement 5 indicates that managers view hostile takeovers as a definite threat.
Reproduced with permission of the copyright owner. Further reproduction prohibited without permission.

81A less common version of the asymmetric information view
argues that managers misrepresent pre-MBO earnings to make the company appear unattractive, thereby reducing the purchase price. Although they do not provide direct evidence in support of this view, the responses to statement 7 do indicate that managers believe that the recent trend in reported earnings is an important determinant of the premium offered to pre-buyout shareholders. This finding, together with the conclusion of Wu (1992), implies that there is a great deal of incentive to distort accounting information.
Statements 2, 11, and 17 address the ethical issuesinvolved in the management-led going-private transactions. A common feature of the responses to these statements is the high neutrality rate. In a range of 5.3% to 32.8% for neutrality for the entire set of statements in the survey, statements 11, 2, and 17 have a rate of 32.8%, 19.2%, and 18.9%, respectively. Overall, the evidence on the ethical side of the buyouts is somewhat mixed: the respondents tend to agree there is a conflict of interest in MBOs as managers act as both buyers (in their own interest) and as sellers (in the stockholders' interest) in the same deal. They do not view buyout transactions as a shrugging off of fiduciarial responsibilities, however. In fact, inherent in an MBO, there appears to be the expectation that "we can and will do a better job for ourselves than we did for shareholders." In addition to providing an idea about management's opinion on
Reproduced with permission of the copyright owner. Further reproduction prohibited without permission.

82the ethical issues involved in MBOs, the responses to these statements can be considered valuable evidence (as reflected by the high neutrality rate for all three statements and a dominating disagreement rate for statements 11 and 17) that the questionnaires were responded to by knowledgeable people.
The last group of statements, 1, 8, and 9, pertain to possible conflicts of interest between managers and shareholders. Statement 8, with a 89.3% frequency rate, receives the highest agreement among all statements of the survey. The obligation to satisfy stockholders through shortterm earnings performance acts as a clear constraint and is somewhat troublesome to managers. As an a priori expectation grouped with statement 8, statement 1 (although not as strong as its counterpart) also receives an agreement from respondents. It has an agreement frequency of 54.2% and an agreement-to-disagreement ratio of 2.03. As mentioned, statement 9 also aims to shed light on the conflict-of- interest dimension of the MBOs. The increased equity ownership of management, together with its investment of human capital in the firm, can act as a powerful incentive. Under this scenario, managers' decisions will unambiguously aim to increase the firm value as opposed to counteracting objectives that may be pursued in the pre-LBO firm. This statement receives a 64.1% agreement frequency and a 2.90 agreement-to- disagreement ratio, supporting the convergence of interest hypothesis (i.e., agency theory) in corporate finance.
Reproduced with permission of the copyright owner. Further reproduction prohibited without permission.

834.3.1 Factor Analysis and ClusteringFactor analysis is generally used to summarize or condense the information in a large set of variables into a set of components, which/ in turn, enables the analyst to examine the common underlying patterns in the data. In the present context, the objective is not to identify or name the underlying factors, but rather to use the information to group respondents into several clusters of shared perceptions. The lack of significant differences among these clusters with respect to any of the survey statements should reveal a homogeneity in management's perceptions.
The results of principal component factor analysis are presented in Table 4.2. Eigen values, percentage of variance, and the accounted-for cumulative percentage of total variance are shown in columns 2, 3, and 4, respectively.
The latent root criterion suggests retaining those components having Eigen values greater than 1.0. This selection results in six components, which account for 57.2% of the total variance. The Eigen values indicate the relative importance of each factor in accounting for the variance associated with the set of variables. Factor 1, having the highest Eigen value, accounts for most of the explanation of the variance, 13.6%. The total amount of variance extracted by six factors is 9.71.
Reproduced with permission of the copyright owner. Further reproduction prohibited without permission.

84Table 4.2
RESULTS FOR THE EXTRACTION OF COMPONENTSFactor Eigen Value Percentage of Variance CumulativePercentage
1 2.30885 13.6 13.62 1.85333 10.9 24.53 1.76949 10.4 34.94 1.41367 8.3 43.25 1.29173 7.6 50.86 1.08156 6.4 57.27 .96512 5.7 62.88 .91030 5.4 68.29 .82038 4.8 73.010 .78305 4.6 77.611 .74342 4.4 82.012 .70954 4.2 86.213 .57535 3.4 89.614 .53491 3.1 92.715 .45888 2.7 95.416 .42003 2.5 97.917 .36039 2.1 100.0
A supporting device to decide how many principalcomponents to retain is the scree curve. Figure 4.1 presentsthe scree curve that plots the Eigen values associated with each component in successive order of its extraction. Results of the scree test in this case suggest two additional factors since it appears that a break occurs after the eighth factor. Moreover, the Eigen values for these two factors, which are 0.965 and 0.910, respectively, are very close to the latent root criterion value of 1.0. The following analysis is based on these two extra factors as well. The eight factors explain 68.2% of the total variation.
Reproduced with permission of the copyright owner. Further reproduction prohibited without permission.

Factor Number
Figure 4.1 SCREE CURVE OF EIGEN VALUES
Component loadings for the eight factors are displayed in Table 4.3. The underlined values represent each variable's highest loading (in absolute value). In some cases, the values represent the two highest loadings if they are similar in size. The last column, designated communality, summarizes how each variable is explained by the eight factors extracted. Communalities associated with statements 1-2, 4-9, 11-14, and 16-17 are all at or above 0.63.5 This indicates that a large portion of the variance in these statements has been extracted by the present factor solution. The communality figures for statements 3, 10, and 15 are smaller, however, suggesting that they have less in common with the other statements.
Reproduced with permission of the copyright owner. Further reproduction prohibited without permission.

86
Table 4.3UNROTATED COMPONENT LOADINGS AND COMMUNALITIES
FactorsCommunalityStatement 1 2 3 4 5 6 7 8
1 .473 -.200 -.253 .473 .174 .211 .114 .159 0.6652 .544 .296 -.052 -.485 -.062 .168 -.014 -.035 0.6573 .472 -.202 -.073 .043 -.484 -.257 .143 -.044 0.5944 .278 .411 -.072 .441 -.377 .160 -.067 .137 0.6395 .146 .252 .493 -.039 -.010 -.216 -.087 -.693 0.8666 .276 .157 -.175 .232 .610 .200 -.170 -.064 0.6317 .353 .322 .190 .187 .193 -.369 .531 .157 0.7818 .274 .066 .269 -.455 .409 .000 .393 .157 0.7079 .562 -.540 .200 .110 .029 .036 -.090 -.092 0.68010 .422 -.318 .179 .008 -.328 .337 .224 -.107 0.59611 .301 .369 .481 .367 .048 .158 -.200 -.052 0.66512 -.104 -.244 .618 -.055 -.198 -.181 -.225 .462 0.79413 -.279 -.052 .627 .165 -.040 .235 .264 .024 0.63014 .011 -.650 .321 .070 .373 -.011 -.191 -.019 0.70915 -.423 .301 .188 .412 .066 -.189 .059 .038 0.52116 -.387 .155 .194 -.150 -.078 .654 .158 -.012 0.69417 .427 .431 .225 -.287 .014 .002 -.409 .297 0.758
An initial examination of the factor loading pattern reveals that a clear-cut interpretation is difficult since, in many cases, different factors get almost the same amount of loading from the same variable. This necessitates a rotation of the factor matrix to redistribute the variance so that a simple loading pattern can be reproduced for an unambiguous interpretation.
The results of the orthogonal varimax rotation method are shown in Table 4.4.® The highest loading for each variable (in absolute value) across the eight factors is underlined.
Reproduced with permission of the copyright owner. Further reproduction prohibited without permission.

87
Table 4.4 VARIMAX ROTATED COMPONENT LOADINGS
Statement:Factors
l 2 3 4 5 6 7 81 .425 -.129 .238 -.105 -.154 .510 -.307 .1442 .188 .746 .048 -.211 -.002 -.020 .077 .1053 .518 .040 .211 -.034 -.396 -.329 .014 .1074 .077 .066 .788 -.037 -.015 .061 -.019 .0185 .033 .062 -.022 -.031 -.013 -.049 .923 .0706 -.076 .104 .006 -.177 -.064 .758 .019 .0527 -.009 -.005 .170 -.007 -.155 .056 .095 .8458 .062 .398 -.405 .039 .178 .078 -.010 .5839 .699 .016 -.134 .232 -.219 .245 .102 -.01610 .733 .068 .091 -.002 .189 -.090 .026 .02411 .050 .116 .459 .279 .155 .361 .434 .12912 .032 .008 -.038 .855 .042 -.238 -.017 .00913 .074 -.293 .009 .347 .581 -.079 .190 .19114 .281 -.244 -.502 .434 -.044 .329 .059 -.11915 -.455 -.421 .240 .137 .103 .013 .153 .15916 -.077 .039 .021 -.073 .807 -.075 -.050 -.14517 -.124 .740 .229 .319 -.096 .127 .105 .052
Statements loading on factor 1 are 3, 9, 10, and 15. Noticethat, except for 9, these statements have been presumed to be related to the undervaluation hypothesis of LBOs. Also noticeable is the negative sign of statement 15's loading.
Factor 2 is dominated by statements 2 and 17. Both of these statements are assumed to be related to ethical issues in management-led buyouts. The third statement, statement 11, included in this group as a priori, however, loads on factor 3, along with statements 4 and 14. Interestingly, the negative sign of 14 may be interpreted (considered with
Reproduced with permission of the copyright owner. Further reproduction prohibited without permission.

88statement 4) that management believes that there is a sufficient return for equity investors in buyouts and that they do not want to share it with buyout specialists.
The only underlying statement of factor 4 is statement 12 with its significant loading of 0.855. Factor 7 is the only other component that attracts just one statement (statement 5). These two statements were grouped together a priori with the expectation that they would capture the third-party, hostile-takeover dimension of the buyouts.
Factor 5 is loaded with statements 13 and 16. Although they were covered in different groups in the initial discussion, these two statements also address the under valuation/asymmetric information issue. Statement 6, which deals directly with undervaluation of stock prior to the buyout, and statement 1 load together on factor 6. Factor 8 captures the remaining two statements, 7 and 8.
Being, in a sense, a condensed representation of several statements, the eight factors are all believed to be the most relevant variables in characterizing the objects to be clustered. The factor scores, therefore, are saved for use in the following cluster analysis. This search should indicate whether the respondents can be partitioned into relatively homogeneous subsets based on the interobject similarities. The objective, therefore, is to specify the number of clusters and examine their similarities.
Reproduced with permission of the copyright owner. Further reproduction prohibited without permission.

89In the absence of a priori information or expectation
about the number of groups that may prevail, the first step in the analysis takes an exploratory path and aims to ascertain the number of groups, in partitioning the data, two different interobject similarity measures (Euclidian distance and squared Euclidian distance) and two different clustering algorithms (average linkage and Ward's method) are used.
At first, an agglomerative hierarchical procedure is run for each of the algorithms in the aforementioned statement. Since the results of the average linkage method do not indicate any meaningful grouping of the sample, the remaining analysis concentrates on the two Ward techniques. Table 4.5 provides the percentage change in agglomeration coefficients for the two different ward techniques used in hierarchical algorithms.
Table 4.5ANALYSIS OF AGGLOMERATION COEFFICIENTS:
HIERARCHICAL CLUSTERINGPercentage Change Coefficient toin Agglomeration Next LevelEucledian Squared Eucledian Distance Number of Clusters
5.6 3.2 105.4 3.1 95.9 3.2 85.7 3.5 76.3 4.1 67.3 4.1 57.1 4.4 47.7 4.2 38.9 5.1 2- - 1
Reproduced with permission of the copyright owner. Further reproduction prohibited without permission.

90The relative increases in the clustering coefficient for
10 to 2 clusters displayed in the first column of Table 4.5 suggest five or fewer data groupings. The second column/ on the other hand, indicates a lower number of groupings (2 or possibly none). Note that the conclusion of no grouping (or the existence of a single group only) is consistent with the results of average linkage models since they did not suggest any number of data groupings, either. As stated by Hair et al. (1992), however, ". . . cluster analysis, along withfactor analysis, is much more of an art than a science." The findings of hierarchical methods are complemented, therefore, by a set of non-hierarchical runs to fine-tune the results.
In hierarchical algorithms, once an object joins a cluster, it is never removed and is fused with other objects belonging to some other clusters. Thus, undesired early combinations may lead to artificial results. Unlike hierarchical techniques, non-hierarchical techniques do not require that the allocation of an object to a cluster be irrevocable. For each of the potential groupings (2 to 5) suggested by hierarchical cluster analysis, a non-hierarchical clustering process is run. For the extracted groups, then, a multivariate analysis of variance (MANOVA) model is applied for all 17 statements being studied. This application is intended to reveal whether the mean vector for at least one cluster is statistically significantly different from the mean vectors of the other clusters.
Reproduced with permission of the copyright owner. Further reproduction prohibited without permission.

91Regardless of which number of groupings between 2 to 5 is
selected, significant differences are observed among clusters. In Table 4.6, however, only the results for the three-cluster case is reported. Although, there is no particular reason for reporting only the three-group clustering, this clustering is the only one to generate a relatively equal number of cells, which is an important requirement for the subsequent univariate analysis of variance (ANOVA) to be meaningful. As Panel B of Table 4.6 shows, differences among the three groups are significant with respect to statements 1-3, 5-7, 9-11, 13, and 15-17.
The majority of the statistically significant differences among groups, however, stems not from directly opposing views (i.e., disagreement versus agreement), but rather from the strength of the consensus [i.e., one cluster agrees (or disagrees) with the statement more than other(s) measured by the cluster means]. Specifically, as shown in Panel B of Table 4.6, the mean values of the three groups in statements 3, 5, 7, 9, 10, 11, and 13 are either below 2 (disagree) or above 2 (agree); that is, the direction of the opinion is the same. For example, mean values of three clusters suggest that they all agree with statement 3 that a private firm can sell assets/divisions easier than a publicly held company. Statistically significant difference is due to the strength of the agreement (3.05, 2.96, and 2.10 for clusters 1, 2, and 3, respectively), rather than to the divergence of opinions.
Reproduced with permission of the copyright owner. Further reproduction prohibited without permission.
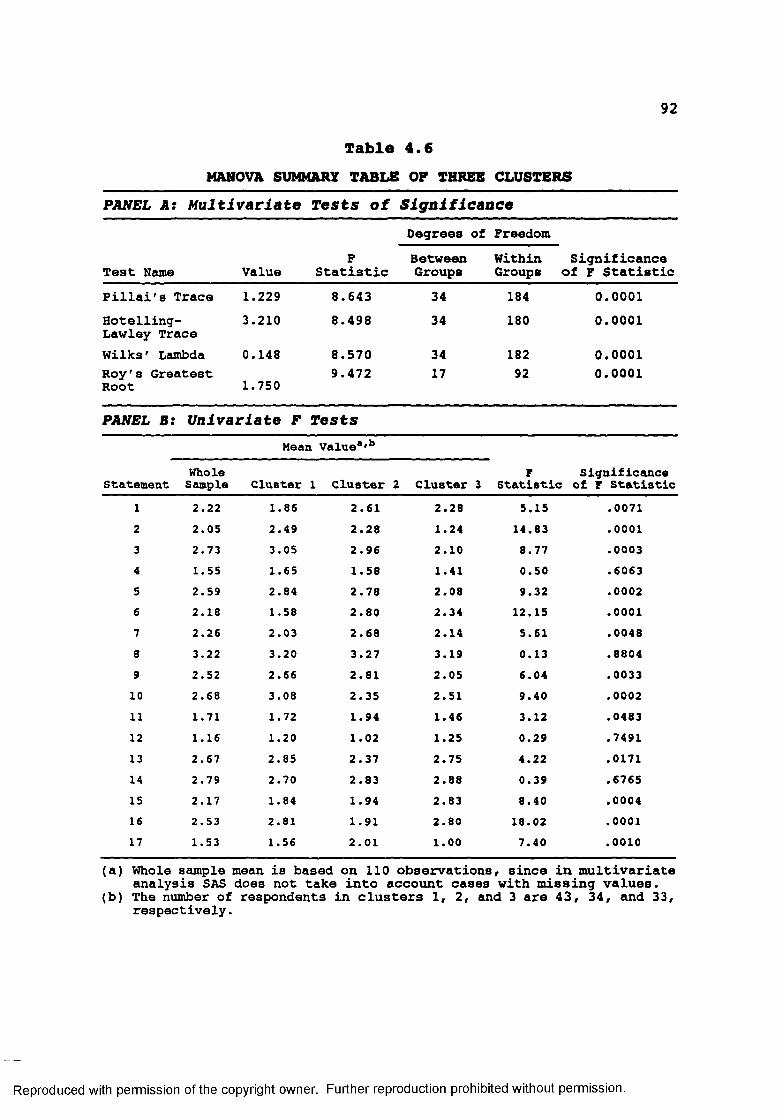
92
Table 4.6MANOVA SUMMARY TABLE OF THREE CLUSTERS
PANEL A: Multivariate Tests of Significance
Degrees of Freedom
Test Name ValueF
StatisticBetweenGroups
WithinGroups
Significance of F Statistic
Pillai 's Trace 1.229 8.643 34 184 0.0001Hotelling- Lawley Trace
3.210 8.498 34 180 0.0001
Wilk3' Lambda 0.148 8.570 34 182 0.0001Roy's ( Root Sreatest 1.750 9.472 17 92 0.0001
PANEL B: Univariate F TestsMean Value*,b
Statement WholeSample Cluster 1 Cluster 2 Cluster 3 F Significance Statistic of F Statistic1 2.22 1.86 2.61 2.28 5.15 .00712 2.05 2.49 2.28 1.24 14.83 .00013 2.73 3.05 2.96 2.10 8.77 .00034 1.55 1.65 1.58 1.41 0.50 .60635 2.59 2.84 2.78 2.08 9.32 .00026 2.18 1.58 2.80 2.34 12.15 .00017 2.26 2.03 2.68 2.14 5.61 .00488 3.22 3.20 3.27 3.19 0.13 .88049 2.52 2.66 2.81 2.05 6.04 .003310 2.68 3.08 2.35 2.51 9.40 .000211 1.71 1.72 1.94 1.46 3.12 .048312 1.16 1.20 1.02 1.25 0.29 .749113 2.SI 2.85 2.37 2.75 4.22 .017114 2.79 2.70 2.83 2.88 0.39 .676515 2.17 1.84 1.94 2.83 8.40 .000416 2.53 2.81 1.91 2.80 18.02 .000117 1.53 1.56 2.01 1.00 7.40 .0010
(a) Whole sample mean is based on 110 observations, since in multivariate analysis SAS does not take into account cases with missing values.(b) The number of respondents in clusters 1, 2, and 3 are 43, 34, and 33, respectively.
Reproduced with permission of the copyright owner. Further reproduction prohibited without permission.

934.3.2 LBO Group versus Reverse LBO GroupThe results in the previous section clearly indicate that managers are not homogeneous in their perceptions with respect to all the statements involved. In fact, they show a significant diversity on those statements that are directly applicable to the undervaluation hypothesis.
Without knowing certain characteristics of the firms in these three clusters, the conclusions drawn from the above analyses remain somewhat limited. This question will be readdressed in section 4.3.3 in the discussion of buyout decisions in value versus glamour stocks. The present section investigates a possible discrepancy between the following two groups of managers' perceptions: the LBO group and the reverse LBO group. In the context of hypotheses 2 (of the current chapter) and 3 (of Chapter 5), perception differences among the managers of these two groups are particularly important. Although hypothesis 4 (of Chapter 5) is applicable to only reverse LBO firms (since a re-LBO firm must become a reverse LBO firm first), hypotheses 2 and 3 make no such distinction and simply state that the firm is bought out by managers because of their subjective beliefs about the true value of their firm, and that the firm will be brought to the market to realize the gain.
Table 4.7 displays cross-tabulations of LBO and reverse LBO groups for the 17 statements of the survey to show the responses to each question for these two groups. If there
Reproduced with permission of the copyright owner. Further reproduction prohibited without permission.

94
Table 4.7CROSS TABULATION RESULTS OF 17 STATEMENTS BY LBO AND
REVERSE LBO GROUPSWhole Reverse X2Statement Consensus Sample* LBO Groupb LBO Group0 (p-value)
DISAGREEMENT 26.7 30.61 24.39 0.911 NEUTRALITY 19.1 20.41 18.29 (.63)AGREEMENT 54.2 48.98 57.32DISAGREEMENT 37.7 44.90 33.33 2.182 NEUTRALITY 19.2 14.29 22.22 (.34)AGREEMENT 43.1 40.82 44.44DISAGREEMENT 18.3 18.37 18.29 0.123 NEUTRALITY 11.5 10.20 12.20 (.94)AGREEMENT 70.2 71.43 69.51DISAGREEMENT 55.7 57.14 54.88 3.324 NEUTRALITY 14.5 20.41 10.98 (.19)AGREEMENT 29.8 22.45 34.15DISAGREEMENT 13.2 18.37 10.00 2.325 NEUTRALITY 18.6 20.41 17.50 (.31)AGREEMENT 68.2 61.22 72.50DISAGREEMENT 34.4 29.79 37.33 0.756 NEUTRALITY 11.5 12.77 10.67 (.69)AGREEMENT 54.1 57.45 52.00DISAGREEMENT 27.3 31.25 25.00 0.817 NEUTRALITY 15.6 16.67 15.00 (.67)AGREEMENT 57.0 52.08 60.00DISAGREEMENT 5.3 4.08 6.10 0.328 NEUTRALITY 5.3 6.12 4.88 (.85)AGREEMENT 89.3 89.80 89.02DISAGREEMENT 22.1 26.53 19.51 1.409 NEUTRALITY 13.7 10.20 15.85 (.49)AGREEMENT 64.1 63.27 64.63DISAGREEMENT 13.1 12.50 13.41 0.1910 NEUTRALITY 16.9 18.75 15.85 (.91)AGREEMENT 70.0 68.75 70.73DISAGREEMENT 46.4 46.81 46.15 1.4211 NEUTRALITY 32.8 27.66 35.90 (.49)AGREEMENT 20.8 25.53 17.95DISAGREEMENT 72.2 71.43 72.73 1.1112 NEUTRALITY 5.6 8.16 3.90 (.58)AGREEMENT 22.2 20.41 23.38DISAGREEMENT 6.2 10.42 3.66 2.5413 NEUTRALITY 20.0 20.83 19.51 (.28)AGREEMENT 73.8 68.75 76.83DISAGREEMENT 10.0 12.50 8.54 0.7714 NEUTRALITY 13.1 14.58 12.20 (.68)AGREEMENT 76.9 72.92 79.27DISAGREEMENT 29.9 27.08 31.65 0.7215 NEUTRALITY 16.5 14.58 17.72 (.69)AGREEMENT 53.5 58.33 50.63DISAGREEMENT 13.1 14.29 12.35 1.2616 NEUTRALITY 20.0 24.49 17.28 (.53)AGREEMENT 66.9 61.22 70.37DISAGREEMENT 53.5 53.06 53.85 3.3517 NEUTRALITY 18.9 12.24 23.08 (.19)AGREEMENT 27.6 34.69 23.08
a, b, and c reflect percentage (%) values.
Reproduced with permission of the copyright owner. Further reproduction prohibited without permission.

95were no bias arising from the group differences, one would expect the proportion of the survey sample agreeing with each statement to be the same for LBO and reverse LBO firms. Chi- square analysis is used to test for differences in the responses between the two groups. These statistical tests show that the responses of the LBO group and reverse LBO group do not differ significantly at conventional levels of significance.
The results of the cross-frequency tables are substantiated by a MANOVA to test the null hypothesis of equality of vector means across the groups designated by buyout stage; i.e., LBO versus reverse LBO. Findings are reported in Panel A of Table 4.8. Similarly, Panel B presents the univariate ANOVA results applied to 17 statements to detect the mean difference between the two groups of respondents.
In line with prior expectations, the F-statistics do not show any statistically significant differences between LBO and reverse LBO groups. Moreover, even the direction of consensus (i.e., disagreement, neutrality, and agreement) does not varybetween the groups; that is, the mean values of all statements (but statement 2) are either above or below 2 for both groups simultaneously. It should be noted, however, that p-value for statement 13 is 0.071. Although this is above0.05, it is interesting nevertheless in light of the question and group means which are 2.78 for reverse LBOs and 2.51 for
Reproduced with permission of the copyright owner. Further reproduction prohibited without permission.

96
Table 4.8MANOVA SUMMARY TABLE OF LBO VERSUS REVERSE LBO GROUPING
PANEL A: Multivariate Tests of Significance
Degrees of Freedom
Test Name ValueF
StatisticBetweenGroups
WithinGroups
Significance of F Statistic
Pillai's Trace 0.112 0.681 17 92 .8140Hotelling- Lawley Trace
0.126 0.681 17 92 .8140
Wilks' Lambda 0.888 0.681 17 92 .8140Roy's Greatest Root
0.126 0.681 17 92 .8140
PANEL B: Univariate F TestsMean Valuea'b
Statement WholeSample Reverse LBO Group LBOGroup FStatistic Significance of F Statistic1 2.22 2.19 2.25 0.07 .78632 2.05 2.11 1.96 0.39 .53113 2.73 2.76 2.69 0.09 .76094 1.55 1.56 1.55 0.01 .94075 2.59 2.66 2.50 0.84 .86256 2.18 2.15 2.22 0.09 .76597 2.26 2.35 2.14 1.38 .24238 3.22 3.27 3.13 1.04 .31119 2.52 2.58 2.44 0.49 .484910 2.68 2.75 2.59 0.93 .337411 1.71 1.66 1.79 0.68 .412712 1.16 1.15 1.17 0.01 .943613 2.67 2.78 2.51 3.33 .0710*14 2 .79 2.83 2.74 0.28 .597815 2.17 2.06 2.33 1.28 .260016 2.53 2.55 2.50 0.08 .775717 1.53 1.42 1.70 1.59 .2093
(a) Whole sample mean is based on 110 observations, since in multivariate analysis SAS does not take into account cases with missing values.(b) The number of respondents in reverse LBO group and LBO group are 66 and 44, respectively.* Significant at 10% level.
Reproduced with permission of the copyright owner. Further reproduction prohibited without permission.

97LBOs. With this exception, the overall results suggest that firms that reverse their LBO are not in a special class, at least along the dimensions covered by the survey.4.3.3 Buyout Decisions in Value versus Glamour StocksDespite its history in finance and security analysis, market- to-book value of equity, MV/BV, has become popular only recently following Fama and French (1992).7 They conclude that stock returns can be explained by two measures that do not incorporate beta: size and MV/BV, the latter having the largest effect. This conclusion is not limited to markets in the United States, but applies also to those of Japan, Germany, the United Kingdom, France, and Switzerland [see Chan, Hamao, and Lakonishok, 1991; and Capaul, Rowley, and Sharpe, 1993].
Apart from its apparent role in empirical studies, however, MV/BV lacks a consensus as a satisfactory economic explanation. Capaul, Rowley, and Sharpe (1993) introduce MV/BV as the variable that differentiates value and growth stocks. Favorable growth prospects raise a firm's stock price and, therefore, induce a high MV/BV ratio. Similarly, a low MV/BV is likely to be associated with high asset value and less growth potential. A second view capitalizes on mispricing by the market and suggests that a low (high) MV/BV characterizes undervalued (overvalued) stocks.
Lehn and Poulsen (1988) observe that buyouts are most likely to occur in mature industries with stable cash flows
Reproduced with permission of the copyright owner. Further reproduction prohibited without permission.

98but limited growth opportunities. Retail, textiles, food, apparel, and bottled and canned soft drinks are the five categories of industries that collectively contain 46.2% of the firms that account for 46.8% of the value of the 106 LBOs included in their sample. Studies by Maupin, Bidwell, and Ortegren (1984), Kieschnik (1989), and Lehn and Poulsen (1989) all support the notion that targets of going-private transactions are characterized by lower growth rates (in sales and employment) and lower market-to-book ratios than other firms in the same industry. These facts, coupled with the discussion above, suggest that investigating differences in managers' attitudes across firms grouped by market-to-book value (MV/BV) may provide additional insights into the analysis.
The ratio for each firm is measured for the accounting year immediately preceding the buyout announcement rather than for the present time. This is because respondents, presumably, have evaluated the survey statements in the light of the going-private decision, which must be associated (if related at all) with market-to-book value of the equity at the time of the buyout. Following Fama and French (1992), the book value of common equity is proxied by Compustat data item 60. Market value of the common equity is calculated by using the closing share price and the number of shares outstanding as of December. Only for 58 firms is data available at both the accounting and market level in CRSP, Compustat,
Reproduced with permission of the copyright owner. Further reproduction prohibited without permission.

99Lexis/Nexis, Moody's, and S&P Stock Reporter.8 The lack of data for the remaining 73 firms is mainly due to the fact that they are divisional MBOs. The inclusion of such buyouts in the main sample of the study was unavoidable since they are the major contributor to the reverse LBO sample, and hence, to the re-LBO sample as well, which are direct interests of the study. The cut-off value for grouping the firms is the median MV/BV of these 58 firms, 1.1549. The main impetus for using the median value was to obtain groups with an equal number of observations. The following table presents summary statistics on market value of equity, book value of equity, and MV/BV ratio.
Table 4.9SUMMARY STATISTICS OF ACCOUNTING AND MARKET-BASED MEASURES
FOR 58 MANAGEMENT BUYOUTSMeasure Minimum Mean Median MaximumBook Value of Assets ($000)
21,830.0 629,854.9 259,273.0 6,183,000.0
Market Value of Equity ($000)
3,916.0 328,673.2 155,705.4 2,563,953.0
Book Value of Equity ($000)
8,337.0 258,381.5 118,015.5 1,946,000.0
Ratio of MV/BV of Equity
0.3901 1.3018 1.1549 3.7862
The F-values for various statistics testing the equality of mean vectors for two groups are too low to be considered significant at the conventional levels of statistical significance. Examined at the individual level, however, three statements are found to generate statistically
Reproduced with permission of the copyright owner. Further reproduction prohibited without permission.

100significant differences between group opinions. Table 4.10 shows the results for these statements only.
Table 4.10SUMMARY TABLE OF LOW MV/BV VERSUS HIGH MV/BV GROUPS
Univariate F TestsMean Value*
Statement Whole Sample Low MV/BV Group High MV/BV Group P Statistic4 1.56 1.6966 1.2586 2.63*10 2.68 2.7862 2.3690 3.71**13 2.68 2.8828 2.4207 5.89***
(a) Whole sample mean values are taken from Table 4.1, and they are based on 131 respondents' opinions. Number of observations in two groups are 29 as the median value of the MV/BV ratio (1.1549) is used as the cutoff point for grouping.*, ** and *** denote statistical significance at 10%, 5%, and 1% levels, respectively.
Both groups disagree with statement 4 and agree with statements 10 and 13. Note that the strength of the opinion, measured by the group mean values, for all three statements is higher for the low MV/BV group. These results may suggest that the managers of low MV/BV firms have a stronger view regarding their firms' value being more as parts rather than the whole than do the managers of high MV/BV group. The low MV/BV group also seems less inclined than the high MV/BV group to use an outside consultant and are more willing to go public again following the buyout.4.4 Chapter Summary and ConclusionsThe last two decades have witnessed various restructuring activities of many American corporations. Among these, most companies took the path from public to private. Even before
Reproduced with permission of the copyright owner. Further reproduction prohibited without permission.
101a consensus has been reached among academicians on the motives for such a move, however, some of these companies returned to public trading. This study surveys financial managers of publicly traded or private firms that experienced a management-led leveraged buyout after 1980 to determine their perception of going-private transactions in general, and to investigate the undervaluation/information asymmetry motive of buyouts in particular.
The analyses that were applied to 131 completed questionnaires suggest several conclusions. First, the results show that managers do not view the participation of the buyout specialist as a major determinant of a buyout's success. This finding is at variance with previous empirical evidence that buyout specialists are one of the driving forces behind improved efficiency following the buyouts.
Second, contrary to previous evidence that buyout targets experience a profit decline in the year preceding the buyout, the respondents seem to believe that their company was performing better than their industry peers before the buyout. This suggests that such an opinion is formed mainly by their subjective beliefs or private information rather than the stock market, or accounting, or other publicly available financial measures.
Finally, the majority of financial executives think that the target firm as a whole is less valuable than the sum of its parts and that its stock is undervalued in the pre-buyout
Reproduced with permission of the copyright owner. Further reproduction prohibited without permission.

102period. Although these opinions of executives showdiscrepancy among groups formed by principal components andcluster analysis, the differences stem from the strength ofopinions rather than from divergence of opinions among groups.More importantly, with the exception of statement 13, nosignificant differences are observed between the views of LBOand reverse LBO groups.
Of course, these conclusions must be evaluated within thelimiting aspects of survey research. Non-response bias, forexample, is a problem common to all survey studies includingthe present one. Another drawback is the fact that CFOs arenot the only individuals involved in the buyout decision.Last, and most important, the possibility that the respondentmight be a totally irrelevant individual exposes this type ofstudy to criticism. It is very encouraging (with respect toboth the last statement and the information asymmetryhypothesis), however, that the president of a company (nameswithheld for confidentiality reasons) expresses his opinionsin an attached letter as follows:
In general, I believe these (management-led buyouts) occur when the stock of the business, or a segment of the business, is undervalued and management believes it can accomplish two goals: (1) To preserve the integrity and to grow thebusiness, and, (2) for management to make a large return on their investment of cash or personal risk.
4.5 Notes to Chapter 41. Maupin, Bidwell, and Ortegren (1984) find that the stocks
of going- private firms are traded at relatively large discounts from book value (compared to a control sample of firms matched on the basis of similar industry and asset size) before the buyout. Kieschnick (1989) reports a lower stock return for the going-private firms than
Reproduced with permission of the copyright owner. Further reproduction prohibited without permission.

103that for a sample of public firms in the year up to the quarter before the buyout. Similar inferences are attained based on the analysis of various accounting/ financial ratios. For example, Wu (1992) documents that the average industry-adjusted change in operating income (standardized by the market value of the firm in the year preceding the buyout) of buyout firms is negative and statistically significant in the year before the buyout.
2. One can argue that agreeing with the statement may mean, on the managers' side, admitting they are incompetent. Magowan's (1989) statement (as well as previous studies in the literature) runs counter to this view:
, with KKR'a help, we were able to figure it (what n e e d e d to be done) out for ourselves. . . . There were a couple of very specialized tax areas where it was necessary to get some extra opinions-we have never been through that kind of thing before. KKR was very helpful to us in arranging the financing and helping with the asset sales, but they basically let the operation of the company to us."
(Magowan was CEO of Safeway Stores and a member of the management team involved in the buyout.)
3. The role of buyout specialists in efficiency gains is generally attributed to both their experience in buyout deals and their substantial equity stake in the new firm. The latter gives them not only a definite incentive to closely monitor managers, but also often the ability to fire incapable ones. See Shleifer and Vishny (1988), Baker and Wruck (1989), and Denis (1994), for example, for the role of buyout specialists in improving the efficiency in private organizations.
4. Names, titles, and addresses are identified from variousbusiness information sources of U.S. public and private companies: disclosure data, Standard & Poor's Register,Ward's Business Directory, and Million Dollar Directory.
5. The choice of 0.63 as a cutoff score in the interpretation is purely arbitrary. It is justified, however, by the observation that there is a noticeable distance between 0.63 and communalities below it (as opposed to those above it).
6. Although not reported, various orthogonal rotation methods including quartimax, equamax, and oblimin rotations also provide similar results where the same statements load significantly on the same factors.
Reproduced with permission of the copyright owner. Further reproduction prohibited without permission.

1047. Although recent literature tends to use book-to-market
value of the equity, market-to-book value of the equity is used in this dissertation.
8. Same sample of firms should be used in a follow-up study to both objectively evaluate statement 15 and identify characteristics of the firms in the three groups generated by the factor analysis/clustering approach.
Reproduced with permission of the copyright owner. Further reproduction prohibited without permission.

Chapter 5UNDERVALUATION AS AN INCENTIVE FOR LBOst
HYPOTHESES TESTS USING MARKET DATA5.1 IntroductionThis chapter tests the information asymmetry hypothesis using market data. Based on the comparison of a sample of 21 re-LBO firms with a control sample, Chapter 3 concludes that the motive for an LBO is not necessarily related to the free cash flow hypothesis. The findings presented in Chapter 4 suggest that LBOs may be a tool used by management to exploit its information advantage. Without additional evidence, however, it is difficult, to make a strong statement about the information asymmetry hypothesis of buyouts. This chapter fills the gap, vis-d-vis a sample of 104 reverse LBO firms.
Chapter 5 compares the value gain realized by these reverse LBO firms with that realized by a control sample of firms. It also studies the sharing of wealth between prebuyout shareholders and managers (who initiate the buyout). Although these two points constitute the core of the chapter, additional hypotheses are also proposed and tested in order to clarify whether management does use buyouts as a tool to exploit its information advantage.
The industry hypothesis presented in this chapter studies value gains in reverse LBOs across industries to discover whether the clustering of LBOs in certain industries has anything to do with information asymmetry between managers and
105
Reproduced with permission of the copyright owner. Further reproduction prohibited without permission.

106shareholders. The learning-curve hypothesis predicts that only successful first-round (public to private to public) managers repeat the LBO. The last hypothesis of the chapter completes the learning-curve concept (from the point of view of the shareholders this time) by comparing the percentage premiums paid to pre-buyout shareholders in the first and second buyouts. The buyout percentage premium must be larger in the second buyout than in the first if shareholders are fooled (because of their informational disadvantage) in the first buyout (and hence require more in the second LBO).5.2 Reverse LBO Sample CharacteristicsFrom an initial sample of 450 reverse LBO firms, 104 firms are selected.1 The buyout values for these 104 firms are the completion values of LBO deals as reported in the media (i.e., Going Public-The IPO Reporter, Mergers & Acquisitions, Mergerstat Review, The Yearbook on Corporate Mergers, Joint Ventures and Corporate Policy). The remaining firms are eliminated for the following reasons either the buyout value is not disclosed to the public, or it is not available in any of the sources searched. It is possible to use the market value of the firm at its last trading date as a proxy for the buyout value. This approach does not provide a great deal of help in the present case, however, because the subject reverse LBO firms are mainly divisions of other companies and hence do not have price or share data available.
Reproduced with permission of the copyright owner. Further reproduction prohibited without permission.

107The descriptive statistics in Table 5.1 detail the
distribution of 104 LBOs undertaken during the period 1980 to 1993. The first column presents the year of the going-private transaction. Column 2 shows the number of LBOs corresponding to each year. As shown, 1988 not only has the largest number of LBOs (26), but also includes several large LBOs. In fact, 1988 LBOs account for the largest portion (36%) of total buyout value during the 1980-1993 period. Full sample values are given in the last row of the table.
Table 5.1DESCRIPTIVE STATISTICS FOR REVERSE LBO FIRMS,
GROUPED BY LBO YEARBuyout Value (Millions of Dollars)
Year Number of LBOs Mean Median Total1980 1 195.000 195.000 195.0001981 4 74.375 107.500 297.5001982 2 44.100 44.100 88.2001983 4 93.125 46.250 372.5001984 10 134.110 76.000 1,341.1001985 10 158.800 77.500 1,588.0001986 18 105.544 79.500 1,899.8001987 5 174.320 131.000 871.6001988 26 251.659 155.000 6,543.1401989 10 227.717 265.000 2,277.1701990 6 168.417 140.000 1,010.5001991 4 37.900 36.000 151.6001992 3 504.633 92.500 1,513.9001993 1 4.100 4.100 4.100FullSample 104 174.56 100.000 18,154.110
Reproduced with permission of the copyright owner. Further reproduction prohibited without permission.

108The sample average at the time of the buyout is $174.56
million, and the median is $100 million. Minimum and maximum values are $4.10 million and $1.80 billion, respectively. The average period that the sample firms were under private ownership is 36.01 months (median is equal to 32.22), which is only slightly higher than the 34.2 months (median is equal to 29) reported by Muscarella and Vetsuypens (1990). That is, on average, LBO firms return to public trading within three years of the buyout.
Table 5.2 provides additional characteristics of reverse LBO firms, for their reversal (i.e., going public) year. The third column gives the average value of the firms (measured as the market price at the end of the offer day x the number of shares outstanding in the firm) at the time of the public offering. Column 4 shows the dollar amount offered in the public offering. The last column is the ratio of column 3 to column 4; i.e., the percentage of the firm value offered.
The peak year for the reverse LBO was 1987, in which there were 21 public offerings of reverse LBO firms. Full sample results show that, on average, 32.94% of the firm is offered to the public. Although one firm in the sample offered 83.14% of its value to the public, a mean 32.94% offer value suggests that management, at least in the initial public offering, maintains its concentrated ownership in the reverse LBO firm.
Reproduced with permission of the copyright owner. Further reproduction prohibited without permission.

109
Table 5.2DESCRIPTIVE STATISTICS FOR REVERSE LBO FIRMS,
GROUPED BY GOING-PUBLIC TEARAverage Value (Millions of Dollars)
Year Number of Reverse LBOs Firm Value at the Offer Total Amount Offered Offer Ratio (%)
1983 1 103.062 30.000 29.111984 2 83.548 29.300 34.791985 2 22.211 5.584 25.251986 13 147.153 43.420 29.341987 21 158.917 46.269 32.581988 4 85.082 30.643 34.661989 1 150.564 47.850 31.781990 1 97.500 46.750 47.951991 17 444.645 104.119 30.981992 17 291.415 96.913 35.511993 18 256.581 70.722 35.471994 5 369.757 66.200 28.671995 2 217.919 92.080 41.25FullSample 104 245.859 68.234 32.94
5.3 The Profit Motive in the Reverse LBO (H,)Under the hypothesis of a semi-strong informationally efficient market, it is reasonable to assume that pre-buyout shareholders require a premium containing not only the potential tax benefits (likely to accrue to the post-buyout firm), but also the tax costs associated with capital gains through the sale of shares. Under the same reasoning, gains created via reduction of agency costs and reduction of transaction costs must also be accounted for in the premium.
Reproduced with permission of the copyright owner. Further reproduction prohibited without permission.

110Therefore, gains accruing to the buyout investors come from the value hidden in the firm (which translates into value creation after the buyout).
in the reverse LBO, management, having achieved a substantial paper gain in the value of the firm's equity because of significantly increased cash flows, sells the company back to the public. In addition to reducing the financial risk of the firm by lowering the leverage, reversing the LBO through the issuance of stock allows buyout investors, particularly managers, to reduce their personal risk through portfolio diversification. This action, which constitutes the first stage of the reversal, is undertaken within a relatively short period of the initial buyout.
Hypothesis 3: Management's motivation in an LBO is
to realize a profit by taking the company public again.
Given that the free cash flow hypothesis (Hi) is not a general explanation to going-private transactions, H3 intends to show that the LBO is a tool for management to exploit its information privilege. That is, managers buy out the company when they think it is undervalued and can thus profit from the process.5.3.1 Implications of H3H3 is tested by comparing the increased value of the firm under private ownership with the possible added value had it remained public. H3 is broken down into two sub-hypothesess
Reproduced with permission of the copyright owner. Further reproduction prohibited without permission.

Ill(a) The ignored value hypothesis, which assumes a
moderate information asymmetry problem and suggests a temporary ignorance by the market. A statistically insignificant difference between the two measures (value gain under private ownership versus value gain in public form) is likely to support the ignored value hypothesis, suggesting that improvements in buyout firms would have happened anyway (with or without a buyout).
(b) The hidden value hypothesis, which implies a severe information asymmetry problem. That is, the information asymmetry problem is persistent and is not conveyed by another means of transmittal to the market.
The hidden value hypothesis is consistent with H2 in that the motivation behind the buyout is management's subjective belief that the firm's value can be increased significantly. Hence, it predicts a lower value for the firm had it remained public rather than gone through a reverse LBO process. Therefore, a statistically significant increment in the value of reverse LBO firms, compared with that of control sample firms, supports the buyout investors' superior information, which is reflected in investment, production, and organizational activities in LBO firms.5.3.2 A Discussion of the Proxy VariableThe test of H3 requires both a reasonable measure of the incremental value of firms (reverse LBOs and control firms) and the construction of a meaningful control sample. By their
Reproduced with permission of the copyright owner. Further reproduction prohibited without permission.

112
nature, reverse LBOs allow one to use a market-based performance measure: market value of equity. Figure 5.1shows how time is measured and the dates of interest in the analyses that follow.
---!------ j------ ,----T1 T2 T3
LBO PROPOSAL LBO COMPLETED PUBLIC OFFERING
Figure 5.1 TIME TABLE OF A REVERSE LBO
The value gain for a reverse LBO firm is calculated as the difference between re-entry value and buyout value,
VG = REV - BOV . (1)Buyout value is the dollar amount reported (in any of the sources mentioned on p. 106) at the time of the LBO completion (T2). Re-entry value is measured at the time of the firm's IPO (T3) as follows:
REV = N x p , (2)where N is the number of shares outstanding after the public offering and P is the stock price at the end of the first trading day.
The systematic underpricing of equity IPOs is a well- documented empirical phenomenon. Consistent with this, Muscarella and Vetsuypens (1989) report a 1.70% mean return for their full (meaning not divisional) reverse LBO sample at the end of the offering day. Although the 1.70% mean return
Reproduced with permission of the copyright owner. Further reproduction prohibited without permission.

113is neither statistically nor economically significant (and is well below the corresponding number of about 8% for their control sample), not accounting for this return in the present study may cause downward bias in the estimate of the re-entry value.5.3.3 The Control SampleAs stated above, one way of estimating the change in the value of the firm, as if it were a public company, is to contrast it to a control sample. Such a sample must contain firms that have characteristics similar to the buyout company's. Following earlier studies of LBOs, industry category and size of the firm are used in this study to construct the control sample.
Also consistent with previous studies, industry classification is based on a four-digit SIC code. Size is proxied by total market value of equity (stock price x number of shares outstanding) at the time of the LBO completion of the buyout company (T2). Similarly, the calculation of the increment in the market value of a firm in the control sample is simply the difference between the market values of the firm's equities at T3 and T2. A comparison of the LBO sample with the control sample should then measure the performance of the re-entering LBOs relative to their possible public performance.
Table 5.3 compares the mean buyout value of the reverse LBO sample with the market value (measured at the time of the
Reproduced with permission of the copyright owner. Further reproduction prohibited without permission.

114matching LBO firm's buyout transaction) of the control sample. The third column reports the mean difference in the value of this variable for each matched pair of reverse LBO firm and corresponding control firm. The last column has the associated t-statistic for a difference in means test.
Table 5.3MEAN REVERSE LBO BUYOUT VALUE
AND MEAN CONTROL FIRM MARKET VALUEReverseLBO Firms Control Firms Mean Difference t-statistic*(Million $) (Million $) (Million $) (p-value)174.558 182.114 -7.556 -0.8224(0.4127)
(a) The F-statistic based on the ratio of variances of the two groups of firms is 1.12. This result indicates that the null hypothesis of equal variances cannot be rejected at conventional levels of significance and that the use of a t-test is appropriate.As expected, the mean difference is not significant since
the market value at the time of the buyout is one of the criteria used to create the control sample. Note, however, that mean difference is -$7.56 million (an economically significant dollar amount), indicating that matching is not perfect and that the value of control firms at the time of the buyout, on average, are greater than those of the reverse LBOs. Although not statistically significant, this finding suggests that some adjustment to the VG variable might be necessary to remove any potential bias because of differences between the values of reverse LBOs and control firms at the time of the buyout. The use of return on investment (ROI) is intended to take care of this problem and is defined as follows:
Reproduced with permission of the copyright owner. Further reproduction prohibited without permission.

115ROI = VG / BOV (3)
It is the ROI that will be used in the following hypothesis test. If the ROI in the reverse LBO firms is greater than the ROI in the control firms, then one can conclude that management exploits the gain from undervaluation of the LBO firm.5.3.4 Empirical Test of H,A difference in means test for matched samples is used to test h3. Panel A of Table 5.4 presents the findings of this test. As expected, the mean ROI of the reverse LBO sample is greater than that of the control sample (the mean of the difference is positive, 0.724). The associated t-statistic value, however, is 1.015, which suggests that the difference is not statistically different from zero. Note that this finding is in line with the prediction of the ignored value hypothesis (discussed in Section 5.3.1 above), but clearly fails to support the hidden value hypothesis. That is, improvements in buyout firms would have happened anyway (with or without a buyout).
An alternative test of H3 is to compare the difference between the pre-LBO firm values and the going-public firm values for the reverse LBO firms. Note that this is in fact the VG variable defined in section above. The results for this variable are given in Panel B of Table 5.4. The mean increase in value is $71,300 million and is significant at the 1% level. Although it is discouraging not to obtain similar
Reproduced with permission of the copyright owner. Further reproduction prohibited without permission.

116support from the use of the ROI variable, this last finding provides some support for the hypothesis that LBOs are driven by the undervaluation of firms. That is, managers do make a significant profit by taking a firm private and then bringing it public again.
Table 5.4PERFORMANCE TESTS FOR THE REVERSE LBO FIRMS
Panel A: M e a n V a l u e s o f BOX f o r Reverse L B O and Control F irms a n d C o r r e s p o n d i n g t - s t a t i s t i c for D i f f e r e n c e in M e a n s Test
Variable Reverse LBO Control Mean Firms Firms Difference t-statisticb (p-value)
ROI* 1.505 0.781 0.724 1.0150(0.3129)Panel B: M e a n V a l u e I n c r e a s e f o r R everse L B O F i r m s a n d C o r r e s p o n d i n g
t - s t a t i s t i c f o r D i f f e r e n c e in M e a n s Tes t
Second Mean Buyout Value IPO Value Difference t-statistic®(p-value)
174.559 245.8590 71.3000 4.3670(0.0001)(a) ROI is defined as Incremental Value/Initial Value.(b,c) The F-statistic based on the ratio of the variances of the twogroups of firms rejects the null hypothesis of equal variances at a significance level of 1%. However, the use of a t-test is still appropriate for both cases since group sizes are equal (Anderson, Sweeney, and Williams, pg. 345).
5.3.5 An Extension of H3: Industry HypothesisAn extension of H3 is to examine the value gains across industries. This is because LBOs, like repurchases, tend to cluster by industry, as reported by Lehn and Poulsen (1988) and Kieschnik (1989). In Lehn and Poulsen (1988), the retail, textiles, food, apparel, and bottled and canned soft drinks industries represent 46.2% of the firms that account for 46.8% of the value of 106 leveraged buyouts included in their
Reproduced with permission of the copyright owner. Further reproduction prohibited without permission.

117sample. The top four industries in the Kieschnik (1989) sample of 102 buyouts are apparel products, food products, textile products, and transport equipment. Although similarities between the two studies may be due to the overlap in the periods covered (Lehn and Poulsen: 1980-1984; andKieschnik: 1981-1986), there is an apparent concentration of LBOs in certain industries. If the undervaluation hypothesis is the explanation for LBOs, then one might generalize (coupled with the observed industry clustering) to industry and expect to see significantly higher value gains for the industry with the highest frequency of buyouts.5.3.6 Empirical Test of Industry HypothesisTable 5.5 presents the number of reverse LBO sample firms by industry. Sample firms are distributed in 34 industries classified by the first two digits of their SIC code. This rather wide industrial distribution of reverse LBOs, however, does not prevent some clustering in certain industries. Chemicals, food stores, and electric machinery are the top three industries in which reverse LBOs are observed most frequently. Note that this finding differs from that of Kieschnik (1989) (where apparel products, food products, and textile products are the leading industries) and that of Lehn and Poulsen (1988) (where retail, textiles, and food are the three industries with the greatest frequencies of LBOs). Although food products or miscellaneous retail industries are not among the top three industries in the present sample,
Reproduced with permission of the copyright owner. Further reproduction prohibited without permission.

118they, consistent with Lehn and Poulsen's (1988) reporting, experience a relatively high number of reverse LBOs (i.e., five each).
Table 5.5INDUSTRIAL DISTRIBUTION OF 104 REVERSE LBO FIRMS
SIC Code Industry Description Number of Firms Buyout Value (Million $)13 Oil and Gas Extraction 1 150.0015 Building Construction 2 95.0020 Food Products 5 513.9021 Tobacco Products 1 137.0022 Textile Products 1 105.0023 Apparel Products 2 111.0024 Lumber and Wood Products 5 443.2025 Furniture and Fixtures 1 56.0027 Paper Products 4 271.7028 Chemicals 8 1,594.9430 Rubber & Plastic Products 2 56.3033 Primary Metals 5 1,412.6134 Fabricated Metals 5 395.9035 Nonelectrical Machinery 5 1,406.0036 Electric Machinery 6 2,293.3537 Transportation Equipment 3 150.0038 Measuring and Photo Equipment 3 480.5039 Miscellaneous Manufacturing 4 408.0042 Motor Freight 1 313.0045 Transportation by Air 1 61.5050 Durable Goods: Wholesale 3 546.4051 Nondurable Goods: Wholesale 1 21.0052 Bldg. Matl, Hardwr, Garden: Retail 1 40.5053 General Merchandise Stores 1 100.0054 Food Stores 7 1,225.4356 Apparel and Accessory Stores 1 430.0057 Home Furniture 6 Equipment Stores 2 727.8058 Eating and Drinking Places 2 50.6359 Miscellaneous Retail 5 602.2062 Securities Brokerage 1 275.0063 Insurance 5 2810.1073 Business Services 2 62.0075 Auto Repair, Services, Parking 1 205.0080 Health Services 5 438.5587 Engr., Acct., Resch., Mgmt. Svcs. 2 164.60
Total 104 18,154.11
Reproduced with permission of the copyright owner. Further reproduction prohibited without permission.

119In testing the industry hypothesis, the difference
between the mean value gain of eight firms in the chemicals industry and the mean value gain of 12 firms each belonging to a separate industry (collective) is compared. The total buyout value for the firms in the chemicals industry is $1,595 million, compared with $1,894 million for firms in the collective group. The two groups account for 19.22% of the total buyout value of the 104 reverse LBOs.5.3.7 Results and DiscussionTable 5.6 presents the mean values for these two groups for two performance measures: value gain (VG), and return on investment (ROI). The difference in means test for the ROI variable produces a t-statistic of 3.437, which is statistically significant at the 1% level. That is, the null hypothesis that the mean return on investment for the collective industry group is equal to that for the chemical industry group is rejected. The same conclusion is reached for the variable value gain. The associated t-statistic in this case is significant at the 5.11% level. These results are consistent with the industry hypothesis. That is, firms in the highest frequency of reverse LBO groups do obtain both a greater dollar value increase and a greater return than firms in industries with the least frequency of buyouts. This finding, combined with the results of H3, provides further support to the undervaluation motive of LBOs.2
Reproduced with permission of the copyright owner. Further reproduction prohibited without permission.

120
Table 5.6MEAN VALUES OF PERFORMANCE VARIABLES:
AN INDUSTRIAL COMPARISON
Variable ChemicalsIndustry CollectiveIndustryMean
Difference t-statistic(p-value)Value Gain* 237.799 42.815 194.984 1.722’*(Million $) (0.0511)
Return on” 6.948 0.363 6.585 3.437'Investment (0.0014)(a) Value gain for a firm is the difference between the going-public value and the going-private value.(b) Return on investment is the value gain divided by the going- private value.* and ** indicate 1% and 10% level of significance, respectively, for a one tailed t-test.
5.4 Application of Learning Curve Concept to LBOsThe progression of LBO, second initial public offering (SIPO), and re-LBO implies that managers take the firm private when they think it is undervalued and bring it back to the market when they believe they can attain a higher market value. Managers, having experienced the public-to-private/ private- to-public cycle, are likely to perform better in the second round (i.e., second LBO and its reversal). This proposition is consistent with the well-known concept of the learning curve.
Regardless of its form, the learning-curve is based on the simple logic of "learning-by-doing," as Alchian (1950) views it, and refers to the efficiency gained by repeating a task (Devinney, 1987). This efficiency, in turn, justifies payment of a higher premium to pre-buyout shareholders. Even in the absence of a "learning" pattern by management, it is
Reproduced with permission of the copyright owner. Further reproduction prohibited without permission.

121likely that the percentage premium required by rational prebuyout investors will be larger than the first case, ceteris paribus. This statement rests on the assumption that the gains of target equity holders are dwarfed by those of managers in the first buyout; hence, market participants adjust their expectations upward at the second buyout. This discussion leads to the formulation of hypotheses 4, 5 and 6.5.4.1 The Learning Curve Hypothesis (H4)H4 is an intuitive extension of the Hz and H3. It posits that, if the whole process is successful in the sense that the returns realized by buyout investors are sufficient to cover both the premium paid and their time/effort, then the buyout will be exercised a second time.
Hypothesis 4: First-round successful managers
(public to private to public) will repeat public- to-private transactions.
H4 is tested using reverse and re-LBO data. The better performance of re-LBO firms in the public-to-private/private- to-public process, compared with that of reverse LBO firms (i.e., firms that stay as public companies after their return to the capital markets), will support H4.5.4.2 Empirical Findings and Discussion of H4As in H3, the test of this hypothesis is based on the fact that both reverse LBO and re-LBO firms possess market-based information both on and subsequent to the IPO date. The test of H4 compares the value gain of repeating reverse LBO firms
Reproduced with permission of the copyright owner. Further reproduction prohibited without permission.

122(i.e., re-LBOs) with that of non-repeating (i.e., those firms that stay in the market and do not undertake a second buyout) reverse LBO firms that performed better than their matched firms in the control firms in terms of value creation. According to this design, then, one should find that, to support H4, repeating LBOs must have a significantly higher mean value for the VG variable than the new sub-sample created.
The above sub-sampling process yielded 43 reverse LBO firms. The size of the corresponding sample of re-LBOs is 11. Ten (out of 21 used in Chapter 3) re-LBO firms are lost because of the lack of information about their first buyout. In the test that follows this difference in sample sizes is taken into account explicitly.
The findings reported in Table 5.7 indicate that repeating reverse LBO firms (re-LBOs) do not necessarily perform better than the non-repeating reverse LBO firms in terms of value creation in their first turnaround (i.e., public-to-private/private-to-public). Assuming that the performance measure, comparison group, and statistical test used are appropriate, H4 cannot be supported. This result may suggest that the motive for the second LBO is not necessarily a successful first round, but the desire to increase the value of the firm toward a perceived value that management thinks that it was not achieved in the first attempt.
Reproduced with permission of the copyright owner. Further reproduction prohibited without permission.

123
Table 5.7COMPARISON OF VALUE GAINS FOR Re-LBOs AND
SUCCESSFUL REVERSE LBO FIRMSRe-LBO Successful M e wVariable Firms Reverse LBOs Difference t-statistic*
Value Gain6 (Million $)164.910 142.175 22.735 0.263
(a) The F-statistic based on the ratio of the variances of the two groups of firms is 3.33, and hence, the null hypothesis of equal variances is rejected at a 1% level of significance. Accordingly, the t-test should be interpreted with caution.(b) Value gain for a firm is the difference between the going-public value and the going-private value.
5.4.3 The Sharing of Health Between Pre- and Post-Buyout Shareholders (H5)
Hypothesis 5: Post-buyout equity investors earn
more than pre-buyout (target) shareholders in the
first buyout.
H; is a test of whether the returns realized by buyout investors (managers) are significantly higher than premiums paid to pre-buyout shareholders. This hypothesis is also tested using reverse LBO data. A comparison between the percentage premiums paid to pre-buyout shareholders and management's return should capture this difference. If H5 cannot be rejected, then it might be concluded that shareholders (market participants) are fooled in the first LBO because of their information disadvantage (implying that the market may not be strong-form efficient).
In order to mitigate the impact of a possible information leak on the stock price, the premium paid to target equity holders is measured relative to the stock price two months
Reproduced with permission of the copyright owner. Further reproduction prohibited without permission.

124before the buyout announcement. The final input needed to calculate the percentage premium is the final offer price. This is the buyout price defined as the per-share cash payment received by pre-buyout shareholders. The premium paid to prebuyout shareholders, then, is calculated as the fraction difference between the buyout equity price (at T2 in Figure 1) and the price of equity two months before the buyout proposal (Tl-2ms.):
PP = (PriceT2 - PriceT1.2aaJ + PriceTi_jM.. (4)5.4.4 Empirical Findings and Discussion of H,Compared with the test of H4, where there was a serious sample size problem, the test of Hs uses 32 reverse LBO cases for which market data are available for the period prior to their first buyout. This information is particularly important since the premiums paid in these transactions cannot be otherwise calculated.
The average private life for this subsample of reverse LBO firms is 48.45 months (median=44.76). Note that this number is somewhat larger than the full sample value (mean=36.01 and median=32.22). Since the remaining cases in the full sample are mostly divisional buyouts, this finding suggests that divisional management buyouts return to the public faster. Perhaps the speed of the public-to- private/private-to-public process may be a better indication of the information advantage of insiders — a point that may be worth studying separately.
Reproduced with permission of the copyright owner. Further reproduction prohibited without permission.

125The average time that elapses between the buyout proposal
announcement and completion of the buyout transaction for these firms is eight months (median-five months). This time difference suggests that both return measures (management's and shareholders') must somehow be adjusted in order to provide a meaningful comparison. In Table 5.8, therefore, both management's and shareholders' average monthly returns are reported. The mean difference between these two matched groups is given in column 4. Column 5 presents the associated t-statistic (p-value is in parentheses).
Table 5.8COMPARISON OF MANAGEMENT'S RETURN AND SHAREHOLDERS' RETURN
IN REVERSE LBO TRANSACTIONSPre-Buyout Mean t-statisticVariable Management Shareholders Difference (p-value)
Monthly Return 0.092046 0.04740 0.045863 0.630(0.533)
As expected, the sign of the mean difference between management's and pre-buyout shareholders' returns is positive. This difference, however, is not statistically significant. This result, combined with the findings for H« and the mixed results presented in Section 5.3, casts doubt on the information asymmetry hypothesis of LBOs.5.4.5 Premiums Paid -bo Pre-Buyout Shareholders in the First
and the Second Buyout (Hs)Hypothesis 6: In re-LBO transactions, the percent
age premium paid to pre-buyout shareholders in the first buyout is lower than that paid in the second buyout.
Reproduced with permission of the copyright owner. Further reproduction prohibited without permission.

126A comparison of the percentage premiums paid to pre-
buyout shareholders in the first and second buyout can be used to test the learning pattern by management. This comparison may also provide additional evidence on the information asymmetry hypothesis. Both learning by management and the revised expectations of shareholders (market participants), whose returns are dwarfed by managers' in the first cycle, justify the payment of a higher percentage premium in the second round. This argument (managers gain more than the shareholders) is not empirically supported in the previous section.
Next, the average prediction errors of the second buyout announcement of re-LBO firms are compared with average prediction errors of a randomly selected group of LBO firms.3 Though this process is not a perfect way to test Hs, it is worthwhile to examine the comparison of excess returns for the two groups of firms.5.4.6 Empirical Findings and Discussion of HeThe conventional market model event study introduced in Chapter 3 (pp. 42-43) is used to calculate the average prediction errors for two buyout samples. As before, the estimation period is -170 to -21 relative to the announcement day. Table 5.9 presents the cumulative prediction errors of each group and their mean differences for the event window [-20,+20] (i.e., days -20 through +20). Both types of buyouts provide significant cumulative average prediction errors.
Reproduced with permission of the copyright owner. Further reproduction prohibited without permission.

127Traditional t-statistics testing the null hypothesis of zero average prediction errors are 7.15 for the re-LBO group and 4.72 for the randomly selected LBO group. The CAPEs generated by second LBO announcements are noticeably higher (a mean difference of 19.72%) than the ones created by the first LBO announcement. Moreover, this difference is associated with a t-statistic value of 14.177, which is statistically significant at the 1% level.
Table 5.9COMPARISON OF [-20 ,+20] WINDOW CAPES FOR FIRST AND SECOND LBO ANNOUNCEMENTSSecond LBO Announcements First LBO Announcements MeanDifference t-statistic
CAPE (%) 37.151 17.431 19.72 14.177*
* Significant at 1% level.
At present, it is difficult to find a reasonableexplanation for such a huge difference between the two types of buyouts. However, the significantly higher market reaction to the re-LBO announcements may suggest that re-LBOs warrant further investigation. This, unfortunately, cannot occur until additional re-LBOs take place and a larger sample becomes available.5.5 Chapter Summary and ConclusionThis chapter examines the information advantage of the management team in going-private transactions. Its purpose is to test a set of hypotheses (not mutually exclusive) that, one
Reproduced with permission of the copyright owner. Further reproduction prohibited without permission.

128way or another, investigate the information asymmetry (or undervaluation) explanation of LBOs.
The results obtained from an initial sample of 104 reverse LBO firms show that the performance (measured by ROI) of the reverse LBO firms is greater, on average, than the performance of control firms matched by industry and size. The lack of statistical significance of the test statistic, however, precludes support of the hidden value hypothesis as the motivation for buyouts. Perhaps the most noteworthy result of the chapter is that there is a statistically significant increase in the value of the firm (measured as the difference between the firm's value at the second IPO and the firm's value at the time of the buyout). A value higher at the going-public date than at the buyout certainly offers an opportunity for managers to reap the gain for themselves rather than sharing it with stockholders. The test of Hs, however, contradicts this view. On a time-adjusted basis, the mean difference between the ROI of management and of buyout shareholders, although positive, is not different than zero.
Contrary to the prediction of H4, in their public- private-public cycle, re-LBOs do not necessarily outperform the remaining reverse LBO firms that stay as public entities after they return to public. This finding may suggest that LBOs can also be repeated if managers think that the first cycle did not bring the firm to the desired value. Although the lack of a strong conclusion about the undervaluation
Reproduced with permission of the copyright owner. Further reproduction prohibited without permission.

129explanation for re-LBOs (and LBOs in general) is disappointing, future research should further investigate other potential explanations for this observed phenomenon.5.6 Notes to Chapter 51. See Chapter 3, pp. 39-40, for the procedure followed in
constructing the initial sample.2. This result, of course, might also be due to a technical
effect. In certain industries there may be a higher tendency for buyouts of small firms in order to attain an optimal (economic-plant) size. Accordingly, a higher frequency and higher value-gain buyouts in an industry may not necessarily be related to the undervaluation hypothesis.
3. Ideally, this hypothesis must be tested with reLBO data.However, because the majority of the firms in the reLBOsample experienced their first buyout as divisions, we lack the data necessary to conduct the test.
Reproduced with permission of the copyright owner. Further reproduction prohibited without permission.

Chapter 6SUMMARY AND CONCLUSION
This study examines the phenomenon of re-LBOs; that is, the practice of going private via management buyout, then reobtaining public status through a new initial public offering, and then going private a second time. Using a sample of 21 re-LBO firms, the study challenges the free cash flow argument of LBOs by replicating the Lehn and Poulsen (1989) study. If Jensen's free cash flow argument is an explanation for going-private transactions in general, it must be a major driving force behind re-LBOs as well. That is, regardless of a firm's past experience with LBOs, the free cash flow argument must also hold for the second LBOs. The findings in Chapter 3, however, tell a different story. They indicate that, although the free cash flow variable is unable to explain both the likelihood of going private and the premiums paid in buyout transactions, the tax savings potential of a firm does play an important role in the going- private decision. The findings also indicate that, contrary to the predictions of Jensen's free cash flow hypothesis, growth in sales is positively and significantly related to the premiums paid to pre-buyout shareholders in such transactions.
Chapter 4 proposes the information asymmetry hypothesis as an explanation for LBOs in general, and surveys the opinions of management teams involved in such transactions. The analyses that were applied to 131 completed questionnaires
130
Reproduced with permission of the copyright owner. Further reproduction prohibited without permission.

131suggest several conclusions. The results show that managers do not consider the participation of a buyout specialist as a major determinant of a buyout's success. This finding is in contrast to previous empirical evidence that suggests that buyout specialists are among one of the driving forces behind the improved efficiency following the buyouts. Chapter 4 also reveals that the majority of financial executives think that the target firm as a whole is less valuable than the sum of its parts and that its stock is undervalued in the pre-buyout period. Although these opinions of executives show discrepancies among groups formed by principal components and cluster analysis, the differences stem from the strength of their opinions rather than from a divergence of opinions among the groups. These conclusions must be evaluated, of course, within the limiting aspects of survey research.
The findings presented in Chapter 4 suggest that the information advantage of insiders may play a role in LBOs. Chapter 5 investigates the issue further, using a sample of 104 reverse LBO firms in tests of several information asymmetry-based hypotheses. Using an initial sample of 104 reverse LBO firms, the performance (measured by ROI) of the reverse LBO firms is not statistically greater than the performance of control firms matched by industry and size. This finding fails to support the undervaluation hypothesis in general. There is, however, a statistically significant increase in the value of the firm (measured as the difference
Reproduced with permission of the copyright owner. Further reproduction prohibited without permission.

132between the firm's value at the second IPO and the firm's value at the time of the buyout) . A value higher at the going-public date than at the buyout certainly offers an opportunity for managers to reap the gain themselves rather than to share it with stockholders. The finding from the test of Hg, however, contradicts this view. On a time-adjusted basis, the mean difference between the ROI of management and of buyout shareholders, although positive, is not different from zero. Overall, the findings of Chapter 5 are mixed, and generally deviate from the information asymmetry hypothesis. This should not prevent researchers from investigating the characteristics of reverse and re-LBO firms as new data become available. These firms provide certain cases that need to be explored. One such incident is the dividend initiation of reverse LBOs despite the fact that they are in need of cash, at least to cover the service costs of their extensive debt. In sum, this dissertation is only a start for the investigation of reverse and re-LBO transactions, not an end.
Reproduced with permission of the copyright owner. Further reproduction prohibited without permission.

REFERENCESAinina, M. Fall, and Nancy K. Mohan, 1991, "When LBOs Go IPO," Journal of Business Finance & Accounting, 393-403.Alchian, A., 1950, "Reliability of Progress Curves in Airframe Production," Rand Corporation Report 260-1, Santa Monica, CA.Amihud, Yakov, 1989, "Leveraged Management Buyouts and Shareholders' Wealth," Leveraged Management Buyouts: Causes and Consequences, edited by Y. Amihud, Homewood, IL: Dow- Jones, Irwin.Anderson, David, Dennis Sweeney, and Thomas Williams, 1993, Statistics for Business and Economics, West Publishing Company, MN.Asquith, Paul, and Thierry A. Wizman, 1990, "Event Risk, Covenants, and Bondholder Returns in Leveraged Buyouts," Journal of Financial Economics 27, 195-213.Baker, George P., and Karen H. Wruck, 1989, "Organizational Changes and Value Creation in Leveraged Buyouts: The Case of the O.M. Scott & Sons Company," Journal of Financial Economics, 163-190.Boehmer, Ekkehart, Jim Musumeci, and Annette B. Poulsen, 1991, "Event-Study Methodology under Condition of Event-induced Variance," Journal of Finsmcial Economics 30, 253-272.Brown, Stephen J., and Jerold B. Warner, 1980, "Measuring Security Price Performance," Journal of Financial Economics 8, 205-258.Bruner, R.F., and L.S. Paine, 1988, "Management Buy-Outs and Managerial Ethics," California Management Review 30, 89-106.Campbell, T., 1979, "Optimal Investment Financing Decisions and the Value of Confidentiality," Journal of Fimmcial and Quantitative Analysis 14, 913-924.Capaul, C., I. Rowley, and W.F. Sharpe, 1993, "International Value and Growth Stock Returns," Financial Analysts Journal, 27-36Chan, L., Y. Hamao and J. Lakonishok, 1991, "Fundamentals and Stock Returns in Japan," Journal of Finance 46, 1739-1764.Cook, Douglas 0., John C. Easterwood, and John D. Martin, 1992, "Bondholder Wealth Effects of Management Buyouts," Financial Management, 102-113.
133
Reproduced with permission of the copyright owner. Further reproduction prohibited without permission.

134Cummings, Stephen E., 1989, "The Recycled LBO: A Second Dose of Leverage," Mergers and Acquisitions, November/December, 53- 56.DeAngelo, L., 1986, "Accounting Numbers as Market Valuation Substitutes: A study of Management Buyouts of PublicShareholders," The Accounting Review, 400-420.DeAngelo, H., L. DeAngelo, and E. Rice, 1984, "Going Private: Minority Freezouts and Stockholder Wealth," Journal of Law and Economics, 367-402.DeGeorge, Francois, and Richard Zeckhauser, 1993, "The Reverse LBO Decision and Firm Performance: Theory and Evidence,"Journal of Finance, 1323-1348.Denis, David J., 1994, "Organizational Form and theConsequences of Highly Leveraged Transactions: Kroger'sRecapitalization and Safeway's LBO," Journal of Financial Economics 36, 193-224.Devinney, Timothy M., 1987, "Entry and Learning," Management Science 33, 706-724.Efron, B., 1979, "Bootstrap Methods: Another Look at theJackknife," Ann. Statist. 7, 1-26.Fama, Eugene F., and Kenneth R. French, 1992, "The Cross- Section of Expected Stock Returns," Journal of Finance, 427- 465.Ferenbach, Carl, 1987, "The IPO Market Welcome for LBOs in Transition," Mergers & Acqusitions, 54-59.Filatotchev, I., K. Starkey, and M. Wright, 1994, "The Ethical Challenge of Management Buy-Outs as a Form of Privatisation in Central and Eastern Europe," Journal of Business Ethics 13, 523-532.Frankfurter, George M., and Erdal Gunay, 1992, "Management Buy-outs: The Sources and Sharing of Wealth Between Insiders and Outside Shareholders," Quarterly Review of Economics and Finance, 82-95.Frankfurter, George M. and Erdal Gunay, 1993, "Management Buyouts and Anticipated Gains to Shareholders - Theory and Testing," International Review of Financial Analysis 2, 33-50.Frankfurter, George M., and Elton G. McGoun, 1996, Toward Finance with Meaning, JAI Press, Greenwich, Connecticut.
Reproduced with permission of the copyright owner. Further reproduction prohibited without permission.

135Fuqua, J., 1988, "Business cycles & Shareholder Value in the LBO Era," Management Review, 26-29.Grammatikos, T., and Swary, I., 1986, "Incentives for Public Firms to Go Private: Superior Information or Organizational Efficiency," Unpublished Working Paper.Guenther, David A., and Andrew J. Rosman, 1994, "Differences Between COMPUSTAT and CRSP SIC codes and Related Effects on Research," Journal of Accounting end Economics, 115-128.Gupta, Atul, and Leonard Rosenthal, 1991, "Ownership Structure, Leverage, and Firm Value: The Case of Leveraged Recapitalizations," Financial Management, 69-83.Hair, Joseph Jr., Rolph E. Anderson, Ronald L. Tatham and William C. Black, 1992, Multivariate Data Analysis, Macmillan Publishing Co., New York.Houston, D.A, and J.S. Howe, 1987, "The Ethics of Going Private," Journal of Business Ethics 6, 519-525.Jensen, Michael C., 1986, "Agency Costs of Free Cash Flow, Corporate Finance and Takeovers," American Economic Review, 323-339.Jensen, Michael C., 1988, "Takeovers: Their Causes andConsequences," Journal of Economic Perspectives 2, 21-48.Jeong, Jinook, and G.S. Maddala, 1993, "A Perspective on Application of Bootstrap Methods in Econometrics," Handbook of Statistics 11, 573-610.Jones, T.M. , and R.O. Hunt III, 1991, "The Ethics of Management Buy-Outs Revisited," Journal of Business Ethics 10, 833-840.Kahle, Kathleen M., and Ralph M. Walkling, 1996, "The Impact of INdustry Classifications on Financial Research," Working Paper, Ohio State University.Kaplan, Steven N., 1989a, "Management Buyouts: Evidence on Taxes as a Source of Value," Journal of Finance, 611-632.Kaplan, Steven N., 1989b, "The Effects of Management Buyouts on Operating Performance and Value," Journal of Financial Economics 24, 217-254.Kaplan, Steven N., 1991, "The Staying Power of LeveragedBuyouts," Journal of Financial Economics 29, 287-313.
Reproduced with permission of the copyright owner. Further reproduction prohibited without permission.

136Kieschnick, Robert L., 1989, "Management Buy-Outs of Public Corporations: An Analysis of Prior Characteristics," Leveraged Management Buyouts, edited by Yakov Amihud, Dow Jones-Irwin, Homewood, IL.Lehn, Kenneth, and Annette Poulsen, 1988, "Leveraged Buyouts: Wealth Created or Wealth Redistributed," in Murray Weidenbaum and Kenneth Chilton, eds.: Public Policy Towards Corporate Takeovers (Transaction Publishers, New Brunswick, NJ) .Lehn, Kenneth, and Annette Poulsen, 1989, "Free Cash Flow and Stockholder Gains in Going Private Transactions," Journal of Finance, 771-787.Leland, H., and D. Pyle, 1977, "Informational Asymmetries, Financial Structure, and Financial Intermediation," Journal of Finance, 371-387.Lichtenberg, Frank R., and Donald Siegel, 1990, "The Effects of Leveraged Buyouts on Productivity and Related Aspects of Firm Behavior," Journal of Financial Economics 27, 165-194.Liebeskind, Julia, Margarethe Wiersema, and Gary Hansen, 1992, "LBOs, Corporate Restructuring, and the Incentive-Intensity Hypothesis," Financial Management, 73-86.Loh, Lawrance, 1992, "Financial Characteristics of Leveraged Buyouts," Journal of Business Reseeurch 24, 241-252.Lowenstein, L., 1985, "Management Buyouts," Columbia LawReview 85, 73 0-784.Madden, Gerald P., Lynn W. Marples, and Lai C. Chugh, 1990, "A Stock Market Evaluation of Management Buyouts," Journal of Business Finance and Accounting 17, 351-358.Marais L., K. Schipper, and A. Smith, 1989, "Wealth Effects of Going Private for Senior Securities," Journal of Financial Economics, 155-191.Magowan, Peter A., 1989, "The Case for LBOs: The SafewayExperience," California Management Review Fall, 9-18.Maupin, Rebekah J., 1987, "Financial and Stock MarketVariables as Predictors of Management Buyouts," Strategic Management Journal, 319-327.Maupin, Rebekah J., Clinton M. Bidwell, and Alan K. Ortegren, 1984, "An Empirical Investigation of the Characteristics of Publicly-Quoted Corporations Which Change to Closely-Held Ownership through Management Buyouts," Journal of Business Finance and Accounting 11, 435-450.
Reproduced with permission of the copyright owner. Further reproduction prohibited without permission.
137Mian, Shehzad, and James Rosenfeld, 1993, "Takeover Activity and the Long-Run Performance of Reverse Leveraged Buyouts," Financial Management, 46-57.Miller, Merton H., 1991, "Leverage," Journal of Finance, 479- 488.Modigliani, F., and M.H. Miller, 1958, "The Cost of Capital Corporation Finance, and the Theory of Investment," American Economic Review 48, 261-297.Modigliani, F., and M.H. Miller , 1963, "Corporate IncomeTaxes and the cost of Capital: A Correction," AmericanEconomic Review 53, 433-443.Mohan, Nancy, 1990, "Do LBOs Sustain Efficiency Gains?" Akron Business and Economic Review 21, 91-99.Morck, Randall, Andrei Shleifer, and Robert Vishny, 1988, "Management Ownership and Market Valuation: An EmpiricalAnalysis," Journal of Financial Economics, 293-316.Mueller, D.C., 1969, "A Theory of Conglomerate Mergers,"Quarterly Journal of Economics, 643-659.Murphy, K., 1985, "Corporate Performance and ManagerialRemuneration," Journal of Accounting and Economics, 11-42.Muscarella, Chris J., and Michael R. Vetsuypens, 1989, "The Underpricing of 'Second' Initial Public Offerings," Journal of Financial Research 12, 183-192.Muscarella, Chris J., and Michael R. Vetsuypens, 1990, "Efficiency and Organizational Structure: A Study of Reverse LBOs," Journal of Finance, 1389-1413.Myers, S.C., 1984, "The Capital Structure Puzzle," Journal of Finance, 575-592.Myers, S.L., and N. Majluf, 1984, "Corporate Financing and Investment Decisions When Firms Have Information That Investors Do Not Have," Journal of Financial Economics, 187- 221.Ofek, Eli, 1994, "Efficiency Gains in Unsuccessful Management Buyouts," Journal of Finance, 637-654.Opler, Tim C., 1992, "Operating Performance in LeveragedBuyouts: Evidence from 1985-1989," Financial Management, 27- 34.
Reproduced with permission of the copyright owner. Further reproduction prohibited without permission.

138Opler, Tim, and Sheridan Titman, 1993, "The Determinants of Leveraged Buyout Activity: Free Cash Flows vs. FinancialDistress Costs," Journal of Finance, 1985-1999.Patell, James, 1976, "Corporate Forecasts of Earnings Per Share and Stock Price Behavior: Empirical Tests," Journal of Accounting Research 14, 246-276.Reiter, Sara Ann, 1994, "Storytellers, stories, and Free Cash Flow," The International Review of Financial Analysis 3, 209- 224.Roll, R., 1986, "The Hubris Hypothesis of CorporateTakeovers," Journal of Business, 197-216.Ross, S., 1977, "The Determination of Financial Structure: The Incentive signalling Approach," Bell Journal of Economics, 23- 40.Shleifer, Andrei, and Robert W. Vishny, 1988, "Management Buyouts as a Response to Market Pressure," Mergers and Acquisitions, edited by Alan J. Auerbach, The University of Chicago Press.Smith, Abbie J., 1990, "Corporate Ownership Structure andPerformance: The Case of Management Buyouts," Journal ofFinancial Economics 27, 143-164.Travlos, N.G., and Millon, M.H., 1987, "Going Private: Buy- Outs and Determinants of Stockholders Returns," Unpublished Working Paper.Torabzadeh, Khalil M., and William J. Bertin, 1987, "Leveraged Buyouts and Shareholder, Returns," Journal of Financial Research 10, 313-319.Van de Gucht, Linda Melania, 1994, "Leveraged Buyouts: An Empirical Examination of the Decision to Return to Public Status" Ph.D. Dissertation, University of South Carolina.Wright, M., and J. Coyne, 1985, Management Buyouts, Croom- Helm, Beckenham, England.Wu, Yuwu, 1992, "Management Buyouts: A Test of the Management Manipulation Hypothesis," Ph.D. Dissertation, New York University, Graduate School of Business.
Reproduced with permission of the copyright owner. Further reproduction prohibited without permission.

APPENDIXManagements' Perception of Buyouts
Instructions: Please mark an X on the line provided beside each question. Given the following scale, the length of the line segment will be taken as the value corresponding to your opinion on each of the statements below.
0. Strongly disagree 4. Strongly agree
Example: The X marked on the line below indicates that the respondent "almost" strongly agrees with the statement.
0 1 2 3 4 1---------- 1---------------- 1---------- 1------ X---1
Begin:1. A buyout allows management to focus on long- 0 1 2 3 4term growth and profitability................|----1-------1------1----- 12. In management buyouts there is a conflict of interest on the part of the managementin that it is acting on both sides of the 0 1 2 3 4transaction as buyer and seller of a company. |----1-------1------1----- 1
3. It is easier for a private firm to sellassets or divisions than it is for a publicly 0 1 2 3 4held company..............................|------ 1------ 1------ 1----- 1
4. It is necessary to rely on outside consultants and takeover specialists to determine 0 1 2 3 4the gains of a buyout.....................|------ 1------ I------ 1----- 1
5. In a hostile takeover, incumbent management 0 1 2 3 4of the target firm is replaced............. |------ 1------ 1------ 1----- 1
6. The main motivation for our buyout was ouropinion that pre-buyout market prices of our 0 1 2 3 4stock did not reflect their "true" value. . . |------1----- 1------ 1------1
7. The premium offered is affected by the 0 1 2 3 4recent trend in reported earnings per share . |----- 1------ 1------ 1----- 1
8. Outside shareholders exert pressure in apublicly held company to increase or at least 0 1 2 3 4maintain previous quarters' earnings figures. |----- 1------ J------ 1----- 1
9. Firm performance improves after a buyoutbecause of a closer relation between 0 1 2 3 4management action and rewards............. |------ 1------J------ 1-----1
139
with permission of the copyright owner. Further reproduction prohibited without permission.

14010. A buyout is an appropriate strategy in afirm for which the parts are worth more them 0 1 2 3the whole............................... |-- J______ l_______L
11. The premium in a buyout is larger, otherthings being equal, when Incumbent management 0 1 2 3 4also sells off some of its shares............|----1------- 1------1----- 1
12. The main motivation in our buyout was that 0 1 2 3 4the firm was subject to a hostile takeover. . |----1-------1 -1----- 1
13. The equity investors in a buyout usually 0 1 2 3 4go public again in three to five years. . . . |-----1------ 1------ 1----- [
14. The equity investors receive a return ontheir investment commensurate with the risk 0 1 2 3 4they take-------------------------------- |------1------ 1------ 1----- 1
15. Before the buyout my company was performingbetter than comparable firms within the same 0 1 2 3 4industry---------------------------------- |------1------ 1------ 1-----1
16. Premiums paid to shareholders in a buyout are not necessarily indicative of the difference between the market value of thestock and management's belief about the 0 1 2 3 4"true" value of the stock................... |---- 1------ 1------1----- |
17. There is an element of disloyalty in a management-led buyout since it amounts to admitting that management will do a betterjob for themselves than they did for share- 0 1 2 3 4holders................................... I---- 1------ 1------1----- 1
□ Please mark the box to the left with an X if you are interested in receiving the results of this survey.
This concludes the questionnaire. All responses are confidential. Please place the completed form in the postage-paid envelope we
have provided.
Thank you for your participation.
Reproduced with permission of the copyright owner. Further reproduction prohibited without permission.

VITA
The author received his elementary, mid-high, and high- school education from Sahakyan-Nunyan Armenian Lyc6e at Samatya, Istanbul between 1970-1981. He then attended Istanbul University during 1982-1986, earning a Bachelor of Science degree in Business. His first encounter with the United States occurred in 1987. After spending the entire year in the English language program (ELOP) at Louisiana State University (LSU), he enrolled in the Finance Department at LSU and obtained a Master of Science degree in 1990. He returned to Istanbul and worked for a large scale import/export company as an Assistant Manager of Finance. In 1993, he was back in the United States for his second escapade at LSU where he reinforced his earlier knowledge in the area and earned a Doctor of Philosophy degree in Finance.
141
Reproduced with permission of the copyright owner. Further reproduction prohibited without permission.

DOCTORAL EXAMINATION AND DISSERTATION REPORT
Candidate: Arman Kosedag
Major Fields Business Administration (Finance)
Title of Dissertation: An Investigation of the Motives in Going-Private Transactions: The Case of Re-LBOs
Approved:
aduate School
EXAMINING COMMITTEE!
Date of Bramination:
March 14, 1997
Reproduced with permission of the copyright owner. Further reproduction prohibited without permission.