an investigation of the mechanism of the hydrogen … · 2019-06-07 · an investigation of the...
TRANSCRIPT

Instructions for use
Title AN INVESTIGATION OF THE MECHANISM OF THE HYDROGEN ELECTRODE PROCESS ON A MERCURYCATHODE AT HIGH ELECTRODE POTENTIAL
Author(s) MITUYA, Atusi
Citation JOURNAL OF THE RESEARCH INSTITUTE FOR CATALYSIS HOKKAIDO UNIVERSITY, 4(3), 228-255
Issue Date 1957-03
Doc URL http://hdl.handle.net/2115/24653
Type bulletin (article)
File Information 4(3)_P228-255.pdf
Hokkaido University Collection of Scholarly and Academic Papers : HUSCAP
AN INVESTIGATION OF THE MECHANISM OF THE HYDROGEN ELECTRODE PROCESS
ON A MERCURY CATHODE AT HIGH ELECTRODE POTENTIAL
By
Atusi MrTUY A *)
(Received February 25, 1957)
Introduction
It is the well-known empirical relationship found by TAFf:L that the logarithm of current density i of the hydrogen electrode reaction
2H + + 28 = H2 , £: metal electron,
varies linearly with the electrode potential 7J of the cathode referred to the reversible hydrogen electrode as
log i = -a.F7J/RT+constant, O>a>l.
Bowm~N and RID)<~AL,I) with their exhaustive studies confirmed this relationship for numerous metal electrodes. That a is a proper fraction and moreover a constant near i independent of 7J for most of hydrogen electrodes, 'has drawn attention of a number of investigators and they have tried to find out a common mechanism, which accounts for this conspicuous aspect of the hydrogen electrode reaction.
HomUTI and OKA~!oTd) found that the separation factors of heavy hydrogen for various metal electrodes at 0.3 volt cathodic polarization at room temperature were distinctly divided into two groups i. e. 6 to 7 for cathodes of Pt, Ni, Au, Ag, Cu, Fe, and Pb (alkaline), and 3 to 4 for those of Hg, Sn, and Pb (acid). Recognizing as did by TOl'LEY and EYHI~(l,") that the separation factor depends only on the rate determining step, they have attributed the catalytic mechanism, controlled by the recombination of chemisorbed hydrogen atoms to the former group and the electrochemical mechanism governed by the neutrali-
*) Chemical Laboratory, St. Paul's University, Tokyo.
--228-
An Investigation of the Mechanism of the Hydrogen Electrode Process
zation of chemisorbed hydrogen molecule-ion to the latter group*). OKA~IOTO, HaRlUT] and HmaTA-I) have actually calculated the separa
tion factor statistical-mechanically in agreement with the observed value with reference to nickel of the former group of the hydrogen electrodes. HaRIUT), KEII and HmoTA5
) have on the other hand worked out the separation factor on the basis of the electrochemical mechanism with special reference to mercury cathode in concordance with the observation. The TAFgL rule that a remains constant near i has also been accounted for on the basis of the respective mechanism. It has been, moreover, predicted from the catalytic mechanism that a reduces to 2 or 0 according as 1) is sufficiently high or low outside the observed region of 1), whereas from the electrochemical mechanism that a is near 1 i or i according as 1) is high or low but never reduces to zero over the region where the reverse current is negligible.
The slow discharge mechanism has on the other hand revealed itself more or less attractive with regard to the explanation of a being constant near i, in so far as one remains with the classical kinetics assumed to be valid to the elementary reaction on the electrode surface; as well known, TAFEL has thus obtained 2 instead of observed i on the basis of the catalytic mechanism. HomuTI et 01. -I)n) have explained that a is a constant near i on the very basis of the catalytic mechanism but taking the repulsive interaction of chemisorbed hydrogen atoms, which causes an appreciable deviation from the classical kinetics.
It is the purpose of the present work further to investigate the mechanism of the hydrogen electrode reaction on mercury. Among three mechanisms mentioned above, the catalytic mechanism may be excluded at the outset, since the energy of two hydrogen atoms chemisorbed on mercury electrode is nearly as high as two free hydrogen atoms, as inferred from the minute dissociation energy of HgH (O.37e V), so that no observable reaction could ever take place through this state. Our procedure of investigation was now to check the theoretical predictions deduced from the electrochemical mechanism by experiments
*) According to the original statement of the mechanism, it was the act of formation of hydrogen molecule from a chemisorbed hydrogen atom H 'ai, a proton H+, and a metal electron 0, which governed the rate of the electrode process: i. e. H+ T H a ,->H,. The present expression, Hz!ah-o->H~, was adopted, since it has turned out later by an actual calculation that the electronic state of Hand H+ before the neutralization was such as adequately covered by words "hydrogen molecule-ion ndsorbed on the electrode". Cf. Ref. 5.
-229-
Journal of the Research Institute for Catalysis
comparatively with those from the slow discharge mechanism. The electrochemical mechanism predicts now, as mentioned abo"~,
that the TAFEL constant a lies near q. or i according as electrode potential r; is high or low. The increase of TAFEL constant by one at higher electrode potential is caused according to the electrochemical mechanism as follows. The probability of a single hydrogen moleculeion to discharge is proportional to exp (-aoFr;/RT) where ao is a constant near i .5) The chemical potential of chemisor bed hydrogen moleculeion pH, or that of metal electron pe is expressed') *) as,
,/i = RTlog (8/1-8) -RT log q:i + u
pe = -Fr; + constant,
where 8 is the probability that a site a for Hi is occupied by the
latter, -RT log q:i the reversible work required to bring up a hydrogen molecule-ion onto the site (1 from the reference state in the absence of the interaction with surrounding adsorptives and u the part of the work due to the latter interaction.
On account of the preliminary equilibrium
we have
and hence
RT log (d 11-0) + u =-= - F'r; + constant* *).
*) According Eqs. (8. 14) and (5. 1) of Ref. 8 we have H+ H+
{J. "=Rl'logeo<.H,-) ;eo(o)-RTlogqa" '
where 60(H;P or eO(rl) is the probability that the site 11 of adsorption is occupied by
Hi or none respecti vely and - RT log q~; is the reversi ble work req ui red to bring
up H{ from its reference state onto 11. Rewriting BO(H;tl into 0 and eO(O) into 1-0,
neglecting the probability of adsorption of other adsorptives in accordance with +
the result of Ref. 5 we have the equations in the text, dividing the work -RTlogq';"
further into two parts, - R7'log q~r: and 1t. Cf. ~ 27, Ref. 7.
H+ *") The work - RTlog qo" is constant at constant temperature according to the de-
finition.
-230:-

An Investigation of the Mechanism of the Hydrogen Electrode Process
As u is of the repulsive interaction5\ it increases with fI and hence
o decreases according to the above relation with increasing r;. When o is sufficiently small that u practically vanishes, 0 or the population of chemisorbed hydrogen molecule-ion is proportional to exp (-Fr;/RT). The current is now proportional at this condition to exp (-(1 + a',,) Fr;/RT)
or the TAFEL constant, a'= - RT a log i , is 1 + 11". F ar;
When 0 attains a certain value with decreasing r;, the increase of u with 0 becomes remarkable, so that the further increase of fI with decreasing r; is appreciably checked and practically completely when fI is close to unity. At this stage a practically equals a" as observed.
We consider now the charge E to be supplied along with the creation of new electrode surface at constant 7). As the repulsive interactions between hydrogen molecule-ions sets in to reduce the value of a from 1 + ao to ao, the rate of increase of E with decreasing r;, or the capacity of the electrode surface must be simultaneously reduced, because of the increase of H; is checked by the repulsive interaction and that of H + al!,}o, as the latter is repulsed by H~+ too as shown by the detailed calculation of HORIUTI, KIm and HIIWTA"l.
On the basis of slow discharge mechanism on the other hand, there is no reason why a should change and the capacity should too, hydrogen atoms formed by the rate-determining slow discharge step being practically in equilibrium with hydrogen gas at constant pressure leaving the electrode surface invariable with respect to their adsorption.
We are thus able to discriminate between the electrochemical and the slow discharge mechanism by observing i-r;-relation as well as Er;-relation simultaneously.
Present author has previously'> measured i-r;-relation finding actually the transition of a from 1 + a" to an. In the present work the latter observation was carried out in conjunction with that of the E-r;-relation respectively at conditions adjusted as close as possible to each other with appreciably improved degree of purity of electrodes as well as of electrolyte as described below.
~ 1. Materials
(1) Mercury and O.1N-HCI.
Mercury for the electrode and 0.1 N-HCl for the electrolyte were prepared from purchased mercury and 6 N-HCI formed from synthe-
-231-

Journal oj the Research Institute for Catalysis
"Electrol sis-l
6N-HCl-3
Electrol 618-2
Hg
·cf. §I - (1) ··cf. §I - (2)
lectr 1 818-1
6N-H 1-4
O.lN-HC1-1
Electrol sis-
O.IN-HC] -2
Red1.t111ed w .. t.r""
Diagram 1 Schematic Diagram of purification
sized 12 N-HCI, 36 N-H~S04 for analysis and redistilled water *) by procedures shown in the Diagram 1 above.
Lines there show the flow of materials through individual procedure of purifications indicated in rims, combination Or branching of the lines showing the two kinds of materials getting into or coming out from the procedure of purification. Hg-1, Hg-2, etc. show materials in progressing degree of purification. The horizontal chain line shows that the procedures above or below it were conducted in air or in vacuum respecti vely.
6 N-HCI-1 was prepared as follows. The 36 N-HcSO, for analysis was droped into the synthesized 12 N-HCI at 50°C. The liberated
*) Cf. (21. Redistilled water used in the present work is all of the same preparation.
-232-

An Investigation of the Mechanism of the Hydrogen Electrode Process
hydrogen chloride was introduced into redistilled water to make a solution of 6N-HCl. This solution was distilled in an all glass apparatus in air to prepare 6N-HCI-1.
Purchased mercury was purified as shown in the Diagram ordinarily by washing with aqueous solution of mercuric nitrate and distilled in air, successively by Electrolysis-O, shaking with 6N-HCI-2, Electrolysis-I and -2 down to Hg-3; Electrolysis-O is the electrolysis of 2N-HNO" with mercury to be purified as anode and platinum as cathode in air after BnnDIEIl and NAHA y-SzABfl'll followed by wash with redistilled water. Electrolysis-I is that of 6N-HCI between mercury and platinum as cathode and anode respectively in vacuum and Electrolysis -2 is the electrolysis using the very 6 N-HCI purified by Electrolysis-I, with two mercury electrodes in vacuum. The anode mercury thus purified is Hg-3.
Electrolysis-I is illustrated in Fig. 1.
graduated flask
Cdl-i ~ .~
Fig. 1 Illustration for Electrolyss-l to make 6N·HCI~3.
Hg-2 was distilled in vacuum without boiling into the right brand of the electrolytic cell, Cell-I, leaving the left branch empty and thE constriction S, was sealed off. 6N-HCI-2 sealed in vacuum in a flas~
was now distilled without boiling into Cell-I and the constriction S was sealed off. After Electrolysis-l was carried out in Cell-I betweel
-233-
Journal of the Research Institute for Catalysis
mercury and platinum as cathode and anode, the content was frozen by liquid air and evacuated for removing the gas evolved by the electrolysis; this procedure was repeated four times to make sure the removal. The 6N-HCl in Cell-I was distilled into a graduated flask to prepare 6N-HCI-3 and the constrictions 83 and S4 were sealed off.
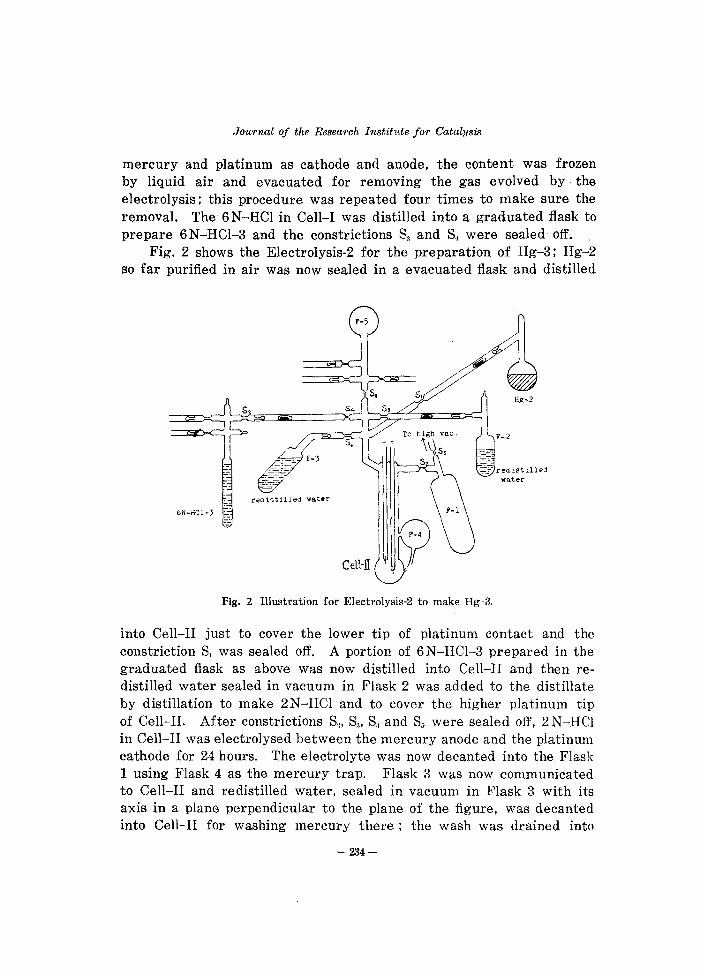
Fig. 2 shows the Electrolysis-2 for the preparation of Hg-3; Hg-2 so far purified in air was now sealed in a evacuated flask and distilled
~ S. $,
Hg-2
F-2
water
reC1i";til]ed water
6N-rlCl-3
c,\t-n~-' Fig. 2 Illustration for Electrolysis-2 to make Hg-3.
into Cell-II just to cover the lower tip of platinum contact and the constriction SI was sealed off. A portion of 6N-HCl-3 prepared in the graduated flask as above was now distilled into Cell-II and then redistilled water sealed in vacuum in Flask 2 was added to the distillate by distillation to make 2N-HCl and to cover the higher platinum tip of Cello. II. After constrictions S", S,,, SI and So were sealed off, 2 N-HCI in Cell-II was electrolysed between the mercury anode and the platinum cathode for 24 hours. The electrolyte was now decanted into the Flask 1 using Flask 4 as the mercury trap. Flask 3 was now communicated to Cell-II and redistilled water, sealed in vacuum in Flask 3 with its axis in a plane perpendicular to the plane of the figure, was decanted into Cell-II for washing mercury there; the wash was drained into
-234-
An Investigation of the 1\1/ echanism of the Hydrogen Electrode Process
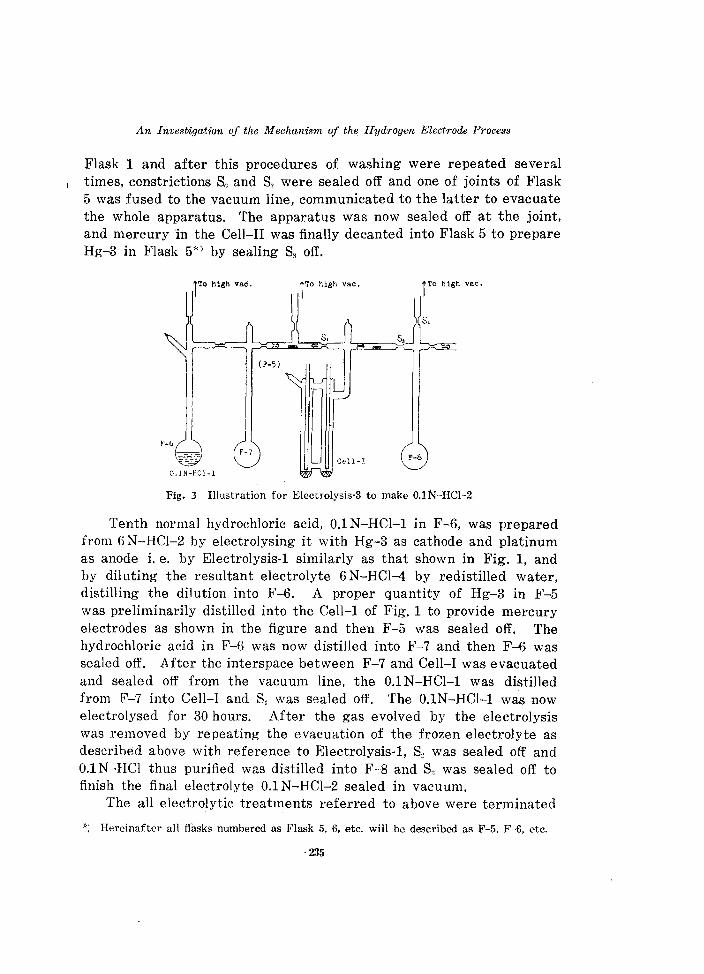
Flask 1 and after this procedures of washing were repeated several times, constrictions Sa and S, were sealed off and one of joints of Flask 5 was fused to the vacuum line, communicated to the latter to evacuate the whole apparatus. The apparatus was now sealed off at the joint, and mercury in the Cell-II was finally decanted into Flask 5 to prepare Hg-3 in Flask 5*) by sealing S8 off.
Fig. 3 Illustration for Electrolysis-3 to make 0.1 N-HCI-2.
Tenth normal hydrochloric acid, 0.1 N-HCI-1 in F -6, was prepared from 6N-HCI-2 by electrolysing it with Hg-3 as cathode and platinum as anode i. e. by Electrolysis-1 similarly as that shown in Fig. 1, and by diluting the resultant electrolyte 6 N-HCI-4 by redistilled water, distilling the dilution into F-6. A proper quantity of Hg-3 in F-5 was preliminarily distilled into the Cell-1 of Fig. 1 to provide mercury electrodes as shown in the figure and then F-5 was sealed off. The hydrochloric acid in F-6 was now distilled into F-7 and then F-6 was sealed off. After the interspace between F-7 and Cell-I was evacuated and sealed off from the vacuum line, the 0.1 N-HCl-I was distilled from F-7 into Cell-I and Sl was sealed off. The 0.lN-HCl-1 was now electrolysed for 30 hours. After the gas evolved by the electrolysis was removed by repeating the evacuation of the frozen electrolyte as described above with reference to Electrolysis-I, S~ was sealed off and O.IN-HCl thus purified was distilled into F-8 and S" was sealed off to finish the final electrolyte 0.1 N-HCI-2 sealed in vacuum.
The all electrolytic treatments referred to above were terminated
XI Hereinafter all flasks numbered as Flask 5, 6, etc. will be described as F-5, F-6, etc.
--235-
2
7
r
Journal of the Research Institute for Catalysis
----to Time in min.
5 lob 15()
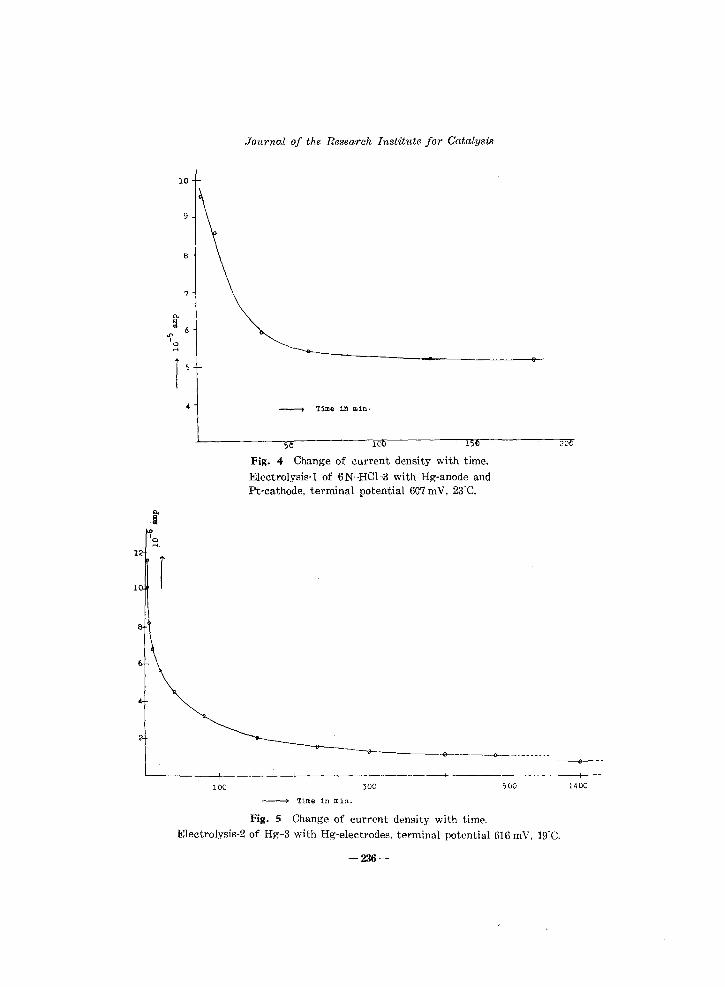
Fig. 4 Change of current density with time.
Electrolysis-l of 6N-HCI-3 with Hg-anode and Pt-cathode, terminal potential 6G7 m V, 23"C.
L---______ ~--------+_------~I--
100 300
------+- Time in min.
Fig. 5 Change of current density with time.
500
Electrolysis-2 of Hg-3 with Hg-electrodes, terminal potential 616 mY, 19"C.
-236-
20/)
1400
An Investigation of the Mechanism of the Hydrogen Electrode Process
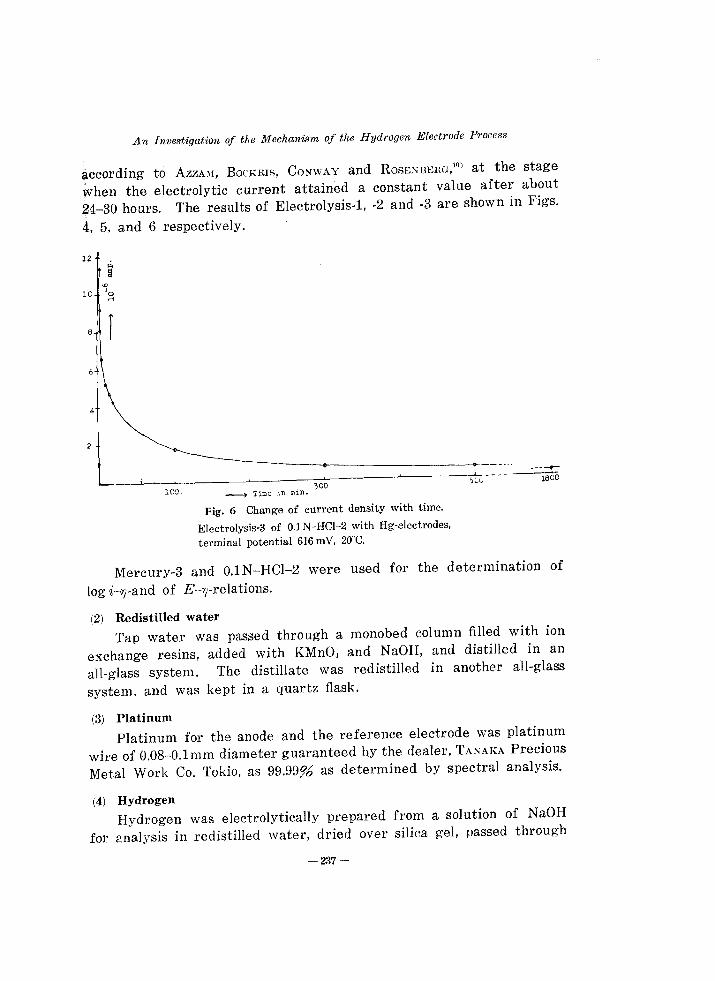
according to AZZA~I, BOCKlUS, CO~WAY and ROSE.'<HEIW,lf») at the stage
When the electrolytic current attained a constant value after about
24-30 hours. The results of Electrolysis-l, -2 and -3 are shown in Figs.
4. 5, and 6 respectively.
12
'" ~ '" 1C '0
rl
8 r 6
4
leo 300 -i' 'i'.i1Jc in min.
Fig. 6 Change of current density with time.
Electrolysis-3 of O.lN-HCI-2 with Hg·electrodes,
terminal potential 616 mY, 20"C.
5GG
MercurY-3 and 0.lN-HCI-2 were used for the determination of
log i-7J-and of E-7J-relations.
(2) Redistilled water
Tap water was passed through a monobed column filled with ion
exchange resins, added with KMnO, and NaOH, and distilled in an
all-glass system. The distillate was redistilled in another all-glass
system, and was kept in a quartz flask.
(3) Platinum
Platinum for the anode and the reference electrode was platinum
wire of 0.08-0.1mm diameter guaranteed by the dealer, TAC-;AKA Precious
Metal Work Co. Tokio, as 99.99% as determined by spectral analysis.
(4) Hydrogen
Hydrogen was electrolytically prepared from a solution of NaOH
fo1' 2nlllysis in redistilled water, dried over silica gel, passed through
-237-
Journal of the Research Institute for Catalysis
i to vac. lin.
Pd-asbestos
si11cagel
Fig. 7 Preparation and purification of hydrogen.
a tube packed with about 50 cm long palladium-impregnated asbestos kept at 350°C, over P205 and then through a trap in liquid air, and stored in a 3 litre flask H2 , shown in Fig. 7.
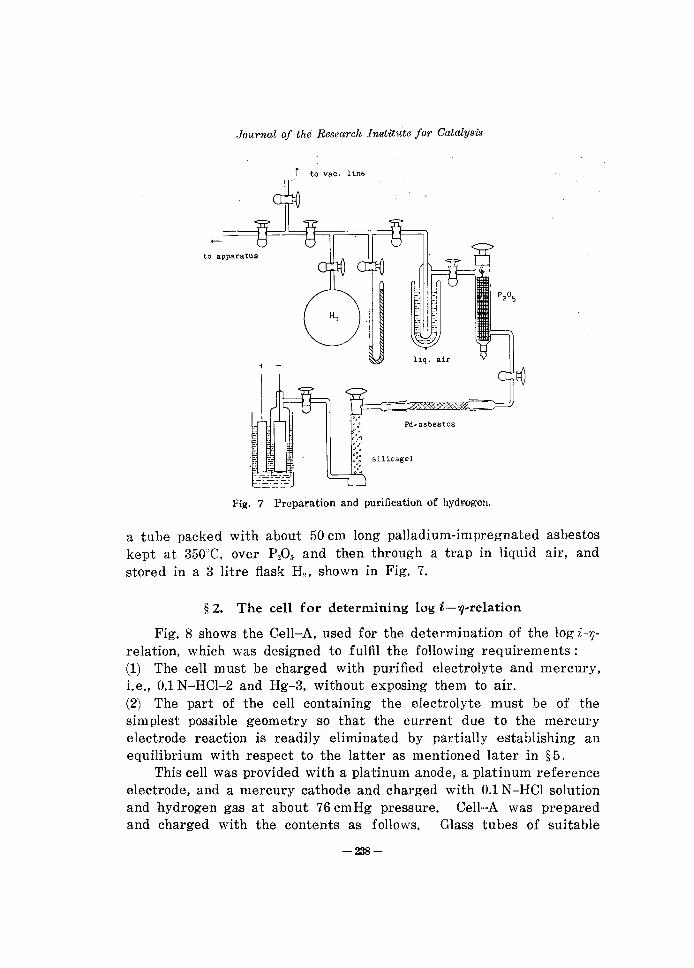
§ 2. The cell for determining log i--1j-relation
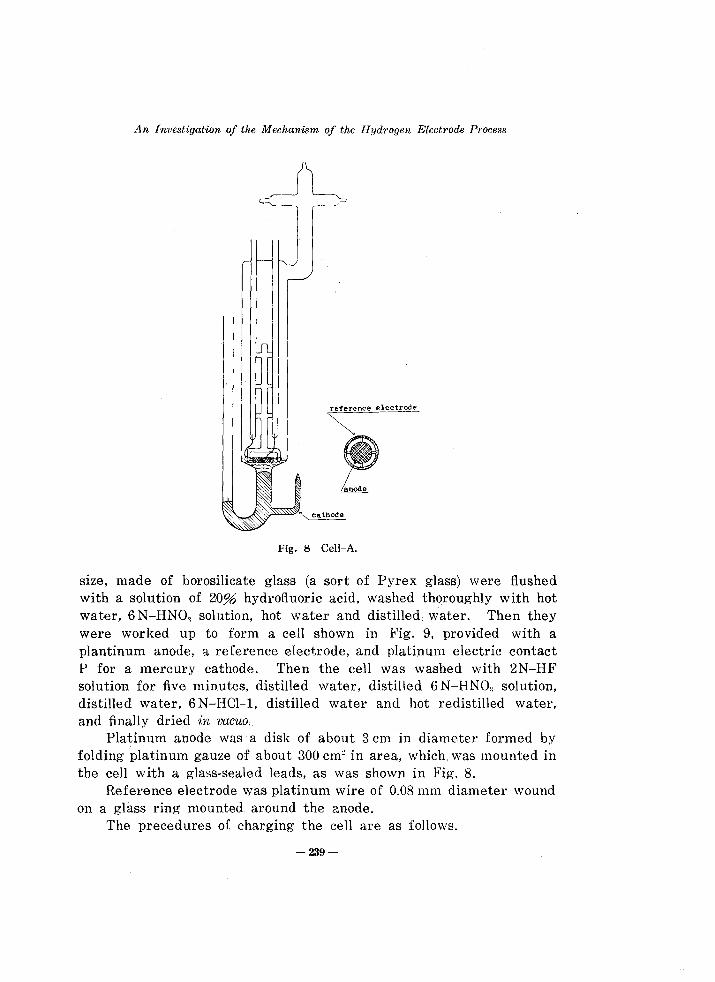
Fig. 8 shows the Cell-A, used for the determination of the log i-r;relation, which was designed to fulfil the following requirements: (1) The cell must be charged with purified electrolyte and mercury, i.e., 0.1 N-HCI-2 and Hg-3, without exposing them to ail'. (2) The part of the cell containing the electrolyte must be of the simplest possible geometry so that the current due to the mercury electrode reaction is readily eliminated by partially establishing an equilibrium with respect to the latter as mentioned later in § 5.
This cell was provided with a platinum anode, a platinum reference electrode, and a mercury cathode and charged with 0.1 N-HCI solution and hydrogen gas at about 76 cmHg pressure. Cell-A was prepared and charged with the contents as follows. Glass tubes of suitable
-238-
An Investigation of the Mechanism of the Hydrogen Electrode Process
Fig. 8 Cell-A.
size, made of borosilicate glass (a sort of Pyrex glass) were flushed with a solution of 20% hydrofluoric acid, washed thoroughly with hot water, 6N-HNo., solution, hot water and distilled water. Then they were worked up to form a cell shown in Fig. 9. provided with a plantinum anode. ::t reference electrode. and platinum electric contact P for a mercury cathode. Then the cell was washed with 2N-HF solution for five minutes. distilled water. distilled 6 N-HNO" solution, distilled water, 6N-HCl-l. distilled water and hot redistilled water. and finally dried in vacuo.
Platinum anode was a disk of about 3 cm in diameter formed by folding platinum gauze of about 300 cme in area, which. was mounted in the cell with a glass-sealed leads, as was shown in Fig. 8.
Reference electrode was platinum wire of 0.08 mm diameter wound on a glass ring mounted. around the 2.node.
The precedures of charging the cell are as follows.
-239-
;'ournal OJ the Research Instit1tte Jar Catalysis
r to Va.c. line
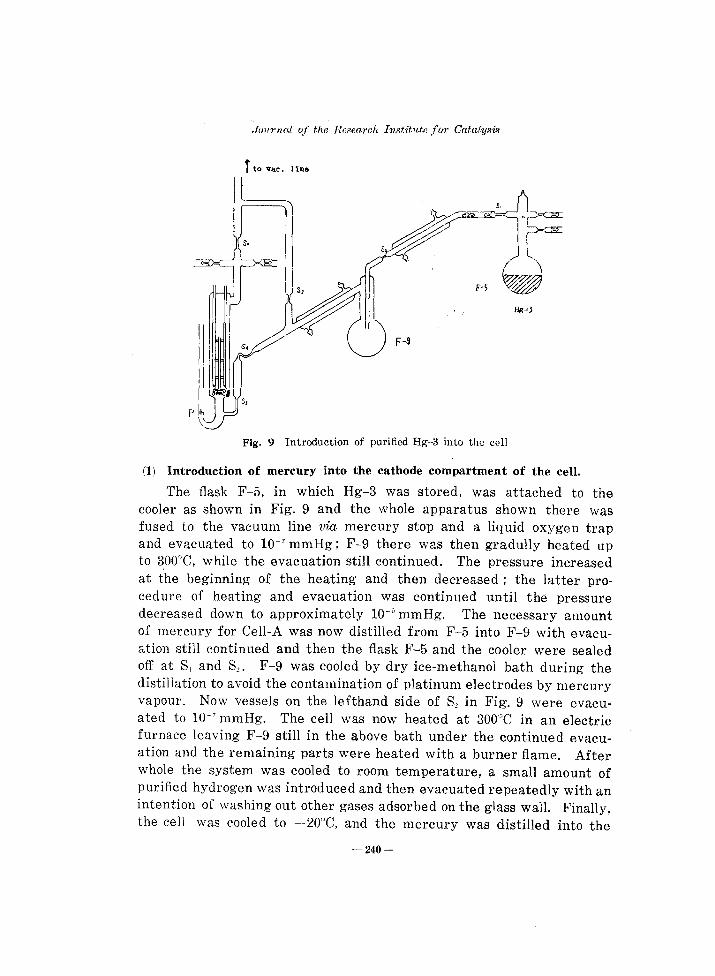
Fig. 9 Introduction of purified Hg-3 into the cell
(1) Introduction of mercury into the cathode compartment of the cell.
The flask F-5, in which Hg-3 was stored, was attached to the cooler as shown in Fig. 9 and the whole apparatus shown there was fused to the vacuum line via mercury stop and a liquid oxygen trap and evacuated to 10-7 mmHg; F-9 there was then gradully heated up to 300°C, while the evacuation still continued. The pressure increased at the beginning of the heating and then decreased; the latter procedure of heating and evacuation was continued until the pressure decreased do\vn to approximately lO-j mmHg. The necessary amount of mercury for Cell-A was now distilled from F-5 into F-9 with evacuation still continued and then the flask F-5 and the cooler were sealed off at S, and S". F-9 was cooled by dry ice-methanol bath during the distillation to avoid the contamination of platinum electrodes by mercury vapour. Now vessels on the lefthand side of So in Fig. 9 were evacuated to 10-' mmHg. The cell was now heated at 300'C in an electric furnace leaving F-9 still in the above bath under the continued evacuation and the remaining parts were heated with a burner flame. After whole the system was cooled to room temperature, a small amount of purified hydrogen was introduced and then evacuated repeatedly with an intention of washing out other gases adsorbed on the glass wall. Finally, the cell was cooled to -20°C, and the mercury was distilled into the
-240-

An Investigation of the Mechanism. of the. Hydrogen .h'lectrode I'rocc88
cell from F-9 by removing the dry ice-methanol bath and heating the flask by a hand burner; and then hydrogen gas was admitted into the cell, to prevent any further contamination of the platinum electrodes by mercury vapour. After that the remaining constrictions S:, S,' S·, and St; were all sealed off.
(2) Introduction of 0.1 N-HCI-solution into the cell.
Now F-8 containing 0.1 N-HCI-2 was fused to a joint of the cell as shown in Fig. 10 and hydrogen gas in the cell was evacuated from S~ without opening F-8 and then S~ sealed off.
I I
, to vac. line
I cell C
F·,
mercury stop O.lN-HCl-2
Fig. 10 Introduction of 0.1 N -HCI-2 to the cell.
The cell kept at -20°C, was now communicated to F-8 to distill 0.1 N-HCI-2 in it gently without boiling into the cell so much as just to wet the platinum anode and the reference electrode for facilitating both the platinum electrodes to work reversibly under hydrogen gas above.
(3) Introduction of hydrogen gas.
After the electrolyte was introduced into the cell the constriction S, was sealed off and the cell was connected to the vacuum line by the remaining joint. After a proper evacuation purified hydrogen kept in a flask H~* was expanded carefully through a liquid ox),!r,en trap into the cell kept at O°C to 70.3 cmHg pressure. Cell-A is now finished by sealing off the constriction of the last joint.
*) Cf. § 1-(4) and Fig. 7.
-241-
Journal of the Research Institute for Catalysis
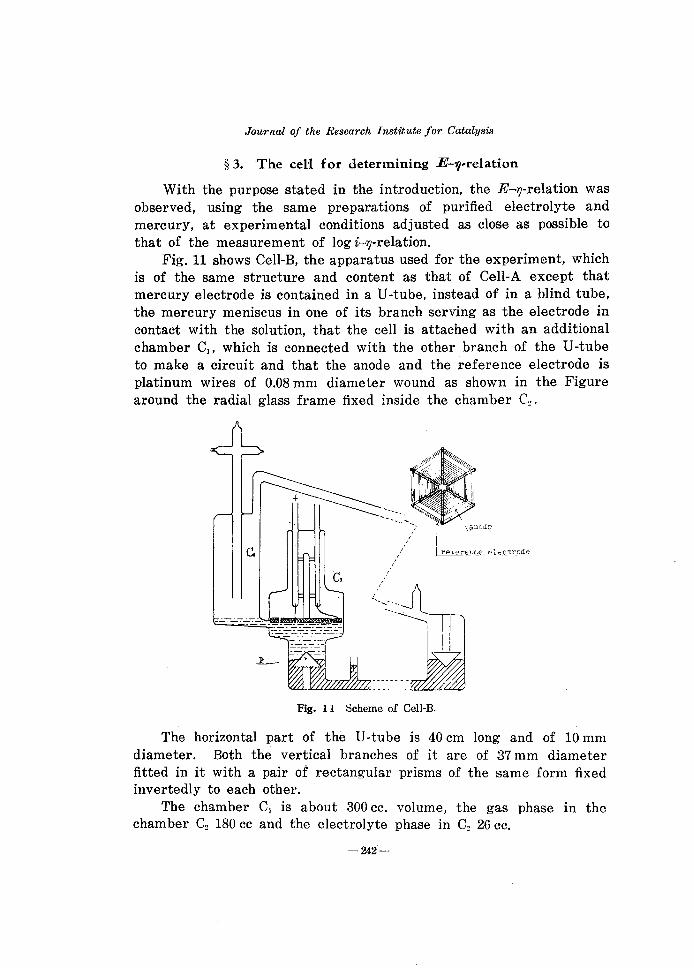
§ 3. The ceU for determining E-v-relation
With the purpose stated in the introduction, the E-Ij-relation was observed, using the same preparations of purified electrolyte and mercury, at experimental conditions adjusted as close as possible to that of the measurement of log i-1J-relation.
Fig. 11 shows Cell-B, the apparatus used for the experiment, which is of the same structure and content as that of Cell-A except that mercury electrode is contained in a V-tube, instead of in a blind tube, the mercury meniscus in one of its branch serving as the electrode in contact with the solution, that the cell is attached with an additional chamber Cl , which is connected with the other branch of the V -tube to make a circuit and that the anode and the reference electrode is platinum wires of 0.08 mm diameter wound as shown in the Figure around the radial glass frame fixed inside the chamber Cz •
+
c,
c,
Fig. 11 Scheme of Cell-B.
The horizontal part of the V -tube is 40 cm long and of 10 mm diameter. Both the vertical branches of it are of 37 mm diameter fitted in it with a pair of rectangular prisms of the same form fixed invertedly to each other.
The chamber Cl is about 300 cc. volume, the gas phase in the chamber Cz 180 cc and the electrolyte phase in Cz 26 cc.
-242-
An Investigation of the Mechanism of the Hydrogl?n Electrode Proces8
The procedure of charging Cell-B with O.lN-HCI-2 and Hg-3 is quite similar to that of Cell-A.
Mercury was so much admitted into Cell-B as both the mercury meniscuses rest, at a proper inclination of the U -tube, just at the middle height between the vertex and the base of the respective prisms.
The Cell-B rest on a knife edge fixed beneath P and its rightward end could be driven upwards by means of a plunger rod of a piston pressed out by oil at constant rate; the oil was pressed in at a constant rate by another piston with its plunger rod screwed in by means of a synchronous motor. The inclination of Cell-B was thus varied at constant rate within 2°. The constant rate of the variation of inclination was changed by a pulley system attached to the synchronous motor.
In this way the area of the electrode in contact with the solution could be varied at a constant rate as shown below. Let hl or Sl be the height above the horizontal part of the U-tube or the area of the mercury meniscus respectively in the left branch of the U-tube and h,. or Sr that in the right branch. We have for the variation of the area dSl or dS, caused by that of inclination
(1.l),(1.r),
since the prisms are of' the same form and placed invertedly to each other, where a (>0) is a constant particular to the geometry of prisms and dhl or dhr the increment of the height of the meniscus caused by the increment of the inclination. We have however because of the incompressibility of mercury
Sl' dhl+S,' dhr c:= 0,
or eliminating dhz and dh,. from the above three equations,
Sl . dSl =-:c Sr . dS,.
or by integration
Si :: S; + const .
The integration constant is however zero, inasmuch as the' mercury level was adjusted to pass through the middle height of' hoth the prisms at a particular inclination, when Sl =S,.. It follows that
( 2 )
-243-

Journal of tlw Research Institute for Catalysis
throughout. But since the inclination of Cell-B is varied at constant rate, the
difference hz-h,. of the heights referred to Cell-B must also be varied at constant rate, say C, i. e.
d (hz-h r ) = C· dt
where t is time. Eliminating dhz and dh r from (1.l), (1.r) and the above equation, we have now
dSz + dSr = a . C . dt
or according to (2)
1 dSz/dt = --a· C 2
1. e. the rate of the variation of the electrode sur face SZ IS a constant.
§ 4. Experimental procedure
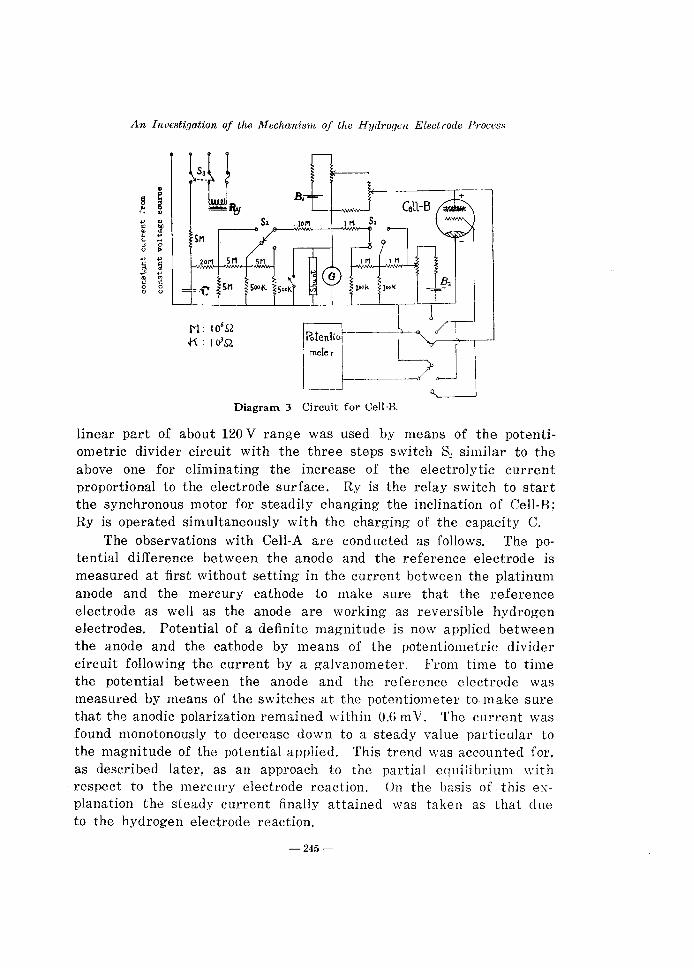
Diagram 2 and 3 show the circuit for Cell-A and CelI-B respectively. Battery BJ in Diagram 3 applies a desired potential between anode
and cathode of CeII-B through the ballistic galvanometer G of 75552 internal resistance by means of the potentiometric divider circuit. Battery B2 there is usen for eliminating a constant electrolytic current i through G with another potentiometric divider circuit switched in three steps by means of the switch S1 according to the order of magnitude of the constant current to be eliminated. C is a capacity of 50 {iF,
which is charged by a 200 V potential source of 0.1% constancy; the
G
Diagram 2 Circuit for Cell-A.
-244-
An Investigation of the Mechanism of the Hydrogen Electrode J'roces8
• ~ ~ !:: .. ... " " ~ ... ... ... ... .... SM ~ 0
" ~
~ ... ~
20M 5M , .., p .. '" " " 0 0
" "
Diagram 3 Ci rcuit for Cell·B.
linear part of about 120 V range was used by means of the potentiometric divider circuit with the three steps switch S" similar to the above one for eliminating the increase of the electrolytic current proportional to the electrode surface. Ry is the relay switch to start the synchronous motor for steadily changing the inclination of Cell-B; Ry is operated simultaneously with the charging of the capacity C.
The observations with Cell-A are conducted as follows. The potential difference between the anode and the reference electrode is measured at first without setting in the current between the platinum anode and the mercury cathode to make sure that the reference electrode as well as the anode are working as reversible hydrogen electrodes. Potential of a definite magnitude is now applied between the anode and the cathode by means of the potentiometric divider circuit following the current by a galvanometer. From time to time the potential between the anode and the reference electrode was measured by means of the switches at the potentiometer to make sure that the anodic polarization remained within 0.6 m V. The current was found monotonously to decl'ease down to a steady value particular to the magnitude of the potential applied. This trend was accounted for, as described later, as an approach to the partial equilibrium with respect to the mercury electrode reaction. On the basis of this explanation the steady current finally attained was taken as that clue to the hydrogen electrode reaction.
-245-

Journal of the Research Institute for Catnlysis
After the first measurement of the steady current described above, the potential applied was shifted to another fixed value to observe the steady current finally attained. The potential was thus changed from a fixed value to another successively observing the final steady current for each fixed potential. The current was found to increase or decrease according as the previous fixed potential is smaller or greater in absolute magnitude than the present one. This effect being similarly explained as an approach to the partial equilibrium with respect to the mercury electrode reaction, the steady current fi:1ally attained was taken similarly as that due to the hydrogen electrode reaction.
The observation of E-r;-relation by means of Cell-B was conducted as follows. Similarly as in the case of Cell-A, it was ascertained that the potential difference between the anode and the reference electrode was torelably small and then that the current at any definite potential of the mercury cathode was just similarly attained as in the case of Cell-A. The circuit for eliminating this steady current i was now switched on, adjusting the deflection of the galvanometer to the nuIlpoint on the scale. The cathode surface area was now increased at a constant rate dSjdt by switching on S" and the charging-up current was directly measured by G by compensating the part due to the hydrogen electrode reac.tion is, which increases at a constant rate idS/dt, by the capacity C with the potentiometric divider circuit.
The compensation current was adjusted as follows; dS/dt was determined by measuring the time for varying the inclination by a definite amount by a stop watch on one hand and by measuring the associating variation of the height of the mercury meniscus relative to the prism by means of a. cathetometer on the other hand; the latter measurement and the known geometry of the prism gives the increase of the surface area and hence dS/dt. The compensation current is now
i . ~ . t and the potential to be applied to the terminals of G to effect dt
the latter current is now i!!~ -t . R, where R is the internal redt
sistance of G; the latter potential is applied by C adjusting the potentiometric divider circuit by preliminary calculation.
§ 5. Result
(1) Change of current density with time and Jog i-lI-relation.
The current density was found, as stated above, at a fixed potential
-246-

An Investigation of the Mechanism of the Hydrogen Electrode Prucess
of the mercury cathode to decrease or increase asymptotically to a definite value accordingly as the cathode potential was lowered or raised from the former fixed potential, after an initial very large current momentarily increasing or decreasing similarly. Attributing this large current to the charging or discharging of the double-layer, it is possible to determine its capacity by measuring the amounts of electricity charged or discharged, by the throwing angle method using a balistic galvanometer, although the determination was not carried out in the present work.
It was concluded from the above experimental facts that the observed current consists, besides of the charging Or discharging current of the capacity, of the current of the hydrogen evolution and that of mercury dissolution, and that our closed cell of simple geometry favoured the latter side reaction prevailing to attain, at a definite polarisation in the present experiment, to its own equilibrium state, automatically adjusting, along with the time, the mercury ion concentration. The final steady current was taken, in consequence, as that of the genuine hydrogen electrode reaction.
)
o
-/
JO 60~i~_ I I I ___ +-...:.l;.;..0L--...:6-L0 ~2~ I I I ___ +---,J:..:.o,--...:c60:..L:m~:~.1 '01 )h-:S-16 JO ,.It. h~ 16 10 2~ hT$ , .. ..... ,-'"
--) Time
Potential
5witche(i
from 1 = ° to 7 = -143·~V.
~Time
from t = -143.9 mY.
to. t = -210.5 mY •
---* Time
G '--___ .••. H
from
to
..... --"-- ...... ~ 1
t = -210,5 mY. t = -256.4 mY.
A .. :.:: .. _E_ .. ::. ~ .. , .. _K ____ _
'--:. ___ ._B --._~-.,,-M- __ _
from mY.
to ? = -143.9 mY.
to
Tlme +---
... _-
t = 256.4 mY.
h = 210.5 ( mV.
J
Time ~ -.l~ ______ _
from 1 = ~2:t\o'5 L
l¥ ~o 16 hTS .1~ ~o
u I I I --~o 30 ""'" ---I I
Fig. 12 Changes of current density with time, when the potential switched from a definite constant value to another.
-247-

.fournal of the Research Institute for Catalysis
The current density-time relationships thus observed are shown in Fig. 12.
As the cathode was first cathodically polarised by 143.9 m V from zero potential, the current followed the curve A as far as 60 min from the moment of the polarisation. The segment B of the curve shows the current around 24 hrs after the moment of the initial polarization. Forty hours later than the moment, the current was found to assume a value shown by the point C; when the potential was lowered to a new value -210.5 m V, the current varied initially as shown by the curve D, around 24 hrs as E, and then settled after 40 hrs at the point F; when the potential further decreased to a new constant value, -256.4 mY, the current varied similarly as curves G and H. settling again after 40 hrs at I; when the potential was increased to the former value - 210.5 m V, the current suddently decreased even inverting its sign initially and then gradually increased as shown by the curve J, and around 24 hrs as K, settling after 40 hrs at F, i. e. just at the steady value attained previously by lowering the potential stepwise. Curves Land M show the variation of the current as the potential finally switched to the initial value, i. e. - 143.9 m V, reproducing 40 hrs after the switch the point C formerly attained.
Th~ !l.symptotic value of the current at a definite potential was thus quit@ reproducible, irrespective of the history of the cathode potentiAl.
It Wfi,~ found, moreover, that the polarization of the platinum anodefj of Cell-A and Cell-B against the respective reference electrode were always Jess than 6 x 10-' volt at current densities up to 10-' amp in th@ preflent experiments.
The cathodic current density i directly observed is now generally related with the forward and backward current 1 and 1 as
t:=; 1-1 and --.. 'J.P',
i = I (l-e 7R1)
aecordin~ to HomuTI and IKUSLlfAll) and HClHWTI7) where !J is the stoichi
ometric number of the rate-determining step. As the cathode potential r; Wfl.fil Itt lea~t -120.5 m V, the exponential term in the parenthesis is negliJdbl~ Goftlpared with unity, whether ).I be 1 or 2, 1. e. the observed i is prMtically id~p.tical with I or the reverse current 1 is negligible as mfmtiQn@d ip the introduction as proviso with reference to the theoretic",l prediction.
The results obtained by Cell-A at O°C is shown in Fig. 13 and in
-248-
An Investigation of the Mechanism of the Hydrogen Electrode Process
Table 1.
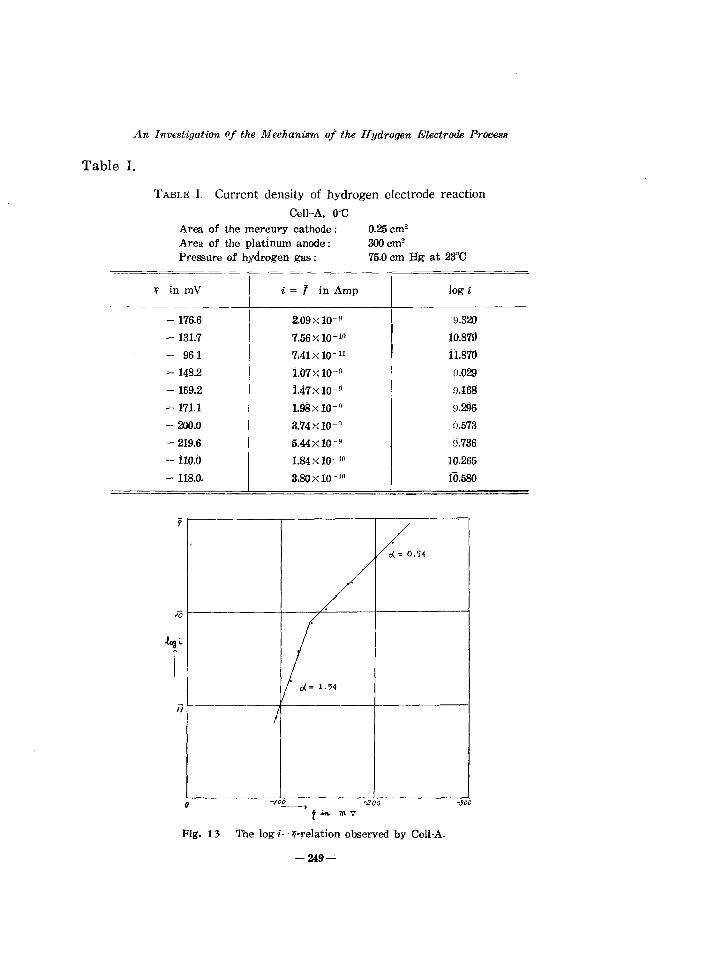
TABLE 1. Current density of hydrogen electrode reaction
Cell-A. ODC
'Y/
0.25cm2
3OOcm2
Area of the mercury cathode; Area of the platinum anode; Pressure of hydrogen gas; 75.0 cm Hg at 23eC
in mV
- 176.6
- 131.7
- 961
- 148.2
- 159.2
~ 171.1
- 200.0
- 219.6
-110.0
- 118.0-
"0
~i.
r 1/
o
i == 1 in Amp
2.09 x 10⁻⁹
7.56 x 10⁻¹⁰
7.41 x 10⁻¹¹
1.07 x 10⁻⁹
1.47 x 10⁻⁹
1.98 x 10⁻⁹
3.74xlO-n
5.44xl0- 9
1.84xlO- 1o
3.80xlO- lO
L.54 /
/
-/00 -------+ -,zoo
t ..... m V
Fig. 13 The log i- 'l-relation observed by Cell-A.
-249-
log i
~).320
10.879
11.870
9.029
0.16S
0.296
fJ.573
9.736
10.265
10.580
-soc
Journal of the Research Institute for Catatlys'is
We see clearly from Fig. 13 that there exists distinctly a break on the log i-r; curve just as previously observed,S) The a value is derived from the parts of the curve at potentials respectively below or above that of the break as 0.54 or 1.54 respectively.
Similar series of experiments have also been carried out with CelI-B before the measurements of charging up currents with similar results as shown in Fig. 14 and Table II.
TABLE II. Current density of hydrogen electrode reaction
Cell-B
Area of the mercury cathode: Area of the platinum anode: Pressure of hydrogen gas:
Temperature r; in mV
- 143.9 - 210.5
- 256.4
- 375.6
- 401.2
- 319.5 O°C - 167.1
- 121.8
- 157.6
- 356.9
- 144.8
- 166.5
- 154.3
- 143.9
- 210.5
- 255.4
- 317.5
- 379.1
- 359.8 12"C - 274.8
- 166.5
- 144.3
- 181.8 - 227.9
- 144.9
- 120.5
-250-
10.5 cm2
100 cm2
75.5 cm Hg at 18°C
i = 1 in amp
1.35x10⁻¹⁰
1.01x 10-0
3.60x10n
7.20 x 10-" 1.09 x 10⁻⁷
1.65 X 10-s
4.22 x 10- 10
0.60 X 10- 10
3.99 X 10- 10
3.70xlO- s
1.64 x 10- 111
4.20 X 10- 10
3.00 X 10⁻¹n
2.24 X 10- 111
1.52x10-"
5.05 X 10-"
3.S0x 10··'
1.36 X 10- 7
6.70x10-S 1.24 X 10-s
8.90 x 10- 111
3.51 x 10- 10
9.34x1O- 111
3.89 X 10-" 3.78 X 10 .. 10
0.70xlO-ll

An Investigation of the Meehani.~m of the Hydrogen Electrode Process
8~----------~-----------4------~?-,rT--
o
9~---------+------~~~----------r-
~~-------~?-~~--------~------------+--
il~~I-------~-----------1------------t--
~ t in mV
--100 -200 -300 -400
Fig. 14 The log i- ;;-relation observed by Cell-B.
The potential of the break at ODC observed with Cell-B is different from that with Cell-A but they are brought to coincidence by taking the difference of the potential of the reference electrode into account,
i. e., by reducing the potential of the former by RT log P II CA where . 2F P
A C
II
PA amI PIJ is the hydrogen pressure and C t and CII is the concentration of hydrogen ion in Cell-A and in Cell-B respectively.
Figs. 13 and 14 show that the experimental results fit exclusively in with the conclusion derived from the electrochemical mechanism stated in the introduction.
(2) Result of the measurement of E~1i-relation.
The observed charging up current divided by the rate dS dt of
-251-

Journal of the Research Institute for Catalysis
increase of the cathode area gives the electricity E, and E divided by electronic charge e gives the number of charges E' required to form unit cathode area, which is shown in Fig. 15.
As shown in the Figure the capacity or the inclination of the curve is smaller at lower electrode potenial and the change from the larger to the smaller inclination occurs just at the "break" of log i-r; curve, in confirmation of the conclusions derived from the electrochemical mechanism mentioned in the introduction. It is concluded that the only possible mechanism of the hydrogen electrode reaction on mercury cathode is the electrochemical.
{O 602~ X/013
0-f ~ e'
t !
1 ---->t Mt 1ll. V
~~----------~rOD------~---~+O-O-----------3+0~O-----
/ / Fig. 15 Electricity required to form unit
cathode area.
-252-
An Inre8tigati'()n of the Mechanism of the Hydrogen Electrode Process
§ 6. Conclusive remarks
(1) Flm~IKDII") objected the authors previous work that platinum colloidal particles formed by the disintegration of the anode may deposit on the mercury cathode surface to mask the genuine hydrogen electrode reaction on mercury.
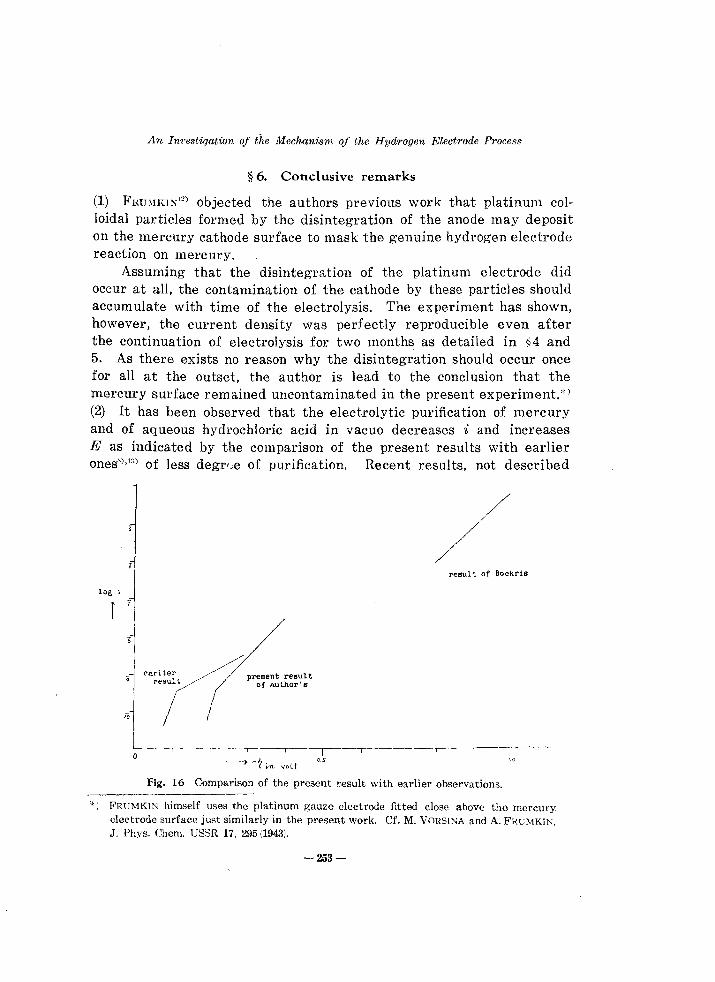
Assuming that the disintegration of the platinum electrode did occur at all, the contamination of the cathode by these particles should accumulate with time of the electrolysis. The experiment has shown, however, the current density was perfectly reproducible even after the continuation of electrolysis for two months as detailed in ~4 and 5. As there exists no reason why the disintegration should occur once for all at the outset, the author is lead to the conclusion that the mercury surface remained uncontaminated in the present experiment.*) (2) It has been observed that the electrolytic purification of mercury and of aqueous hydrochloric acid in vacuo decreases i and increases g as indicated by the comparison of the present results with earlier onesS).l~) of less degr';e of purification. Recent results, not described
resu.l t of Bockris
log I
r 7
o -,-------,--,--r----r---
, 0
Fig. 16 Comparison of the present result with earlier observations.
") FRUMKIN himself uses the platinum gauze electrode fitted close above the mercury electrode surface just similarly in the present work. Cf. M. VORSIJ'.<A and A. FRUMKIJ'.<, J. Phys. Chern. USSR 17. 295 (1943).
-253-
Juurnal fo the Re,~etlrch InHtiillte fOT Catalysis
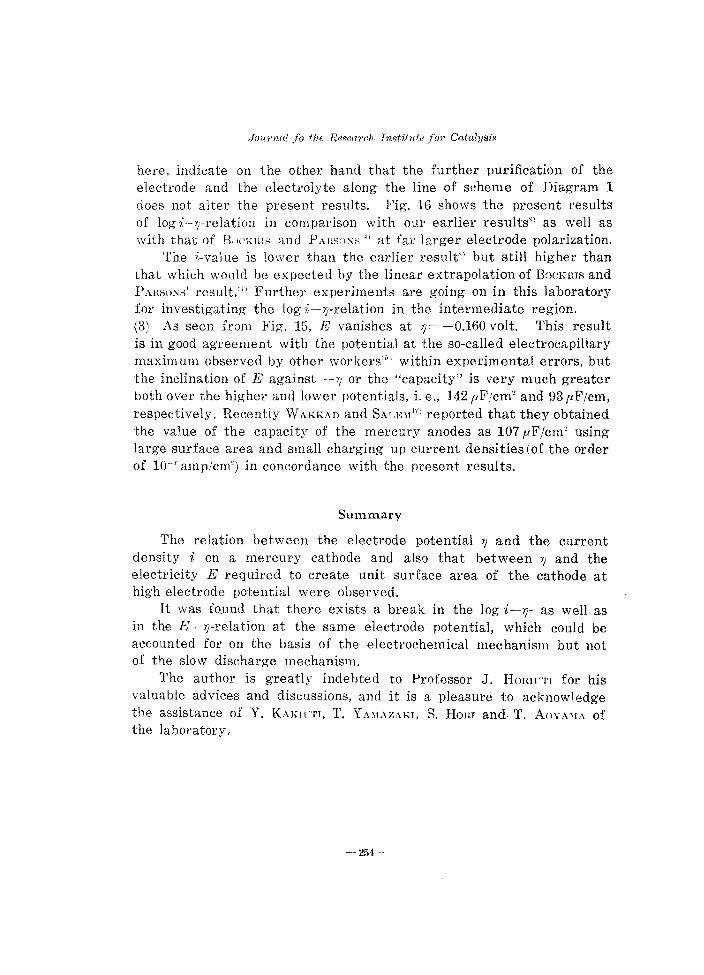
here, indicate on the other hand that the further purification of the electrode and the electrolyte along the line of scheme of Diagram 1 does not alter the present results. Fig. 16 shows the present results of log 1>-lj-relation in comparison with our earlier results') as well as with that of Bili'KIUr-; and PAIlS»);r-;'1l at far larger electrode polarization.
The i-value is lower than the earlier result') but still higher than that which would he expected by the linear extrapolation of BnCKIlIS and p!I.!U,o:\,,,' result.'" Further experiments are going on in this laboratory for investigating the log'i-7J-relation in the intermediate region. (3) As seen from Fig. 15, E vanishes at 7J= -0.160 volt. This result is in good agreement with the potential at the so-called electrocapillary maximum observed by other workers"') within experimental errors, but the inclination of E against --7/ or the "capacity" is very much greater both over the higher and lower potentials, i. e., 142 flF/cm~ and 93 fJF/cm,
respectively. Recently WAKKAD and SALE\I'I) reported that they obtained the value of the capacity of the mercury anodes as 107 pF/cm2 using large surface area and small charging up current densities (of the order of 10--7 amp/cm") in concordance with the present results.
Summary
The relation betweell the electrode potential 7J and the current density i on a mercury cathode and also that between '1 and the electricity E required to create unit surface area of the cathode at high electrode potential were observed.
It was fo.und that there exists a break in the log i-7J- as well as in the B--7J-relation at the same electrode potential, which could be accounted for on the basis of the electrochemical mechanism but not of the slow discharge mechanism.
The author is greatly indebted to Professor J. HOJlwTI for his valuable advices and discussions, and it is a pleasure to acknowledge the assistance of Y. KAKIl'TI, T. YA\lAZAKI, S. HOIlI and. T. AOYA\lA of the laboratory.
-254-
An lnv('stigatioll of the Alecill!nism of the Hydrogen Electrode I'rol;"8.q
References
1) F. P. BOWDE" and E. K RIllEI\I., l'roc. Roy. Soc. A 120, 59 \19281•
2) .J. H'lJmJTl and G. OK,\MOTO, Sci Pctpers lnst Phys. Chern. Research.Tokio 28,
1231 (19361.
3) B. TUl'LEY and H. EYRI"G, J. Chern. Physics 2, 217 (19341•
41 G. OKAMOTO, .T. HORIUTI and K HIROTA, Sci. Papers lnst. Phys. Chf'rn. Research
(Tokio) 29, 223 11936.
5) J. HORlUT!, T. KEIl and K HIROTA, this Journal 2, 1 (1951).
6) J. HOl<IllTl, this Journal 4, 55 !.1951.
7) J. HORl!JTI, this Journal 1, 8 :1948).
8) J. HORmTI and A. MIT1JYA, this Journal 2, 79 (1951 1•
A. MlT{)YA, Bull. lnst. Phys. Chern. Research (Tokio) 19, 142 (1940) (in .Japanese'.
9) E. BRtlMMER und St. VOl, NARAY-SZA.B0, Zeit. Elektrochern. 31, 95 (1925).
]0) A. M. AZZAM,.T. O'M. BO;"·KR1S.-n. E. CONWAY and II. ROSENBERG, Trans. Faraday
Soc. 46, 918 iJ950.l.
11) .1. HORHlTI and M. IKrISHlMA. Proc. Imp. Acad. Tokyo 15, 39 (1939).
12 i A. N. FRUMKIN, Acta Physicochirn. U. S. S. R. 18, 34 (1943).
13) A. MITUYA, T. YAM,ZAKI, S. HORI and T. AOYAM/\, Shokubai (Catalyst), No. 12,
p. 149 (1955) li(l Japanese).
14) J. O'M. BOCKRIS and R. PAHSONS, Trans. Faraday Soc. 45, 916 (1949).
15 i D. C. GRAHAME, R. P. LARSE!': and M. A. P ~)TH, J. Am. Chern. Soc. 71, 2978 (1949).
G. GOtJY, Ann. Phys. 7, (9), 129, (1917).
D. C. GRAHAME, Chern. Rev. 41, 441, 11947).
16) S. E. S. El WAKKAll and T. M. SAr.EM, .T. Chern. Soc. 1489 (1955).
-255-