an investigation of methods to measure and predict
TRANSCRIPT
ENVIRONMENTAL IMPACTRESEARCH PROGRAM
MISCELLANEOUS PAPER EL-91-12
AN INVESTIGATION OF METHODS TO MEASUREAND PREDICT BIOLOGICAL AND PHYSICAL
AD-A236 673 EFFECTS OF COMMERCIAL NAVIGATIONAD-A236 67 TRAFFIC: WORKSHOP II
by
Andrew C. Miller, Barry S. Payne
Environmental Laboratory
DEPARTMENT OF THE ARMYWaterways Experiment Station, Corps of Engineers
3909 Halls Ferry Road, Vicksburg, Mississippi 39180-6199
DTIC
April 1991Final Report
Approved For Public Release; Distribution Unlimited
91-01859SUUU|UIII
Prepared for DEPARTMENT OF THE ARMYUS Army Corps of Engineers
Washington, DC 20314-1000
91 b 11 138

Destroy this report when no longer needed. Do not returnit to the originator.
The findings in this report are not to be construed as an officialDepartment of the Army position unless so designated
by other authorized documents.
The contents of this report are not to be used fcradvertising, publication, or promotional ourposes.
Citation of trade names does not constitute anofficial endorsement or approva! of the use of
such commercial products.
Form ApprovedREPORT DOCUMENTATION PAGE OMB No. 0704-0188
Public reporting burden for this collection of information is estimated to average I hour per response, including the time for reviewing instructions, searching existing data sources.gatheng 9 1nd maintaining the data needed. and completing and reviewing the collection of information. Send comments regarding this burden estimate or any other aspect of thiscolletion of information, including suggestions for reducing this burden, to Washington Headquarters Services, Directorate for information Operations and Reports, 1215 JeffersonDavis Highway. Suite 1204. Arlington. VA 22202-4302. and to the Office of Management and Budget. Paperwork Reduction Project (0704-0188), Washington, DC 20503.
1. AGENCY USE ONLY (Leave blank) I 2. REPORT DATE 3. REPORT TYPE AND DATES COVERED
I April 1991 Final reDort4L TITLE AND SUBTITLE S. FUNDING NUMBERS
An Investigation of Methods to Measure and PredictBiological and Physical Effects of Commercial Navigation
Traffic- Workshon II6. AUTHOR(S)
Andrew C. Miller and Barry S. Payne
7. PERFORMING ORGANIZATION NAME(S) AND ADDRESS(ES) 8. PERFORMING ORGANIZATIONREPORT NUMBER
USAE Waterways Experiment Station, Environmental Labora- Miscellaneous Papertory, 3909 Halls Ferry Road, Vicksburg, MS 39180-6199 EL-91-12
9. SPONSORING/MONITORING AGENCY NAME(S) AND ADDRESS(ES) 10. SPONSORING/MONITORINGAGENCY REPORT NUMBER
US Army Corps of Engineers, Washington, DC 20314-1000
11. SUPPLEMENTARY NOTES
Available from National Technical Information Service, 5285 Port Royal Road,
Springfield, VA 22161
12a. DISTRIBUTION /AVAILABILITY STATEMENT 12b. DISTRIBUTION CODE
Approved for public release; distribution unlimited
13. ABSTRACT (Maximum 200words)
On 17-18 April 1990, a workshop on commercial navigation traffic was held at
the Holiday Inn, Riverfront, in St. Louis, MO. The purpose was to investigate
strategies for measuring and predicting physical and biological effects of com-mercial traffic in inland waterways. The meeting was attended by personnel from
the US Army Engineer Waterways Experiment Station, Headquarters, US Army Corps ofEngineers (HQUSACE), USACE District and Division Offices, the Institute for Water
Resources, the US Fish and Wildlife Service (USFWS), the Tennessee Valley Author-ity, and State Agencies.
The workshop was divided into three sections. Sections I and II dealt with
physical and biological techniques, respectively, to measure and predict the
effects of commercial navigation traffic. Each section was divided into discus-
sions of laboratory studies, field studies, and predictive models. Section IIIconsisted of presentations that dealt with techniques and approaches that have
been used by Districts and the USFWS for analyzing and predicting commercialtraffic effects.
14. SUBJECT TERMS 15. NUMBER OF PAGESCommercial navigation traffic 77
Laboratory simulation 16. PRICE CODEPhysical effects studies
17. SECURITY CLASSIFICATION 18. SECURITY CLASSIFICATION 19. SECURITY CLASSIFICATION 20. LIMITATION OF ABSTRACTOF REPORT OF THIS PAGE OF ABSTRACT
UNCLASSIFIED UNCLASSIFIED I II
NSN 7540-01-280-5500 Standard Form 298 (Rev 2-89)Prescribed by ANSI S d 139-18298-102

PREFACE
In October 1985, the US Army Engineer Waterways Experiment Station (WES)
initiated a multi-year study on the environmental effects of commercial navi-
gation traffic in large waterways. Iis work is part of the Environmental
Impact Research Program (EIRP) at WES. In April 1990, a workshop was held in
St. Louis, MO, to investigate strategies to measure and predict physical and
biological effects of commercial navigation traffic. The workshop was
attended by planners, engineers, and biologists from Corps District and Divi-
sion Offices, Headquarters, US Army Corps of Engineers, the US Fish and Wild-
life Service, the Tennessee Valley Authority, and two State agencies. This
report contains papers presented by attendees and a summary of major findings
of the workshop.
The report was edited by Ms. Janean Shirley of the WES Visual Production
Center, Information Technical Laboratory. Mr. Edwin A. Theriot was Chief,
Aquatic Habitat Group, Environmental Laboratory (EL), WES; Dr. Conrad J. Kirby
was Chief, Environmental Resources Division, EL; Dr. John Harrison was Chief,
EL; and Dr. Roger Saucier was Program Manager of the EIRP during the prepara-
tion of this report.
Commander and Director of WES was COL Larry B. Fulton, EN. Technical
Director was Dr. Robert W. Whalin.
This report should be cited as follows
Miller, A. C., and Payne, B. S. 1991. "An Investigation of Methods toMeasure and Predict Biological and Physical Effects of Commercial Navi-gation Traffic: Workshop II," Miscellaneous Paper EL-91-12, US ArmyEngineer Waterways Experiment Station, Vicksburg, MS.
.U....
" I C. . .
11.I
CONTENTS*
Page
PREFACE ................ ............................. 1
ATTENDEES ................ ............................ 3
AGENDA .............. .. ............................. 5
CONVERSION FACTORS, NON-SI TO SI (METRIC) UNITSOF MEASUREMENT ............... ......................... 7
Purpose of the Workshop ............ ..................... 8
Using Physical Models to Study Navigation-InducedForces ............... ............................. i0**
Demographic Analysis of Populations in Evaluations ofEnvironmental Effects of Navigation Traffic ....... ........... 15
Models for Predicting Impacts of Vessel Passage on Young ofYear Fish and Fish Populations ..... ................. ... 22
Application of Existing Information and Methods to PredictBiological Effects of Vessel Passage ... .............. .. 28
An Overview of LTRMP Long-term Research Strategies for
Navigation Impacts ............. ....................... 35tt
Expert Testimony as a Tool for Documenting Resource Impacts . . . 40t
Kanawha River Larval Fish Distribution and PreliminaryAssessment of Entrainment Risk ..... ................. ... 55tt
A Strategy to Investigate the Environmental Effectsof Commercial Navigation Traffic .... ................ .. 69§
* Papers in this document are based upon oral presentations made during themeeting. The oral presentations, as described in the Agenda (pages 5-6),had the following titles:
** Assessing Vessel-Induced Water Velocity Changes Using Physical Models -
Ms. Sandra Martin, WES.t Assessing Biological Responses with Laboratory and Field Studies -Dr. Barry S. Payne, WES.
tt An Overview of the Long-term Resource Monitoring Plan - Dr. Ken Lubinski,USFWS.Use of Delphi Procedures for Evaluating Commercial Traffic Effects -
Mr. Jerry Rasmussen, USFWS.** Larval Fish Distribution Studies - Mr. Don Hershfeld, CEORH.§ Monitoring Biotic Parameters to Assess Environmental Effects -Dr. Andrew C. Miller, WES.
2
ATTENDEES
Strategies to Measure and Predict Biological and PhysicalEffects of Commercial Navigation Traffic: A Workshop
St. Louis, MO17-18 April 1990
Nani Bhowmik Jon DuyveJonckISWS (IDENR) CENCR-PD-E11 State Water Survey P.O. Box 20042204 Griffith Dr. Clock Tower Bldg.Champaign, IL 61820 Rock Island, IL 61204
Eugene Buglewicz Thomas C. FisherCEUMV-PD-R TVAP.O. Box 80 TVA Evans Bld. 4 EIWVicksburg, MS 39180 Knoxville, TN 37902
Gail Carmody John FurryFWS-RIFO CEORH-PD-B1830 Second Ave. 502 8th StRock Island, IL 61201 Huntington, WV 25701
Joe Cathey David GrierCEORN-ED-E CEWRC-IWR-NPO Box 1070 Casey Bldg.Nashville, TN 37202 Fort Belvoir, VA 22060
Steve Cobb Donald C. HershfeldCELMVD-PD-R CEORH-PD-BBox 80 Huntington District, COEVicksburg, MS 39180 502 8th St.
Mike Cockerill Huntington, WV 25701
CENCR-PD-E Julian HoffmanClock Tower Building, Box 2004 USFWSRock Island, IL 61201 PO Box 1278
Larry Daggett Elkins, WV 26241
CEWES-HR-N Tom KeevinUSAE Waterways Experiment Station CELMS-PD-A3909 Halls Ferry Rd US Army Engineer District,Vicksburg, MS 39180 St. Louis
Robert Delaney 210 Tucker Blvd.
EMTC-FWS St. Louis, MO 63101
Environmental Management George KincaidTechnology Center US Army Engineer District,
575 Lester Ave. HuntingtonOnalaska, WI 54650 502 8th Street
Glenn Drummond Huntington, WV 25701
CECW-EH David LeakeHQUSACE US Army Engineer District,20 Massachusetts Ave., N.W. St. LouisWashington, DC 20314 210 Tucker Blvd.
St. Louis, MO 63101
3

ATTENDEES (Continued)
Ken Lubinski Bernard Schonhoff
USFWs/EMTC Iowa DNR575 Lester Drive RR 3-Box 434
Onalaska, WI 54650 Muscatine, IA 52761
Sandra Martin Terry SiemsenCEWES-HS-L CEORL-PD-C
USAE Waterways Experiment Station PO Box 593909 Halls Ferry Road US Army Engineer District,Vicksburg, MS 39180 Louisville
Andrew Miller Louisville, KY 40201
CEWESER-A Ed Theriot
USAE Waterways Experiment Station CEWES-ER-A3909 Halls Ferry Road USAE Waterways Experiment Station
Vicksburg, MS 39180 3909 Halls Ferry Rd.
Barry Payne Vicksburg, MS 39180
CEWESER-A Richard TippitUSAE Waterways Experiment Station CEORN-ED-E3909 Halls Ferry Road US Army Engineer District,Vicksburg, MS 39180 Nashville
PO Box 1070Mr. Phil Pierce Nashville, TN 37202-1070
CECW- P0
HQUSACE Bob Vanderjack20 Massachusetts Ave., N.W. CENCR-PD-EWashington, DC 20314 US Army Engineer District,
Rock IslandDan Ragland Clock Tower Bldg.CEI4S-PD-ARokIlnL610
US Army Engineer District, Rock Island, IL 61204
St. Louis Daniel Wilcox210 Tucker Blvd. CENCS-PD-ERSt. Louis, MO 63101 US Army Engineer District,
yRasmussen St. PaulJerrysm US Post Office Bldg.
KWS -EMTC St. Paul, MN 55101
575 Lester Ave.
Onalaska, WI 54650 John Wright
Robert Read US Army Engineer Division,Ohio River
WI DNR CEORD-CE-OCP.O. Box 7921 PO Box 1159Madison, WI 53907 550 Main Street
Cincinnati, OH 45201-1159
4

Strategies to Measure and Predict Physical and Biological Effects
of Commercial Navigation Traffic
17-18 April 1990, St. Louis, MO
AGENDA
17 April 1990
0700-0800 Registration
0800-0815 Welcome - Mr. Phil Pierce, OCE
0815-0845 Purpose and Objectives of the Workshop - Dr. Andrew C. Miller, WES
Session I: Physical Effects Studies
0845-0905 Assessing Vessel-Induced Water Velocity Changes Using 2hysicalModels - Ms. Sandra Martin, WES
0905-0925 Measuring Physical Effects of Vessel Passage Using Field Tech-niques - Dr. Nani Bhowmik, IL Water Survey
0925-0945 Use of Hydrodynamic Models for Evaluating Physical Effects ofCommercial Traffic - Dr. Larry Daggett, WES
0945-1000 Discussion
1000-1015 Break
1015-1045 Application of Existing Information and Techniques to PredictPhysical Effects of Vessel Passage - Dr. George Kincaid, CEORH
1015-1200 Panel Discussion I: Strategies for Predicting Physical Effects ofVessel Passage (Bhowmik, Daggett, Kincaid, Martin)
1200-1300 Lunch (on your own)
Session II: Biological Response Studies
1300-1320 Assessing Biological Responses With Laboratory and Field Studies -Dr. Barry S. Payne, WES
1320-1340 Monitoring Biotic Parameters to Assess Environmental Effects -Dr. Andrew C. Miller, WES
1340-1410 Models for Predicting Impacts of Vessel Passage on Young of theYear Fish and Fish Populations - Mr. Dan Wilcox, CENCS
1410-1430 Discussion
1430-1500 Application of Existing Information and Methods to Predict Biolog-ical Effects of Vessel Passage - Mr. Gene Buglewicz, LMV
1500-1530 Break
1530-1545 Panel Discussion II: Strategies for Predicting Biological Effectsof Vessel Passage (Buglewicz, Payne, Tippit, Wilcox)
1700 Adjourn
1930-2100 Break-out SessionTopics: Strategies for Dealing with Recommendations Made by the
44th Environmental Advisory Board Strategies for Eval-uating Traffic Effects - Are There Reasonable Choices?
5

Strategies to Measure and Predict Physical and Biological Effectsof Commercial Navigation Traffic
18 Aoril 1990
0800-0815 Purpose of Day 2 - Dr. Andrew C. Miller, WES
0815-0830 Summary of Break-out SessionsMr. Thomas C. Fisher, TVADr. Robert Delaney, USFWSMr. Bernard Schonhoff, Iowa DNTMr. Richard Tippit, CEORN
Session III: Large-Scale Studies of Traffic Effects
0845-0905 An Overview of the Long-term Resource Monitoring Plan - Dr. KenLubinski, USFWS
0905-0925 An Overview of the Plan of Study - Mr. David Leake, LMS
0925-0945 An Overview of NAVPAT - Mr. Terry Siemsen, ORL
0945-1000 Break
1000-1020 An Overview of Huntington District Studies - Mr. John Furry, CEORH
1020-1040 Larval Fish Distribution Studies, Kanawha River - Mr. DonHershfeld, CEORH
1040-1100 Use of Delphi Procedures for Evaluating Commercial TrafficEffects - Mr. Jerry Rasmussen, USFWS
1040-1100 Discussion
1100-1145 Panel Session III:Rationale for Choosing Specific Approaches for Studying/PredictingCommercial Traffic (Furry, Hershfeld, Leake, Lubinski, Rasmussen,Siemsen)
1145-1200 Concluding Comments - Mr. Phil Pierce, OCE
1200-1330 General Discussion on Dealing with Traffic Effects - All
1330-1430 Lunch (on your own)
1430-1600 Establishing a Task Force to Deal with Commercial Navigation Traf-fic Issues - All
6
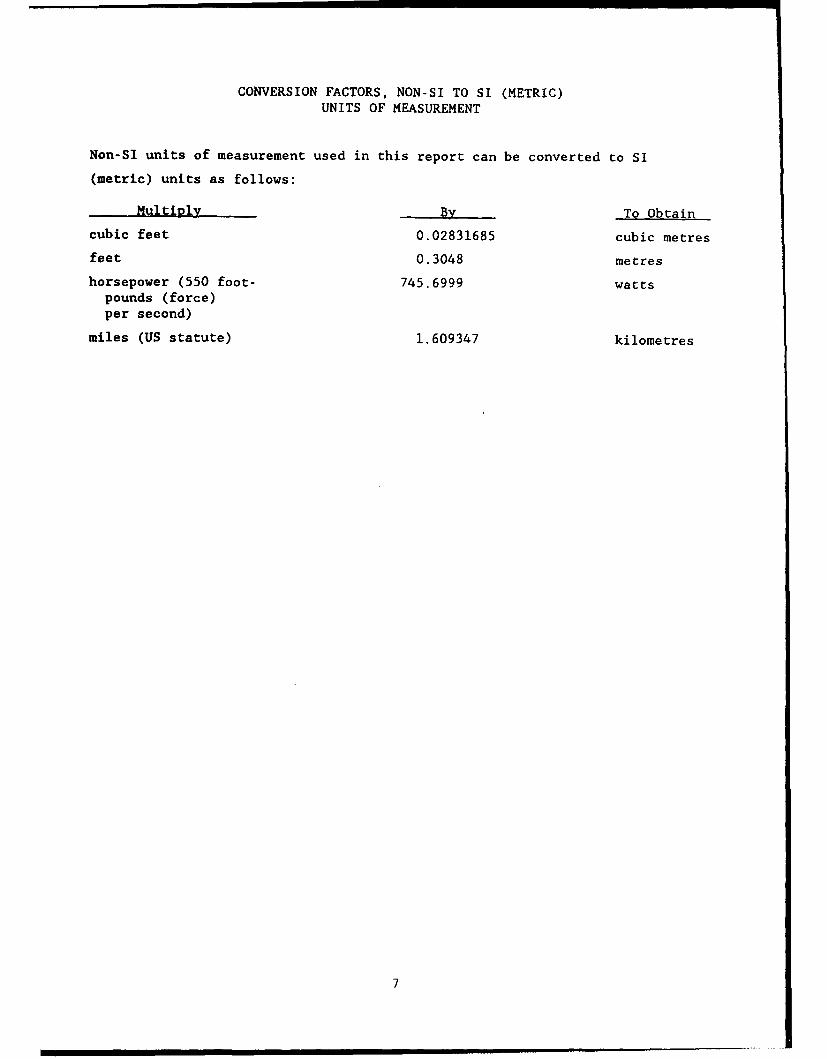
CONVERSION FACTORS, NON-SI TO SI (METRIC)UNITS OF MEASUREMENT
Non-SI units of measurement used in this report can be converted to SI
(metric) units as follows:
Multiply By To Obtain
cubic feet 0.02831685 cubic metres
feet 0.3048 metres
horsepower (550 foot- 745.6999 wattspounds (force)per second)
miles (US statute) 1.609347 kilometres
7

AN INVESTIGATION OF METHODS TO MEASURE AND PREDIC2
BIOLOGICAL AND PHYSICAL EFFECTS OF COMMERCIAL
NAVIGATION TRAFFIC: WORKSHOP II
Purpose of the Workshop
Dr. Andrew C. Miller*
Diverse opinions exist within the US Army Corps of Engineers on the
environmental effects of commercial navigation traffic. Some Corps personnel
appear to believe that traffic has many negative effects that cannot be com-
pensated for, whereas others believe the effects to be minimal. This is
unusual when one considers the tremendous amount of study that has been done
on the environmental effects of commercial traffic. Worse than lack of agree-
ment on navigation effects, few Corps personnel could agree on the best meth-
ods of studying or measuring the biological and physical effects of traffic.
In an effort to remedy some of these problems, a workshop was held to
discuss the most appropriate techniques for measuring and predicting the phys-
ical and biological effects of commercial navigation traffic. Agreement on
these issues must be reached if Corps personnel and others are to evaluate the
effects of existing levels of traffic, and to predict the effects of future,
increased traffic levels. This workshop was attended by biologists and plan-
ners within the Corps, the US Fish and Wildlife Service, and State agencies
that have the responsibility to deal with environmental problems on major
inland waterways. This report contains papers submitted by some of the
speakers who made presentations at the workshop. In selected cases, the title
of the submitted paper differed from the title of the oral presentation. Both
titles are given in the Table of Contents.
Studies are being conducted at the US Army Engineer Waterways Experiment
Station to determine the best procedures to measure biological effects of
commercial navigation traffic. These studies are providing quantitative data
on the effects of commercial traffic on important biotic resources. These
data will assist personnel in the Corps and other agencies who deal with
effects of commercial navigation traffic. Considerable time and funds will be
* US Army Engineer Waterways Experiment Station, Vicksburg, MS.
8

saved if resource and construction agencies cease conducting poorly designed
studies that deal superficially with cause and effect. Well-designed studies
that yield quantitative data are needed. Planners and biologists will then be
able to concentrate on issues that need attention. This will improve the
credibility of studies conducted by State and Federal agencies and, most
important, will increase the likelihood that significant resources along
waterways will be protected.
9

Using Physical Models to Study Navigation-Induced Forces
Sandra Martin and Steve Maynord*
Introduction
On the inland waterways of the United States, particularly on the upper
Mississippi and Ohio River systems, determination of the physical forces that
result from navigation are complicated by the diverse flow and channel condi-
tions and by the variability of vessels found on the rivers. Physical models
have been and continue to be an effective means of bridging the gap between
the difficult and sometimes impossible task of measurinig these forces in the
natural environment and the increasing need to predict how these forces will
ultimately affect the environment. This discussion will be devoted to the
advantages and limitations of using large physical models; that is, those
reduced at most to a 1:25 scale, to evaluate the physical forces produced by
commercial tows in confined channels and navigable rivers.
Advantages of Physical Models
The most important advantage of a physical model is that it can provide
insight and understanding of flow patterns caused by vessel motion. From the
"bank" of the model, the observer can get a panoramic view of the vessel-
induced flow phenomena, such as bow waves and return currents, and simulta-
neously the passing vessel's effects on shoreline water levels. Visualization
techniques such as dye injection, plastic beads, confetti, and underwater
photography can be used in a model to easily demonstrate water currents and
sediment motion. Observation of flow patterns in scale models is not inhib-
it6d by adverse wind conditions, passing vessels, and turbid water.
Another major advantage is the control that can be obtained in the
model. All parameters can be held constant except for the variable of inter-
est. That is, climatic conditions such as wind, passing vessels, geometric
variability, flow conditions, etc. can be monitored, at will, to suit the
study needs. This is virtually impossible under field conditions.
* Both authors are Research Hydraulic Engineers, US Army Engineer Waterways
Experiment Station, Vicksburg, MS.
10
Finally, results of navigation-induced conditions can be easily mea-
sured, particularly water levels and velocities. With the advent of new
instrumentation such as the laser Doppler velocimeter we will be able to
improve the measurements obtained in the model.
Limitations of Physical Models
There are two primary limitations to physical modeling - one regarding
similarity laws and the other regarding cost. To overcome the first limita-
tion, it is extremely important that physical model results are verified with
prototype data. This is due to the fact that scale effects can be experienced
with regard to friction, quantification of sediments, and tow-power relation-
ships, even when using relatively large models. To obtain highly accurate
results, especially considering the scale of these models, the initial con-
struction, instrumentation, and testing of these models can be expensive.
However, once a comprehensive flume has been constructed, modifications and
additional tests can be performed with little expense.
Applying Physical Models to Navigation Studies
Physical models can bp used to address the following specific concerns
regarding navigation effects:
a. Physical forces near/beneath vessel. Prototype measurement ofthe forces near or below the vessel can be difficult. Sincethe parameters such as the propeller type (open wheel or kortnozzle), the channel geometry, vessel speed, tow type, etc.,can be controlled in the physical model, the model can evalu-ate the effects of these parameters on the velocities andstrength of the wake flow, the width of the propeller jetattack, and other phenomena occurring near or beneath thevessel.
b. Return velocity distribution. The physical model can be usedto evaluate the effect of various tow positions, operatingconditions, barge configurations, and channel geometries onreturn currents.
C. Backwater and side channel analysis. Physical models can beused to evaluate navigation effects on backwaters and sidechannels. This area is one in which a high potential existsto improve our understanding of physical processes. Either asite-specific or a generic backwater area could be modeledwith and without tow traffic to formulate analytical descrip-tions of the sediment-flow interactions in these areas.
1i

. Evaluation of the ambient velocity effects. All existingnumerical models of physical forces add and/or substract theambient river velocities from the tow-induced velocities. Itis extremely important, and completely conceivable, to vali-date this assumption in a physical model where tows can be runupbound, downbound, and in variable river currents, includingslack waters.
e. Physical forces at high flows/stages. An important advantageof physical models is the ability to reproduce catastrophic orunusual flow conditions that are either impossible to measurein the prototype or for which historical data are not avail-able. Consequently, much can be gained by reproducing extremeriverine conditions and evaluating the navigation-inducedforces that occur under these conditions.
Accomplishments Using Physical Models
Many studies have been done abroad that investigated the forces around
vessels using physical models. They have addressed problems or reproduced
conditions specific to the objectives of those studies. For example, they
have evaluated large ship traffic in confined channels, translatory waves in
locks, limiting vessel speed, squat, etc. In general, the European work has
been primarily applicable to small channels, whereas the studies that have
been conducted at the US Army Engineer Waterways Experiment Station (WES) have
attempted to address problems more related to the towboat traffic and the type
of conditions found in the upper Mississippi and Ohio River systems.
The flow conditions produced near and beneath a towboat are complex and
three-dimensional. These flow conditions are affected by physical conditions
such as the shape and size of the vessel, its horsepower and propeller type,
the channel shape and size, the ambient current, the speed of the vessel, etc.
Physical model studies conducted at WES have demonstrated how the bow wave,
drawdown, displacement flows, propeller jets, etc., relate to the physical
parameters.
In work conducted by WES for the Louisville District, flow visualization
and velocities measured beneath the vessel in a 1:20-scale model have shown
that prop jets are not the only mechanism that caused increases in turbulence
intensity and velocities*. Other mechanisms that have a significant effect on
* Maynord, S. 1990. "Velocities Induced by Commercial Navigation," Techni-cal Report HL-90-15, US Army Engineer Waterways Experiment Station,Vicksburg, MS.
12

the flow beneath the vessel include bow wave, displacement flows, and wake
flows. Physical model studies have produced analytical relationships based on
the empirical data described, at least one-dimensionally, by some of these
mechanisms.
Many European studies have been conducted regarding return currents in
"confined" channels. These studies have produced several analytical equations
for the calculation of these currents and have shown, intuitively, that the
strength of these currents diminishes with the width of the channel. Return
velocity distributions have been studied at WES at three different model
scales, 1:35, 1:70, and 1:120. Observations in the field have indicated,
however, that return currents may be of significant magnitude in much wider
channels than those that have been studied in the laboratory.
Several studies have been conducted at WES that address navigation-
induced forces by taking measurements of the water level changes and veloci-
ties near and beneath the vessel. These studies have primarily been devoted
to towboat waves and drawdown as they are related to slope stability and rip-
rap protection. Bank protection was evaluated for the Tennessee-Tombigbee
project,* the new Gallipolis lock approach, and the Point Marion Lock approach
at 1:20, 1:25, and 1:15 scales, respectively. The Technical Report entitled
"Riprap Protection on Navigable Waterways"** contains both general and site-
specific results of studies addressing the effects of navigation on channel
bottom stability. Although these studies provide useful and much-needed
information regarding the effects of towboat traffic, there is still much left
to accomplish, especially regarding environmental concerns on the upper Mis-
sissippi River.
Conclusions
In order to measure and predict the impacts of commercial traffic on
both the physical and biological environment, it is vital not only to under-
stand and quantify the physical forces created by the vessel, but also to
* Maynord, S., and Oswalt, N. 1986. "Riprap Stability and Navigation Tests
for the Divide-Cut Section Tennessee-Tombigbee Waterway," Technical ReportHL-86-3, US Army Engineer Waterways Experiment Station, Vicksburg, MS.
** Maynord, S. 1984. "Riprap Protection on Navigable Waterways," TechnicalReport HL-84-3, US Army Engineer Waterways Experiment Station, Vicksburg,MS.
13

determine how these forces interact with river currents, sedimentation, and
biological resources. Physical models can be extremely useful tools when
evaluating the phenomena associated with tow-induced forces and their effects
on the riverine environment in which they operate. Data obtained from the
model can provide direct answers to specific questions regarding currents and
sediment movement, produce empirical data for the development of numerical
algorithms for use in mathematical models, and identify potential sites for
prototype testing.
14
Demograohic Analysis of Populations in Evaluations of
Environmental Effects of Navigation Traffic
Barry S. Payne*
Background
Measurements of population condition are applicable to analysis of eco-
logical consequences of commercial navigation traffic. These direct biologi-
cal assessments lead to inferential evaluation of aquatic habitats (e.g.,
Payne, Bingham, and Miller (1989), Payne et al. (1989)) and both contrast with
and complement habitat-based evaluations such as the US Fish and Wildlife
Habitat Evaluation Procedures and the Instream Flow Incremental Methodology.
Such habitat-based methods directly assess habitat and lead to inferential
evaluation of specific biological populations. Both population- and habitat-
based assessment methods can be used for pragmatic and quantitative environ-
mental analysis.
The condition of any population is determined by the net result of
recruitment, growth, and mortality of individuals. Recruitment, growth, and
mortality can be assessed by measuring the relative abundance of individuals
of different sizes (and ages). Such assessments of size demography have been
the basis of a highly quantitative and fruitful line of pure and applied stud-
ies of aquatic animal life histories (e.g., Russell Hunter (1953), Fremling
(1960)) and, more recently, production (e.g., Ivlev (1966), Waters (1969),
Hunter (1975), McMahon (1975)). The practicality and established scientific
credibility of such direct biological assessments make them useful in applied
studies such as efforts to determine the effects of commercial navigation
traffic in large inland waterways.
An Example of Mussel Habitat Condition in the Lower Ohio River as Assessed
from Population Size Demography of the Ebony Shell Mussel
The ebony shell, Fusconaia ebena, is the dominant mussel of mainstream
shoals in the lower Ohio River (Miller, Payne, and Siemsen 1986). Mainstream
* Environmental Laboratory, US Army Engineer Waterways Experiment Station,Vicksburg, MS.
15

river shoals are the principal habitat of F. ebena and most species of fresh-
water unionid mussels. Unionids are a natural resource of commercial, ecolog-
ical, and aesthetic value, and 25 species are on the Federal List of
Endangered Species. Protection of riverine mussels and their habitat is an
important concern of the Corps and natural resource management agencies.
Demographically complete censuses have rarely been made of unionid popu-
lations in mainstream river shoals (Miller and Payne 1988) despite great
attention that is focused on preservation of these animals. Unique among
freshwater bivalves, large, thick-shelled unionids that have adapted to life
in river shoals combine a long reproductive life with high reproductive output
each year (Coker et al. 1921; Chamberlain 1931; Burky 1983). Annual variation
in recruitment success is often a critical aspect of the dynamics of popula-
tions with such life history features. The condition of a mussel bed cannot
be adequately assessed without quantitative information on recruitment (Miller
and Payne 1988).
Methods and Description of Study Area
The mussel bed studied is located in the lower Ohio River downstream of
Lock and Dam 53, the downstreammost impoundment of the Ohio River (Miller,
Payne, and Siemsen 1986). This mussel bed is approximately 5 km in length and
occurs on the channel border adjacent to the Ohio River navigation channel.
Fusconala ebena is the dominant mussel in this bed, comprising approximately
two-thirds of the total community. The size demography of this dominant popu-
lation was assessed during each of the 3 years as part of a long-term monitor-
ing study of this mussel bed (Payne and Miller 1989). Replicate quantitative
samples of substrate were collected in the fall of 1983, 1985, and 1987 by
divers equipped with scuba and sieved to obtain all mussels regardless of
size. The shell length (SL) of each mussel was measured, and SL frequency
histograms were plotted.
Results and Discussion
Seventy-one percent of all F. ebena collected in 1983 belonged to a
single cohort of 1981 recruits with an average SL of 16 mm (range 13 to 20 mm)
(Figure 1). By the fall of 1985 this cohort had increased in average SL to
30 mm (range 23 to 38 mm), and still comprised 71 percent of the total
16

population of F. ebena. Continued linear growth of this cohort led to an
average SL of 47 mm in late September 1987 (range 36 to 56 mm), and relative
abundance of the cohort remained high (74 percent). The sustained high rela-
tive abundance of this cohort was reflected in its low mortality from 1983 to
1987, plus the lack of any extensive new recruitment of younger cohorts during
that period (minor recent recruitment was indicated in the results of the 1987
sample) (Figure 1).
Much concern exists that increased frequencies of navigation traffic in
inland waterways will deleteriously affect mussels via increased turbulence
and resuspension of bottom sediments. This population of F. ebena in the
lower Ohio River has existed for decades (Williams 1969) in a shoal bordering
the commercial navigation lane. Data summarized in Figure 1 clearly demon-
strate that annual recruitment success is the principal determinant of the
abundance of mussels in this shoal. Studies are continuing to determine what
environmental factors were responsible for the exceptionally strong recruit-
ment noted in 1981. Nonetheless, it is highly improbable that a unique condi-
tion of navigation traffic in the lower Ohio River in 1981 accounted for
recruitment in that year at orders of magnitude greater than in other years
from 1981-1987. Survival of the 1981 recruits has been high despite the prox-
imity of this shoal to a major commercial navigation lane.
The continued existence of most unionids in large inland rivers depends
on protection of remaining beds and stable shoals from destruction by impound-
ment, dredging, or sustained degradation of water quality as well as preven-
tion of overharvesting of commercially exploited mussel beds. Assessments of
the health of remaining mussel beds must be based on long-term quantitative
studies of recruitment, growth, and survival of cohorts of dominant popula-
tions. Periodic assessment of size demography of F. ebena in the lower Ohio
River (Figure 1) demonstrates how such measurements can allow quantification
of recruitment, growth, and mortality rates.
Guidance on Assessment of Population Size Demography
Assessment of population size demography is straightforward, typically
relying on construction and interpretation of size frequency histograms. Size
frequency histograms are constructed by: (a) sampling a large number of indi-
viduals (required sample sizes will be discussed in the next section) essen-
tially without bias due to variation in the size of individuals, (b) measuring
17

the size of each individual (typically a length measurement is taken),
(c) sorting individuals into size class intervals, and (d) determining the
frequency of occurrence of individuals per size class. The histogram is then
plotted and inspected to determine how many distinct size groups (cohorts) are
present.
A critical choice is the number of class intervals to be used. The
number of class intervals that should be used is proportional to the number of
individuals in the sample and the precision and accuracy of individual size
measurements. However, no rule exists to determine the appropriate number of
class intervals. Final choice can depend on preliminary analysis of several
plots using different-sized class intervals. In general, 25 to 50 class
intervals are appropriate for most applications based on moderately large
samples (50 to 200 individuals).
Both sample size and the number of size classes used to construct size
frequency histograms directly affect interpretation of population size struc-
ture (Figure 2). Figure 2a presents a shell length (SL) frequency histogram
constructed for an unusually large sample (n - 2,272) of the Asiatic clam
Corbicula fluminea from the lower Ohio River. For such enormous samples, the
limits for size class intervals are determined by measurement accuracy and
precision rather than sample size. Calipers were used to measure SL to the
nearest 0.1 mm (measurement precision). Despite such precise measurement of
SL, repeated measurements of single clams indicated that accuracy of SL mea-
surement was approximately.0.5 mm. Based on this accuracy, and the need to
rapidly process a high number of large samples, SL was recorded to the nearest
1.0 mm (caliper measurements could be quickly read to the nearest 1.0 mm or,
at a far slower pace, to the nearest 0.1 mm). Clams ranged in SL from 6 to
33 mm (sampling method did not collect clams < 4 mm). Thus, a total of
28 class intervals were used to determine the relative abundance of individ-
uals by size class (Figure 2a). Five cohorts were evident, although two of
these (cohorts III and IV) were especially abundant and one (cohort I) was
rare.
The SL frequency histogram plotted using the same class interval size
(1.0 mm) but a moderately large sample (n - 214) (Figure 2b) revealed the same
size demography with one exception. A few individuals (n - 3) from cohort I
were included in the sample of 214 clams, but this rare cohort could not be
distinguished in the moderately large sample. Forty-eight individuals of
cohort I were included in the exceptionally large sample on which Figure 2a
18

was based. Adjacent cohorts often cannot be distinguished if fewer than
20 individuals per cohort are included in the population sample. In addition,
reduced growth rate of larger and older animals can create difficulty. For
example, the largest and oldest cohorts (I, II) in Figure 2a are more closely
spaced than are the smallest and youngest cohorts (III, IV, and V). The old-
est cohorts in exceptionally long-lived populations (such as some riverine
mussels that live 10 to 20 years) typically cannot be distinguished in a size
frequency histogram even when each cohort is adequately represented (i.e.,
> 20 individuals) in the population sample).
A second SL frequency histogram was constructed for the moderately large
sample of Corbicula fluminea in the lower Ohio River to demonstrate informa-
tion loss resulting from use of too few size class intervals (Figure 2c). The
same SL data sorted into 1.0-mm class intervals for Figure 2b was sorted into
2.0-mm intervals (reducing the number of size classes in half) for Figure 2c.
Cohorts II and V were not distinguishable in this coarse-grained analysis,
although the two dominant cohorts (III and IV) were still distinguishable.
Use of fewer than 20 class intervals is appropriate for small samples
(< 30 individuals). Such small samples and coarse-grained analysis are ade-
quate for basic aspects of population size demography (e.g., general informa-
tion on total size range of individuals and identification of especially
abundant size classes). The finest details of size demography of a population
may be revealed only by exceptionally large samples and fine-grained analysis.
Huge numbers of individuals of dominant macroinvertebrate populations are
routinely obtained in samples of exceptionally dense populations, and such
samples can be used for extremely detailed description of size demography
(e.g., Figure 2a). However, moderately large samples will reveal most impor-
tant aspects of discernible population size structure (Figure 2b).
Discussion
Measurement of population size demography is a direct method of biologi-
cal assessment that can be used for inferential evaluation of aquatic habitat
conditions. Especially when particular animals are of high interest and abun-
dant (such as mussels in the lower Ohio River), direct assessments are a prac-
tical and highly quantitative method of environmental analysis. Furthermore,
basic quantitative information on population conditions and life history that
19

result from such direct assessment of size demography provide important base-
line information relevant to future environmental evaluations.
The studies exemplified herein of Fusconaia ebena involved repetitive
assessments over a number of years, but important information can also be
gained from single date assessments. The first assessment of the size demo-
graphy F. ebena in the lower Ohio River (1983 in Figure 1) revealed the most
important characteristic of this population -- namely, a single cohort of
recent recruits dominates these long-lived mussels. Subsequent monitoring was
conducted for growth and mortality evaluations of this dominant year class.
Quantitative assessments of size demography of dominant macroinverte-
brate populations can be accomplished with no more effort and expense than is
typically spent on descriptive characterization of macroinvertebrate communi-
ties. Such general community characterizations are a common component of
aquatic environmental evaluations. It is noteworthy that accurate information
on species relative abundance, richness, diversity, and evenness can be pro-
vided as part of studies of the size demography of dominant populations (e.g.,
Miller and Payne 1988; Payne, Bingham, and Miller 1989).
Assessments at the population level of biological organization are espe-
cially valuable in applied studies. Biological effects of man's activities in
aquatic habitats can also be assessed at the organismal or community (groups
of co-occurring populations) levels of organization. Studies at the individ-
ual level often lack ecological relevance without confirmation of effects at
the population or community level. For example, mortality of individual
organisms often has no discernible effect due to compensatory responses in
population dynamics. Community level studies, although of clear ecological
relevance, are greatly hindered by the prevalence of locally uncommon species
in nearly all natural communities. This makes completely accurate sampling of
communities (especially with replication) practically impossible Accurate
and replicated sampling of dominant populations is much more feasible. Not
surprisingly, the most convincing conclusions of many community studies are
those based on analysis of responses of dominant species. As demonstrated
herein, size (and age) structure are among the most important and practical
measurements that can be made of dominant populations.
20

References
Burky, A. J. 1983. "Physiological Ecology of Freshwater Bivalves," The Mol-lusca (Volume 6): Ecology. W. D. Russell-Hunter, ed., Academic Press,Orlando, FL.
Chamberlain, T. K. 1931. "Annual Growth of Freshwater Mussels," Bulletin ofthe U.S. Bureau of Fisheries, Vol 46, pp 713-739.
Coker, R. E., Shira, A. F., Clark, H. W., and Trygstad, P. M. 1921. "NaturalHistory and Propagation of Fresh-water Mussels," Bulletin of the U.S. Bureauof Fisheries, Vol 37, pp 75-182.
Fremling, C. 0. 1960. "Biology and Possible Control of Nuisance Caddisfliesof the Upper Mississippi River," Iowa State University Research Bulletin,Vol 483, pp 856-879.
Hunter, R. D. 1975. "Growth, Fecundity, and Bioenergetics in Three Popula-tions of Lymnaea palustris in Upstate New York," Ecology. Vol 56, pp 50-63.
Ivlev, V. S. 1966. "The Biological Productivity of Waters," Journal of theFisheries Research Board of Canada. Vol 23, pp 1727-1759.
McMahon, R. F. 1983. "Physiological Ecology of Freshwater Pulmonates," TheMollusca (Volume 6): Ecology, W. D. Russell-Hunter, ed., Academic Press,Orlando, FL.
Miller, A. C., and Payne, B. S. 1988. "The Need for Quantitative Sampling toCharacterize Size Demography and Density of Freshwater Mussel Communities,"American Malacological Bulletin, Vol 6, pp 49-54.
Miller, A. C., Payne, B. S., and Siemsen, T. S. 1986. "Description of Habi-tat of the Endangered Mussel Plethobasus cooperianus," Nautilus, Vol 100,pp 14-18.
Payne, B. S., Bingham, C. R., and Miller, A. C. 1989. "Life History and Pro-duction of Dominant Insects on Stone Dikes in the Lower Mississippi River,"Lower Mississippi River Environmental Program Report 18, Mississippi RiverCommission, Vicksburg, MS.
Payne, B. S., and Miller, A. C. 1989. "Growth and Survival of RecentRecruits to a Population of Fusconaia ebena (Bivalvia: Unionidae) in theLower Ohio River," American Midland Naturalist, Vol 121, pp 99-104.
Payne, B. S., Miller, A. C., Hartfield, P. D., and McMahon, R. F. 1989."Variation in Size Demography of Lotic Populations of Corbicula fluminea (Mul-ler)," Nautilus, Vol 103, pp 78-82.
Russell Hunter, W. 1953. "On the Growth of the Freshwater Limpet, Ancylusfluviatilis Muller," Proceedings of the Zoological Society of London, Vol 123,pp 623-636.
Waters, T. F. 1969. "The Turnover Ratio in Production Ecology of FreshwaterInvertebrates," American Naturalist, Vol 103, pp 173-185.
Williams, J. C. 1969. "Mussel Fishery Investigations, Tennessee, Ohio, andGreen Rivers," US Fish and Wildlife Service and Kentucky Department of Fishand Wildlife Resources, Frankfort, KY.
21
Models for Predicting Impacts of Vessel Passage
on Young of Year Fish and Fish Populations
Daniel B. Wilcox*
Introduction
Commercial vessel traffic may have a significant effect on fish eggs,
larvae, and juveniles that occur in navigation channels. Entrainment of young
of year (YOY) fish in commercial vessel propeller flow appears to expose
organisms to lethal hydraulic forces. The impact of entrainment losses of YOY
fish can be realized at the population level, and in forage production fore-
gone. The impact mechanism is similar to the entrainment and loss of fish at
steam-electric power plants. Some of the approaches to quantifying the impact
of powerplant entrainment on fish populations have application to assessing
the impact of commercial vessel traffic. Some of the basic modeling
approaches used in powerplant entrainment impact assessment are described.
Application of these modeling techniques to assessing commercial vessel
impacts will require interagency agreement on approach, and considerable
effort to refine model parameters to limit uncertainty in results.
Impact Mechanism
Fish eggs, larvae, and juveniles occur in large numbers in the naviga-
tion channels of waterways. Their species composition, life stage, density,
temporal occurrence, and position in the channel cross section are quite vari-
able. This variability is influenced by the phenology of fish reproduction,
the reproductive strategies of different fish species, the hydrology of the
river, and the behavior of young fish.
Towboats entrain large volumes of water in propeller flow. This volume
has been initially estimated using a scale physical model, to be about twice
the propeller area times the distance travelled.** Shear, acceleration, pres-
sure change, and direct impingement can kill young fish (Marcy, Beck, and
* US Army Engineer Distcict, St. Paul, St. Paul, MN.** Personal communication, 1990, Stephen Maynord, Fishery Biologist, US Army
Engineer Waterways Station, Vicksburg, MS.
22
Ulanowicz 1978). Velocities in excess of 3 m/sec in the propeller flow of
commercial vessels generate shear, acceleration, and pressure changes that
appear to be of sufficient magnitude to kill fish eggs and larvae (Academy of
Natural Sciences of Philadelphia 1980; Killgore, Miller, and Conley 1987).
Entrainment losses of YOY fish can result in reduced recruitment and
decline of populations. This impact is realized at the population level if
entrainment losses exceed the compensatory reserve of the population (the
ability of a population to offset increases in mortality). Reductions in
populations of sport and commercial fish species translate to fishing opportu-
nity denied, and associated economic loss (Goodyear 1988).
Entrainment losses of YOY fish also reduce available forage. Entrain-
ment losses of forage fish can result in reduced numbers and biomass of forage
fish and may affect growth of survivors. Reduced abundance of forage fish can
affect populations of piscivorous fishes and birds.
Approach to Impact Assessment
The impact of vessel entrainment is analogous to entrainment of fish at
powerplants. Modeling approaches used to assess powerplant entrainment
impacts (Schubel and Marcy 1978) have application to assessing the impact of
vessel entrainment impacts.
Estimating Entrainment Losses
First, entrainment losses can be estimated using an algebraic equation
that incorporates pumping rate, entrainment mortality, river volume, and an
estimate of natural mortality (Englert and Boreman 1988). In more complex
systems, empirical transport models have been developed to incorporate hydro-
dynamic detail, age of fish, and temporal and spatial distribution of fish
(Boreman and Goodyear 1988). The objective is to model the percent reduction
(PR) of yearling fish numbers due to entrainment losses:
PR = 100 (Yo - Y(1)
Y0 is the number of age-O fish surviving to become yearlings without
the impact, and Yp is the number of age-O fish surviving to yearlings with
23
impact. The PR has also been called conditional entrainment mortality rate
(Boreman, Goodyear, and Christensen 1981). The conditional entrainment mor-
tality rate is defined as the fractional reduction in year-class strength due
to entrainment if other sources of mortality are density-independent.
Entrainment mortality can be conservatively assumed to be 100 percent.
Ignoring potential entrainment survival, however, can lead to an overestimate
of entrainment impacts on fish populations. Refinements of towboat entrain-
ment mortality rate could be accomplished by the same methods used to estimate
powerplant entrainment mortality: field prototype experiment, laboratory
simulation with a scale physical model, or numerical hydraulic modeling to
estimate magnitude of hydraulic forces coupled with laboratory assays to
determine survival. Experimantal design must be carefully controlled in tests
using live fish to determine entrainment mortality to attain statistically
supported results (Vaughan and Kumar 1981).
Estimating population-level impact
The impact of entrainment losses on fish populations can be estimated
with considerable confidence if sufficient information exists about the
affected population. Unfortunatel"-, most stocks of fish in inland waterways
have not been assessed and there are few fish population statistics to use for
impact assessment.
Lacking population statistics, an indirect method can be used in which
the numbers of eggs, larvae, and juveniles entrained are converted to an esti-
mate of the number of adult fish that would have been produced had entrainment
mortality not occurred (Horst 1975). A number of refinements of this approach
have been developed to assess powerplant impacts. This general approach %as
come to be known as the "equivalent adults" or "eggs per recruit" method. If
the entrained stage is an egg, the estimate of the number of adults lost is
calculated as:
N, = SgNe = (2/F)N. (2)
where
N. - number of adults
Sa - survival from egg to adult
N. - number of eggs entrained
24

2 - number of adults needed to be produced by a breeding pair to main-tain a stable population
F - total lifetime fecundity of a female based on generation time (g)of the population and the average fecundity
Estimates of survival from entrained age to adult and fecundity esti-
mates are gleaned from the fisheries literature. Refinements to this modeling
approach have included sensitivity analyses of the input variables, improved
statistical treatment of input data, and measures to account for biological
compensation.
Estimating production foregone
Entrainment loss impacts on the forage base can be estimated by estimat-
ing production (body mass produced by a population over a period of time)
foregone (Rago 1984). This direct approach is based on exponential mortality
and growth. An indirect method, based on exponential mortality and the von
Bertalanffy growth equation, can be used to provide a more complete assessment
of production foregone (Jensen, Reider, and Kovalak 1988).
Information Requirements and Predictive Value
An assessment of entrainment impacts requires modeling of entrainment
losses and population-level impact. There is a high degree of uncertainty in
entrainment impact modeling because there is a high degree of uncertainty in
estimation of many model parameters. There have been only initial efforts to
quantify vessel-induced entrainment impacts at the population level, and con-
siderable information is required.
Predictive value increases with increased certainty of results. A
tiered impact assessment approach may be appropriate, where conservative esti-
mates are used throughout, to provide a relatively certain order-of-magnitude
prediction of impact. If initial conservative predictions indicate minimal
impact for certain river reaches, further investigation may not be warranted.
Sensitivity analyses of models to be applied in impact assessment should be
conducted to determine input variables where effort to quantitatively refine
the variable estimates would pay off in increases in certainty of results.
25

References
Academy of Natural Sciences of Philadelphia. 1980. "Analysis of the Effectof Tow Traffic on Biological Components of the Ohio River," US Army EngineerDistrict, Huntington, WV.
Boreman, J., and Goodyear, C. P. 1988. "Estimates of Entrainment Mortalityfor Striped Bass and Other Fish Species Inhabiting the Hudson River," AmericanFisheries Society Monograph. Vol 4, pp 152-160.
Boreman, J., Goodyear, C. P., and Christensen, S. W. 1981. "An EmpiricalMethodology for Estimating Entrainment Losses at Power Plants Sited on Estuar-ies," Transactions of the American Fisheries Society, Vol 110, pp 225-262.
Englert, T. L., and Boreman, J. 1988. "Historical Review of EntrainmentImpact Estimates and the Factors Influencing Them," American Fisheries SocietyMonograph, Vol 4, pp 152-160.
Goodyear, C. P. 1988. "Implications of Power Plant Mortality for Managementof the Hudson River Striped Bass Fishery," American Fisheries Society Mono-graph. Vol 4, pp 152-160.
Horst, T. J. 1975. "The Assessment of Impact Due to Entrainment of Ichthyo-plankton," Fisheries and Energy Production, a Symposium," S. B. Saila, ed.,D. C. Heath and Company, Lexington, MA.
Jensen, A. L., Reider, R. H., and Kovalak, W. P. 1988. "Estimation of Pro-duction Foregone," North American Journal of Fisheries Management, Vol 8,pp 191-198.
Killgore, K. J., Miller, A. C., and Conley, K. C. 1987. "Effects of Turbu-lence on Yolk-Sac Larvae of Paddlefish," Transactions of the American Fisher-ies Society, Vol 116, No. 4, pp 670-673.
Marcy, B. C., Jr., Beck, A. D., and Ulanowicz, R. E. 1978. "Effects andImpacts of Physical Stress on Entrained Organisms, Power Plant Entrainment: ABiological Assessment, J. R. Schubel and B. C. Marcy, Jr., eds., AcademicPress, New York.
Rago, P. J. 1984. "Production Foregone: An Alternative Method for Assessingthe Consequences of Fish Entrainment and Impingement at Power Plants," Ecolog-ical Modeling, Vol 24, pp 79-111.
Schubel, J. R., and Marcy, B. C., Jr. 1978. Power Plant Entrainment: ABiological Assessment, Academic Press, New York.
Vaughan, D. S., and Kumar, K. D. 1981. "Detectability and Precision of Esti-mates of Entrainment Mortality of Ichthyoplankton," Environmental SciencesDivision Publication No. 1683, Oak Ridge National Laboratory, oak Ridge, TN.
27
Application of Existing Information and Methods to
Predict Biological Effects of Vessel Passage
Eugene Buglewicz*
Background
The Corps of Engineers, by the nature of its work, precipitates deci-
sions. The Corps and other water resource construction agencies follow a
rigorous set of guidance to assess biological effects of vessel passage. The
purpose of this paper is to put into perspective those sometimes conflicting
and contradictory aspects of providing reasonable evaluations of navigation
traffic impacts and the "real world approach," the implications for future
planning efforts.
The intent is not to reiterate the Planning Principles and Guidelines,**
but rather to explain some of the key definitions and procedures that govern
to a large extent how the Corps evaluates projects, and relate them to our
current planning process. We in the Corps work under specific rules and regu-
lations. We must have the proper authorities to carry out our activities,
while being consistent with the requirements of law and the policies of our
organization.
"Economic and Environmental Principles and Guidelines for Water and
Related Land Resources Implementation Studies," or "Principles and Guide-
lines," as they are more commonly called, were developed to guide the formula-
tion and evaluation studies of the major Federal water resources development
agencies. The other Federal agencies include the Bureau of Reclamation, Ten-
nessee Valley Authority, and the Soil Conservation Service. The Principles
and Guidelines have their foundation in law, Section 103 of the Water
Resources Planning Act, Public Law 89-90, and Executive Order 11747. The
Principles portion of the document was approved by the President in February
1983, and the Chairman of the Water Resources Council approved the Standards
and Procedures in March of 1983. If you take careful note of the booklet, it
is divided into two major sections. The Principles are a relatively short
* US Army Engineer Division, Lower Mississippi Valley.
** Water Resources Council. 1983. "Economic and Environmental Principlesand Guidelines for Water and Related Land Resources Implementation
Studies," Washington, DC.
28
statement of economic and environmental principles in which the Federal objec-
tive is defined. The Standards begin on page 1, and constitute the detailed
procedures we must follow in our plan formulation process.
The second publication is called the "Planning Guidance Notebook."* The
notebook is also known in the Corps of Engineers as ER 1105-2-100, and has
been in draft form since May of 1989. This publication incorporates the
requirements of the "Principles and Guidelines" as well as the changes that
have occurred in the planning process as a result of the passage of the Water
Resources Development Act of 1986.
The other document that impacts our planning to a great extent is the
National Environmental Policy Act, or NEPA. The "Principles and Guidelines"
incorporate NEPA requirements, which are incorporated into our ER 1105-2-100.
Thus, by following our guidance, any project should be in compliance with the
Principles and Guidelines, NEPA, and our policy guidance.
As you know, the Corps of Engineers uses a two-phase planning process,
the first phase called reconnaissance, and the second phase called the feasi-
bility phase. Each phase requires different levels of information. Both
phases depend on one another, and in fact, the first phase, reconnaissance, is
perhaps the most important, and is the one I will spend more time on today.
It is important because decisions made during reconnaissance are going to
determine success or lack of success during the feasibility phase. Second,
the allowed time frames for accomplishing reconnaissance and our budgeting
process demand that you begin to make decisions about the feasibility phase
even before the reconnaissance phase has begun. How that problem is to be
handled and how that is going to relate to the need for navigation traffic
impact information is of vital concern to us here today.
The purpose of a reconnaissance phase study is to determine whether or
not there is a Federal project for which we should proceed to the more
detailed feasibility phase. In reconnaissance, there must be a preliminary
determination of the presence and general location of significant resources
within the study area, and the likely effects of project alternatives on those
significant environmental resources. The reconnaissance study will require a
thorough discussion of potential mitigation measures and possibly a determina-
tion of the type of NEPA document that will be required. The reconnaissance
* US Army Corps of Engineers. "Planning Guidance Notebook," Engineer Regula-
tion 1105-2-100, Draft Regulation, Washington, DC.
29

report must contain a scope of work to conduct fish and wildlife surveys,
studies or analyses proposed for the feasibility phase. Since the reconnais-
sance phase is constrained to a 12-month time period, there will be precious
little time to do much, if any, field analysis. Therefore, letters to
appropriate resource agencies and interested publics, site visits, and possi-
bly some minor surveys will be possible in the study area. During reconnais-
sance, the project biologist is basically constrained to using available
information. In the case of large navigation projects, there is a possibility
that the reconnaissance phase may be extended to a longer period of time (with
permission from Headquarters), but the most we should plan for is 6 additional
months. During reconnaissance, the Corps planner must look ahead to feasibil-
ity, because in feasibility the planning process demands a NEPA document and
justified mitigation requirements for the recommended plan and all alterna-
tives that entered into the final array. During reconnaissance, Corps biolo-
gists are going to have to rely on their ability to foresee resource problems.
When the topic is navigation, and impacts result from vessel traffic, scopes
of work will have to be carefully designed to answer specific resource ques-
tions that surface during reconnaissance.
Our guidance provides definitions we should be conversant with. They
are important because they narrow our focus to deal with important resource
questions and provide an indication how and where we should be anticipating
mitigation requirements. These important definitions are:
Significant - A situation that is likely to have a material bearing onthe decision-making process.
Significant resource - A national form, process, or system that isidentified based on institutional, public, andtechnical recognition.
Significant effect - A situation in which estimates of future with- andwithout-plan conditions of the resource aredifferent.
Study area - For NEPA purposes, and by definition, the area over whichthere are potential impacts.
Mitigation - A commonly misunderstood word but one that includes:
a Avoiding an impact.
0 Minimizing an impact.
. Rectifying an impact by repairing, rehabilitation, orrestoring, reducing, or eliminating, and impact bypreservation or maintenance through the life of theproject.
30

• Compensation through replacement (in-kind) or substitu-tion (out-of-kind) but at least equal in value and sig-nificance to lost resources or environments.
" Mitigation measure - An action or feature of a mitiga-tion project.
Our guidance provides us some tests in which we can determine
significance.
a. The significance of fish and wildlife resources shall be basedupon both their monetary and non-monetary (environmental qual-ity) values. Both monetary and non-monetary values shall beidentified and clearly described.
b. Monetary value shall be based upon the contribution theresource makes to the nation's economy.
p. Non-monetary value shall be based on technical, institutional,and public recognition of the ecological attributes of thefish and wildlife resources in the study area.
d. Criteria for determining significance shall include, but notbe limited to, the scarcity or uniqueness of the resource fromnational, regional, state, and local perspectives.
e. Non-monetary values associated with fish and wildliferesources are subjective, and depend on the value societyplaces on them. Differing values and concerns shall be docu-mented, including the rationale used to select values chosento determine resource significance.
. Lastly, our guidance provides a methodology to determine thosevalues:
The monetary and non-monetary values associated with fish andwildlife resources arise primarily from the quantity and qual-
ity of the habitat within the study area. Therefore, habitat-based evaluation methodologies, supplemented with production.user-day. population census, or other similar informationshall be used to describe and evaluate fish and wildliferesources and impacts associated with alternative plans.
It is clear what our guidance requires in the analysis of significant
resources. A good planner will focus on quantity and quality of habitat. The
first tool any waterway study must have available to it is some type of habi-
tat description. The lower Mississippi River, for instance, is essentially an
uncontrolled river with river stage varying 30 ft* and more on an annual
basis. Habitats are described such that an area may change habitat type based
on river stage. It is a physically based habitat system, a most useful and
reliable habitat system using the physical characteristics of the aquatic
• A table of factors for converting non-SI units of measurement to SI
(metric) units is presented on page 7.
31

system such as water depth, substrate, current velocity, relative volume, and
so on.
The second tool is data on biological resources collected by habitat
type. There must be reliable information on the biological resources in the
habitats in order to determine if alternative plans have any impacts. If
resource information is not available, studies must be designed to collect it
during feasibility.
Biological information is very difficult to recover in a short period of
time. Field studies are labor intensive and usually must be carried out over
a period greater than 1 year. Assuming a 3-year period for carrying out the
feasibility phase, assuming the "real-world budgetary delays," and the need to
produce draft and final reports by the end of 3 years, practically speaking, a
planner will have a maximum of 2 years to conduct field work on any particular
waterway. The opportunity to have all the population and habitat information
at hand to make project alternative evaluations and mitigation recommendations
is limited.
Mathematical models can be used to compare relative environmental
impacts of alternatives. Math models, or any mathematical representation of
biological, physical, or habitat systems, are based on assumptions which are
translated into equations or curves that attempt to describe some process or
relationship. Mathematical models can translate a collection of hypotheses
into representations of the system we are attempting to describe. Some models
can be used to describe current conditions, while others may be used to pre-
dict future conditions. When choosing a model for alternative plan assess-
ments, however, there are some cautions that must be exercised:
a. The user must understand the problem being researched, andmust be able to describe it.
b. The assumptions on which the model is built must be based onknowledge of the system.
c. The user must be able to describe the major components of thesystem.
d. There should be a describable relationship between major com-ponents of the system, and
e. The user must be able to specify the output of the model.
Guidance requires that habitat quality and quantity determine impacts.
If the result of our analysis cannot be expressed in some type of habitat
descriptor, other methods of dealing with impacts will have to be found. In
32
the case of navigation traffic impacts, there is no off-the-shelf model that
can be used to deal with multiple waterway resource problems.
We can, however, deal with vessel impact analysis. Vessel impact analy-
sis depends on two preconditions:
A. The waterway must be categorized by habitat. Our guidancedemands it and justification of mitigation measures requireit.
I. Resource components of each habitat and the importance of the
habitat to that resource component must be documented.
If this information is not available, each District should set out in a
systematic way to collect it, and collect it in advance of the normal planning
sequence, before decisions have to be made, and in time periods which are
acceptable for collecting biological systems information. Methods that can be
used to supplement basic habitat delineation and significant resource compo-
nents information include:
a. Resource-specific studies. These should be conducted duringthe feasibility phase to investigate specific impacts. Thesestudies are designed to answer problem-oriented questions.Field and laboratory investigations are appropriate.
b. Resource-specific models. Models are employed to understandinterrelationships between and among habitats and resources.Models can test one variable at a time to help us understandour observations. Models can assist in designing field andlaboratory studies.
c. Evaluation of new methods and technology. Test and evaluatenew technology for responsiveness to study requirements.
d. Use good judgment. Evaluate the results of the informationgained through field and laboratory experiment, through modelapplication, and based on the resource base and habitatsaffected. Does it make sense?
All biological evaluation methods have their strong points and use
assumptions based on our understanding of how ecological systems work. Corps
biologists must be able to use these tools effectively and efficiently, par-
ticularly in the project planning phase when time is minimal and decisions
must be made early on which affect the success of our planning effort. Bio-
logical assessment in the reconnaissance phase must be based on current data
and sound biological principles, recognizing the requirements of law, policy,
and organizational guidance.
The first step in assessing navigation vessel movement impacts is to
develop a habitat classification of the waterway. The initiation of the
reconnaissance phase is too late to begin to plan to develop a habitat
33

classification; it is too late to begin characterizing the significant
resources of the waterway. Corps biologists must be cognizant of the require-
ments of our planning guidance and anticipate the information needs before the
planning process begins. Habitat classification and characterization of the
significant resources in those habitats must be available at the initiation of
the reconnaissance phase if the biological analysis is to evaluate project
alternatives and mitigation requirements in the short time periods available
during the planning process.
34

An Overview of LTRMP Long-term Research Strategies for
Navigation Impacts
Kenneth S. Lubinski*
Introduction
The Long-term Resource Monitoring Program (LTRMP) for the upper Missis-
sippi River System (UMRS) was authorized under the Water Resources Development
Act of 1986. It provides many of the research functions for a larger program
known as the Environmental Management Program (EMP). The LTRMP is funded
through the US Army Corps of Engineers and was implemented by the Environmen-
tal Management Technical Center, a unit of the US Fish and Wildlife Service.
The LTRMP has the following objectives (Rasmussen and Wlosinski 1988):**
a. Analyze and recommend solutions to significant resource prob-lems such as sedimentation, navigation, and water level fluc-tuat'c impacts.
b. Monitor selected habitats and species.
c. Develop data management systems and techniques to assist deci-sion makers in managing the UMRS.
Information needed to describe and explain navigation impacts on the
UMRS is generated under two LTRMP program elements: Trend Analysis and Prob-
lem Analysis. Information for evaluating methods to restore impacted areas is
provided by a separate network of habitat rehabilitation (i.e., backwater
dredging, island creation) projects funded under the EMP.
Trend analysis emphasizes the documentation of spatial and temporal
patterns of resource components and problems. Six field stations, located to
represent floodplain reaches that differ in geomorphology, land use, and
anthropogenic influence, provide data related to water and sediment quality,
vegetation, and the river's fishery. A major effort under trend analysis
includes the use of a Geographic Information System to classify the UMRS into
areas that are characterized by different levels of selected physical or
* US Fish and Wildlife Service, Environmental Management Technical Center,
575 Lester Drive, Onalaska, WI.** Rasmussen, J. L., and Wlosinski, J. H. 1988. "Operating Plan of the Long
Term Resource Monitoring Program for the Upper Mississippi River System."US Fish and Wildlife Service, Environmental Management Technical Center,La Crosse, WI.
35
biological variables. Classification templates are used to spatially extrapo-
late from the point data collected at field stations to system-wide area
coverages. Problem analysis focuses on the measurement and modeling of
impacts. Before the selection and funding of specific studies under problem
analysis could begin, it was necessary to develop a mechanism for identifying
necessary research products. This has been expedited by formalizing impacts
hypotheses and outlining a research strategy for each hypothesis.
Strategy Development
The Operating Plan for the LTRMP (Rasmussen and Wlosinski 1988)* listed
work tasks that must be accomplished for the successful completion of the
program. Based on these tasks, a series of impact hypotheses related to com-
mercial navigation were developed. Examples of impact hypotheses are:
a. Single commercial traffic events produce short-term changes inturbulence, velocity, shear stress, waves, drawdown, suspendedsolids, and turbidity in channel and channel border habitats.
b. Single commercial traffic events increase ichthyoplanktonmortality in channel and channel border habitats.
C. Commercial traffic events cause an increase in the movement ofsediment into sidechannels and backwaters.
Hypotheses are designed to define "packages" of research information
that can be completed as individual work units. Each hypothesis includes an
explicit description of the spatial level (i.e., system-wide, selected river
reach, local habitat area) at which the hypothesis is to be tested. When
necessary, the time period of interest is described. Short-term physical
changes, for instance, may last only 2-5 min, while habitat losses due to
navigation-related movement of sediment into side channels or backwaters may
occur over a period of decades.
Hypotheses identify specific variables to be investigated. This permits
the linkage of physical impacts with consequent biological impacts. Measure-
ments of short-term physical changes associated with traffic events are, as a
result, not only used to test the physical impact hypothesis, but also to
guide subsequent biological impact experiments.
* Rasmussen, J. L., and Wlosinski, J. H. 1988. "Operating Plan of the LongTerm Resource Monitoring Program for the Upper Mississippi River System,"US Fish and Wildlife Service, Environmental Management Technical Center,La Crosse, WI.
36
The research strategy for each hypothesis includes three lines of
inquiry: studies of cause-and-effect relationships; mapping of impact areas;
and evaluations of potential solutions. Many of the steps listed under these
lines of inquiry (Table 1) are common to most hypotheses being tested. The
steps focus on research products needed to comprehensively test a hypothesis.
Steps to study cause-and-effect relationships also assist in distin-
guishing necessary research products from those that are supplemental. Thus a
completed strategy provides a means of prioritizing studies during periods of
limited funds.
The most important step in the early phase of this line of inquiry is
the construction of a well-defined conceptual impact model. The conceptual
impact model (Figure 1) concisely delineates the relationships that require
quantification. The model also identifies impact mechanisms. The distinction
of impacts caused by separate mechanisms is necessary for assessing impact
differences among spatial areas. For instance, the impact model in Figure I
permits the assumption that jet flow and waves provide different contributions
to suspended solids concentrations in different habitat categories.
Mapping of impact areas is necessary to determine when and where defined
impact levels occur on the UMRS. Data describing spatial and temporal pat-
terns of selected resource components within the LTRMP Trend Analysis river
reaches are generated at field stations. When data from other river reaches
are needed, special mapping or spatial extrapolation exercises are
implemented.
Mapping steps are facilitated using a Geographic Information System. A
variety of spatial products (i.e., elevation, aquatic areas, and land use
templates) are being constructed to act as base maps for the identification of
problem areas.
An important element for the successful completion of both cause-effect
studies and impact mapping is the coordinated definition of impact categories
among the Federal and State agencies that will use the data to make management
decisions. Coordination meetings are held early in the hypothesis testing
schedule for this purpose.
Evaluations of potential impact solutions will require a substantial
database and impact models that permit the comparison of reasonable "what-if"
scenarios. As a result, comprehensive evaluations are scheduled to be com-
pleted late in the program. However, lists of potential management alterna-
tives that could reduce or minimize impacts will be produced as early as
37
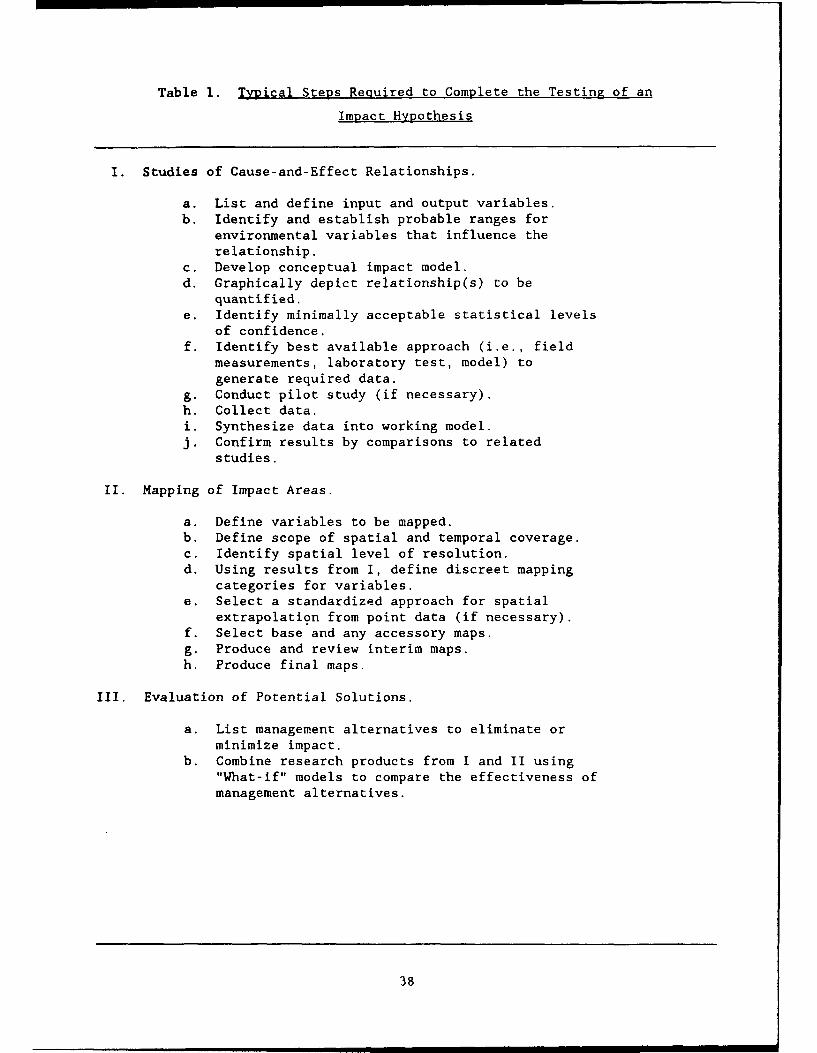
Table 1. Typical Steps Required to Complete the Testing of an
Impact Hypothesis
I. Studies of Cause-and-Effect Relationships.
a. List and define input and output variables.b. Identify and establish probable ranges for
environmental variables that influence therelationship.
c. Develop conceptual impact model.d. Graphically depict relationship(s) to be
quantified.e. Identify minimally acceptable statistical levels
of confidence.f. Identify best available approach (i.e., field
measurements, laboratory test, model) togenerate required data.
g. Conduct pilot study (if necessary).h. Collect data.i. Synthesize data into working model.j. Confirm results by comparisons to related
studies.
II. Mapping of Impact Areas.
a. Define variables to be mapped.b. Define scope of spatial and temporal coverage.c. Identify spatial level of resolution.d. Using results from I, define discreet mapping
categories for variables.e. Select a standardized approach for spatial
extrapolation from point data (if necessary).f. Select base and any accessory maps.g. Produce and review interim maps.h. Produce final maps.
III. Evaluation of Potential Solutions.
a. List management alternatives to eliminate orminimize impact.
b. Combine research products from I and II using"What-if" models to compare the effectiveness ofmanagement alternatives.
38

CAUSATIVEAGENT MECHANISM TARGET
LEVEL 1 SINGLE EVENT - PROP.JET SHEAR STRESS
LEVEL 2 SHEAR STRESS - SPINNING EGG MORTALITY
LEVEL 3 EGG MORTALITY ANNUAL -STANDING STOCK
RECRUITMENT
Figure 1. Conceptual impact model for the'hypothesis that singletraffic events produce short-term changes in targetvariables (water velocity, shear stress, turbulence,turbidity, etc.)
possible to allow extensive discussion of the alternatives within the scien-
tific, social, and political communities.
Summary
The LTRMP focuses on current and future commercial navigation impacts to
natural resources of the UMRS. Research products needed to complete work
tasks identified in the program's Operating Plan are being identified and
prioritized through a process of formalizing hypotheses and research strate-
gies. Research strategies include studies of cause-and-effect relationships,
mapping of impact areas, and evaluations of problem solutions.
39
Expert Testimony as a Tool for Documenting Resource Impacts
Jerry L. Rasmussen*
Introduction
Use of expert testimony and scientific opinion as resource management or
planning tools can be very effective and efficient if properly executed.
Expert testimony is not the preferred problem-resolving technique of most
resource managers, but time and funding constraints often force them to take
that option. Most people would agree that actual data collection and scien-
tific documentation of facts are preferred alternatives.
However, once the decision is made to resolve a problem through expert
testimony it is imperative that the process and decision points be well docu-
mented, much as they would be in any scientific analysis or evaluation.
Expert testimony was used on the upper Mississippi River on numerous
occasions during the 1980's (See References Section). The process used was
similar to one commonly referred to as the "Delphi Process." But since tech-
niques used on the upper Mississippi were developed independently of the
Delphi Process, the two will not be compared here.
The remainder of this paper will describe five phases of the expert
testimony process used on the upper Mississippi.
Phase I - Problem Evaluation
Phase II - Organization of Panels
Phase III - Conduct of Panels
Phase IV - Panel Operations
Phase V - Report Preparation
Problem Evaluation
Winston Churchill once said, "A well-defined problem is half solved."
That statement holds true for expert testimony as it does for most of life.
Care taken to define the limits of a problem pays large dividends in Cime and
resources saved later.
* Environmental Management Technical Center, US Fish & Wildlife Service,
575 Lester Avenue, Onalaska, WI 54650.
40

Once a problem is well-defined, "information needs" can be easily iden-
tified through a literature evaluation. It is important here that the so-
called gray literature not be overlooked. There is no need to reinvent the
wheel, and it is foolish to assume that no one else has ever before confronted
the problem at hand, or some facet of it.
Unfortunately, a great volume of scientific data, especially biological
data, is buried in files and unpublished documents. This doesn't mean that
these data are of no value; most often it simply means that no one has had the
time or money to complete the lengthy and expensive formal publication and
peer review process. If necessary, the expert testimony process can be used
to help validate important gray literature.
Once all existing information has been retrieved, it must be summarized
to separate what is known from what is not known. This ensures that data gaps
are clearly identified. Data gaps may be extensive and require prioritiza-
tion. Prioritization further refines and defines the problem, and assists in
scoping subsequent efforts.
Organization of Panels
Before proceeding with panel organization, it is important to review
budget constraints. A good rule of thumb is that "everything costs more than
it costs." Consequently, budget analyses are important and usually dictate
the number of data gaps which can actually be addressed.
A review of procedures, guidelines, and avenues available for payment of
panel participants is important. There may be mechanisms available to cut
costs through cooperative agreements or simple money transfers. In the Fish
and Wildlife Service, college and university personnel can often be reached
through significantly reduced overhead charges. On the other hand, there may
be some experts who are simply not available due to administrative problems or
lack of willingness to participate on panels that may end up in court or dis-
qualify them for future work.
Once all constraints are identified, guidelines (i.e., per diem rates,
labor rates, etc.) should be developed for payment to participants. This
further assists in budget evaluation and assessment of the number of data gaps
to be addressed by proposed panels.
The next step is to develop guidelines for panel conduct. Decisions
need to be made as to whether the panels will be allowed to run themselves
41

under a self-elected chairman or whether a chairman or facilitator will be
provided by the sponsoring agency. Experts do not always agree, so voting or
minority statement procedures must be worked out. Also, the question of per-
mitting or not permitting observers and agency participation must be worked
out to the satisfaction of all participating sponsors.
Once these procedures are established and documented, a prioritized list
of topics for panel review should be developed. A single data gap may need to
be broken down into several topics, and each topic may require a separate
expertise. For instance, evaluation of towboat traffic effects on fish popu-
lations includes the topics of physical forces in the water column, on the
shoreline, and on the biota. Effects on the biota include the topics of fish
eggs and larvae, invertebrates, and aquatic vegetation. Inclusion of a sepa-
rate expertise for each of these topics and subtopics will result in a very
large panel.
This leads to the task of identifying "critical" expertise. Panel suc-
cess depends on having all the necessary expertise available. In the case of
the evaluation of towboat traffic effects on fish, the panel would have to
include at least the critical expertise of hydraulic engineers and fisheries
biologists.
Once the required expertise is identified, procedures must be developed
for participant selection. The selection process should be similar to that
used by most employers to hire new employees, and it must be well documented.
It is critical that selections be unbiased, since panel products, and panel
members themselves, could end up in court. Selection criteria should include
at least a ranking by education, background, and experience.
Once a list of potential panel members is developed, informational let-
ters inviting participation are sent to all candidates stating the deadline
for application. Each candidate then has the opportunity to apply. When the
deadline for application passes, applicants are ranked and panel members and
alternates selected. It is important to have a list of qualified alternates
in case some unforeseen emergency prevents participation of one or more mem-
bers. However, if an alternate is used, that person permanently replaces
(rather than stands in for) the original member. All candidates are then
notified of final selections.
42

Conduct of Panels
Locations and dates for panel meetings must be set as far in advance as
possible. Generally, scientists called on as experts are very busy, and it
can be difficult to coordinate all their schedules. Depending on the complex-
ity of the problem, more than one panel meeting may be required, and each
meeting may last one to several days.
A panel moderator must be selected or appointed to be in charge of meet-
ing proceedings. It is generally advisable to hire the services of a profes-
sional facilitator. This enhances panel credibility by eliminating any
built-in bias that an agency or sponsor facilitator may bring to the panel.
It also frees sponsoring personnel to concentrate on th. content rather than
the conduct of the meetings.
It may be necessary to record meeting proceedings verbatim, especially
if future court action is anticipated. In the later case, it is best to hire
a professional court recorder.
Thirty to sixty days before the panel convenes, pre-panel discussion
materials need to be prepared and distributed to all members. These materials
should include any of the sponsor's assumptions or preliminary conclusions
pertinent to the problem, detailed descriptions of data gaps, lists of
resources of concern, copies of any scientilic articles pertinent to the
problem which members may not otherwise have access to, pertinent agency docu-
ments, maps, etc.
Panel members should be asked to review pre-panel materials and submit a
2-3 page report on the panel topic, 1-2 weeks before the panel is to convene.
Copies of all member reviews and the meeting agenda should be distributed to
panel members a few days before the meeting.
Panel Operations
The facilitator should open the meeting with introductions, and then
quickly have each member provide a brief oral presentation of his pre-panel
report. This will "break the ice" and help establish baseline knowledge and
relationships between panel participants early on, getting the meeting off to
a quick start. Panels are expensive and time should not be wasted by a
lengthy "getting-acquainted" period.
43

The meeting should then move quickly into discussions of generic impact
relationships between the action or project proposed and the resources being
evaluated. These discussions help better define resources of concern and set
the scope for further panel action. Time should not be wasted discussing
resources which the panel feels are unimpacted or of trivial importance.
Instead, critical resources and significant impact relationships should be
defined or described to the extent possible.
This may be the end point for the first panel meeting if a complex issue
such as navigation impacts is the panel topic. Simpler topics could be
expected to proceed further or to be concluded in one meeting.
Panel discussions (either at the continuing meeting or at the next meet-
ing) then lead into interactions between the specific project or action in
question and the resources of concern. This tailors generic impact relation-
ships and assessment to specific projects or actions being evaluated. If
impacts are considered significant, the panel should be led into a discussion
of possible avoidance mechanisms or mitigation techniques. The panel should
apply impact assessment to both pre- and post-project conditions.
This could also be the end point of the meeting unless the project or
action being evaluated is complex and has impacts beyond the immediate project
area. In the case of navigation impact evaluation, another meeting may be
necessary to apply impact/mitigation information system wide.
At the conclusion of each panel session the facilitator should orally
summarize panel conclusions and recommendations. This may stimulate some
additional discussion, but it is imperative to good communications and con-
sensus building. Before the panel adjourns, a general understanding and con-
sensus must be reached on what the panel report is expected to present.
Report Preparation
Either the sponsor or the facilitator can prepare the written abstract
and summary of findings. Both meeting notes and verbatim transcripts will be
helpful in preparing these documents.
The draft abstract and summary of findings are then circulated to panel
members for review and comment. Depending on the magnitude of comment and
controversy, this may be an iterative process requiring one or more additional
drafts.
44
When all comments have been adequately addressed, the final abstract and
summary of findings are prepared and approved by panel members. A panel
roster should be transmitted with all documents and a space provided for mem-
ber signatures. Signatures on the documents enhance credibility of panel
findings.
Final documents are then distributed through appropriate channels, and
panel products are used as reference documents for further project
evaluations.
Summary
As alluded to earlier, the expert panel process described here has been
used successfully and to the satisfaction of numerous State and Federal agen-
cies on the upper Mississippi River. Expert opinion formed the bisis for
decisions made to recommend and fund a major environmental program on that
river.
Actual panel topics addressed by those panels and panel membership
rosters are displayed on the pages that follow. It should be noted in these
displays that expert or impact panels take many forms depending on the com-
plexity of the issues or topics at hand. For example in the case of the upper
Mississippi River System (UMRS) Master Plan Impact Panels, large, iterative
inter-disciplinary panels were used; and in others, resource professionals
were mixed with laymen and met for a single meeting (i.e., the UMRS Master
Plan Expert Panel on Commercial Fish and Fishing).
In conclusion, the use of expert testimony on the upper Mississippi has
a proven track record. The process described here should work elsewhere and
be equally effective for other issues and impact evaluations to build scien-
tific documentation and consensus when time and funds do not allow for lengthy
data collection and study.
45
References
Bade, G. 1981. Summary Proceedings, Environmental Work Team MitigationPanel. Comprehensive Master Plan for the Management of the Upper MississippiRiver System. Report to Upper Mississippi River Basin Commission for UMRSMaster Plan, US Fish and Wildlife Service, Rock Island, IL.
PANEL MEMBERS
Gerry Bade, Coordinator/Facilitator, US Fish and Wildlife ServiceBill Boyd, Illinois Department of ConservationBill Bertrand, Illinois Department of ConservationHerman Hier, Illinois Department of ConservationAl VanVooren, Iowa Conservation CommissionBill Aspelmeier, Iowa Conservation CommissionRon Nicklaus, Wisconsin Department of Natural ResourcesJim Holzer, Wisconsin Department of Natural ResourcesBruce Hawkinson, Minnesota Department of Natural ResourcesNick Gulden, Minnesota Department of Natural ResourcesDavid Urich, Missouri Department of ConservationDr. Frank Bellrose, Illinois Natural History SurveyDr. Richard Sparks, Illinois Natural History SurveyJerry Schotzko, US Fish and Wildlife ServiceTom Sanford, US Fish and Wildlife Service0. T. Fears, US Fish and Wildlife ServiceRosalie Schnick, US Fish and Wildlife ServiceTom Lovejoy, Wisconsin Department of Natural ResourcesDave Kordiyak, Wisconsin Department of Natural ResourcesGary Grunwald, Minnesota Department of Natural ResourcesDr. Nani Bhowmik, Illinois State Water SurveyTed Ondler, US Fish and Wildlife ServiceFrank Collins, Corps of EngineersDr. Peter Lagasse, Simons, Li and Associates, Fort Collins, COJerry Rasmussen, US Fish and Wildlife Service
Boyd, W., and J. G. Harber (editors). 1981. "Effects of Navigation andOperation/Maintenance of the Upper Mississippi River System Nine-Foot Channelon Waterfowl Populations," UMRBC Environmental Work Team Report for UMRqMaster Plan, Upper Mississippi River Basin Commission, Minneapolis, M'"
PANEL MEMBERS
William Boyd, Chairman, Illinois Department of ConservationJoseph Harber, Facilitator, Dan McGuiness and Associates, Wabasha, MNBill Aspelmeier, Iowa Conservation CommissionDr. Frank Bellrose, Illinois Natural History SurveyRichard Bishop, Iowa Conservation CommissionDr. Leigh H. Fredrickson, University of Missouri., PuxicoDr. Carl Korschgen, US Fish and Wildlife ServiceRon Nicklaus, Wisconsin Department of Natural Resources
46
Boyd, W., and J. G. Harber (editors). 1981. "Effects of Fluctuation PoolLevels Caused by Normal Operation of the Upper Mississippi River System Nine-Foot Channel on Wetland Plants, Waterfowl, Muskrats, Invertebrates, and Fish,"UMRBC Environmental Work Team Report for UMRS Master Plan, Upper MississippiRiver Basin Commission, Minneapolis, MN.
PANEL MEMBERS
Bill Boyd, Chairman, Illinois Department of ConservationJoseph Harber, Facilitator, Dan McGuiness and Associates, Wabasha, MNDr. Nani Bhowmik, Panel Advisor, Illinois State Water SurveyBill Aspelmeier, Iowa Conservation CommissionDr. Frank Bellrose, Illinois Natural History SurveyRichard Bishop, Iowa Conservation CommissionDr. Tom Claflin, University of Wisconsin, LaCrosseDr. Jim Eckblad, Luther College, Decorah, IADr. Carl Korschgen, US Fish and Wildlife ServiceRon Nicklaus, Wisconsin Department of Natural ResourcesDr. Leigh Fredrickson, University of Missouri, PuxicoNick Gulden, Minnesota Department of Natural ResourcesDon Helms, Environment Research and Technology, Bellevue, IADr. Henry Seagle, Illinois Natural History gurveyAl VanVooren, Iowa Conservation Commission
Observers:Gail Peterson, US Fish and Wildlife ServiceDr. David Kennedy, Wisconsin Department of Natural ResourcesBill Green, US Fish and Wildlife ServiceDr. Robert Clay, Iowa State UniversityLou George, US Fish and Wildlife Service
Carmody, G. A., Bade, G., and Rasmussen, J. L. 1986. "Draft Fish and Wild-life Coordination Act Report for Lock and Dam 26 (Replacement) Second LockDraft Environmental Impact Statement," US Fish and Wildlife Service, RockIsland Field Office, Rock Island, IL.
PANEL MEMBERS
POOLS 1-4 - December 10, 1985 - LaCrosse, WisconsinJerry Rasmussen, Chairman, US Fish and Wildlife ServiceGail Carmody, US Fish and Wildlife ServiceGerry Bade, US Fish and Wildlife ServiceGary Wege, US Fish and Wildlife ServiceEd Crozier, US Fish and Wildlife ServiceDr. Leslie Holland, US Fish and Wildlife ServiceBruce Gilbertson, Minnesota Department of Natural ResourcesJohn Parker, Minnesota Department of Natural ResourcesLarry Gates, Minnesota Department of Natural ResourcesGary Grunwald, Minnesota Department of Natural ResourcesJim Stewart, Minnesota Department of Natural ResourcesRon Nicklaus, Wisconsin Department of Natural ResourcesMike Neuman, Wisconsin Department of Natural ResourcesWillis Fernholz, Wisconsin Department of Natural Resources
Dr. David Kennedy, Wisconsin Department of Natural ResourcesHillL.ry Berkman, Wisconsin Department of Natural Resources
47
POOLS 5-9 - December 11, 1985 - LaCrosse, Wisconsin
Gail Carmody, Chairman, US Fish and Wildlife ServiceGerry Bade, US Fish and Wildlife ServiceGary Wege, US Fish and Wildlife ServiceHannibal Bolton, US Fish and Wildlife ServiceDick Steinback, US Fish and Wildlife ServiceJohn Lyons, US Fish and Wildlife ServiceBob Arntz, US Fish and Wildlife ServiceBob Bartels, US Fish and Wildlife ServiceDr. Leslie Holland, US Fish and Wildlife ServiceNick Gulden, Minnesota Department of Natural ResourcesGary Grunwald, Minnesota Department of Natural ResourcesLarry Gates, Minnesota Department of Natural ResourcesJim Holzer, Wisconsin Department of Natural ResourcesMike Neuman, Wisconsin Department of Natural ResourcesDr. Cal Fremling, Winona State University, Winona, MN
POOLS 9-11 - December 12, 1985 - LaCrosse, WisconsinGail Carmody, Chairman, US Fish and Wildlife ServiceGerry Bade, US Fish and Wildlife ServiceJohn Lyons, US Fish and Wildlife ServiceHannibal Bolton, US Fish and Wildlife ServiceRick Berry, US Fish and Wildlife ServiceGary Ackerman, Iowa Conservation CommissionBill Aspelmeier, Iowa Conservation CommissionJim Ripple, Iowa Conservation CommissionMike Neuman, Wisconsin Department of Natural ResourcesRon Nicklaus, Wisconsin Department of Natural ResourcesMarian Havlik, Malacological Consultants, LaCrosse, WisconsinDr. Bill Clark, Iowa State University, AmesDr. Jim Eckblad, Luther College, Decorah, IATom Keevin, Corps of Engineers, St. Louis
POOLS 12-15 - December 4, 1985 - Rock Island, IllinoisJerry Rasmussen, Chairman, US Fish and Wildlife ServiceGerry Bade, US Fish and Wildlife ServiceGail Carmody, US Fish and Wildlife ServiceEd DeVries, US Fish and Wildlife ServiceBill Bertrand, Illinois Department of ConservationDan Sallee, Illinois Department of ConservationTerry Moyer, Illinois Department of ConservationTom Boland, Iowa Conservation CommissionGary Mensinger, Commercial Fisherman, Camanche, IowaDr. Ed Cawley, Loras College, Dubuque, IA
Observers:Dave Gates, US Army Corps of EngineersWayne Fischer, US Fish and Wildlife ServiceDr. Leslie Holland, US Fish and Wildlife ServiceJody Millar, US Fish and Wildlife ServiceTom Jones, Unknown
POOLS 16-19 - December 5, 1985 - Rock Island, IllinoisJerry Rasmussen, Chairman, US Fish and Wildlife ServiceGerry Bade, US Fish and Wildlife ServiceGail Carmody, US Fish and Wildlife ServiceBill Bertrand, Illinois Department of Conservation
48
Norm Emerick, Illinois Department of ConservationDr. Steve Havera, Illinois Natural History SurveyBernie Schonoff, Iowa Conservation CommissionBill Aspelmeier, Iowa Conservation CommissionDr. Ed Cawley, Loras College, Dubuque, IADr. Larry Jahn, Western Illinois University, MacombDr. Rick Anderson, Western Illinois University, Macomb
Observers:Dave Gates, US Army Corps of EngineersDr. Leslie Holland, US Fish and Wildlife ServiceRick Nelson, US Fish and Wildlife Service
POOLS 20-26 - December 17, 1985 - Alton, IllinoisJerry Rasmussen, Chairman, US Fish and Wildlife ServiceGerry Bade, US Fish and Wildlife ServiceGail Carmody, US Fish and Wildlife ServiceGeorge Peyton, US Fish and Wildlife ServiceBruce Stebbings, US Fish and Wildlife ServiceButch Atwood, Illinois Department of ConservationBill Boyd, Illinois Department of ConservationDan Sallee, Illinois Department of ConservationDr. Ken Lubinski, Illinois Natural History SurveyGordon Farabee, Missouri Department of ConservationRobert Dobbins, Missouri Department of ConservationJoseph Saylor, Missouri Department of ConservationWilliam Dieffenbach, Missouri Department of ConservationJohn W. Robinson, Missouri Department of Conservation
Observers:Thomas Keevin, US Army Corps of EngineersDr. Drew Miller, US Army Corps of Engineers
OPEN RIVER, KASKASKIA - December 18, 1985 - Alton, ILJerry Rasmussen, Chairman, US Fish and Wildlife ServiceGerry Bade, US Fish and Wildlife ServiceGail Carmody, US Fish and Wildlife ServiceBruce Stebbings, US Fish and Wildlife ServiceButch Atwood, Illinois Department of ConservationBill Boyd, Illinois Department of ConservationGordon Farabee, Missouri Department of ConservationWilliam Dieffenbach, Missouri Department of ConservationJohn W. Robinson, Missouri Department of Conservation
Observers:Thomas Keevin, Corps of EngineersDrew Miller, Corps of Engineers
ILLINOIS RIVER - December 19, 1985 - Havana, ILJerry Rasmussen, Chairman, US Fish and Wildlife ServiceGerry Bade, US Fish and Wildlife ServiceGail Carmody, US Fish and Wildlife ServiceGeorge Peyton, US Fish and Wildlife ServiceMax Runkle, Illinois Department of ConservationDan Sallee, Illinois Department of ConservationButch Atwood, Illinois Department of ConservationDr. Steve Havera, Illinois Natural History SurveyDr. Richard Sparks, Illinois Natural History Survey
49

Dave Gates, US Army Corps of EngineersDrew Miller, US Army Corps of Engineers
Harber, J. G., Kennedy, D. M., and Littlejohn, J. D. (editors). 1981."Effects of Navigation and Operation/Maintenance of the Upper MississippiRiver System Nine-Foot Channel on Channel Catfish," UMRBC Environmental WorkTeam Report for UMRS Master Plan, Upper Mississippi River Basin Commission,Minneapolis, MN.
PANEL MEMBERS
Dr. David Kennedy, Chairman, Wisconsin Department of Natural ResourcesJoseph Harber, Facilitator, Dan McGuiness and Associates, Wabasha, MNJohn L. Funk, Missouri Department of ConservationDon Helms, Environment Research and Technology, Bellevue, IADr. Robert Muncy, USFWS, Iowa Coop Fishery Unit, AmesJohn Pitlo, Iowa Conservation CommissionMichael Talbot, Wisconsin Department of Natural Resources
Observers:Gary Ackerman, Iowa Conservation CommissionRobert DeCooke, Iowa Conservation CommissionJeffery Littlejohn, Wisconsin Department of Natural ResourcesJerry Rasmussen, US Fish and Wildlife Service
Kennedy, D. M., Harber, J. G., and Littlejohn, J. D. 1981. "Effects of Navi-gation and Operation/Maintenance of the Upper Mississippi River System Nine-Foot Channel on Larval and Juvenile Fishes," UMRBC Environmental Work TeamReport for UMRS Master Plan, Upper Mississippi River Basin Commission,Minneapolis, MN.
PANEL MEMBERS
Dr. David Kennedy, Chairman, Wisconsin Department of Natural ResourcesJoseph Harber, Facilitator, Dan McGuiness and Associates, Wabasha, MNJeffery Littlejohn, Wisconsin Department of Natural ResourcesDr. Raymond P. Morgan, Appalachian Environmental Lab, Univ of MarylandDr. Vincent R. Kranz, Ecological Analysts, Inc.Douglas M. Carlson, New York Department of Environmental ConservationDr. Leslie E. Holland, US Fish and Wildlife ServiceDr. William D. Pearson, University of LouisvilleDr. Diane E. Ashton, Michigan State University
McGuiness, D. and Associates. 1981. Summary Proceedings, Environmental WorkTeam Impact Panel No. 1. Comprehensive Master Plan for the Management of theUo~er Mississippi River System, Contract Report to Upper Mississippi RiverBasin Commission for UMRS Master Plan, Minneapolis, MN.
PANEL MEMBERS
Jerry Rasmussen, Chairman, US Fish and Wildlife ServiceDan McGuiness, Facilitator, Dan McGuiness and Associates, Wabasha, MNDebra Johnson, Dan McGuiness and Associates, Wabasha, MNHarlan Hirt, US Environmental Protection AgencyOwen Dutt, Corps of EngineersCharles Michael, Missouri Department of Natural ResourcesBill Boyd, Illinois Department of Conservation
50

Dr. Ken Lubinski, Illinois Natural History SurveyJeff Littlejohn, Wisconsin Department of Natural ResourcesBill Braunschweig, Wisconsin Department of Natural ResourcesLee Keller, Upper Mississippi River Basin CommissionDr. Tom Wright, Corps of EngineersMike Cockerill, Corps of EngineersDr. David Kennedy, Wisconsin Department of Natural ResourcesDr. Nani Bhowmik, Illinois State Water SurveyDr. Rodger Adams, Illinois State Water SurveyDr. Yung Hai Chen, Simons, Li and Associates, Fort Collins, COGary Palesh, Corps of EngineersRick Pietruszka, Illinois Department of ConservationDr. Tim Kelly, University of MinnesotaDr. Tom Claflin, University of Wisconsin-LaCrosseDr. Jim Eckblad, Luther College, Decorah, IADr. Edwin Herricks, University of IllinoisGerald Bade, US Fish and Wildlife ServiceGail Peterson, US Fish and Wildlife ServiceJoseph Harber, Dan McGuiness and Associates, Wabasha, MNGene Hollenstein, Minnesota Department of Natural ResourcesJim Forsyth, Corps of EngineersJohn Marlin, Central States River Coalition, Urbana, IL
McGuiness, D., and Associates. 1981. Summary Proceedings, Environmental WorkTeam Impact Panel No. 2. Comprehensive Master Plan for the Management of theUpper Mississippi River System, Contzact Report to Upper Mississippi RiverBasin Commission for UMRS Master Plan, Minneapolis, MN.
PANEL MEMBERS
Jerry Rasmussen, Chairman, US Fish and Wildlife ServiceDan McGuiness, Facilitator, Dan McGuiness and Associates, Wabasha, MNHarlan Hirt, US Environmental Protection AgencyOwen Dutt, Corps of EngineersCharles Michael, Missouri Department of Natural ResourcesBill Boyd, Illinois Department of ConservationDr. Ken Lubinski, Illinois Natural History SurveyMichael Rhyner, Upper Mississippi River Basin CommissionDr. Tom Wright, Corps of EngineersMike Cockerill, Corps of EngineersDr. David Kennedy, Wisconsin Department of Natural ResourcesDr. Nani Bhowmik, Illinois State Water SurveyGary Palesh, Corps of EngineersJoe Scott, US Fish and Wildlife ServiceDr. Anatoly Hochstein, Private ConsultantDr. Tom Claflin, University of Wisconsin, LaCrosseDr. Jim Eckblad, Luther College, Decorah, IADr. Edwin Herricks, University of IllinoisGail Peterson, US Fish and Wildlife ServiceGene Hollenstein, Minnesota Department of Natural ResourcesJim Forsyth, Corps of EngineersYung Hai Chen, Simons, Li and Associates, Fort Collins, COJohn Marlin, Central States River Coalition, Urbana, IL
Dr. Jon Goodwin, Illinois Geological SurveyDr. Dick Seagle, Illinois Natural History Survey
51

Dr. Wayne Hubert, Iowa Cooperative Fish and Wildlife Unit, ISU, AmesDr. Ron Rada, University of Wisconsin, LaCrosseFrank Kline, Transportation IndustryLeif Marking, US Fish and Wildlife ServiceDr. Bill Clark, Iowa State UniversityKevin Szcodronski, Iowa Conservation CommissionDr. Larry Danek, Private Consultant
McGuiness, D. and Associates. 1981. Summary Proceed!ings, Environmental WorkTeam Impact Panel No. 3. Comprehensive Master Plan for the Management of theUpper Mississippi River System, Contract Report to Upper Mississippi RiverBasin Commission for UMRS Master Plan, Minneapolis, MN.
PANEL MEMBERS
Jerry Rasmussen, Chairman, US Fish and Wildlife ServiceDan McGuiness, Facilitator, Dan McGuiness and Associates, Wabasha, MNBill Boyd, Illinois Department of ConservationDr. Ken Lubinski, Illinois Natural History SurveyMike Cockerill, US Army Corps of EngineersDr. David Kennedy, Wisconsin Department of Natural ResourcesDr. Nani Bhowmik, Illinois State Water SurveyDr. Jim Eckblad, Luther College, Decorah, IADr. Edwin Herricks, University of IllinoisGail Peterson, US Fish and Wildlife ServiceGene Hollenstein, Minnesota Department of Natural ResourcesJim Forsyth, US Army Corps of EngineersJohn Marlin, Central States River Coalition, Urbana, ILDr. John Goodwin, Illinois Geological SurveyDr. Dick Seagle, Illinois Natural History SurveyDr. Wayne Hubert, Iowa Cooperative Fish and Wildlife Unit, ISU, AmesFrank Kline, Public RecreationDr. Bill Clark, Iowa State UniversityJeff Littlejohn, Wisconsin Department of Natural ResourcesBill Braunschweig, Wisconsin Department of Natural ResourcesLee Keller, Upper Mississippi River Basin CommissionRick Pietruszka, Illinois Department of ConservationKevin Szcodronski, Iowa Conservation CommissionDebbie Johnson, Dan McGuiness and Associates, Wabasha, MNJoe Harber, Dan McGuiness and Associates, Wabasha, MNDave Ellis, Dan McGuiness and Associates, Wabasha, MNJoyce Danner, Dan McGuiness and Associates, Wabasha, MNRosalie Schnick, US Fish and Wildlife ServiceHarvey Goodell, Retired EngineerTom Keevin, US Army Corps of EngineersDr. Rodger Adams, Illinois State Water SurveyDr. Jim Gramann, University of Wisconsin, MadisonDr. Tom Bonnicksen, University of Wisconsin, MadisonDr. Leo McAvoil, University of MinnesotaRoss Reagan, Upper Mississippi River Basin CommissionGene Hollenstein, Minnesota Department of Natural ResourcesDr. Jim Absher, University of Illinois
52

McGuiness, D. and Associates. 1981. Comprehensive Master Plan for the Man-agement of the Upper MississiRpi River System: Summary Proceedings. Environ-mental Work Team Impact Panel No. 4. Contract Report to Upper MississippiBasin Commission for UMRS Master Plan, Minneapolis, MN.
PANEL MEMBERS
Jerry Rasmussen, Chairman, US Fish and Wildlife ServiceDan McGuiness, Facilitator, Dan McGuiness and Associates, Wabasha, MNBill Boyd, Illinois Department of ConservationDr. Ken Lubinski, Illinois Natural History SurveyMike Cockerill, US Army Corps of EngineersDr. David Kennedy, Wisconsin Department of Natural ResourcesDr. Nani Bhowmik, Illinois State Water SurveyDr. Jim Eckblad, Luther College, Decorah, IADr. Edwin Herricks, University of IllinoisGail Peterson, US Fish and Wildlife ServiceGene Hollenstein, Minnesota Department of Natural ResourcesJim Forsyth, US Army Corps of EngineersJohn Marlin, Central States River CoalitionDr. Jon Goodwin, Illinois Geological SurveyDr. Dick Seagle, Illinois Natural History SurveyDr. Wayne Hubert, Iowa Cooperative Fish and Wildlife Unit, ISU, AmesFrank Kline, Public RecreationDr. Bill Clark, Iowa State UniversityJeff Littlejohn, Wisconsin Department of Natural ResourcesBill Braunschweig, Wisconsin Department of Natural ResourcesLee Keller, Upper Mississippi River Basin CommissionRick Pietruszka, Illinois Department of ConservationKevin Szcodronski, Iowa Conservation CommissionDebbie Johnson, Dan McGuiness and Associates, Wabasha, MNJoe Harber, Dan McCuiness and Associates, Wabasha, MNDave Ellis, Dan McGuiness and Associates, Wabasha, MNJoyce Danner, Dan McGuiness and Associates, Wabasha, MNRosalie Schnick, US Fish and Wildlife ServiceHarvey Goodell, Retired EngineerTom Keevin, US Army Corps of EngineersDr. Rodger Adams, Illinois State Water SurveyDr. Jim Gramann, University of Wisconsin, MadisonDr. Tom Bonnicksen, University of Wisconsin, MadisonDr. Leo McAvoil, University of MinnesotaRoss Reagan, Upper Mississippi River Basin CommissionGene Hollenstein, Minnesota Department of Natural ResourcesDr. Jim Absher, University of Illinois
Rasmussen, J., and Harber, J. G. (editors). 1981. "Effects of Navigation andOperation/Maintenance of the Upper Mississippi River System Nine-Foot Channelon Commercial Fish and Fishing," UMRBC Environmental Work Team for UMRS MasterPlan, Upper Mississippi River Basin Commission, Minneapolis, MN.
PANEL MEMBERS
Jerry Rasmussen, Chairman, US Fish and Wildlife ServiceJoseph Harber, Facilitator, Dan McGuiness and Associates, Wabasha, MNJohn Diehl, Commercial Fisherman, Ferryville, WisconsinBill Fritz, Illinois Department of Conservation
53

Vern Hacker, Wisconsin Department of Natural ResourcesDon Helms, Environment Research and Technology, Bellevue, IAGary Mensinger, Commercial Fisherman, Camanche, IAJohn Verdon, Commercial Fisherman, Waverly, IA
Observers:Gary Ackerman, Iowa Conservation CommissionRobert De Cooke, Iowa Conservation CommissionDaniel McGuiness, Dan McGuiness and Associates, Wabasha, MNGail Peterson, US Fish and Wildlife Service
54

Kanawha River Larval Fish Distribution and Preliminary
Assessment of Entrainment Risk*
Donald C. Hershfeld**
Introduction
One of the environmental concerns surrounding commercial navigation on
inland waterways is the potential impact of vessel passage on early life
stages of fish, particularly eggs and larvae. Larval swimming ability varies
with size/developmental stage and while their evasive capability is consider-
able (in terms of body lengths traveled per unit time), this mobility takes
place over only a small spatial scale relative to the total field of motion
induced by passage of a commercial vessel. Depending on their proximity to
the sailing line, some larvae are likely unable to avoid encounters with
vessel effects. The passage of vessels generates hydraulic conditions which
are both complex and variable. Based upon some, but not all, laboratory simu-
lations, repeated exposure to certain of these conditions is sufficient to
cause mortality. Attempts to verify entrainment mortality in the field have
been made (VPI&SU 1985; Holland 1986) but inherent sampling difficulties have
confounded results. It is reasonable to assume that some fraction of the
larval population is exposed to potentially lethal effects with each passage.
In this paper a newly developed sampling tool and a preliminary analysis
being used by the Huntington District to assess potential impacts are intro-
duced. The objectives of this paper are to describe the typical abundance and
distribution of larval fish (all species combined), estimate the extent to
which physical forces potentially injurious to larvae surround a representa-
tive vessel, and quantitatively integrate these data to predict the vulner-
ability of larval fish to multiple passes.
* The following is a preliminary examination of larval fish entrainment risk
associated with existing navigation traffic on the Kanawha River, WestVirginia. This analysis is intended merely to explore the potential forimpacts and is subject to revision and/or expansion as may be required.Conclusions are based on the limited portion of the total databasepresently available, and as such are tentative.
** Ecologist, US Army Engineer District, Huntington.
55

Methods
Sampling and larval fish distribution
The first objective is to describe a typical distribution of larvae
relative to passing tows and their hydraulic effects. Previous Kanawha River
larval fish distribution studies did not provide sufficient detail to make
quantitative estimates of entrainment impacts, so additional spatial resolu-
tion was desired in the present study. In order to afford a finer level of
control, a pair of modified Isaacs-Kidd trawls (MIK's) designed by the
Huntington District were used for sampling (Figure 1). The MIK was designed
to provide maximum depth control and sample size while minimizing gear eva-
sion, gear-induced mortality, sample contamination, and inter-sample varia-
tion. Quantitative samples were collected in a 2- by 2- by 7-m, 500-micron
Nitex mesh net. The net mouth was mounted in a lightweight aluminum frame
which allowed the trawl to be remotely opened and closed, permitting discrete
sampling at target depths. The trawl was suspended from an overhead beam
mounted on a 3.65- by 3.00-m pontoon-style platform equipped with pulleys and
winches. The central feature of the MIK platform is an open well through
which the trawl is deployed and retrieved. It is also fitted with a bow
extension plank and cleats to safely manage lines. The net frame could be
precisely positioned at a fixed depth while linked to a separate anchor line
Figure 1. Modified Isaacs-Kidd trawl and deployment platform
56
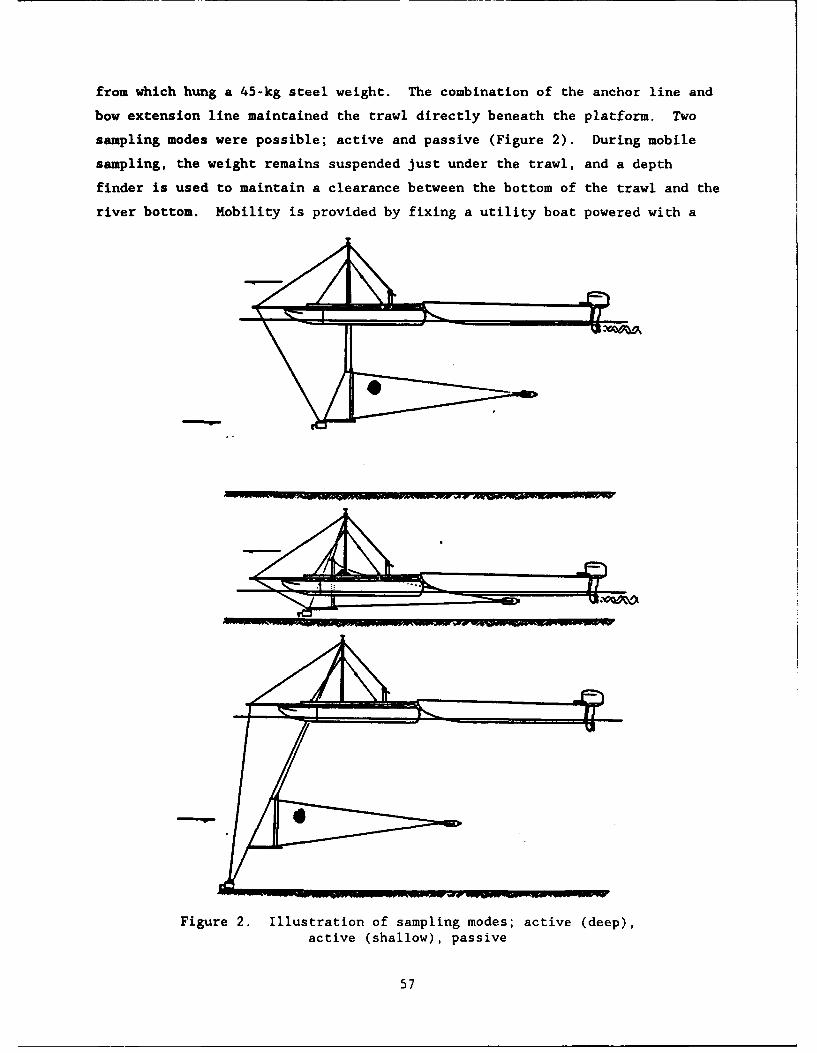
from which hung a 45-kg steel weight. The combination of the anchor line and
bow extension line maintained the trawl directly beneath the platform. Two
sampling modes were possible; active and passive (Figure 2). During mobile
sampling, the weight remains suspended just under the trawl, and a depth
finder is used to maintain a clearance between the bottom of the trawl and the
river bottom. Mobility is provided by fixing a utility boat powered with a
Figure 2. Illustration of sampling modes; active (deep),
active (shallow), passive
57

25-hp* outboard motor to the stern of the MIK platform. A Marsh-McBierney
Model 201 flowmeter probe positioned in the net mouth monitored water velocity
(maintained at 0.5 fps during sampling).
A three-person crew (including one boat operator) is recommended for
maximum safety and efficiency, although two could operate the gear if neces-
sary. The MIK's were used to sample actively (under power) in depths which
ranged from 0.6 to 9 m. At depths of less than 2 m, the trawl was only par-
tially submerged. Sampling can also be done passively (while anchored in
place) provided at least 0.2 fps of current is available. Active sampling was
preferred because it allowed control over sample volumes under a variety of
discharge conditions. Where ambient flow was less than 0.5 fps, net forward
progress upstream was made, otherwise the MIK was allowed to slip downstream
slowly (while facing upstream) in order to maintain the desired net mouth
velocity. Sample duration was typically 5 min, which resulted in 6,340 cu ft
of water passing through the net. Due to a large net mesh area to net mouth
ratio (7:1) no back pressure was apparent at the low net mouth velocity used.
At the end of each sample period, the trawl was closed, retrieved from
the water through the well, and the terminus of the net thoroughly washed down
into the sample collection chamber. After sample volumes were appropriately
reduced and any large debris removed, the sample was labeled and preserved in
10-percent Formalin solution for later sorting, enumeration, identification,
and measurement in the laboratory.
In extreme nearshore habitats (less than 0.5 m), a 0.5- by 3.0-m
500-micron Nitex mesh larval seine was used to collect samples. By moving
directly towards the shore very slowly along a measured distance, and noting
depths at the start and end points, semi-quantitative samples were obtained.
Use of the larval seine was restricted to gradually sloping banks free from
snags and dense overhanging vegetation.
Transects spanning the entire river channel (approximately 600 ft wide)
were established at three locations. The initial intent was to sample up to
three depths at each of 10 stations on each transect. This regimen proved
difficult to complete under all but the most favorable sampling conditions,
however, and the sampling effort was reallocated after the first few trips.
In the revised plan only that portion of a transect extending from midriver to
* A table of factors for converting non-SI units of measurement to SI(metric) units is presented on page 7.
58
the left descending bank was sampled. The advantages of this plan included
avoiding conflicts with existing traffic and crepuscular periods, and an
increased level of resolution (eight stations could be used to span a half-
transect of approximately 300 ft). Transects were chosen in the longest
straight reaches available and it was assumed that larval fish distribution
would exhibit bilateral symmetry in these reaches. Three consecutive samples
were taken at each depth and location across a transect. Sampling was con-
ducted biweekly from April through July and weekly during May and June when
larvae reached peak abundances.
Estimation of the encounter zone
The second objective is to examine the flow patterns induced by passage
of a vessel and to estimate the bounds of the encounter zone; that is, the
portion of the channel cross section within which a larval fish would likely
be exposed to potentially injurious forces during the course of vessel pas-
sage. This zone must be described by both the relative volume of the water
mass under consideration and its pre-passage position. Estimates of these two
components can then be integrated with larval distribution data to quantify
exposure accompanying each passage. Due to the complexity of the hydraulics
surrounding a vessel, this analysis used a conservative assumption concerning
the extent of this zone. Three types of information were used to make a pre-
liminary estimate - aerial observation of vessels, mathematical estimates of
water volumes impelled by props (Kuo et al. 1988; Cobb 1988*), and scale
modeling done by the US Army Engineer Waterways Experiment Station Hydraulics
Laboratory under contract for the Corps of Engineers, Ohio River Division. In
recognition of the uncertainty about this estimate, a sensitivity analysis was
conducted to determine the behavior of the entrainment model.
Evaluatina the risk of encounter
Each transect was divided into cells corresponding to the sampling sta-
tions. Within each cell and depth range the average density of larvae (for
the three consecutive samples) estimated from field sampling on any given date
was multiplied by the cell volume to yield the numbers of larvae present. The
surface, middle, and bottom samples were pooled in this regard after scale
model studies showed that, at least in shallow channels, the entire water
column directly under a moving vessel is typically mixed. This effect was
Personal communication, 1988, Steve Cobb, Environmental Specialist, US Army
Corps of Engineers, Lower Mississippi Valley Division, Vicksburg, MS.
59
particularly evident at the head of a loaded tow. Lacking detailed hydraulic
information, it was assumed that larvae throughout the water column in the
immediate vicinity of the vessel would be exposed to vessel effects.
The number of larvae throughout the water column within each cell was
expressed as a cumulative percentage of the total number within the half tran-
sect, starting in midchannel and proceeding to the left descending bank.
Assuming that vessels generally operate in or near midchannel, half the width
of the encounter zone was translated through a graph of the cumulative distri-
bution of larvae by cell to yield the fraction of larvae present in the cross
section which are exposed (Figure 3).
Larval Fish DensitySite: London
/ 600- 1
1500- C0 -0.80 m
400- uC 0.6 1U 300- ab t1 -0.4 1c 200- vm 0.2
100 -0.2
t• 0 , I 0r 0 50 100 150 200 250 280 290
Feet from Sailing Line
Density -4-- Vel./Vol. --- Simple
Date: 060889
Figure 3. Density and distribution of larval fish on 8 June, 1989
To account for the river current and the upbound or downbound progress
of the vessels, it was necessary to consider the cells as three-dimensional
evaluation volumes through which both larvae and vessels transit (Figure 4).
These volumes were bound by the width and depth of the cells, and the lengths
assigned to each cell were given by the distance transited by the head of the
60

Figure 4. Illustration of evaluation volues
vessel per unit of time, plus or minus the relatively small distance the water
in the cell moves during this interval. For example, an upbound vessel with a
ground speed of 6 mph covers a reach of 8.8 ft in 1 see. If the water
velocity in a cell is 0.5 fps, during 1 second the volume of water encountered
at a midchannel location would be given by the cell width x cell depth x
9.3 ft. In the case of a downbound vessel, water velocity was subtracted from
tow speed. These adjusted volumes were then multiplied by larval density in
each cell prior to computing the cumulative distribution.
Given larval distribution, an estimate of the encounter zone and traffic
frequencies, it is possible to compute the fraction of the larvae exposed overany nmber of passes. Te cuulative effect of multiple passes was estimated
by computing the probability of avoiding encounters, which may be given by:
x - [(1 v) + V*(l E)t. (1)
where X - undisturbed fraction of initial population
V - vulnerable portion of the population
61

E - fraction of fish population entrained per pass
t - tow passes per transect per day
d - days in evaluation period
This model assumes a redistribution of the vulnerable portion of the popula-
tion after each pass; i.e., that larvae occupying the main channel mix and are
equally vulnerable. A second portion which occupies the nearshore and channel
borders remains isolated from direct encounters with traffic, regardless of
the number of passes.
Results and Discussion
Sampling and larval fish distribution
Compared to more traditional sampling tools such as bongo nets, the MIK
trawls performed well. Side-by-side comparisons were made between these two
gears but the results are not yet available. One limitation was noted during
mobile sampling tests. At net mouth velocities above 0.9 fps, considerable
back pressure would develop and cause the trawl to swing back out from under
the platform despite the weight and bow extension line, in which case depth
could not be precisely controlled. At the target velocity of 0.5 fps, no such
problem occurred. The intent of the gear was to approach fish slowly and
thereby minimize alarm. Even adult fish that could easily outswim the gear
were frequently captured, suggesting that the gradually approaching trawl did
not prompt an evasive response.
The larval seine performed adequately, but some gear evasion was likely
and only cover-free areas could be effectively sampled. If densities obtained
by using this gear underestimate the true number of larvae present per unit
volume of water along a typical bank, this would make the estimate of exposure
more conservative. On average, larvae captured in the seine were larger than
those taken with the MIK. Whether this is due to some difference in the gear
or an actual size difference between habitats is unknown, but the latter is
suspected if larvae use the nearshore zones as nursery areas.
On those few dates for which data are presently available, larval fish
distributions demonstrated a consistent pattern. For example, at the London
site on 8 June 1989, the density of larvae in the six open-water stations
ranged from 6.11 to 15.66 per 100 m 3, and increased to 22.0 per 100 m3 at the
channel border station. In contrast, 471.34 larvae per 100 m3 were found at
the nearshore station (Figure 3).
62

If all cells had equal volumes and velocities, then the above data would
suggest that the bulk of the larvae were well outside of the sailing line.
However, the nearshore habitat is typically a shallow bench covered with very
limited volumes of water. While ic holds the highest densities, this water
constitutes only about 0.001 of the available habitat. Consequently, the
channel border and nearshore areas held only 0.084 of the larvae in this cross
section at the time it was sampled. Thus a large fraction, 0.916 of the total
larval population, occupied the main channel and was directly vulnerable to
traffic on this date.
Velocities in the extreme nearshore habitat are commonly zero or nearly
so at low-to-moderate flows and may be affected as much by shifting wind
directions as by gravity, whereas velocities in the main channel are typically
in the range of 0.5 - 1.5 fps. Thus the throughput (or turnover rate) in a
mid-channel cell, in combination with the inherently greater volume of water
found there, more than compensates for lower instantaneous densities of larvae
(Figure 5). Vessel speed overshadowed the ambient velocity of the river by
Larval Fish AbundanceSite: London
Number in Evaluation Volume Cumulative %3500
1
3000. ...... 0.8
2500
2000 0.6
1500 .. 0.4
1000-00 -0.2
0 0
0 50 100 150 200 250 280 290Feet from Sailing Line
Larvae in water col. - Cumulative % of Pop.
DO". oo9l9
Figure 5. Abundance of fish larvae within evaluation volumes
63

about an order of magnitude, consequently river velocity did not greatly
affect exposure. Vessel direction also had only a minor influence.
Earlier Kanawha River studies suggested that larval densities were com-
monly one to two orders of magnitude greater in shallow nearshore habitat than
in the deeper, more open channel habitat (VPI&SU 1985). Embayments, where
present, may support tenfold more larvae per unit volume than the adjacent
nearshore habitats (Scott 1989). These observations are confirmed by numerous
literature reports which suggest that, in general, larval fish occupying lotic
systems prefer more shallow, quiescent areas. Higher densities and larger
sizes of larvae in the nearshore habitat may be explained by several factors.
Shallow water and relatively abundant cover may minimize predation risk.
Reduced current velocities may minimize energy expenditures and displacement.
Foraging for prey items may be more efficient in these areas as well. Daytime
temperatures may be warmer, leading to higher growth rates. However, larvae
may face a greater risk of de-watering or wave wash disturbance depending on
the bank geometry in nearshore areas. Casual observation suggests that larvae
remain just outside of the bank/water interface. This may offset the risk of
drawdown and waves to some degree.
Estimation of the encounter zone
In earlier work done by the Huntington District attention was focused on
the propeller jet, the effect of Kort nozzles versus open wheels, etc. How-
ever, only a small fraction of the average Kanawha River discharge is impelled
through the propellers of the typical vessel found there (approximately
2.5 percent). Later work by the District and others demonstrated that high
velocities are found not only in the propeller region, but at the head of the
tow where sudden flow reversals may occur. Thus it would appear that propel-
ler entrainment is only a subset of the entire field of disturbance to which
larvae may be exposed.
Aerial observation as well as scale modeling suggest that the high
velocities induced at the head of the tow occur over an area only slightly
wider than the load itself and appear to extend throughout the water column
under the vessel. For the sake of this analysis the encounter zone was
assumed to be the entire water column 25 ft to either side of center of the
tow's track; that is a 50-ft-wide swath. This estimate is considered conser-
vative in that the present fleet employs 35-ft-wide jumbo barges in a 1 x 5
configuration. All larvae present in this zone are considered as having been
exposed to potentially injurious forces. In reality a considerable
64

displacement flow envelopes the moving vessel, first being pushed out to the
front, then off to the sides, and finally being drawn back in behind. Thus
not all larvae initially occupying the sailing line pass directly under the
vessel into the most turbulent regions. However some larvae located just off
the sailing line may be drawn immediately behind the vessel and experience
turbulence in a vessel's wake. Assuming the hydraulic conditions surrounding
the vessel are less severe than those under it and in the props, this analysis
utilizes a conservative estimate of the encounter volume.
Evaluating cumulative risk of encounter
The entrainment model was evaluated over a 30-day period under three
sets of assumptions regarding the vulnerable portion of the population and the
fraction of the vulnerable larvae occupying the encounter zone (Figure 6).
All three cases assume a traffic frequency of 10 passes per day. Case I is a
reference intended to reflect only the impact of that water being impelled by
the props. Larvae are arbitrarily assumed to be uniformly distributed across
Entrainment Potential10 Tows/d, 50 Ft Encounter Zone, 30 d
% Remaining UnentrainedI
0.8
0.6
0.4 -
0.2
00 5 10 Is 20 25 30 35
Days
-- Reference - Worst Case -- Most Probable
V6100.100.91.%, Eo.025,.104,.114
Figure 6. Fraction of population remaining unexposed over time
65
all habitats. Case II reflects a situation in which all larvae within the
50-ft-wide encounter zone centered on the sailing line are subject to impact.
The 8 June 1989 distribution data were used and considered representative.
Case III is similar to II except that only 91.6 percent of the larvae, the
portion occupying the main channel, were vulnerable. Larvae in the nearshore
zone and channel border were considered effectively separated from those in
the channel and therefore immune to impact. In contrast, 100 percent of the
larvae, including those on the margins of the main channel, were considered
vulnerable in cases I and II.
The results of all three cases suggest that even at present levels of
traffic, all or nearly all larvae are exposed to the effects of vessel passage
(Figure 6). In the reference case (I) about 22 days are required before prac-
tically all larvae have been exposed. Only 6 days are required to expose most
larvae in the worst case (II). In the "most likely" cases (III) nearly all
vulnerable larvae are also exposed within about 6 days but 8.4 percent remain
(unexposed) in the nearshore and main channel border habitats. The sensitiv-
ity analysis revealed that the model is much more sensitive to traffic fre-
quency than to the size of the encounter zone. Most larvae occupying the main
channel will be exposed in 2 weeks or less at current levels of traffic. As
this analysis suggests that impacts are potentially significant, it will be
expanded to incorporate the distribution of individual species and the rela-
tive effects of future tow traffic configurations and frequency.
Several interpretations can be drawn from this apparent high prL .bility
of exposure. One is that larval fish exposed to the vessel passage effects
are injured or killed, and the reduction in recruitment potential severely
impacts adult populations. However, fish populations have markedly improved
or remained steady in the Kanawha River since the early 1970's, while traffic
has grown over the same period. Therefore it would not appear that traffic
limits adult populations. Improvements in water quality are generally cited
as responsible for the resurgence of fish populations in the Kanawha and Ohio
Rivers. Given suitable water quality, other factors such as inadequate prey
densities at the end of endogenous feeding or scarcity of hiding cover for
larval or juvenile stages appear to be more likely mechanisms to limit popula-
tion sizes than are traffic effects.
Fecundity is typically quite high for river species, but it is doubtful
if the apparent long-term recruitment trends would have occurred given high
natural mortality in addition to the high vessel exposure rates estimated
66
here, provided the latter is presumed to result in mortality. An exceptional
compensatory reserve would have to be assumed to account for improving fish
populations during a period of increasing traffic.
This leads to the possibility that larvae exposed to traffic effects may
simply not be impacted. While it may appear presumptuous to suggest that a
lifestage commonly regarded as fragile withstands vessel encounters without
harm, several characteristics may confer protection. In the earliest life
stages a majority of larvae directly in the path of a tow are likely to slip
around the vessel with the displacement flow. Small, weakly swimming larvae
would flow with the water at low relative velocities and may enjoy the protec-
tion of thin boundary layers surrounding hull and prop blades. Susceptibility
to shear is also minimized by short body length. For those drawn into the
propeller region, small size minimizes the probability of direct strike.
Rapid pressure changes in the vicinity of the propellers would not necessarily
impact larvae which have not yet developed a swim bladder. The only physical
disturbance to which larvae appear vulnerable is cavitation, but the propul-
sion units are designed and operated to minimize this. It is not unreasonable
to question the commonly held assumption that larvae are easily damaged by
vessel encounters. By the time they have grown sufficiently large that they
would become susceptible to these hydraulic factors, they may have acquired
sufficient evasive capability to avoid the regions surrounding the vessel most
likely to cause damage.
The most reasonable interpretation is that some of the larvae which
become entrained are damaged, while others are unharmed. In either case,
however, main-channel habitat is normally of such low quality for growth and
survival that most larvae found there would not recruit even in the absence of
traffic and its presumed detrimental effects. The main channel of rivers
similar to the Kanawha may well be inhospitable due to minimal cover, maximal
exposure to predators, and relatively low prey densities. Foraging may be
impaired due to natural turbulence. Suboptimal conditions in the main channel
probably combine to delay growth, resulting in low survival. If this is the
case the potential influence of vessel passage becomes a moot issue, excepting
possible drawdown and wavewash effects upon more viable larvae occupying
ecologically suitable nearshore habitats.
67

References
Holland, L. E. 1986. "Effects of Barge Traffic on Distribution and Survivalof Ichthyoplankton and Small Fishes in the Upper MIississippi River," Transac-tions of the American Fisheries Society. Vol 115, pp 162-163.
Kuo, C. Y., Jordan, D. M., Ying, K. J., ant Loganathan, G. V. 1988. "Vessel-Induced Physical Effects Related to Navigation Changes on the Kanawha River inWest Virginia," Technical report submitted to Huntington District, US ArmyCorps of Engineers, Huntington, WV, by Virginia Polytechnic Institute andState University, Blacksburg, VA.
Scott, M. 1989. "Larval Fish Abundance and Habitat Associations in Back-waters and Main Channel Borders of the Kanawha River," M.S. thesis, VirginiaPolytechnic Institute and State University, Blacksburg, VA.
VPI&SU. 1985. "Development and Application of an Energy Flow Model to Ana-lyze Impacts of Navigation Changes on the Kanawha River in West Virginia,"Technical report submitted to Huntington District, US Army Corps of Engineers,Huntington, WV, by Virginia Polytechnic Institute and State University,Blacksburg, VA.
68

A Strategy to Investigate the Environmental Effects
of Commercial Navigation Traffic
Andrew C. Miller*
Background
A planner or engineer in a Corps of Engineers District, the US Fish and
Wildlife Service, or a State agency must use an effective strategy to deal
with commercial traffic effects. The strategy should not be an unalterable
set of rules that apply in every circumstance, but a general guide that can be
modified as necessary. The following approach to analyze the impacts of com-
mercial navigation traffic has been developed as a result of conducting numer-
ous studies on the effects of man's activities in navigable waterways.
Development of a Strategy
Preliminary evaluation
Before field work is initiated, an accurate description of the problem
must be prepared. For a navigation project, this should include the predicted
number and size of tows on a seasonal or annual basis. If the project con-
sists of upgrading a port or loading facility, the size and number of tows,
operation schedules, and the exact route that tows would use as they approach
the facility are required. A map of the area should be prepared that would
include important biotic and physical resources.
The purpose of the preliminary evaluation is to identify valuable
resources such as aquatic macrophytes, mussel beds, gravel deposits, back-
waters, or sloughs. Mainly qualitative information (species lists, presence/
absence data, etc.) can be collected at this time. Results could indicate
that additional study is warranted, or that biotic resources were not as valu-
able as once thought. Detailed studies may not be needed if valuable biotic
resources are not present.
Qualitative biological and physical data can be collected with minimal
equipment. Water velocity can be estimated with a stopwatch and float, depth
* Environmental Laboratory, US Army Engineer Waterways Experiment Station,Vicksburg, MS.
69
can be measured with a string and weight. A petite Ponar dredge can be used
to collect sediment samples for visual examination. Percentages of various
grain sizes and amounts of organic matter can be estimated. At a later time
these samples can be taken to the laboratory for more accurate analysis.
Presence of mussels and insect larvae can be noted and density estimates can
be made. Qualitative estimates of the effects of commercial vessel passage on
velocity and suspended solids should be obtained. At a later time, the
effects of vessel passage on suspended sediments or water velocity can be
determined with specialized techniques and equipment (Bhowmik, Miller, and
Payne 1990). Sites for physical and biological effects studies should be
located to receive low, medium, and high effects of vessel passage. Distances
can be estimated with an optical range finder or determined more accurately
with electronic range finders. The number of vessels using the area can be
noted and compared with records kept by Corps Lock and Dam operators.
Detailed investigation
If a detailed investigation is required, then representative sites
should be chosen. Sites should span existing physical and biological condi-
tions in the affected reach. They should exhibit the range of substrate con-
ditions, water depths and velocities, and riparian vegetation. It is not
possible to conduct a thorough investigation of an entire waterway; it is more
realistic to study individual segments. Data from representative sites should
be extrapolated to obtain information on the system.
The design for field work depends on the objectives of the study and the
type of navigation project that is planned. It is useful to collect quantita-
tive data on the biotic resource of interest at representative sites during
several seasons or water levels for 1 to 2 years. This will provide good
information on species diversity and richness, density of dominant taxa, life
history patterns, evidence of mortality and recruitment. These biotic indices
can be used to describe existing conditions and as a basis to make predictions
(Miller and Payne 1988; Miller, Payne, and Ragland 1990; Miller, Payne, and
Way 1989).
Indices of value that are used for habitat evaluation projects are (or
at least should be) based upon empirically derived population level data.
Quantitative results of field investigation such as species richness, divers-
ity, or density, can always be converted to habitat suitability index scores.
Physical data (substrate types, water velocity, chemical and physical condi-
tions of water, etc.) should also be obtained.
70

Synthesis of Results
Predicting the environmentaleffects of commercial traffic
Three techniques can be used to predict the environmental effects of
commercial navigation traffic:
_. The investigator can estimate impacts based upon informationon existing biological conditions and an assessment of physi-cal effects likely to be caused by the project (Bhowmik,Miller, and Payne 1990). Miller, Payne, and Ragland (1990)measured water vessel-induced changes in velocity over musselbeds and determined that the magnitude of change was typicalof values usually found in large waterways. It appearedunlikely that measured vessel-induced velocities would nega-tively affect freshwater mussels or their habitat. On theother hand, if it is determined that vessel movement willcreate a large change in water velocity or suspended sedimentsclose to aquatic plants or areas where fishes spawn, thennegative effects could occur. In these cases the amount ofvaluable habitat must be known, as well as magnitude of thephysical effect.
b. Results of laboratory experiments (Aldridge, Payne, and Miller1986; Killgore, Miller, and Conley 1987; Payne and Miller1987; Pearson et al. 1989) can be used to determine the influ-ence of physical effects on specific organisms. However,naturally occurring populations may not respond in the samemanner as laboratory-held organisms. Stress measured at theindividual level may not be translated to the populationlevel. The above-cited papers should be used mainly to gainan overall understanding of the effects of physical stress onaquatic organisms.
c. Numeric or simulation models can be used to predict physicaleffects. More information on these methods can be found inpapers by Martin and Maynord, and Wilcox, in these Proceed-ings. This would alleviate the need to measure changes inwater velocity or suspended solids as a result of trafficmovement. Results from these models, when coupled with bio-logical information, can be used to make estimates of impactsto the biota.
Intervretation
Results should be compared with data from other studies to interpret
findings. For example, physical and biological data from sites that are simi-
lar with respect to all biotic and abiotic conditions except traffic levels
can be contrasted. Results can be compared with data from previously
conducted studies, although use of various sampling techniques can make this
difficult. Field data also can be compared with results from numeric or
71

simulation models. This information can be used to verify models or suggest
the need for additional field study.
Summary
Government personnel have used a variety of methods to study the effects
of commercial navigation traffic. Information from laboratory studies can be
used to predict navigation traffic effects. However, it is often difficult to
compare results obtained from laboratory-held organisms with natural popula-
tions. Numeric or simulation models can be used to predict changes in water
velocity or sediment concentrations following vessel passage. These results
can be compared with information on tolerances of selected organisms to spe-
cific types of stress.
It is important to develop a strategy for designing and conducting a
navigation effects study. Before the study is initiated, a pilot investiga-
tion should be completed. The purpose of the pilot investigation would be to
gain qualitative information on aquatic resources and physical effects of
vessel movement. Following interpretation of data from the preliminary study,
a more detailed investigation can be initiated. The detailed investigation
should include provisions for collecting quantitative biological and physical
data during several seasons. Sample sites should be located to receive low,
medium, and high effects of traffic. After quantitative data have been col-
lected, the results of model studies or information from the technical litera-
ture can be use to predict effects. Aquatic resources along waterways are
best protected if quantitative information is obtained to interpret trends.
The effects of commercial navigation traffic, like the effects of any man-made
impacts, can be studied and predicted using conventional methods.
72
References
Aldridge, D., Payne, B. S., and Miller, A. C. 1986. "The Effects of Inter-mittent Exposure to Suspended Solids and Turbulence on Three Species of Fresh-water Mussels," Environmental Pollution. Vol 45, pp 17-28.
Bhowmik, N. G., Miller, A. C., and Payne, B. S. 1990. "Techniques for Study-ing the Physical Effects of Commercial Navigation Traffic," TechnicalReport EL-90-10, US Army Engineer Waterways Experiment Station, Vicksburg, MS.
Killgore, K. J., Miller, A. C., and Conley, K. 1987. "Effects of Turbulenceon Yolk-Sac Larvae of Paddlefish," Transactions of the American FisheriesSociety. Vol 116, pp 670-673.
Miller, A. C., and Payne, B. S. 1988. "A Workshop to Investigate Techniquesto Analyze Physical and Biological Effects of Commercial Traffic," TechnicalReport 89-4, US Army Engineer Waterways Experiment Station, Vicksburg, MS.
Miller, A. C., Payne, B. S., and Ragland, D. 1990. "Studies on the PhysicalEffects of Commercial Navigation Traffic in the Upper Mississippi River,"National Conference on Hydraulic Engineering. San Diego, CA, July, 1990.
Miller, A. C., Payne, B. S., and Way, C. M. 1989., "Phase I Studies: TheImpacts of Commercial Navigation Traffic on Freshwater Mussels -- A Review,"Miscellaneous Paper EL-89-11, US Army Engineer Waterways Experiment Station,Vicksburg, MS.
Payne, B. S., and Miller, A. C. 1987. "Effects of Current Velocity on theFreshwater Bivalve Fusconaia ebena," American Malacological Bulletin. Vol 5,pp 177-179.
Pearson, W. D., Killgore, K. J., Payne, B. S., and Miller, A. C. 1989."Environmental Effects of Navigation Traffic: Studies on Fish Eggs and Lar-vae," Technical Report EL-89-14, US Army Engineer Waterways Experiment Sta-tion, Vicksburg, MS.
73