an investigation of cyanobacteria dynamics in...
TRANSCRIPT

AN INVESTIGATION OF CYANOBACTERIA DYNAMICS
IN THREE SOUTHWEST NEW BRUNSWICK LAKES:
UTOPIA, CHAMCOOK, AND DIGDEGUASH
Project Report
Eastern Charlotte Waterways Inc.
APRIL 2012

1
Contents
1. Introduction .............................................................................................................................................. 2
1.1. Trophic States .............................................................................................................................. 2
1.2 Cyanobacteria ............................................................................................................................... 4
2. Overview of Study Lakes ........................................................................................................................... 5
Lake Utopia ......................................................................................................................................... 5
Chamcook lake ................................................................................................................................... 6
Digdeguash Lake ................................................................................................................................. 6
3. Methodology ............................................................................................................................................. 7
3.1 Monitoring Stations and Regime .................................................................................................. 7
3.2 Water Quality ............................................................................................................................... 7
3.3 Sediment Chemistry ..................................................................................................................... 8
3.4 Phytoplankton Characterization and Abundance ........................................................................ 8
4. Results and Discussion .............................................................................................................................. 9
4.1 Water Temperature and Dissolved Oxygen ................................................................................. 9
4.2 pH, Conductivity, and Alkalinity ................................................................................................. 11
4.3 Transparency and Chlorophyll a ................................................................................................. 12
4.4 Surface Water and Sediment Chemistry .................................................................................... 13
4.5 Lake Levels and Precipitation ..................................................................................................... 16
4.6 Phytoplankton Characteristics and Abundance ......................................................................... 18
4.7 Trophic States of the Three Lakes .............................................................................................. 22
5. Conclusions ............................................................................................................................................. 23
6. Recommendations .................................................................................................................................. 24
References .................................................................................................................................................. 25
Acknowledgements ..................................................................................................................................... 26
Appendix A – Regional Map of Study Lakes ................................................................................................ 27
Appendix B – Bathymetric Maps ................................................................................................................. 28
Appendix C – *B Analytical Package for Surface Water and Aquatic Protection........................................ 31
Appendix D – Monitoring Sample Sites ...................................................................................................... 32
Appendix E – Summary data of pH, Conductivity, and Alkalinity ............................................................... 33
Appendix F – Complete Water Quality Dataset (Fredericton Analytical Services, DENV) .......................... 34
Appendix G – Phytoplankton Characterization and Abundance ................................................................ 43
Appendix H – Phytoplankton Characterization and Abundance ................................................................ 44

2
1. Introduction
Southwest New Brunswick has an abundance of lakes, which vary widely with respect to water quality,
trophic stability, and ecosystem integrity. These variations are largely a result of differential
environmental pressure from anthropogenic sources such as shoreline development, point source
discharges, water abstraction or hydrological interference, and recreational activities. When such
pressures threaten lakes, signs of eutrophication (typically a consequence of nutrient loading) begin to
emerge, which can include blooms of cyanobacteria. When in abundance, cyanobacteria not only have the
potential to suffocate lakes by depriving these systems of oxygen, but some strains produce substances
that can be toxic to humans and animals, which has been a cause of concern in recent years for two of the
study lakes described here, Lake Utopia and Chamcook Lake. Blooms of toxin-producing cyanobacteria
in these two lakes, Microcystis aeruginosa and Gloeotrichia echinulata species respectively, have
presented significant challenges. Most recently, blooms in Chamcook Lake are impacting the municipal
water supply for the local township of St. Andrews. While the phenomena of eutrophication is well
studied, unpredictable blooms of cyanobacteria continue to precipitate concern across the globe due to
uncertain implications for human and aquatic health, potential loss of recreation opportunities, and
reduced tourism and property values. In New Brunswick, environmental pressures are intensifying due to
increased human encroachment into rural, and particularly shoreline areas. However, despite upward
trends in residential shoreline development and aquatic recreational activities, there continues to be
relatively intermittent monitoring of lakes in the province.
The purpose of this ongoing project is to attain a better understanding of why these blooms are happening
and to promote and initiate long term and consistent monitoring of lakes and the watersheds of which they
are a part. To achieve this, Eastern Charlotte Waterways Inc. (ECW) collected extensive water quality
data, as well as baseline data describing sediment chemistry, and phytoplankton characterization and
abundance. The three lakes under investigation for this project are all located in Southwest New
Brunswick. They include the two aforementioned lakes as well as Digdeguash Lake; a lake located in the
same region but one not known to exhibit blooms. Lake surveying and preliminary data analyses among
the three lakes are being used to assess the current condition of the lakes and draw on observations that
may be indicative of why blooms are occurring. ECW conducted the monitoring of these three lakes in
partnership with the New Brunswick Department of the Environment (NB DENV), with funding from the
Environmental Trust Fund and the Atlantic Ecosystems Initiative.
1.1. Trophic States
The trophic state, or biological productivity, of a lake is described as being oligotrophic, mesotrophic, or
eutrophic. An oligotrophic lake has relatively low primary production (i.e. low phytoplankton
concentration) and low nutrient levels, in contrast to mesotrophic, which is moderate, and eutrophic,
which is on the high end of the trophic spectrum. In the context of this study, one would expect the type
of bacterial blooms that have occurred in Chamcook and Utopia, in the past, to occur under eutrophic
conditions. Tropic states are traditionally assessed with an examination of primary water quality
parameters, including transparency (Secchi depth), chlorophyll a, and nutrient concentration. The
Organization for Economic Co-operation and Development (OECD, 1992) guidelines, which are based on
ice-free growing season averages, are used to determine trophic state (

3
Table 1).

4
Table 1: Trophic state indicator parameters and associated values (Source: Brylinsky, 2009)
Parameter Oligotrophic Mesotrophic Eutrophic
Secchi depth (m) ≥ 5 ≥ 3, < 5 < 3
Chlorophyll a (ug/L) < 3.5 ≥ 3.5, < 5.0 ≥ 5.0
Total Phosphorus (mg/L) < 0.010 ≥ 0.010, ≤ 0.020 ≥ 0.020
1.2 Cyanobacteria
Cyanobacteria are ancient, microscopic aquatic organisms, and together with diatoms and dinoflagellates,
form the three main groups of phytoplankton. Although they are naturally occurring in freshwater systems
throughout the world, their success and proliferation is dependent upon available nutrients, which are
largely by-products of anthropogenic activities such as agriculture, wastewater treatment, and shoreline
development. Most species of cyanobacteria are capable of producing toxins, which have health
implications for both humans and aquatic organisms, and which have only recently been studied. Some
cyanobacteria have the capacity to fix nitrogen, and are therefore dependent upon the availability of
excess phosphorus and to a lesser extent, elements such as iron. In combination to their unique ability to
control buoyancy, this gives cyanobacteria a competitive edge over other forms of phytoplankton, and
suggests that freshwater systems with elevated nutrients are prone to blooms of cyanobacteria.
(Mersereau, 2011)
Of the three different types of cyanobacteria, colony-producing species, which form colonies consisting
of thousands of individual cells, are considered to be the most widespread and problematic in lake
environments. While most colonies are thought to die off or form dormant cysts in lake sediments over
winter, there is some evidence to suggest that some cyanobacteria species are capable of overwintering,
even in temperate climates. In the summers of both 2010 and 2011, Gleotrichia echinulata was found to
be the most prevalent species during blooms of cyanobacteria in Chamcook Lake. In addition to having
the ability to fix nitrogen, and like a select group of other colony-forming species of cyanobacteria,
Gleotrichia sp. are capable of storing phosphorus for use at a later time when its availability is limited.
This characteristic not only makes it difficult to reduce the incidence of blooms, but to anticipate the
timing of blooms, which can occur independently of the availability of nutrients. Furthermore, many
cyanobacteria are capable of not only using nutrients available in the water column, but also in the benthic
sediments of aquatic environments, which suggests that many traditional water quality monitoring
programs may not provide adequate indication of the vulnerability of a lake environment to blooms of
cyanobacteria. (Mersereau, 2011)
Beyond the availability of nutrients, hydrology is a major determinant of the success of cyanobacteria in
aquatic systems. Cyanobacteria are thought to favour low flow conditions, evidenced by higher
abundance during periods and years of relatively low precipitation. This is attributed to a reduction in the
flushing of nutrients used by the organisms for growth. Cyanobacteria also favour warmer temperatures,
although there are increasingly reports of cyanobacteria blooms overwintering, but little is known about
the mechanics of this phenomenon. In lakes that experience significant thermal stratification, the turnover
effect in spring and fall is thought to support cyanobacteria in two important ways: by liberating nutrients
from the bottom sediment through a chemical reaction that occurs during anaerobic conditions at deep
depths, and through the transport of nutrients throughout the water column with the mixing water. All
indications suggest that climate change and its anticipated impacts will further encourage the proliferation
of cyanobacteria. Warmer temperatures, earlier ice-outs, and altered hydrological patterns that favour
more intense rainfall and greater run-off are likely to favour cyanobacteria more than other species of
phytoplankton. (Mersereau, 2011)
The impacts of cyanobacteria on human and animal health have only recently been studied, and our
current understanding remains relatively limited. Various toxins produced by varieties of cyanobacteria
have been linked with liver and neurodegenerative diseases in humans. Each particular cyanobacterium

5
species is capable of producing 3-4 types of toxins, and very little is known about why or when toxins are
produced throughout the life cycle of these organisms. There are in theory four pathways through which
cyanotoxins can impact human health: direct ingestion, via food webs, skin exposure, and through
inhalation. Unfortunately recognized treatment options are limited and tend to assume the presence of
high nutrient loads in afflicted bodies of water. (Mersereau, 2011)
While monitoring of toxin levels was not included within the scope of this report, coordination with the
Town of St. Andrews enabled phytoplankton monitoring activities to inform decisions concerning the
timing of sample collection for toxin analysis from Chamcook Lake. These external analyses did not
detect the presence of toxins in the lake water, and ECW was not aware of any other toxin analysis
performed on any of the study lakes during the time frame of this study. Analytical techniques to detect
the multitude of toxins produced by cyanobacteria are very underdeveloped, and the prohibitive costs of
existing techniques present challenges for assessing the risk associated with cyanobacteria presence in
this way.
2. Overview of Study Lakes
The three Southwest New Brunswick lakes under investigation for this project were Lake Utopia
(45°10'34.94"N, 66°47'13.13"W), Chamcook Lake (45°08'46.07"N, 67°05'30.13”W), and Digdeguash
Lake (45°13'19.06"N, 66°55'01.26”W). See Appendix A for a map of the study region and lakes. The
following sections cover a brief description of these lakes, including information pertaining to
morphology, ecology, and resource use in and around the lakes, where available.
Lake Utopia
Lake Utopia is the eastern most of the three lakes. Its approximate elevation is between 13 to 45 m above
sea level (Google Inc., 2009). Lake Utopia is situated in a coniferous valley with acidic soil. The lake is
located in the lower part of a watershed, whose total area is 87.9 km2
(Hanson-Lee, 2003). The lake itself
has a surface area of 13.8 km2
(Brylinsky, 2009) and a water volume capacity of 151 x 106
m3
(Hanson-
Lee, 2003). Its maximum and mean depths are 30.0 m and 11.1 m respectively (Brylinsky, 2009). A
detailed bathymetric map of Lake Utopia is provided in Appendix B. The lake’s shoreline length is 30.8
km (Brylinsky, 2009). Lake Utopia has a north-south orientation. Its shape can be described like a peanut,
which widens at either end in a deeper basin and has a narrow and shallower central region. Its length is
about 7.5 km and its width at the centre is about 0.72 km (Google Inc., 2009).
The results of a lake survey conducted by the NB DNR in 1979 indicate several fish species present in
Lake Utopia; including Atlantic salmon, alewife, brook trout, American eel, smallmouth bass, burbot,
yellow perch, white sucker, brown bullhead, and lake chub (NB DNR, 1979). The lake is also known to
contain a unique sympatric smelt pair. The trophic state of the lake at the time of the survey was reported
as being oligotrophic (NB DNR, 1979).
There are 130 waterfront property units on Lake Utopia, concentrated to the southeastern shoreline as
well as the Canal, which is located off the southwestern shore (Brylinsky, 2009). Recreational activities
on and around the lake include fishing, hunting, hiking, ATV riding, swimming, and pleasure boating.
There is a salmon hatchery and a pulp mill located on the lake; both draw water from the lake and the
hatchery also deposits effluent (Brylinsky, 2009). There are some forestry and agricultural activities, i.e.
blueberry and cranberry operations, within the lake’s watershed. Finally, there is also a run-of-the-river
hydroelectric dam downstream on the Magaguadavic River, which is located to the west of lake and
joined to it via the 2.6 km, multi-directional canal (Brylinsky, 2009), the operation of which reportedly
impacts water levels in the lake.

6
Concerns over the proliferation of cyanobacteria, particularly the species Microcystin aeruginosa, in Lake
Utopia have surfaced within the past several years, most recently prompting the Lake Utopia Water
Quality Assessment study by Brylinsky, 2009. Although there are records of individual reports dating
from 2003, persistent shoreline blooming of cyanobacteria from 2007-09 resulted in the lake being posted
to warn residents and recreational users about the dangers of exposure to the water, which precipitated
considerable public concern.
Chamcook lake
Chamcook Lake is the western most of the three lakes. Its approximate elevation is between 50 to 73 m
above sea level (Google Inc., 2009). The soil type of Chamcook Lake and surrounding land is dominated
by loamy, Humo-Ferric Podzols. Clay is an important component of this soil type (Wilder, 1977).
Chamcook Lake has a surface area of 3.38 km2, with a water volume capacity of 49.9 x 10
6 m
3 (Wilder,
1977). Its maximum and mean depths are 41.1 m and 11.3 m respectively (Wilder, 1977). A detailed
bathymetric map of Chamcook Lake is provided in Appendix B. The lake’s shoreline length is 9.76 km
(Wilder, 1977). Chamcook Lake is somewhat oval in shape, with a length and width of 3.61 km and 1.66
km respectively (Google Inc., 2009).
The results of a lake survey conducted by the NB DNR in 1969 indicate several fish species present in
Chamcook; including lake trout, brook trout, Atlantic salmon, American smelt, white sucker, American
eel, common shiner, yellow perch, lake chub, and pumpkinseed sunfish (NB DNR, 1969). There was no
trophic state reported for the lake at the time of the survey.
A survey from 2007 indicates that there are 54 waterfront property units on Chamcook Lake within a 75
m perimeter of the shoreline (FOREAU Consultants, 2008). Recreational activities on and around the lake
include fishing, hunting, hiking, ATV riding, swimming, and pleasure boating. There are also small-scale
forestry activities in the watershed area (FOREAU Consultants, 2008). Water abstraction from the lake is
allocated to a hatchery downstream of Chamcook Lake, to the Bayside Port, and to the Town of St.
Andrews for use as a public drinking water supply. There is also a dammed wetland in southeast corner of
the lake (FOREAU Consultants, 2008).
There were reports of the appearance of shoreline cyanobacteria blooms in the lake in August of 2010,
which precipitated considerable concern among lake residents, as well as the nearby Town of St.
Andrews, which sources its drinking water from Chamcook Lake. This monitoring effort came about in
response to these concerns, following consultation and coordination with the municipality and NB
DENV, to supplement and expand the reach the existing monitoring activities planned and carried out by
DENV.
Digdeguash Lake
Digdeguash Lake is located slightly north and in between the two other study lakes. It sits at an elevation
between 39 to 63 m above sea level (Google Inc., 2009). Similar to Lake Utopia, Digdeguash Lake is also
situated in a coniferous valley surrounded by slopes and plains with acidic soil. At the area of the western
and southern drainage of the lake, the soil is dry, with low fertility. Digdeguash Lake has a surface area of
4.12 km2
(NB DNR, 1970) and a water volume capacity of 22.4 x 10⁶ m
3 (Hanson-Lee, 2001). Its
maximum and mean depths are 20.4 m and 4.69 m respectively (NB DNR, 1970). A detailed bathymetric
map of Digdeguash Lake is provided in Appendix B. The lake’s shoreline, or perimeter length, is 22.9 km
(NB DNR, 1970). Digdeguash Lake has a north-south orientation, similar to Lake Utopia; however,
unlike Lake Utopia, its shape is long and narrow. The length and width of Digdeguash Lake is about 6.51
km and 0.60 km respectively (Google Inc., 2009).

7
The results of a lake survey conducted by the NB DNR in 1970 indicate several fish species present in
Digdeguash Lake; including smallmouth bass, brown bullhead, yellow perch, pumpkinseed sunfish, white
sucker, American smelt, American eel, brook trout, and fallfish (NB DNR, 1970). In addition, Hanson-
Lee identified white perch, rainbow smelt, burbot, golden shiner, common shiner, banded killifish, and
pearl dace in a 2001 report. The trophic state of the lake at the time of NB DNR’s survey was reported as
being oligotrophic (NB DNR, 1970).
A report generated in 2001 by ECW identifies 65 property owners around the lake (Hanson-Lee, 2001).
As with the other two lakes, recreational activities on and around Digdeguash include fishing, hunting,
hiking, ATV riding, swimming, and pleasure boating. There is a salmon hatchery immediately
downstream of Digdeguash Lake, on Linton Stream on the eastern side of the lake, which withdraws
water from the lake. There is also a dam on the lake in the vicinity of this hatchery, which is owned and
operated by J.D. Irving. The dam is reported to have been in various stages of disrepair in recent years,
although a fish latter was constructed in 2010 (Hanson-Lee, 2001).
In 2011, during the production of this study, residents of Digdeguash Lake have reportedly expressed
concerns of diminishing fish stocks to the Department of Fisheries and Oceans. There was also reportedly
above-normal variation in water levels on the lake throughout the study period, as a result of the
breaching and subsequent restoration of a small dam at the outlet of the lake following the significant
flooding in the region that occurred in December of 2010. However, there were no known concerns over
cyanobacteria in the lake prior to this study.
3. Methodology
3.1 Monitoring Stations and Regime
Seven, six and four sample sites, at Lakes Utopia, Chamcook and Digdeguash respectively, were
monitored for this project, the locations of which are identified in Appendix D. The sample sites that were
monitored are long-standing, having been established by the NB DENV in the 1970s. These same sites
were chosen to facilitate comparisons with historical data. The following sections provide detailed
information on the activities that occurred at each of the three lakes, which includes sampling and
analysis for water quality, sediment chemistry, and phytoplankton characterization and abundance. For
the purpose of this report, the monitoring regime has been divided into three distinct periods: early
summer (late June to mid-July), late summer (mid-August to early-September), and fall (early
November). The precise dates of sampling events are outlined in Table 2.
3.2 Water Quality
To assess water quality, surface water data was collected from all 17 sample sites across the three lakes
(refer to Appendix D for information on sample sites). Throughout the course of this study, monitoring
for lake conditions and water quality occurred three times from late June until early November. The
following chart indicates when each lake was visited:
Table 2: Dates of sampling events that took place on each lake for lake conditions and water quality
Lake Early Summer Late Summer Fall
Utopia July 04, 2011 Sept. 08 2011 Nov. 03, 2011
Chamcook July 07, 2011 Aug. 24, 2011 Nov. 07, 2011
Digdeguash June 23, 2011 Aug. 18, 2011 Nov. 03, 2011
Upon arrival at each sample site, a hand-held YSI multi-meter was used to record water temperature,
dissolved oxygen, and conductivity at about 15 cm below the water surface. Secchi depth was assessed

8
using a Secchi disc and lake depth was measured using the rope from the boat’s anchor. As well, surface
pH was measured with an EcoSense pH10A pen.
Lake level data on each of the lakes was compiled from various volunteer monitors along with federal and
municipal government. These measurements were compiled for each lake and compared to
Environmental Canada precipitation data for the nearby town of St. Stephen, NB.
In addition to onsite measurements, surface water grab samples (at about 15 cm below surface) were
collected and couriered overnight to the Analytical Services Section of the NB DENV in Fredericton. The
samples were analyzed for all 31 parameters comprising the *B analytical package for surface water and
aquatic protection (NBDENV, n.d.; Appendix C) as well as chlorophyll a. Each sampling unit consists of
5 sample bottles: 2x125mL and 2x500mL for *B and 1x1L for chlorophyll a. While all this data is
valuable and will contribute to baseline monitoring data, the following parameters have been isolated and
scrutinized more closely in the present study due to their demonstrated associations with trophic status
and cyanobacteria abundance: total nitrogen, total phosphorus, total organic carbon, aluminum, and
chlorophyll a.
The impact of water depth on water chemistry has also been taken into consideration through the
collection of depth samples. This occurred at select sites on the lakes: two sample sites on both Lake
Utopia (AQ0001 and AQ0005) and Chamcook Lake (AR0010 and AR0012) (chosen strategically through
coordination with DENV), and one site on Digdeguash Lake (AQ0018). Using a Kemmerer device, grab
samples were obtained at Secchi depth, mid-depth, and lake bottom and analyzed for chlorophyll a, and
the *B parameters respectively. Stratification of the water column at these depth sites was also measured.
This exercise consisted of taking temperature and dissolved oxygen measurements at one-meter intervals
throughout the water column to a maximum depth of 15m, the extent of the YSI cable, or up to one meter
above lake bottom where depth was less than 15m.
In consideration of time sensitive events, a continuous multi-probe data logger was installed in each lake
on two week intervals over the sampling season. The Manta 2 Water Quality Multiprobe data logger is
equipped with a Turner Instruments Cyclops 7 Phycocyanin probe, Eureka Environmental Manta 2
temperature sensor, Eureka Environmental Manta 2 Conductivity Sensor, Eureka Environmental Manta 2
Clark Dissolved Oxygen Sensor, and a Eureka Environmental Manta 2 pH sensor. This data was
compared to that data obtained from the YSI multiprobe, DENV Analytical Services, and phytoplankton
analyses.
3.3 Sediment Chemistry
Sediment chemistry was analyzed to determine if significant nutrient availability within lake sediment
may contribute to the proliferation of cyanobacteria. In conjunction with the early summer and fall
sampling events for lake conditions and water quality described above (Table 2), sediment samples were
also collected using an Eckman grab sampler. Sediment samples were collected from the same sites as
those used for determination of water quality conditions: two sample sites on both Lake Utopia (AQ0001
and AQ0005) and Chamcook Lake (AR0010 and AR0012), and one site on Digdeguash Lake (AQ0018).
The location of these sites on each of the lakes is provided in Appendix D. Sediment samples were
couriered overnight to the Research and Productivity Centre in Fredericton immediately following
sampling. The samples were analyzed for total nitrogen, total phosphorus, total organic carbon, and
aluminum.
3.4 Phytoplankton Characterization and Abundance
Two phases of phytoplankton sampling, in early and late summer, were conducted to capture changes in
phytoplankton community dynamics at peak population growth across this period (presumed to occur in

9
late summer in conjunction with maximum surface water temperature). Surface grab samples of 500mL
were collected from the same five sites across the three lakes that were used for sediment sampling and
water depth analysis of lake conditions and water chemistry: two sample sites on both Lake Utopia
(AQ0001 and AQ0005) and Chamcook Lake (AR0010 and AR0012), and one site on Digdeguash Lake
(AQ0018). At each site, two phytoplankton samples were collected, one at the surface and one at Secchi
depth, for a total of 10 samples. A Kemmerer water sampler was used to obtain the Secchi depth sample.
Phytoplankton samples were sent to M.A. De Sève Consultants in Quebec for species identification and
determination of overall and relative abundance of the species present, as well as overall and relative
biomass. The phycocyanin probe data from the Manta 2 Water Quality Multiprobe was also used to
estimate relative abundance of cyanobacteria cells, and the resultant data was compared to that obtained
from De Sève laboratory.
4. Results and Discussion
4.1 Water Temperature and Dissolved Oxygen
Three depth profiles, in the mid-summer, late summer and fall, were conducted on select sites in each of
the lakes to illustrate the occurrence and changes in water stratification throughout the monitoring period.
Figure 1: Temperature-depth profiles for Lake Utopia across the monitoring regime from early summer (July 4, 2011) to fall
(Nov. 3, 2011). The graphs depict both temperature (circle points) and dissolved oxygen (square points) on the x-axis. In the
early and late summer sampling events, measurements were taken at site AQ0001, while in the last sampling event (Nov. 3,
2011) measurements were taken at site AQ0005 to capture a deeper profile.

10
Figure 2: Temperature-depth profiles for Chamcook Lake across the monitoring regime from early summer (July 7, 2011) to
fall (Nov. 7, 2011). The graphs depict both temperature (circle points) and dissolved oxygen (square points) on the x-axis.
Measurements were taken at site AR0012.
Figure 3: Temperature-depth profiles for Digdeguash Lake across the monitoring regime from early summer (June 23, 2011)
to fall (Nov. 3, 2011). The graphs depict both temperature (circle points) and dissolved oxygen (square points) on the x-axis.
Measurements were taken at site AQ0018.
In general the relationship between dissolved oxygen and temperature is that water is more saturated with
oxygen at cooler temperatures, resulting in higher concentrations of dissolved oxygen at low
temperatures. Dissolved oxygen within a eutrophic system tends be low (0-5 mg/L) as a result of the
high oxygen requirement of decomposing plant life, while oligotrophic lakes are associated with high
levels of dissolved oxygen (> 10 mg/L) (British Columbia Deparment of Environment). The results from
Chamcook Lake (Figure 2) are the most typical of lake environments, with a well-stratified water column
throughout which dissolved oxygen increases as temperature decreases. The last of the three graphs

11
shows a typical winter stratification profile for an oligotrophic lake (British Columbia Deparment of
Environment). The dissolved oxygen levels in Chamcook ranged from 8.5-12.48mg/L, suggesting
mesotrophic to oligotrophic conditions.
It is possible that the different results from Lake Utopia (Figure 1) could be explained by the sampling
dates. The first sampling was taken in early July, so the lack of clear stratification may be due to the fact
that the lake had just completed spring turnover and was starting to stratify. It should also be noted that
because of the modest lake depth at site AQ0001, we may have seen more stratification if there were
available data at greater depths. Similarly, since the late summer sample was not taken until early
September, the beginning of fall turnover may explain the atypical shape of this profile. The last profile
is typical of winter stratification. Dissolved oxygen levels in Lake Utopia ranged from 8.35-10.81 mg/L
suggesting mesotrophic conditions.
Perhaps the most interesting results come from Digdeguash Lake (Figure 3). The results from the late
June sampling show the beginnings of a typical summer stratification profile. However, the August
profile shows a decrease in oxygen with depth, and a corresponding and expected decrease of
temperature. The dissolved oxygen levels dipped to a low of 4 mg/L, a level that can compromise the
ability of the ecosystem to support healthy fish stocks. Though historically Digdeguash is not known to
have experienced cyanobacteria blooms, the results of phytoplankton monitoring performed (outlined in
greater detail in Section 4.5 below) during the course of this study suggest cyanobacteria may be
outcompeting other forms of cyanobacteria and increasing in abundance, which was confirmed by visual
inspections of the shoreline. The results of the August profile are reflective of the larger changes taking
place in Digdeguash Lake in response to the proliferation of cyanobacteria that occurred unexpectantly in
late summer. The November reading shows typical winter stratification and the highest dissolved oxygen
levels, peaking at 11.19 mg/L.
4.2 pH, Conductivity, and Alkalinity
The levels of major ions present in water, such as described by pH, conductivity, and alkalinity, reflect a
lake’s ability to withstand or buffer against external pressures, and as such, these parameters are routinely
quantified to support surface water monitoring efforts. In aquatic systems, respiration is a major source
of carbon dioxide, which acts to lower water pH. Alternatively, aquatic plants and algae consume carbon
dioxide and raise water pH (EC, 2011). Table 3 summarizes the pH conductivity and alkalinity data for
the three study lakes.
Table 3: Summary data of pH, conductivity, and alkalinity detected across the monitoring regime from surface grab samples
taken at each of the study lakes. These parameters were analyzed by the NB DENV Fredericton Analytical Services. A detailed
data spreadsheet is provided in Appendix E.
Lake
pH Conductivity (us/cm) Alkalinity (mg/L)
Min. Max. Avg. Min. Max. Avg. Min. Max. Avg.
Utopia 6.80 7.27 7.04 33.50 43.40 36.85 6.42 8.38 7.11
Chamcook 7.06 7.27 7.16 31.50 35.70 33.34 5.85 6.75 6.15
Digdeguash 6.57 6.89 6.66 21.40 27.40 24.34 2.77 3.79 3.38
The pH levels exhibited by all three lakes are within the neutral range of 6.5-8.5, though it should be
noted that Digdeguash is at the lower end of this range. The pH values obtained from the external
laboratory compare well with the field data average, which were 6.99 for Lake Utopia, 7.15 for
Chamcook Lake, and 6.43 for Digdeguash Lake. The pH data from the continuous data logger was much
higher, for example for Chamcook Lake the data logger found an average pH of 8.06, well above average
value found by the lab and with our field meter. Despite regular calibration, the pH readings derived from
the Mata 2 pH probe were considered inaccurate, so for this reason the data logger’s pH data was not used
in further analysis. The conductivity results in the lakes are much lower than what one would expect for a

12
fresh water system, since typical conductivity levels in surface waters range from 50-1500 us/cm
(Spooner, 2007). Similar conductivity results were found using both the YSI and Manta2 mutliprobe
devices. However, conductivity is a measurement of the ability of water to carry a current and increases
as the amount of dissolved ions increases, so these low level results suggest the absence of dissolved
metals in the water, which in itself is not a concern for overall water quality. The alkalinity results for the
lakes suggest a poor buffering capacity, typically an alkalinity range of 50-500mg/L is considered of
satisfactory quality (Spooner, 2007). The low alkalinity values for these lakes suggest that they have the
potential to be corrosive in nature, with a low capacity to buffer acidic conditions.
4.3 Transparency and Chlorophyll a
Water transparency, which was measured with the use of a Secchi disc, along with chlorophyll A levels
can be used to assess lake productivity, i.e. phytoplankton production, and thus trophic state. Secchi disc
readings taken throughout the monitoring period suggest Chamcook Lake demonstrated the clearest water
with a Secchi depth average of 6.0 m. Lake Utopia follows with a Secchi depth average of 2.7 m, and
Digdeguash Lake, with the lowest transparency measure as compared to the other two lakes, indicated a
Secchi depth average of 1.8 m. The graph depicted in Figure 4 shows a comparison of average Secchi
depth readings taken across the three lakes periodically between mid-summer and fall. Secchi depth
readings did not appear to be influenced temporally by the change in seasons.
When comparing the Secchi disc readings to chlorophyll a levels at respective sample sites, though slight,
there appears to be a negative correlation (Figure 5). As Secchi depth increases, chlorophyll a
concentration decreases, which is what is to be expected since chlorophyll A is a proxy for the abundance
of micro and macro plant life in an aquatic ecosystem, which has an obvious bearing on transparency.
Figure 4: Comparison of lake transparency across the three study lakes as measured by Secchi disc depth. Secchi depth points
in the graph represent averages taken across sampling sites within each lake on the various days they were visited.

13
Figure 5: Graph depicting a negative correlation between Secchi depth and chlorophyll a levels at respective sample sites and
events across the three study lakes.
4.4 Surface Water and Sediment Chemistry
The following is a discussion of total nitrogen, total phosphorus, total organic carbon, and aluminum
results for both water and soil samples. While all aspects of water quality measured in the *B analytical
package were not analyzed as part of this study, the raw data is provided in Appendix F.
Phosphorus is an essential nutrient for all living organisms and it is commonly the first nutrient to limit
productivity (CCME, 2004). Phosphate ions (PO43-
) (i.e. inorganic phosphate) are what plants require for
nutrition, whose concentration increases with the increase of total phosphorus (TP). Therefore, TP is used
as a meaningful measure of phosphorus in surface water (CCME, 2004). Nutrient levels in these lakes
(depicted in Figure 6) are low for those expected to support cyanobacteria blooms. For example, based on
present surface water results for phosphorus (TP) levels, Utopia and Digdeguash are both classified as
oligotrophic lakes (0.004 - 0.010 mg/L) and Chamcook, surprisingly, is classified as ultra-oligotrophic
(<0.004 mg/L) (CCME, 1999). The levels of nitrogen across all the sites in all the lakes were undetectable
(Figure 6), meaning they are either very low or non-existent. According to traditional assumptions, this
lack of available nutrients suggests the presence of cyanobacteria blooms is unlikely. However, the
ability of many cyanobacteria species to store nutrients internally questions whether traditional water
quality indices can be accurately interpreted as reflective of the available supply of nutrients.
Given the capacity of many cyanobacteria species to utilize nutrients bound to sediment, the study also
encompassed an examination of the nutrient levels in lake sediment. This data serves as baseline data
since there was an absence of sediment sampling in the past. Furthermore, a lack of standardized
guidelines or indicators to serve as a bench mark suggests that the application of this data should be
limited to relative spatial and temporal comparisons in the future, within each individual lake.
Nonetheless, the results of the sediment chemistry testing from this study (Figure 6) indicate that there is
availability of both phosphorus and nitrogen in the sediment at bottom of all lakes. The lack of nutrients
Negative Correlation between Secchi Depth and Chlorophyll a Concentration

14
throughout the water column combined with their availability in bottom sediments further supports the
hypothesis that cyanobacteria are able to access nutrients from sediments, particularly during turnover
events, and store nutrients for extended periods of time.
Figure 6: Summary column graphs show comparative phosphorus and nitrogen levels detected in surface water and
sediment between the three study lakes and across the monitoring regime. Where there is no bar indicated for water
phosphorus in Chamcook Lake, levels were below the minimum detection level of 0.005mg/L.
The total organic carbon (TOC) levels in the lake could help to explain the proliferation of bacteria
blooms in these lakes, in addition to corroborating the Sechi depth transparency results. In freshwater,
environmental TOC levels are usually greater than 2 mg/L and less than 10 mg/L (British Columbia
Deparment of Environment, 2011). The results for all of our lakes fall well within this range (Error!
Reference source not found.).
Greater levels of TOC are associated with discoloured lakes, sometimes called tea coloured. One should
note that the level of TOC in the lakes mirrors the Secchi disk data; Digdeguash has the highest levels of
TOC and the lowest transparency, Chamcook has the lowest TOC levels and the highest transparency.
Organic Carbon data is too general of a parameter to allow inferences concerning the source of organic
carbon, but high TOC can be caused by waste materials and effluents. Since these effluents may provide
the necessary nutrients for cyanobacteria to flourish, TOC can be an indication of organic contamination,
which could lead to blooms. As the levels in our lakes were within the normal range and no testing was
PHOSOPHORUS NITROGEN
Water Sediment Water Sediment
Early
Summer
TN levels at all
sample sites across
the three lakes were
below the
minimum detection
level of 0.3 mg/L
Late
Summer
no data
TN levels at all
sample sites across
the three lakes were
below the
minimum detection
level of 0.3 mg/L
no data
Fall
TN levels at all
sample sites across
the three lakes were
below the
minimum detection
level of 0.3 mg/L

15
done for organic contaminants, there is not enough information to derive make clear conclusions at this
time.
Sediment samples were also analyzed for aluminum (Al), due to its ability to sequester nutrients and
render them biologically unavailable for cyanobacteria (Norton et al., 2008). It is important to consider Figure 7: Summary column graphs show comparative organic carbon and aluminum levels detected in surface water and
sediment between the three study lakes and across the monitoring regime.
that too much metal in a lake can become detrimental to the overall quality of the lake. Standards for
water metal concentrations put forth by the Canadian Council of Ministers of the Environment indicate a
tolerance limit of 0.1mg/L for Al (CCME, 1999). Results for our lakes (Error! Reference source not
found.) fall well within this limit set for aquatic life protection, with the exception of Digdeguash where
the average surface water Al concentration during the early July 2011 sampling event was 0.13mg/L.
Contrary to indications that nutrient levels and the availability of aluminum as a nutrient sequestering
metal have a bearing on the proliferation of cyanobacteria, the present data set does reveal any obvious
patterns. Natural variability of nutrient and metal levels across the three lakes is apparent (Error!
Reference source not found.).
ORGANIC CARBON ALUMINUM
Water Sediment Water Sediment
Early
Summer
Late
Summer
no data
no data
Fall
16
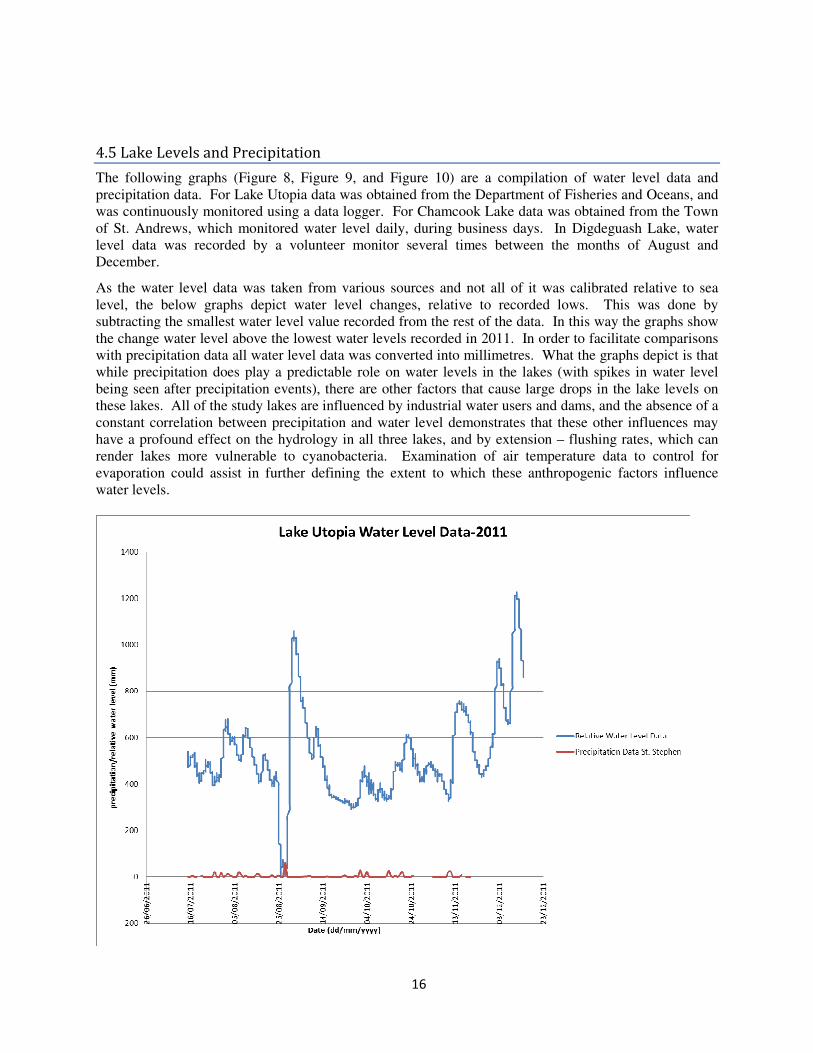
4.5 Lake Levels and Precipitation
The following graphs (Figure 8, Figure 9, and Figure 10) are a compilation of water level data and
precipitation data. For Lake Utopia data was obtained from the Department of Fisheries and Oceans, and
was continuously monitored using a data logger. For Chamcook Lake data was obtained from the Town
of St. Andrews, which monitored water level daily, during business days. In Digdeguash Lake, water
level data was recorded by a volunteer monitor several times between the months of August and
December.
As the water level data was taken from various sources and not all of it was calibrated relative to sea
level, the below graphs depict water level changes, relative to recorded lows. This was done by
subtracting the smallest water level value recorded from the rest of the data. In this way the graphs show
the change water level above the lowest water levels recorded in 2011. In order to facilitate comparisons
with precipitation data all water level data was converted into millimetres. What the graphs depict is that
while precipitation does play a predictable role on water levels in the lakes (with spikes in water level
being seen after precipitation events), there are other factors that cause large drops in the lake levels on
these lakes. All of the study lakes are influenced by industrial water users and dams, and the absence of a
constant correlation between precipitation and water level demonstrates that these other influences may
have a profound effect on the hydrology in all three lakes, and by extension – flushing rates, which can
render lakes more vulnerable to cyanobacteria. Examination of air temperature data to control for
evaporation could assist in further defining the extent to which these anthropogenic factors influence
water levels.

17
Figure 8:Lake Utopia Relative water level data compared to precipitation data
Figure 9: Relative Water Level Data compared to precipitation Chamcook Lake

18
Figure 10: Water Level Data compared to precipitation Digdeguash Lake
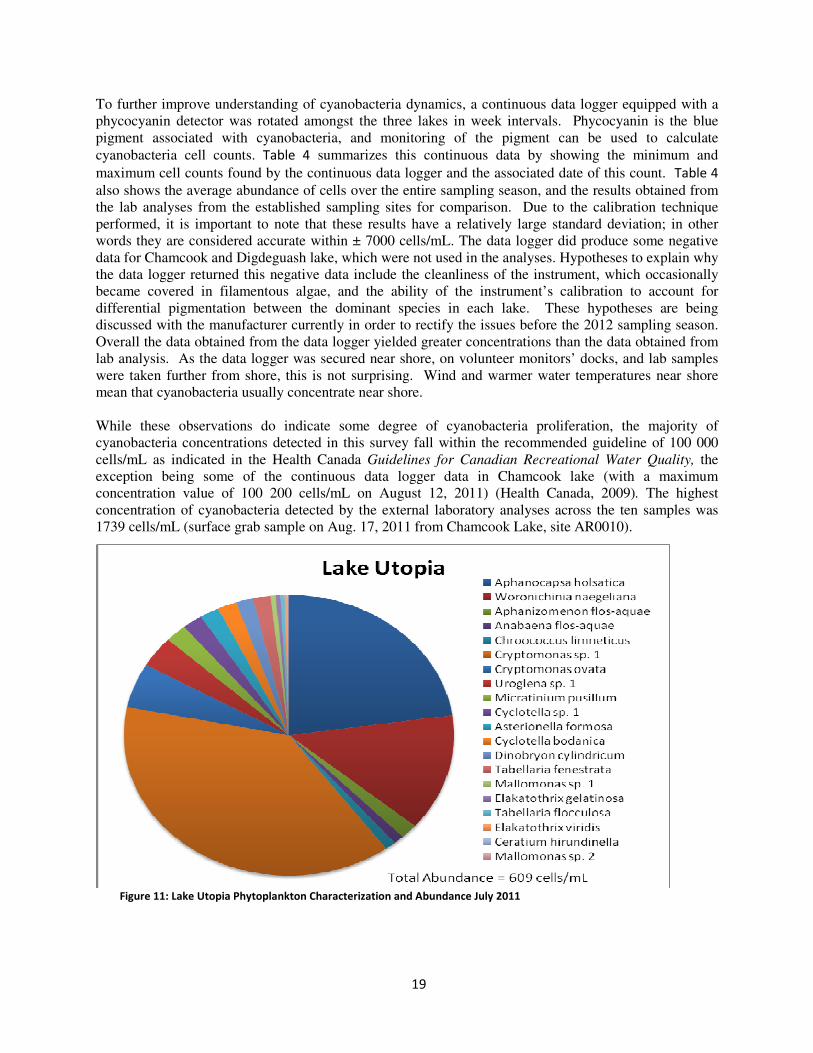
4.6 Phytoplankton Characteristics and Abundance
Field observations gave no indication that Lake Utopia experienced a proliferation of cyanobacteria
during the study period. Chamcook Lake and Digdeguash Lake, on the other hand, both exhibited some
degree of blooming given the appearance of characteristic shoreline scum accumulation. Phytoplankton
lab analyses substantiated these observations. From July to August, total phytoplankton abundance
observed from surface grab samples in Utopia decreased by 20% (Appendix H Tables 1a and b). In
contrast, phytoplankton abundance in both Chamcook and Digdeguash increased by 503% and 117%
(Appendix H tables 2a, 2b, 3a, and 3b) respectively during the same period, mostly attributed to increases
in cyanobacteria abundance. In these two lakes, the dominant cyanobacteria species detected at peak
observation are Gloeotrichia echinulata and Merismopedia tenuissima in Chamcook and Digdeguash
respectively. In Chamcook Lake, an active municipal drinking water supply, cyanobacteria made up and
alarming 91% of the total phytoplankton community in August sampling. More information on the
relative abundance and biodiversity dynamics of the phytoplankton communities across the three lakes is
provided in Appendix H. Graphical representations of phytoplankton characterization and abundance are
found in Figure 11 through to Figure 16. It should be noted, that because this study included testing at pre-
determined sites, the samples for phytoplankton were not taken where blooms were observed, areas that
were likely subject to greater densities of cyanobacteria.
19
To further improve understanding of cyanobacteria dynamics, a continuous data logger equipped with a
phycocyanin detector was rotated amongst the three lakes in week intervals. Phycocyanin is the blue
pigment associated with cyanobacteria, and monitoring of the pigment can be used to calculate
cyanobacteria cell counts. Table 4 summarizes this continuous data by showing the minimum and
maximum cell counts found by the continuous data logger and the associated date of this count. Table 4
also shows the average abundance of cells over the entire sampling season, and the results obtained from
the lab analyses from the established sampling sites for comparison. Due to the calibration technique
performed, it is important to note that these results have a relatively large standard deviation; in other
words they are considered accurate within ± 7000 cells/mL. The data logger did produce some negative
data for Chamcook and Digdeguash lake, which were not used in the analyses. Hypotheses to explain why
the data logger returned this negative data include the cleanliness of the instrument, which occasionally
became covered in filamentous algae, and the ability of the instrument’s calibration to account for
differential pigmentation between the dominant species in each lake. These hypotheses are being
discussed with the manufacturer currently in order to rectify the issues before the 2012 sampling season.
Overall the data obtained from the data logger yielded greater concentrations than the data obtained from
lab analysis. As the data logger was secured near shore, on volunteer monitors’ docks, and lab samples
were taken further from shore, this is not surprising. Wind and warmer water temperatures near shore
mean that cyanobacteria usually concentrate near shore.
While these observations do indicate some degree of cyanobacteria proliferation, the majority of
cyanobacteria concentrations detected in this survey fall within the recommended guideline of 100 000
cells/mL as indicated in the Health Canada Guidelines for Canadian Recreational Water Quality, the
exception being some of the continuous data logger data in Chamcook lake (with a maximum
concentration value of 100 200 cells/mL on August 12, 2011) (Health Canada, 2009). The highest
concentration of cyanobacteria detected by the external laboratory analyses across the ten samples was
1739 cells/mL (surface grab sample on Aug. 17, 2011 from Chamcook Lake, site AR0010).
Figure 11: Lake Utopia Phytoplankton Characterization and Abundance July 2011

20
Figure 12:Lake Utopia Phytoplankton Characterization and Abundance August 2011
Figure 13:Chamcook Lake Phytoplankton Characterization and Abundance July 2011

21
Figure 14:Chamcook Lake Phytoplankton Characterization and Abundance August 2011
Figure 15: Digdeguash Lake Phytoplankton Characterization and Abundance July 2011

22
Figure 16:Digdeguash Lake Phytoplankton Characterization and Abundance August 2011
Table 4: Comparison of continuous data logger data to lab data over the 2011 sampling season
Lake Name
Cells of Cyanobacteria (cells/mL)
Data Logger Data Lab Data
Min Max Avg. July Sampling
August Sampling
Date
Cell
Count Date
Cell
Count
Cell
Count Site
Cell
Count Site
Cell
Count
Utopia 20-Sep 359 26-Oct 36,340 3,226
AQ0001 312 AQ0001 168
AQ0005 243 AQ0005 39
Chamcook 4-Jul 509 12-Aug 100,200 4,077
AR0010 126 AR0010 1,739
AR0012 106 AR0012 1,041
Digdeguash 12-Sep 112 23-Aug 42,070 3,144 AQ0018 365 AQ0018 885
4.7 Trophic States of the Three Lakes
To assess trophic states of the three study lakes the study season, transparency, chlorophyll a, and
phosphorus concentrations were examined at the late summer sampling period to capture the conditions
when water temperatures were at their highest. Only surface depth data was considered; mid-depth and
bottom depth data were ignored for simplicity, as they were not anticipated to influence the outcome.
Peak water temperatures in lakes correspond with peak production of phytoplankton and chlorophyll a
concentration, and thus reflect productivity potential. Results from the late summer sampling period for

23
this study are summarized in Table 5. The results suggest that Chamcook Lake is oligotrophic across all
indicator parameters. Lake Utopia and Digdeguash Lake, on the other hand, show mixed results. Lake
Utopia’s results reflected characteristics of all three trophic states across different parameters. According
to Secchi depth, this lake is classified as eutrophic, according to chlorophyll a concentration it is
mesotrophic, and according to total phosphorus it is oligotrophic. These conflicting results suggest that
typical correlations between these parameters do not hold in this case, and water quality dynamics in
Utopia appear be in a state of flux. Digdeguash also has a shallow Secchi depth and is classified as
eutrophic according to the standards set for this parameter. According to chlorophyll a and total
phosphorus, however, it is considered an oligotrophic lake. To some degree, recent appearances of
cyanobacteria proliferation in all three lakes question the application of these conventional techniques to
evaluate trophic status and approximate water quality conditions. The complexity of these aquatic
ecosystems appears not to be conducive to such simplistic classifications, and suggest that a much broader
scope of factors must be taken into consideration.
Table 5: Summary of average values across the three study lakes of the key trophic state indicator parameters as detected in
the late summer sampling period to capture peak biological productivity when water temperatures are at their
Lake Date Secchi depth (m) Chlorophyll a (ug/L) Total Phosphorus
(mg/L)
Utopia Sept. 8, 2011 2.3 4.21 0.0083
Chamcook Aug. 25, 2011 6.0 2.45 < 0.0005
Digdeguash Aug. 18, 2011 1.5 2.88 0.0065
The explanation as to why the Sechi depths are at odds with assumed correlations with total phosphorus
readings may be related to the observed total organic carbon values. As discussed earlier, higher levels of
TOC are associated with discolouration of lakes and water colour alone has the potential to significantly
influence Secchi disc readings. The DENV laboratory assessed the water clarity in Lake Utopia and
Digdeguash Lake as having relatively high colour value averages across the entire monitoring period,
50.5 and 79.4 ACU respectively, in comparison to Chamcook Lake, which has a colour value average of
10.5 ACU. Assuming this discoloration is caused by organic carbon concentrations, it would not be
reflected in total phosphorus, or other physical water quality parameters.
5. Conclusions
Results indicate a highly complex relationship between cyanobacteria and lake chemistry, highlighting
the need for a holistic approach to lake monitoring. While many of the traditional indicators point to high
water quality and good lake health, the presence of cyanobacteria blooms suggests the lakes may be
undergoing changes in trophic status. Overall, dissolved oxygen profiles of the lakes show signs of good
water quality, though the late summer results for Digdeguash suggest that this may be changing. The pH
of the lakes is within a neutral range, but when combined with the conductivity and alkalinity data,
suggest that the lakes would be unable to buffer against potential future acidic events. The presence of
higher concentrations of total organic carbon may be the cause of water discoloration in Lake Utopia and
Digdeguash, which may contribute to relatively low Secchi depth readings, however the source of organic
carbon cannot be determined within the scope of the study. The lack of nutrients within the water column
suggests that the role of turnover and soil nutrient availability may be particularity important to the
observed proliferation of cyanobacteria in these lakes. It is clear that conventional relationships between
physical water quality and cyanobacteria proliferation do not apply to these lakes, which suggests the
need to adopt an approach to lake monitoring and management that encompasses broader considerations,
such as the influence of cyanobacteria biology and hydrological dynamics on these complex ecosystems.

24
6. Recommendations
A. Future research efforts should include a comparison of data from this present monitoring project
to historical data, and to data collected by other stakeholders where available, to identify and
monitor trends.
B. Effort should be made to implement a long term and more consistent (standardized) water level
recording program. While intermittent and data is available from lake volunteers, it is
increasingly recognized that hydrology plays an important role in facilitating the conditions
required to support great numbers of cyanobacteria, so more time and resources should be
directed to these efforts.
C. Hydrological studies should be performed for all three lakes, inclusive of water balances, to
determine if existing anthropogenic factors influencing hydrology, notably water abstraction and
dams, are significantly influencing flushing rates, thus rendering lakes vulnerable to increased
cyanobacteria abundance.
D. Future monitoring programs should include testing for organic contaminants associated with the
residential, recreational, and industrial uses of these lakes. This data could help to distinguish
whether the TOC levels in Lake Utopia and Digdeguash are caused by natural or anthropogenic
factors.
E. Future sampling programs should include sampling in shoreline areas of observed cyanobacteria
blooms as the current static site method does not take into account the influence of wind, or
localized cyanobacteria blooms.
F. Period monitoring (e.g. 5 year intervals) of nutrient levels in benthic sediments should be
performed to supplement more frequent monitoring of nutrient levels in the water column, in
order to ascertain the changing capacity of lakes to support cyanobacteria growth.
G. It is possible that the exceptionally low nutrients detected in the water column of all three lakes
with demonstrated vulnerability to cyanobacteria blooms, could be explained by the capacity of
cyanobacteria species to store nutrients. The availability of analytical tests to quantify total
nutrient concentration, inclusive of those stored by micro-organisms, should be investigated.
H. Literature reviews of the predominant cyanobacteria species plaguing New Brunswick lakes
should be performed to improve understanding of the conditions that support their proliferation,
and of the risks associated with their presence in waters used for recreation and potable purposes.
I. Where available, additional toxin analyses should be performed to reduce risks associated with
exposure to cyanotoxins. In particular, analysis to detect the presence β-Methylamino-L-alanine
(BMAA) should be performed on samples from lakes undergoing bloom conditions, since this
toxin is associated with elevated incidences of neuro-degenerative disorders in humans, through
both consumption and inhalation pathways.

25
References
Bellinger EG, Sigee DC. 2010. Freshwater Algae: Identification and Use as Bioindicators. John Wiley &
Sons, Ltd., West Sussex, UK.
British Columbia Deparment of Environment . (n.d.). Ambient Water Quality Criteria for Dissolved
Oxygen. Retrieved February 28, 2012, from Environmental Protection Division:
http://www.env.gov.bc.ca/wat/wq/BCguidelines/do/do-02.htm
British Columbia Deparment of Environment. 2011. Water Quality. Retrieved February 28, 2012, from
Environmental Protection Division:
http://www.env.gov.bc.ca/wat/wq/BCguidelines/orgcarbon/definitions.html
Brylinksy M. 2009. Lake Utopia Water Quality Assessment. Commissioned by the New Brunswick
Department of the Environment.
Canadian Council of Ministers of the Environment (CCME). 1999. Canadian Water Quality
Guidelines for the Protection of Aquatic Life. Available online http://ceqg-rcqe.ccme.ca/.
Canadian Council of Ministers of the Environment (CCME). 2004. Canadian Water Quality Guidelines
for the Protection of Aquatic Life – Phosphorus: Canadian
FOREAU Consultants. 2008. Chamcook Watershed Description and Management Plan-Final Report.
Edmunston NB.
Google Inc. 2009. Google Earth (Version 5.1.3509.4636) [Software]. Available online
http://www.google.com/earth/download/ge/agree.html.
Hanson-Lee M. 2003. The Water Quality of Lake Utopia.
Hanson-Lee M. 2001. The Water Quality of Digdeguash Lake: Community Lake Education Monitoring.
Health Canada. 2009. Guidelines for Canadian Recreational Water Quality. Available online
http://www.hc-sc.gc.ca/ewh-semt/consult/_2009/water_rec-eau/draft-ebauche-eng.php.
Mersereau, R. 2011. Summary of the ‘Cyanobacteria and Human Health’ Conference. Report to the
Town of St. Andrews, submitted August 18, 2011.
New Brunswick Department of Natural Resources (NB DNR). 1969. Lake Survey Summaries:
Chamcook. Available online http://www.unb.ca/research/institutes/cri/nbaquatic/reports.html.
New Brunswick Department of Natural Resources (NB DNR). 1970. Lake Survey Summaries:
Digdeguash. Available online http://www.unb.ca/research/institutes/cri/nbaquatic/reports.html.
New Brunswick Department of Natural Resources (NB DNR). 1979. Lake Survey Summaries: Utopia.
Available online http://www.unb.ca/research/institutes/cri/nbaquatic/reports.html.
New Brunswick Department of the Environment (NB DENV). n.d. *B Package Information.
Retrieved on April 20, 2011, from Analytical Services Section, Fredericton.

26
Norton SA, Coolidge K, Amirbahman A, Bouchard R, Kopácek J, Reinhardt R. 2008. Speciation of Al,
Fe, and P in recent sediment from three lakes in Maine, USA. Sci Total Environ. 404(2-3):276-83.
Organization for Economic Cooperation and Development (OECD) 1982. Eutrophication of Waters.
Monitoring Assessment and Control, Final Report. OECD Cooperative Programme on Monitoring of
Inland Waters (Eutrophication Control). OECD, Paris.
Spooner, I. (2007). Recognizing Water Problems and Their Solutions. In V. Authors, Custom Course
Materials GEOL 3723. Wolfville, NS: Acadia University.
Taylor, D. 2009. A water quality survey of nine lakes in the Carleton River Watershed Area, Yarmouth
County, Nova Scotia. Nova Scotia Environment, Water and Wastewater Branch.
Wilder, D.G. 1977. Water Quality Survey: Chamcook Watershed. Issued by the Town of St. Andrews,
Nov. 1978.
Acknowledgements
Contributing authors to this lakes monitoring project report are Emma Hebb, Agata Palowski, and
Rebecca Mersereau of Eastern Charlotte Waterways Inc. Contributing funders include the Environmental
Trust Fund, The Atlantic Ecosystem Initiative, and the Town of St. Andrews. Other contributors to the
project include:
- Fredericton Analytical Services (analytical services)
- DeSéve Consultants (analytical services)
- Research and Productivity Centre (analytical services)
- Lake volunteers for their assistance with the monitoring of water quality
- John O’Keefe, Don Fox, and Erin Douthwright of the New Brunswick Department of the
Environment assisted with project development and with lake and parameter selection
- Brian Glebe for technical assistance
- ECW staff: Karl Whalen and Benny Travis for logistical support, Michelle LeBlanc and Mario
Jones for their assistance with fieldwork

27
Appendix A – Regional Map of Study Lakes
Map of Study Lakes
The map on the left shows New Brunswick (NB). To the north of NB is Quebec, Prince Edward Island is to the east, Nova Scotia is to the
southeast (partially divided from NB by the Bay of Fundy), and the US state of Maine is shown to the west. The map to the right is zoomed into
the study region, showing the three study lakes. Clockwise from the left is Chamcook Lake (45°08'46.07"N, 67°05'30.13”W), Digdeguash Lake
(45°13'19.06"N, 66°55'01.26”W), and Lake Utopia (45°10'34.94"N, 66°47'13.13"W). These lakes are located in Charlotte County, Southwest New
Brunswick. Image source http://maps.google.com/.

28
Appendix B – Bathymetric Maps
LAKE UTOPIA

29
CHAMCOOK LAKE

30
DIGDEGUASH LAKE

31
Appendix C – *B Analytical Package for Surface Water and Aquatic Protection
List of parameters tested under the *B analytical package for surface water and aquatic protected set for
by the New Brunswick Department of the Environment (NBDENV, n.d.).

32
Appendix D – Monitoring Sample Sites
Maps for each of the three southwest New Brunswick (NB) study lakes, Lake Utopia, Chamcook Lake,
and Digdeguash Lake, showing their corresponding sample sites (seven, six, and four respectively).
Coordinates of each site are depicted in the table to the right. Sample sites were chosen on the premise
that they are long-standing with the NB Department of the Environment and thus can facilitate data
comparisons to historical information. Maps source: Google Earth.

33
Appendix E – Summary data of pH, Conductivity, and Alkalinity
Summary chart of pH, conductivity, and alkalinity detected at surface water across the sampling period
and sample sites within the three study lakes.
Lake Date Sample Site pH Specific Conductance (µS/cm) Alkalinity (mg/L CaCO3)
Chamcook 2011/07/07 AR0010 7.22 33.8 6.13 AR0011 7.25 33.8 6.05 AR0012 7.25 33.7 6.00 AR0023 7.27 34.3 6.14 AR0024 7.27 34.1 6.18 AR0026 7.26 34.5 6.09 2011/08/25 AR0010 7.21 35.7 6.40 AR0011 7.15 33.8 6.08 AR0012 7.15 33.8 6.18 AR0023 7.10 34.1 6.04 AR0024 7.17 33.9 6.25 AR0026 7.11 34.1 6.12 2011/11/07 AR0010 7.15 31.9 6.75 AR0011 7.07 31.5 5.85 AR0012 7.06 32.2 6.07 AR0023 7.07 31.7 6.11 AR0024 7.07 31.7 6.13 AR0026 7.07 31.5 6.04
Minimum 7.06 31.50 5.85 Maximum 7.27 35.70 6.75 Average 7.16 33.34 6.15
Digdeguash 2011/06/23 AQ0017 6.68 21.7 2.77 AQ0018 6.62 21.4 2.89 AQ0019 6.57 21.5 2.83 AQ0020 6.59 24.5 3.08 2011/08/18 AQ0017 6.89 23.8 3.55 AQ0018 6.74 23.5 3.47 AQ0019 6.69 23.7 3.61 AQ0020 6.66 24.0 3.67 2011/11/03 AQ0017 6.63 26.8 3.72 AQ0018 6.64 26.6 3.79 AQ0019 6.64 27.2 3.63 AQ0020 6.61 27.4 3.58 Minimum 6.57 21.40 2.77 Maximum 6.89 27.40 3.79 Average 6.66 24.34 3.38
Utopia 2011/07/04 AQ0001 7.20 34.5 6.61 AQ0002 7.18 33.7 6.44 AQ0003 7.17 33.5 6.42 AQ0004 7.20 34.7 6.76 AQ0005 7.17 33.9 6.60 AQ0006 7.19 34.2 6.59 AQ0008 7.19 34.1 6.82 2011/09/08 AQ0001 6.95 35.8 7.85 AQ0002 6.81 35.6 7.02 AQ0003 6.81 36.0 7.03 AQ0004 6.80 35.6 7.02 AQ0005 6.82 36.6 7.08 AQ0006 6.82 36.6 7.01 AQ0008 6.82 36.7 7.43 2011/11/03 AQ0001 7.27 41.5 8.38 AQ0002 7.10 38.9 7.12 AQ0003 7.09 38.8 7.24 AQ0004 7.09 43.4 7.28 AQ0005 7.10 39.8 7.70 AQ0006 7.05 39.7 7.15 AQ0008 7.06 40.2 7.68
Minimum 6.80 33.50 6.42 Maximum 7.27 43.40 8.38 Average 7.04 36.85 7.11

34
Appendix F – Complete Water Quality Dataset (Fredericton Analytical Services, DENV)
Table 1a. Compete dataset of water quality parameters, *B and chlorophyll a, for Lake Utopia analyzed by the New Brunswick Department of the
Environment Fredericton Analytical Services. Indicated are seven sites sampled on three sampling events in 2011: early summer (July 4), late
summer (Sept. 8), and fall (Nov. 3). Two of the seven sites, AQ0001 and AQ0005, were sampled at depth (mid-depth and bottom, as well as
Secchi depth* for an addition chlorophyll a measurement where it does not correspond with either mid-depth or bottom).
Lake Station Date Depth
(m) Al
(mg/L) ALK_G (mg/L)
As (µg/L)
Ca (mg/L)
Cd (µg/L)
CHL"A" (µg/L)
Cl (mg/L)
CLRA (ACU)
COND (µSIE/cm)
Cr (µg/L)
Cu (µg/L)
Utopia AQ0001 2011/07/04 0 0.079 6.61 <1 3.47 <0.1 2.6 3.45 46.1 34.5 <0.5 0.5 Utopia AQ0001 2011/07/04 2.6* - - - - - 3.5 - - - - - Utopia AQ0001 2011/07/04 4.5 0.079 5.77 <1 3.37 <0.1 - 3.23 45.5 33.5 <0.5 1.9 Utopia AQ0001 2011/07/04 8 0.083 6.41 <1 3.36 <0.1 - 3.24 45.2 33.7 <0.5 2 Utopia AQ0002 2011/07/04 0 0.077 6.44 <1 3.41 <0.1 2.5 3.25 46.4 33.7 <0.5 0.6 Utopia AQ0003 2011/07/04 0 0.078 6.42 <1 3.39 <0.1 2.9 3.23 44.3 33.5 <0.5 0.7 Utopia AQ0004 2011/07/04 0 0.08 6.76 <1 3.45 <0.1 2.7 3.31 45.8 34.7 <0.5 0.6 Utopia AQ0005 2011/07/04 0 0.074 6.6 <1 3.4 <0.1 2.7 3.3 44.5 33.9 <0.5 <0.5 Utopia AQ0005 2011/07/04 2.6* - - - - - 3.2 - - - - - Utopia AQ0005 2011/07/04 12 0.083 6.56 <1 3.34 <0.1 - 3.69 45.8 35.6 <0.5 2.6 Utopia AQ0005 2011/07/04 23 0.1 6.22 <1 3.47 <0.1 - 3.48 46.4 34.6 <0.5 3.1 Utopia AQ0006 2011/07/04 0 0.074 6.59 <1 3.45 <0.1 2.9 3.38 45.0 34.2 <0.5 0.9 Utopia AQ0008 2011/07/04 0 0.074 6.82 <1 3.41 <0.1 2.4 3.26 43.8 34.1 <0.5 0.5 Utopia AQ0001 2011/09/08 0 0.091 7.85 <1 3.77 <0.1 3.8 3.08 67.2 35.8 <0.5 0.6 Utopia AQ0001 2011/09/08 1.8* - - - - - 4 - - - - - Utopia AQ0001 2011/09/08 4.5 0.096 7.33 <1 3.77 <0.1 - - - 35.8 <0.5 1.7 Utopia AQ0001 2011/09/08 8 0.096 7.63 <1 3.78 0.1 - - - 36.1 <0.5 2 Utopia AQ0002 2011/09/08 0 0.09 7.02 <1 4.82 <0.1 4.3 3.07 65.5 35.6 <0.5 0.6 Utopia AQ0003 2011/09/08 0 0.079 7.03 <1 3.74 <0.1 4.9 3.07 63.5 36 <0.5 0.5 Utopia AQ0004 2011/09/08 0 0.094 7.02 <1 3.75 <0.1 3 2.99 63.7 35.6 <0.5 0.6 Utopia AQ0005 2011/09/08 2.8* - - - - - 4.7 - - - - - Utopia AQ0005 2011/09/08 11.75 0.061 7.17 <1 3.71 <0.1 - - - 36.5 <0.5 1.1 Utopia AQ0005 2011/09/08 22.5 0.062 7.31 <1 3.71 <0.1 - - - 37 <0.5 1.1 Utopia AQ0005 2011/09/08 0 0.064 7.08 <1 3.74 <0.1 4.1 3.21 48.5 36.6 <0.5 0.6 Utopia AQ0006 2011/09/08 0 0.059 7.01 <1 3.71 <0.1 5.1 3.21 47.3 36.6 <0.5 <0.5 Utopia AQ0008 2011/09/08 0 0.066 7.43 <1 3.65 <0.1 4.2 3.23 47.0 36.7 <0.5 0.6 Utopia AQ0001 2011/11/03 0 0.059 8.38 <1 3.9 <0.1 3.7 3.5 50.2 41.5 <0.5 <0.5 Utopia AQ0001 2011/11/03 2* - - - - - 3.3 - - - - - Utopia AQ0001 2011/11/03 4.6 0.062 7.38 <1 3.89 <0.1 - 3.39 54.1 38.3 <0.5 1.2 Utopia AQ0001 2011/11/03 8.5 0.061 7.27 <1 3.88 <0.1 - 3.39 48.6 38.8 <0.5 0.9 Utopia AQ0002 2011/11/03 0 0.058 7.12 <1 3.95 <0.1 3.4 3.39 51.7 38.9 <0.5 0.5 Utopia AQ0003 2011/11/03 0 0.055 7.24 <1 3.93 <0.1 3.3 3.41 50.9 38.8 <0.5 0.5 Utopia AQ0004 2011/11/03 0 0.062 7.28 <1 3.92 <0.1 4.2 4.31 49.6 43.4 <0.5 0.8 Utopia AQ0005 2011/11/03 0 0.055 7.7 <1 3.93 <0.1 3 3.72 43.4 39.8 <0.5 0.6 Utopia AQ0005 2011/11/03 2.3* - - - - - 3 - - - - - Utopia AQ0005 2011/11/03 11.5 0.054 7.29 <1 3.9 <0.1 - 3.63 46.1 39 <0.5 0.6 Utopia AQ0005 2011/11/03 22.5 0.056 7.21 <1 3.89 <0.1 - 3.68 43.1 38.9 <0.5 3 Utopia AQ0006 2011/11/03 0 0.056 7.15 <1 3.91 <0.1 4.2 3.72 45.7 39.7 <0.5 <0.5 Utopia AQ0008 2011/11/03 0 0.054 7.68 <1 3.93 <0.1 3.2 3.67 50.7 40.2 <0.5 0.5

35
Table 1b. Compete dataset of water quality parameters, *B and chlorophyll a, for Lake Utopia analyzed by the New Brunswick Department of the
Environment Fredericton Analytical Services. Indicated are seven sites sampled on three sampling events in 2011: early summer (July 4), late
summer (Sept. 8), and fall (Nov. 3). Two of the seven sites, AQ0001 and AQ0005, were sampled at depth (mid-depth and bottom, as well as
Secchi depth* for an addition chlorophyll a measurement where it does not correspond with either mid-depth or bottom).
Lake Station Date Depth
(m) F
(mg/L) Fe
(mg/L) HARD (mg/L)
K (mg/L)
Mg (mg/L)
Mn (mg/L)
Na (mg/L)
NH3T (mg/L)
Ni (µg/L)
NO2 (mg/L)
NO3 (mg/L)
Utopia AQ0001 2011/07/04 0 0.106 0.076 11.1 0.32 0.59 0.008 2.58 0.014 <5 <0.05 <0.05 Utopia AQ0001 2011/07/04 2.6* - - - - - - - - - - - Utopia AQ0001 2011/07/04 4.5 0.126 0.075 10.9 0.32 0.59 0.007 2.5 0.015 <5 <0.05 <0.05 Utopia AQ0001 2011/07/04 8 0.113 0.08 10.7 0.34 0.57 0.009 2.51 0.017 <5 <0.05 <0.05 Utopia AQ0002 2011/07/04 0 0.112 0.073 10.8 0.32 0.57 0.006 2.57 0.014 <5 <0.05 <0.05 Utopia AQ0003 2011/07/04 0 0.113 0.072 10.8 0.33 0.57 0.006 2.56 0.013 <5 <0.05 <0.05 Utopia AQ0004 2011/07/04 0 0.113 0.076 11 0.32 0.58 0.006 2.56 0.016 <5 <0.05 <0.05 Utopia AQ0005 2011/07/04 0 0.123 0.068 10.8 0.32 0.55 0.005 2.52 0.013 <5 <0.05 <0.05 Utopia AQ0005 2011/07/04 2.6* - - - - - - - - - - - Utopia AQ0005 2011/07/04 12 0.118 0.068 10.7 0.33 0.58 0.006 2.54 0.035 13 <0.05 <0.05 Utopia AQ0005 2011/07/04 23 0.113 0.137 11 0.32 0.57 0.028 2.51 0.019 5 <0.05 <0.05 Utopia AQ0006 2011/07/04 0 0.123 0.071 11 0.34 0.58 0.006 2.56 0.015 <5 <0.05 <0.05 Utopia AQ0008 2011/07/04 0 0.122 0.068 10.8 0.33 0.56 0.005 2.53 0.017 <5 <0.05 <0.05 Utopia AQ0001 2011/09/08 0 0.113 0.136 11.9 0.34 0.6 0.015 2.51 0.011 <5 <0.05 <0.05 Utopia AQ0001 2011/09/08 1.8* - - - - - - - - - - - Utopia AQ0001 2011/09/08 4.5 0.109 0.136 12 0.35 0.62 0.016 2.47 - <5 <0.05 <0.05 Utopia AQ0001 2011/09/08 8 0.108 0.138 11.9 0.34 0.59 0.016 2.46 - 11 <0.05 <0.05 Utopia AQ0002 2011/09/08 0 0.126 0.126 14.6 0.37 0.62 0.015 2.49 0.011 <5 <0.05 <0.05 Utopia AQ0003 2011/09/08 0 0.113 0.109 11.9 0.36 0.61 0.015 2.51 <0.01 <5 <0.05 <0.05 Utopia AQ0004 2011/09/08 0 0.11 0.127 11.9 0.36 0.61 0.015 2.46 0.011 <5 <0.05 <0.05 Utopia AQ0005 2011/09/08 2.8* - - - - - - - - - - - Utopia AQ0005 2011/09/08 11.75 0.116 0.086 11.7 0.34 0.6 0.009 2.56 - <5 <0.05 <0.05 Utopia AQ0005 2011/09/08 22.5 0.116 0.087 11.7 0.34 0.59 0.009 2.56 - 7 <0.05 <0.05 Utopia AQ0005 2011/09/08 0 0.116 0.085 11.9 0.35 0.63 0.009 2.59 <0.01 <5 <0.05 <0.05 Utopia AQ0006 2011/09/08 0 0.116 0.079 11.6 0.34 0.58 0.008 2.56 0.01 <5 <0.05 <0.05 Utopia AQ0008 2011/09/08 0 0.116 0.081 11.6 0.34 0.6 0.008 2.55 <0.01 <5 <0.05 <0.05 Utopia AQ0001 2011/11/03 0 <0.1 0.124 12.3 0.34 0.63 0.022 2.57 0.012 <5 <0.05 <0.05 Utopia AQ0001 2011/11/03 2* - - - - - - - - - - - Utopia AQ0001 2011/11/03 4.6 <0.1 0.126 12.3 0.34 0.63 0.022 2.57 0.014 <5 <0.05 <0.05 Utopia AQ0001 2011/11/03 8.5 <0.1 0.127 12.3 0.33 0.64 0.021 2.56 0.011 <5 <0.05 <0.05 Utopia AQ0002 2011/11/03 0 <0.1 0.124 12.5 0.35 0.63 0.022 2.58 0.012 <5 <0.05 <0.05 Utopia AQ0003 2011/11/03 0 <0.1 0.123 12.4 0.33 0.64 0.02 2.57 0.012 <5 <0.05 <0.05 Utopia AQ0004 2011/11/03 0 <0.1 0.12 12.6 0.37 0.67 0.021 2.88 0.017 <5 <0.05 <0.05 Utopia AQ0005 2011/11/03 0 <0.1 0.097 12.5 0.35 0.65 0.034 2.6 0.018 <5 <0.05 <0.05 Utopia AQ0005 2011/11/03 2.3* - - - - - - - - - - - Utopia AQ0005 2011/11/03 11.5 <0.1 0.096 12.4 0.33 0.64 0.035 2.58 0.011 <5 <0.05 <0.05 Utopia AQ0005 2011/11/03 22.5 <0.1 0.099 12.4 0.34 0.65 0.035 2.58 0.017 6 <0.05 <0.05 Utopia AQ0006 2011/11/03 0 <0.1 0.094 12.4 0.35 0.65 0.031 2.53 0.018 <5 <0.05 <0.05 Utopia AQ0008 2011/11/03 0 <0.1 0.096 12.5 0.33 0.64 0.032 2.56 0.013 <5 <0.05 <0.05

36
Table 1c. Compete dataset of water quality parameters, *B and chlorophyll a, for Lake Utopia analyzed by the New Brunswick Department of the
Environment Fredericton Analytical Services. Indicated are seven sites sampled on three sampling events in 2011: early summer (July 4), late
summer (Sept. 8), and fall (Nov. 3). Two of the seven sites, AQ0001 and AQ0005, were sampled at depth (mid-depth and bottom, as well as
Secchi depth* for an addition chlorophyll a measurement where it does not correspond with either mid-depth or bottom).
Lake Station Date Depth
(m) NOX
(mg/L) Pb
(µg/L) pH Sb
(µg/L) SO4
(mg/L) TN
(mg/L) TOC
(mg/L) TP-L
(mg/L) TURB (NTU)
Zn (µg/L)
Utopia AQ0001 2011/07/04 0 <0.05 <1 7.2 <1 2.26 <0.3 6.2 0.006 0.5 <5 Utopia AQ0001 2011/07/04 2.6* - - - - - - - - - - Utopia AQ0001 2011/07/04 4.5 <0.05 <1 7.17 <1 2.11 <0.3 6 0.006 0.37 <5 Utopia AQ0001 2011/07/04 8 0.06 <1 7.12 <1 2.08 <0.3 6 0.005 0.35 5 Utopia AQ0002 2011/07/04 0 <0.05 <1 7.18 <1 2.19 <0.3 6 0.006 0.34 <5 Utopia AQ0003 2011/07/04 0 <0.05 <1 7.17 <1 2.19 <0.3 6 0.006 0.34 <5 Utopia AQ0004 2011/07/04 0 <0.05 <1 7.2 <1 2.19 <0.3 6.1 0.007 0.35 <5 Utopia AQ0005 2011/07/04 0 <0.05 <1 7.17 <1 2.16 <0.3 6.5 0.007 0.3 <5 Utopia AQ0005 2011/07/04 2.6* - - - - - - - - - - Utopia AQ0005 2011/07/04 12 0.08 <1 7.11 <1 2.19 <0.3 6.2 0.006 0.25 10 Utopia AQ0005 2011/07/04 23 0.1 <1 7.04 <1 2.19 <0.3 6.3 0.007 0.34 8 Utopia AQ0006 2011/07/04 0 <0.05 <1 7.19 <1 2.21 <0.3 6.4 0.006 0.32 <5 Utopia AQ0008 2011/07/04 0 <0.05 <1 7.19 <1 2.09 <0.3 6.2 0.007 0.49 <5 Utopia AQ0001 2011/09/08 0 <0.05 <1 6.95 <1 1.99 <0.3 8.3 0.009 0.6 <5 Utopia AQ0001 2011/09/08 1.8* - - - - - - - - - - Utopia AQ0001 2011/09/08 4.5 <0.05 <1 6.83 <1 - - 8.5 0.01 0.77 6 Utopia AQ0001 2011/09/08 8 <0.05 <1 6.82 <1 - - 8.5 0.01 0.66 8 Utopia AQ0002 2011/09/08 0 <0.05 <1 6.81 <1 1.9 <0.3 8.1 0.008 0.65 6 Utopia AQ0003 2011/09/08 0 <0.05 <1 6.81 <1 2.11 <0.3 7.6 0.009 0.56 <5 Utopia AQ0004 2011/09/08 0 <0.05 <1 6.8 <1 2.03 <0.3 8.6 0.008 0.53 <5 Utopia AQ0005 2011/09/08 2.8* - - - - - - - - - - Utopia AQ0005 2011/09/08 11.75 <0.05 <1 6.82 <1 - - 6.4 0.009 0.44 <5 Utopia AQ0005 2011/09/08 22.5 <0.05 <1 6.8 <1 - - 6.6 0.009 0.47 9 Utopia AQ0005 2011/09/08 0 <0.05 <1 6.82 <1 2.14 <0.3 6.6 0.009 0.39 <5 Utopia AQ0006 2011/09/08 0 <0.05 <1 6.82 <1 2.08 <0.3 6.5 0.008 0.46 <5 Utopia AQ0008 2011/09/08 0 <0.05 <1 6.82 <1 2.19 <0.3 6.7 0.007 0.45 <5 Utopia AQ0001 2011/11/03 0 0.06 <1 7.27 <1 2.18 <0.3 6.6 0.008 1 <5 Utopia AQ0001 2011/11/03 2* - - - - - - - - - - Utopia AQ0001 2011/11/03 4.6 0.06 <1 7.13 <1 2.11 <0.3 6.6 0.009 1.2 <5 Utopia AQ0001 2011/11/03 8.5 0.06 <1 7.1 <1 2.19 <0.3 6.6 0.008 1.2 <5 Utopia AQ0002 2011/11/03 0 0.06 <1 7.1 <1 2.07 6.5 0.008 1.1 <5 Utopia AQ0003 2011/11/03 0 0.06 <1 7.09 <1 2.06 <0.3 6.8 0.008 1 <5 Utopia AQ0004 2011/11/03 0 0.06 <1 7.09 <1 2.29 <0.3 6.6 0.008 1.1 <5 Utopia AQ0005 2011/11/03 0 0.08 <1 7.1 <1 2.18 <0.3 6.7 0.009 0.79 <5 Utopia AQ0005 2011/11/03 2.3* - - - - - - - - - - Utopia AQ0005 2011/11/03 11.5 0.07 <1 7.08 <1 2.22 <0.3 6.3 0.007 0.65 <5 Utopia AQ0005 2011/11/03 22.5 0.08 <1 7.07 <1 2.37 <0.3 6.7 0.008 0.83 16 Utopia AQ0006 2011/11/03 0 0.07 <1 7.05 <1 2.37 <0.3 6.5 0.007 0.6 <5 Utopia AQ0008 2011/11/03 0 0.08 <1 7.06 <1 2.31 <0.3 6.5 0.007 0.71 <5

37
Table 2a. Compete dataset of water quality parameters, *B and chlorophyll a, for Chamcook Lake analyzed by the New Brunswick Department of
the Environment Fredericton Analytical Services. Indicated are six sites sampled on three sampling events in 2011: early summer (July 7), late
summer (Aug. 25), and fall (Nov. 7). Two of the six sites, AR0010 and AR0012, were sampled at depth (mid-depth and bottom, as well as Secchi
depth* for an addition chlorophyll a measurement where it does not correspond with either mid-depth or bottom).
Lake Station Date Depth
(m) Al
(mg/L) ALK_G (mg/L)
As (µg/L)
Ca (mg/L)
Cd (µg/L)
CHL"A" (µg/L)
Cl (mg/L)
CLRA (ACU)
COND (µSIE/cm)
Cr (µg/L)
Cu (µg/L)
Chamcook AR0010 2011/07/07 0 0.017 6.13 <1 2.93 <0.1 1.2 3.69 10.9 33.8 <0.5 <0.5 Chamcook AR0010 2011/07/07 4 0.019 5.77 <1 2.90 <0.1 - 3.56 11.0 33.6 <0.5 1.5 Chamcook AR0010 2011/07/07 7 0.017 6.09 <1 2.89 <0.1 - 3.66 11.2 33.7 <0.5 1.9 Chamcook AR0011 2011/07/07 0 0.015 6.05 <1 2.86 <0.1 1.4 3.64 8.8 33.8 <0.5 <0.5 Chamcook AR0012 2011/07/07 0 0.017 6.00 <1 2.95 <0.1 1.0 3.63 10.0 33.7 <0.5 <0.5 Chamcook AR0012 2011/07/07 5.1* - - - - - 1.2 - - - - - Chamcook AR0012 2011/07/07 15.75 0.017 5.93 <1 2.88 <0.1 - 3.59 12.3 33.8 <0.5 2.1 Chamcook AR0012 2011/07/07 30.5 0.110 6.05 <1 2.93 <0.1 - 3.61 34.2 <0.5 3.0 Chamcook AR0023 2011/07/07 0 0.016 6.14 <1 3.79 <0.1 1.3 3.61 10.0 34.3 <0.5 <0.5 Chamcook AR0024 2011/07/07 0 0.018 6.18 <1 2.88 <0.1 1.5 3.65 9.8 34.1 <0.5 <0.5 Chamcook AR0026 2011/07/07 0 0.015 6.09 <1 2.89 <0.1 1.3 3.79 10.0 34.5 <0.5 <0.5 Chamcook AR0010 2011/08/25 0 0.010 6.40 <1 2.77 <0.1 2.3 3.54 10.0 35.7 <0.5 <0.5 Chamcook AR0010 2011/08/25 4.25 0.010 6.29 <1 2.79 <0.1 2.2 3.54 10.7 34.7 <0.5 <0.5 Chamcook AR0010 2011/08/25 7.5 0.011 6.30 <1 2.83 <0.1 - 3.48 11.2 34.0 <0.5 3.2 Chamcook AR0011 2011/08/25 0 0.010 6.08 <1 2.77 <0.1 2.4 3.52 11.0 33.8 <0.5 <0.5 Chamcook AR0012 2011/08/25 0 0.010 6.18 <1 2.79 <0.1 2.3 3.59 10.4 33.8 <0.5 <0.5 Chamcook AR0012 2011/08/25 6* - - - - - 2.1 - - - - - Chamcook AR0012 2011/08/25 9.75 0.010 5.73 <1 2.76 <0.1 - 3.57 9.5 34.1 <0.5 0.6 Chamcook AR0012 2011/08/25 18.5 0.010 6.04 <1 2.86 <0.1 - 3.49 10.9 34.0 <0.5 1.5 Chamcook AR0023 2011/08/25 0 0.011 6.04 <1 2.76 <0.1 2.2 3.50 11.7 34.1 <0.5 <0.5 Chamcook AR0024 2011/08/25 0 0.010 6.25 <1 2.77 <0.1 2.1 3.47 9.4 33.9 <0.5 <0.5 Chamcook AR0026 2011/08/25 0 0.010 6.12 <1 2.77 <0.1 2.5 3.55 11.2 34.1 <0.5 <0.5 Chamcook AR0010 2011/11/07 0 0.012 6.75 <1 3.05 <0.1 2.0 3.85 6.8 31.9 <0.5 <0.5 Chamcook AR0010 2011/11/07 3.8 0.014 6.18 <1 3.13 <0.1 - 3.80 10.4 31.3 <0.5 0.6 Chamcook AR0010 2011/11/07 6.2 0.011 6.17 <1 3.03 <0.1 1.9 3.77 12.2 31.5 <0.5 0.5 Chamcook AR0011 2011/11/07 0 0.013 5.85 <1 3.02 <0.1 2.3 3.99 11.4 31.5 <0.5 <0.5 Chamcook AR0012 2011/11/07 0 0.015 6.07 <1 3.28 <0.1 2.8 4.01 12.0 32.2 <0.5 1.0 Chamcook AR0012 2011/11/07 6* - - - - - 2.3 - - - - - Chamcook AR0012 2011/11/07 13.5 0.012 5.83 <1 3.02 <0.1 - 3.76 12.2 31.3 <0.5 <0.5 Chamcook AR0012 2011/11/07 26 0.012 6.03 <1 3.00 <0.1 - 3.80 11.5 31.6 <0.5 1.1 Chamcook AR0023 2011/11/07 0 0.014 6.11 <1 3.06 <0.1 2.5 3.78 12.2 31.7 <0.5 0.5 Chamcook AR0024 2011/11/07 0 0.012 6.13 <1 3.00 <0.1 2.7 3.83 12.0 31.7 <0.5 <0.5 Chamcook AR0026 2011/11/07 0 0.015 6.04 <1 3.02 <0.1 2.8 3.87 12.0 31.5 <0.5 0.6

38
Table 2b. Compete dataset of water quality parameters, *B and chlorophyll a, for Chamcook Lake analyzed by the New Brunswick Department of
the Environment Fredericton Analytical Services. Indicated are six sites sampled on three sampling events in 2011: early summer (July 7), late
summer (Aug. 25), and fall (Nov. 7). Two of the six sites, AR0010 and AR0012, were sampled at depth (mid-depth and bottom, as well as Secchi
depth* for an addition chlorophyll a measurement where it does not correspond with either mid-depth or bottom).
Lake Station Date Depth
(m) F
(mg/L) Fe
(mg/L) HARD (mg/L)
K (mg/L)
Mg (mg/L)
Mn (mg/L)
Na (mg/L)
NH3T (mg/L)
Ni (µg/L)
NO2 (mg/L)
NO3 (mg/L)
Chamcook AR0010 2011/07/07 0 <0.1 0.015 9.59 0.21 0.55 <0.005 2.74 0.012 <5 <0.05 <0.05 Chamcook AR0010 2011/07/07 4 <0.1 0.019 9.44 0.20 0.53 <0.005 2.70 0.012 <5 <0.05 <0.05 Chamcook AR0010 2011/07/07 7 <0.1 0.015 9.45 0.21 0.55 <0.005 2.67 0.013 <5 <0.05 <0.05 Chamcook AR0011 2011/07/07 0 <0.1 0.011 9.32 0.21 0.53 <0.005 2.66 0.013 <5 <0.05 <0.05 Chamcook AR0012 2011/07/07 0 <0.1 0.010 9.60 0.22 0.55 <0.005 2.68 0.014 <5 <0.05 <0.05 Chamcook AR0012 2011/07/07 5.1* - - - - - - - - - - - Chamcook AR0012 2011/07/07 15.75 <0.1 0.010 9.43 0.21 0.54 <0.005 2.67 0.014 11 <0.05 <0.05 Chamcook AR0012 2011/07/07 30.5 <0.1 0.195 9.79 0.24 0.60 0.046 2.69 0.020 <5 <0.05 <0.05 Chamcook AR0023 2011/07/07 0 <0.1 0.013 11.80 0.21 0.56 <0.005 2.68 0.012 <5 <0.05 <0.05 Chamcook AR0024 2011/07/07 0 <0.1 0.013 9.41 0.21 0.54 <0.005 2.66 0.016 <5 <0.05 <0.05 Chamcook AR0026 2011/07/07 0 <0.1 0.011 9.43 0.21 0.54 <0.005 2.64 0.013 <5 <0.05 <0.05 Chamcook AR0010 2011/08/25 0 <0.1 0.011 9.16 0.22 0.55 <0.005 2.48 <0.01 <5 <0.05 <0.05 Chamcook AR0010 2011/08/25 4.25 <0.1 0.010 9.19 0.22 0.54 <0.005 2.49 <0.01 <5 <0.05 <0.05 Chamcook AR0010 2011/08/25 7.5 <0.1 0.012 9.32 0.23 0.55 <0.005 2.49 <0.01 7 <0.05 <0.05 Chamcook AR0011 2011/08/25 0 <0.1 <0.01 9.11 0.22 0.54 <0.005 2.49 <0.01 <5 <0.05 <0.05 Chamcook AR0012 2011/08/25 0 <0.1 <0.01 9.23 0.23 0.55 <0.005 2.47 <0.01 <5 <0.05 <0.05 Chamcook AR0012 2011/08/25 6* - - - - - - - - - - - Chamcook AR0012 2011/08/25 9.75 <0.1 <0.01 9.15 0.22 0.55 <0.005 2.44 <0.01 7 <0.05 <0.05 Chamcook AR0012 2011/08/25 18.5 <0.1 <0.01 9.40 0.23 0.55 <0.005 2.47 <0.01 6 <0.05 <0.05 Chamcook AR0023 2011/08/25 0 <0.1 <0.01 9.12 0.23 0.54 <0.005 2.51 <0.01 <5 <0.05 <0.05 Chamcook AR0024 2011/08/25 0 <0.1 <0.01 9.15 0.23 0.54 <0.005 2.46 <0.01 <5 <0.05 <0.05 Chamcook AR0026 2011/08/25 0 <0.1 <0.01 9.15 0.22 0.54 <0.005 2.50 <0.01 <5 <0.05 <0.05 Chamcook AR0010 2011/11/07 0 <0.1 0.013 9.96 0.24 0.57 0.006 3.27 0.016 <5 <0.05 <0.05 Chamcook AR0010 2011/11/07 3.8 <0.1 0.012 10.10 0.24 0.56 0.006 3.13 0.017 <5 <0.05 <0.05 Chamcook AR0010 2011/11/07 6.2 <0.1 0.012 9.85 0.22 0.56 0.005 3.09 0.015 <5 <0.05 <0.05 Chamcook AR0011 2011/11/07 0 <0.1 0.013 9.82 0.22 0.55 0.005 3.07 0.018 <5 <0.05 <0.05 Chamcook AR0012 2011/11/07 0 <0.1 0.014 10.60 0.34 0.60 0.006 3.46 0.023 <5 <0.05 <0.05 Chamcook AR0012 2011/11/07 6* - - - - - - - - - - - Chamcook AR0012 2011/11/07 13.5 <0.1 0.013 9.81 0.22 0.55 0.005 3.03 0.014 <5 <0.05 <0.05 Chamcook AR0012 2011/11/07 26 <0.1 0.012 9.76 0.23 0.55 0.007 2.99 0.013 5 <0.05 <0.05 Chamcook AR0023 2011/11/07 0 <0.1 0.017 9.95 0.25 0.56 0.005 3.07 0.012 <5 <0.05 <0.05 Chamcook AR0024 2011/11/07 0 <0.1 0.014 9.80 0.24 0.56 0.006 3.00 0.012 <5 <0.05 <0.05 Chamcook AR0026 2011/11/07 0 <0.1 0.012 9.86 0.26 0.56 0.006 3.01 0.019 <5 <0.05 <0.05
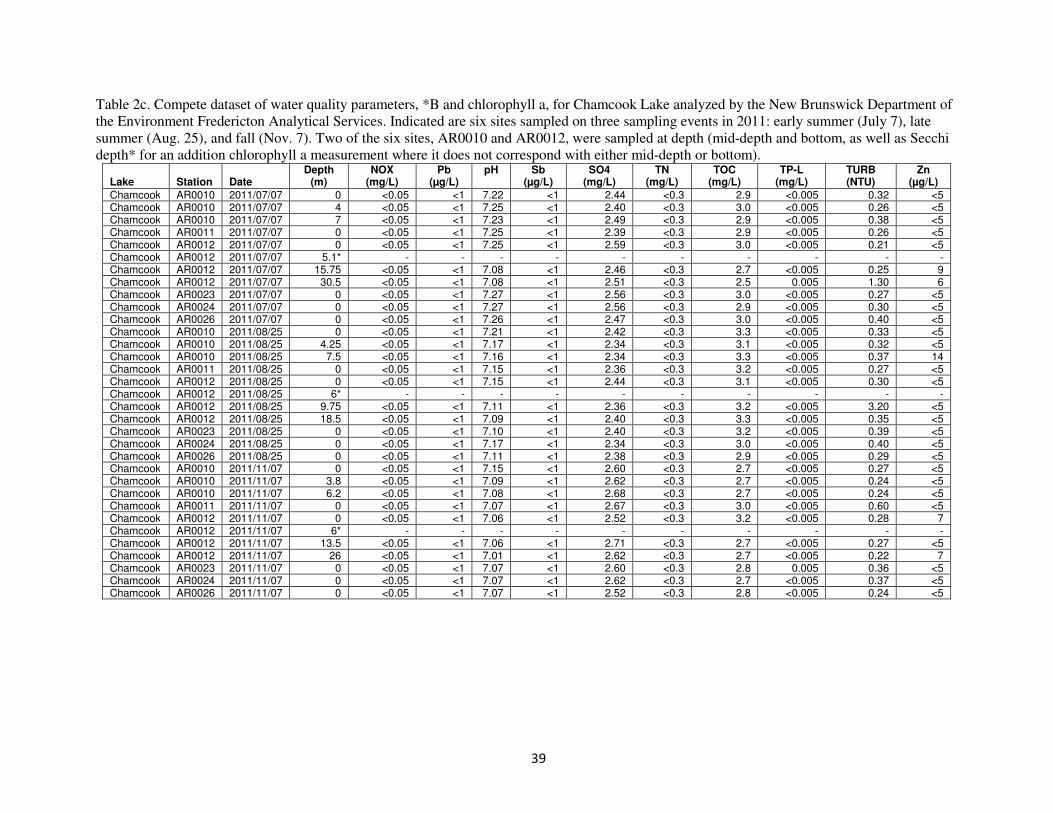
39
Table 2c. Compete dataset of water quality parameters, *B and chlorophyll a, for Chamcook Lake analyzed by the New Brunswick Department of
the Environment Fredericton Analytical Services. Indicated are six sites sampled on three sampling events in 2011: early summer (July 7), late
summer (Aug. 25), and fall (Nov. 7). Two of the six sites, AR0010 and AR0012, were sampled at depth (mid-depth and bottom, as well as Secchi
depth* for an addition chlorophyll a measurement where it does not correspond with either mid-depth or bottom).
Lake Station Date Depth
(m) NOX
(mg/L) Pb
(µg/L) pH Sb
(µg/L) SO4
(mg/L) TN
(mg/L) TOC
(mg/L) TP-L
(mg/L) TURB (NTU)
Zn (µg/L)
Chamcook AR0010 2011/07/07 0 <0.05 <1 7.22 <1 2.44 <0.3 2.9 <0.005 0.32 <5 Chamcook AR0010 2011/07/07 4 <0.05 <1 7.25 <1 2.40 <0.3 3.0 <0.005 0.26 <5 Chamcook AR0010 2011/07/07 7 <0.05 <1 7.23 <1 2.49 <0.3 2.9 <0.005 0.38 <5 Chamcook AR0011 2011/07/07 0 <0.05 <1 7.25 <1 2.39 <0.3 2.9 <0.005 0.26 <5 Chamcook AR0012 2011/07/07 0 <0.05 <1 7.25 <1 2.59 <0.3 3.0 <0.005 0.21 <5 Chamcook AR0012 2011/07/07 5.1* - - - - - - - - - - Chamcook AR0012 2011/07/07 15.75 <0.05 <1 7.08 <1 2.46 <0.3 2.7 <0.005 0.25 9 Chamcook AR0012 2011/07/07 30.5 <0.05 <1 7.08 <1 2.51 <0.3 2.5 0.005 1.30 6 Chamcook AR0023 2011/07/07 0 <0.05 <1 7.27 <1 2.56 <0.3 3.0 <0.005 0.27 <5 Chamcook AR0024 2011/07/07 0 <0.05 <1 7.27 <1 2.56 <0.3 2.9 <0.005 0.30 <5 Chamcook AR0026 2011/07/07 0 <0.05 <1 7.26 <1 2.47 <0.3 3.0 <0.005 0.40 <5 Chamcook AR0010 2011/08/25 0 <0.05 <1 7.21 <1 2.42 <0.3 3.3 <0.005 0.33 <5 Chamcook AR0010 2011/08/25 4.25 <0.05 <1 7.17 <1 2.34 <0.3 3.1 <0.005 0.32 <5 Chamcook AR0010 2011/08/25 7.5 <0.05 <1 7.16 <1 2.34 <0.3 3.3 <0.005 0.37 14 Chamcook AR0011 2011/08/25 0 <0.05 <1 7.15 <1 2.36 <0.3 3.2 <0.005 0.27 <5 Chamcook AR0012 2011/08/25 0 <0.05 <1 7.15 <1 2.44 <0.3 3.1 <0.005 0.30 <5 Chamcook AR0012 2011/08/25 6* - - - - - - - - - - Chamcook AR0012 2011/08/25 9.75 <0.05 <1 7.11 <1 2.36 <0.3 3.2 <0.005 3.20 <5 Chamcook AR0012 2011/08/25 18.5 <0.05 <1 7.09 <1 2.40 <0.3 3.3 <0.005 0.35 <5 Chamcook AR0023 2011/08/25 0 <0.05 <1 7.10 <1 2.40 <0.3 3.2 <0.005 0.39 <5 Chamcook AR0024 2011/08/25 0 <0.05 <1 7.17 <1 2.34 <0.3 3.0 <0.005 0.40 <5 Chamcook AR0026 2011/08/25 0 <0.05 <1 7.11 <1 2.38 <0.3 2.9 <0.005 0.29 <5 Chamcook AR0010 2011/11/07 0 <0.05 <1 7.15 <1 2.60 <0.3 2.7 <0.005 0.27 <5 Chamcook AR0010 2011/11/07 3.8 <0.05 <1 7.09 <1 2.62 <0.3 2.7 <0.005 0.24 <5 Chamcook AR0010 2011/11/07 6.2 <0.05 <1 7.08 <1 2.68 <0.3 2.7 <0.005 0.24 <5 Chamcook AR0011 2011/11/07 0 <0.05 <1 7.07 <1 2.67 <0.3 3.0 <0.005 0.60 <5 Chamcook AR0012 2011/11/07 0 <0.05 <1 7.06 <1 2.52 <0.3 3.2 <0.005 0.28 7 Chamcook AR0012 2011/11/07 6* - - - - - - - - - - Chamcook AR0012 2011/11/07 13.5 <0.05 <1 7.06 <1 2.71 <0.3 2.7 <0.005 0.27 <5 Chamcook AR0012 2011/11/07 26 <0.05 <1 7.01 <1 2.62 <0.3 2.7 <0.005 0.22 7 Chamcook AR0023 2011/11/07 0 <0.05 <1 7.07 <1 2.60 <0.3 2.8 0.005 0.36 <5 Chamcook AR0024 2011/11/07 0 <0.05 <1 7.07 <1 2.62 <0.3 2.7 <0.005 0.37 <5 Chamcook AR0026 2011/11/07 0 <0.05 <1 7.07 <1 2.52 <0.3 2.8 <0.005 0.24 <5

40
Table 3a. Compete dataset of water quality parameters, *B and chlorophyll a, for Digdeguash Lake analyzed by the New Brunswick Department
of the Environment Fredericton Analytical Services. Indicated are four sites sampled on three sampling events in 2011: early summer (June 23),
late summer (Aug. 18), and fall (Nov. 3). One of the four sites, AQ0018, was sampled at depth (mid-depth and bottom, as well as Secchi depth*
for an addition chlorophyll a measurement).
Lake Station Date Depth
(m) Al
(mg/L) ALK_G (mg/L)
As (µg/L)
Ca (mg/L)
Cd (µg/L)
CHL"A" (µg/L)
Cl (mg/L)
CLRA (ACU)
COND (µSIE/cm)
Cr (µg/L)
Cu (µg/L)
Digdeguash AQ0017 2011/06/23 0 0.14 2.77 <1 1.56 <0.1 2.1 2.01 68.9 21.7 <0.5 0.7 Digdeguash AQ0018 2011/06/23 0 0.12 2.89 <1 1.41 <0.1 2.3 1.85 70.7 21.4 <0.5 <0.5 Digdeguash AQ0018 2011/06/23 1.9* - - - - - 2.4 - - - - - Digdeguash AQ0018 2011/06/23 8.5 0.12 2.66 <1 1.50 <0.1 - 1.99 74.7 21.5 <0.5 4.3 Digdeguash AQ0018 2011/06/23 16 0.15 2.79 <1 1.38 <0.1 - 2.02 84.5 21.5 <0.5 2.2 Digdeguash AQ0019 2011/06/23 0 0.13 2.83 <1 1.52 <0.1 2.2 2.09 74.2 21.5 <0.5 <0.5 Digdeguash AQ0020 2011/06/23 0 0.13 3.08 <1 1.47 <0.1 2.5 2.47 82.3 24.5 <0.5 0.6 Digdeguash AQ0017 2011/08/18 0 0.13 3.55 <1 2.39 <0.1 2.0 1.99 68.1 23.8 <0.5 <0.5 Digdeguash AQ0018 2011/08/18 0 0.14 3.47 <1 2.49 <0.1 2.9 2.02 69.9 23.5 <0.5 0.8 Digdeguash AQ0018 2011/08/18 1.5* - - - - - 2.3 - - - - - Digdeguash AQ0018 2011/08/18 8.5 0.13 3.44 <1 2.35 <0.1 - 1.86 69.4 23.3 <0.5 1.7 Digdeguash AQ0018 2011/08/18 16 0.13 3.29 <1 2.11 <0.1 - 1.99 70.9 23.3 <0.5 2.6 Digdeguash AQ0019 2011/08/18 0 0.13 3.61 <1 2.32 <0.1 1.7 2.08 73.6 23.7 <0.5 <0.5 Digdeguash AQ0020 2011/08/18 0 0.14 3.67 1.1 2.28 <0.1 1.6 1.98 88.4 24.0 <0.5 <0.5 Digdeguash AQ0017 2011/11/03 0 0.14 3.72 <1 2.74 <0.1 4.1 2.39 88.4 26.8 <0.5 <0.5 Digdeguash AQ0018 2011/11/03 0 0.14 3.79 <1 2.51 <0.1 2.5 2.45 86.9 26.6 <0.5 0.9 Digdeguash AQ0018 2011/11/03 1.7* - - - - - 2.2 - - - - - Digdeguash AQ0018 2011/11/03 8.75 0.14 3.64 <1 2.56 <0.1 - 2.34 88.7 26.5 <0.5 1.0 Digdeguash AQ0018 2011/11/03 17 0.14 3.84 <1 2.50 <0.1 - 2.34 91.1 26.7 <0.5 1.2 Digdeguash AQ0019 2011/11/03 0 0.14 3.63 <1 2.55 <0.1 2.6 2.51 88.1 27.2 <0.5 0.8 Digdeguash AQ0020 2011/11/03 0 0.15 3.58 <1 2.53 <0.1 3.8 2.56 92.7 27.4 <0.5 0.8
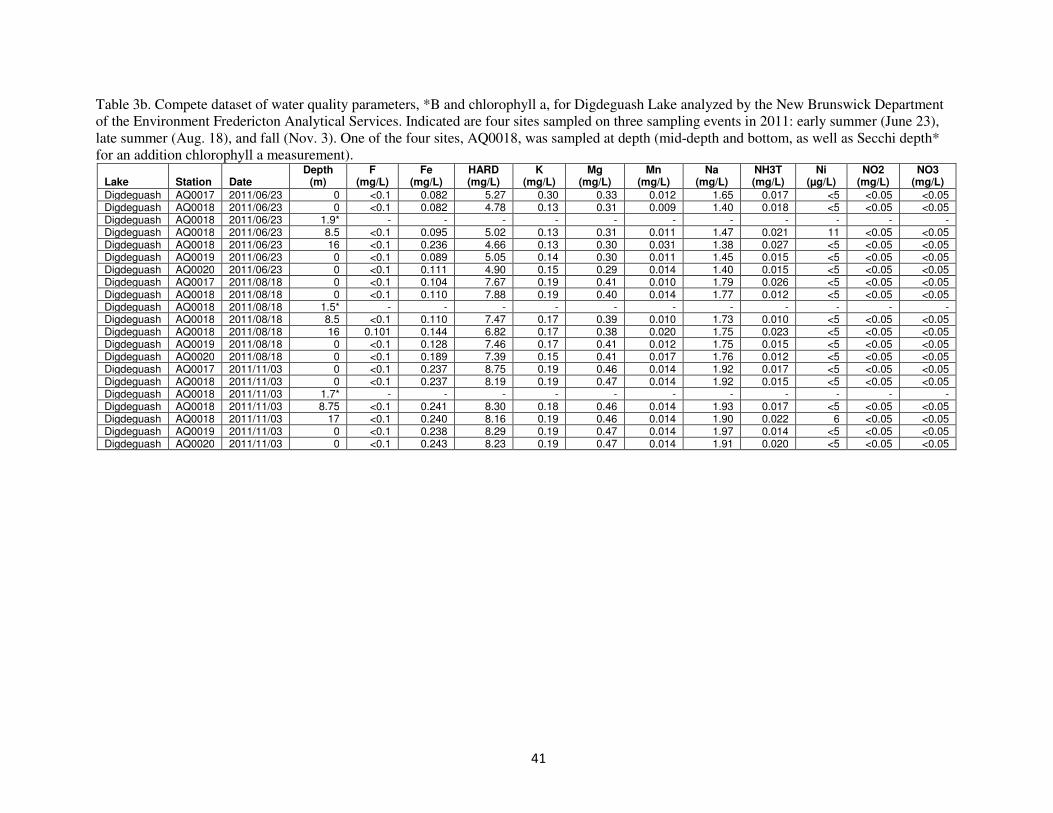
41
Table 3b. Compete dataset of water quality parameters, *B and chlorophyll a, for Digdeguash Lake analyzed by the New Brunswick Department
of the Environment Fredericton Analytical Services. Indicated are four sites sampled on three sampling events in 2011: early summer (June 23),
late summer (Aug. 18), and fall (Nov. 3). One of the four sites, AQ0018, was sampled at depth (mid-depth and bottom, as well as Secchi depth*
for an addition chlorophyll a measurement).
Lake Station Date Depth
(m) F
(mg/L) Fe
(mg/L) HARD (mg/L)
K (mg/L)
Mg (mg/L)
Mn (mg/L)
Na (mg/L)
NH3T (mg/L)
Ni (µg/L)
NO2 (mg/L)
NO3 (mg/L)
Digdeguash AQ0017 2011/06/23 0 <0.1 0.082 5.27 0.30 0.33 0.012 1.65 0.017 <5 <0.05 <0.05 Digdeguash AQ0018 2011/06/23 0 <0.1 0.082 4.78 0.13 0.31 0.009 1.40 0.018 <5 <0.05 <0.05 Digdeguash AQ0018 2011/06/23 1.9* - - - - - - - - - - - Digdeguash AQ0018 2011/06/23 8.5 <0.1 0.095 5.02 0.13 0.31 0.011 1.47 0.021 11 <0.05 <0.05 Digdeguash AQ0018 2011/06/23 16 <0.1 0.236 4.66 0.13 0.30 0.031 1.38 0.027 <5 <0.05 <0.05 Digdeguash AQ0019 2011/06/23 0 <0.1 0.089 5.05 0.14 0.30 0.011 1.45 0.015 <5 <0.05 <0.05 Digdeguash AQ0020 2011/06/23 0 <0.1 0.111 4.90 0.15 0.29 0.014 1.40 0.015 <5 <0.05 <0.05 Digdeguash AQ0017 2011/08/18 0 <0.1 0.104 7.67 0.19 0.41 0.010 1.79 0.026 <5 <0.05 <0.05 Digdeguash AQ0018 2011/08/18 0 <0.1 0.110 7.88 0.19 0.40 0.014 1.77 0.012 <5 <0.05 <0.05 Digdeguash AQ0018 2011/08/18 1.5* - - - - - - - - - - - Digdeguash AQ0018 2011/08/18 8.5 <0.1 0.110 7.47 0.17 0.39 0.010 1.73 0.010 <5 <0.05 <0.05 Digdeguash AQ0018 2011/08/18 16 0.101 0.144 6.82 0.17 0.38 0.020 1.75 0.023 <5 <0.05 <0.05 Digdeguash AQ0019 2011/08/18 0 <0.1 0.128 7.46 0.17 0.41 0.012 1.75 0.015 <5 <0.05 <0.05 Digdeguash AQ0020 2011/08/18 0 <0.1 0.189 7.39 0.15 0.41 0.017 1.76 0.012 <5 <0.05 <0.05 Digdeguash AQ0017 2011/11/03 0 <0.1 0.237 8.75 0.19 0.46 0.014 1.92 0.017 <5 <0.05 <0.05 Digdeguash AQ0018 2011/11/03 0 <0.1 0.237 8.19 0.19 0.47 0.014 1.92 0.015 <5 <0.05 <0.05 Digdeguash AQ0018 2011/11/03 1.7* - - - - - - - - - - - Digdeguash AQ0018 2011/11/03 8.75 <0.1 0.241 8.30 0.18 0.46 0.014 1.93 0.017 <5 <0.05 <0.05 Digdeguash AQ0018 2011/11/03 17 <0.1 0.240 8.16 0.19 0.46 0.014 1.90 0.022 6 <0.05 <0.05 Digdeguash AQ0019 2011/11/03 0 <0.1 0.238 8.29 0.19 0.47 0.014 1.97 0.014 <5 <0.05 <0.05 Digdeguash AQ0020 2011/11/03 0 <0.1 0.243 8.23 0.19 0.47 0.014 1.91 0.020 <5 <0.05 <0.05
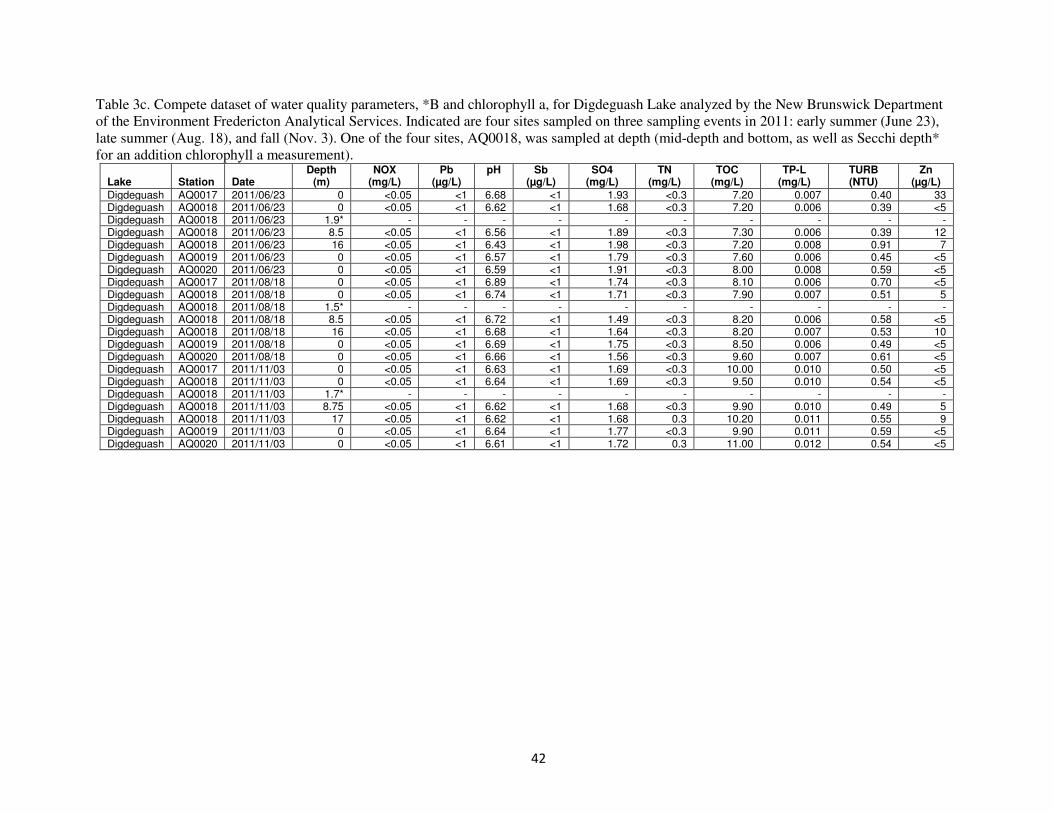
42
Table 3c. Compete dataset of water quality parameters, *B and chlorophyll a, for Digdeguash Lake analyzed by the New Brunswick Department
of the Environment Fredericton Analytical Services. Indicated are four sites sampled on three sampling events in 2011: early summer (June 23),
late summer (Aug. 18), and fall (Nov. 3). One of the four sites, AQ0018, was sampled at depth (mid-depth and bottom, as well as Secchi depth*
for an addition chlorophyll a measurement).
Lake Station Date Depth
(m) NOX
(mg/L) Pb
(µg/L) pH Sb
(µg/L) SO4
(mg/L) TN
(mg/L) TOC
(mg/L) TP-L
(mg/L) TURB (NTU)
Zn (µg/L)
Digdeguash AQ0017 2011/06/23 0 <0.05 <1 6.68 <1 1.93 <0.3 7.20 0.007 0.40 33 Digdeguash AQ0018 2011/06/23 0 <0.05 <1 6.62 <1 1.68 <0.3 7.20 0.006 0.39 <5 Digdeguash AQ0018 2011/06/23 1.9* - - - - - - - - - - Digdeguash AQ0018 2011/06/23 8.5 <0.05 <1 6.56 <1 1.89 <0.3 7.30 0.006 0.39 12 Digdeguash AQ0018 2011/06/23 16 <0.05 <1 6.43 <1 1.98 <0.3 7.20 0.008 0.91 7 Digdeguash AQ0019 2011/06/23 0 <0.05 <1 6.57 <1 1.79 <0.3 7.60 0.006 0.45 <5 Digdeguash AQ0020 2011/06/23 0 <0.05 <1 6.59 <1 1.91 <0.3 8.00 0.008 0.59 <5 Digdeguash AQ0017 2011/08/18 0 <0.05 <1 6.89 <1 1.74 <0.3 8.10 0.006 0.70 <5 Digdeguash AQ0018 2011/08/18 0 <0.05 <1 6.74 <1 1.71 <0.3 7.90 0.007 0.51 5 Digdeguash AQ0018 2011/08/18 1.5* - - - - - - - - - - Digdeguash AQ0018 2011/08/18 8.5 <0.05 <1 6.72 <1 1.49 <0.3 8.20 0.006 0.58 <5 Digdeguash AQ0018 2011/08/18 16 <0.05 <1 6.68 <1 1.64 <0.3 8.20 0.007 0.53 10 Digdeguash AQ0019 2011/08/18 0 <0.05 <1 6.69 <1 1.75 <0.3 8.50 0.006 0.49 <5 Digdeguash AQ0020 2011/08/18 0 <0.05 <1 6.66 <1 1.56 <0.3 9.60 0.007 0.61 <5 Digdeguash AQ0017 2011/11/03 0 <0.05 <1 6.63 <1 1.69 <0.3 10.00 0.010 0.50 <5 Digdeguash AQ0018 2011/11/03 0 <0.05 <1 6.64 <1 1.69 <0.3 9.50 0.010 0.54 <5 Digdeguash AQ0018 2011/11/03 1.7* - - - - - - - - - - Digdeguash AQ0018 2011/11/03 8.75 <0.05 <1 6.62 <1 1.68 <0.3 9.90 0.010 0.49 5 Digdeguash AQ0018 2011/11/03 17 <0.05 <1 6.62 <1 1.68 0.3 10.20 0.011 0.55 9 Digdeguash AQ0019 2011/11/03 0 <0.05 <1 6.64 <1 1.77 <0.3 9.90 0.011 0.59 <5 Digdeguash AQ0020 2011/11/03 0 <0.05 <1 6.61 <1 1.72 0.3 11.00 0.012 0.54 <5

43
Appendix G – Phytoplankton Characterization and Abundance
Table 1. Summary table indicating changes in surface water chemistry parameters with lake depth. BDL
represents datasets where levels were below detectable limits and changes could not be calculated.
Sampling Period Lake Site Depth (m) Δ TP (mg/L) Δ TN (mg/L) Δ TOC (mg/L) Δ Al (mg/L)
Early Summer Chamcook AR0010 7 BDL BDL 0 0
Utopia AQ0001 8 -0.001 BDL -0.200 0.004
Digdeguash AQ0018 16 0.002 BDL 0 0.030
Utopia AQ0005 23 0.002 BDL -0.200 0.026
Chamcook AR0012 30.5 BDL BDL -0.500 0.093
Late Summer Chamcook AR0010 7.5 BDL BDL 0 0.001
Utopia AQ0001 8 0 BDL 0.200 0.005
Digdeguash AQ0018 16 0 BDL 0.300 -0.010
Chamcook AR0012 18.5 BDL BDL 0.200 0
Utopia AQ0005 22.5 0.001 BDL 0 -0.002
Fall Chamcook AR0010 6.2 BDL BDL 0 -0.001
Utopia AQ0001 8.5 0.002 BDL 0 0.002
Digdeguash AQ0018 17 0.001 BDL 0.700 0
Utopia AQ0005 22.5 0.001 BDL 0 0.001
Chamcook AR0012 26 BDL BDL -0.500 -0.003

44
Appendix H – Phytoplankton Characterization and Abundance
Table 1a. Results of grab samples (500mL) taken from Lake Utopia in early summer (July 17, 2011) at
sample site AQ0001. Phytoplankton samples were analyzed by M.A. De Sève Consultants in Quebec.
LAKE UTOPIA; July 17, 2011
Sample Site AQ0001 Surface Secchi (2.6m)
Species #cells / L Percentage Biomass
(µg/l) #cells / L Percentage
Biomass (µg/l)
Chlorophyceae
Elakatothrix viridis 1281 0 0.26 1282 0 0.26
Sphaerocystis schroeteri 10250 2 0.00 0 0 0.00
Cyanobacteriophyceae
Anabaena flos-aquae 1281 0 0.15 1923 1 0.22
Aphanizomenon flos-aquae 17297 3 1.30 13461 4 1.01
Aphanocapsa holsatica 202442 31 0.10 0 0 0.00
Woronichinia naegeliana 90971 14 3.21 0 0 0.00
Bacillariophyceae
Asterionella formosa 0 0 0.00 5128 2 0.82
Cyclotella bodanica 4484 1 4.07 5128 2 4.65
Cyclotella sp. 1 41001 6 0.77 42306 13 0.80
Chrysophyceae
Uroglena sp. 1 10250 2 unknown 1282 0 unknown
Dinophyceae
Dinobryon cylindricum 3844 1 3.09 641 0 41.74
Dinobryion bavaricum 7047 1 2.92 1282 0 1.03
Xanthophyceae
Mallomonas sp. 1 6406 1 94.63 3205 1 47.34
Mallomonas sp. 2 1281 0 10.88 641 0 5.44
Cryptophyceae
Cryptomonas ovata 37798 6 155.08 30768 10 126.24
Cryptomonas sp. 1 216536 33 56.66 207684 66 54.34
Total 652171 100 333.11 314731 100 283.89

45
Table 1b. Results of grab samples (500mL) taken from Lake Utopia in early summer (July 17, 2011) at
sample site AQ0005. Phytoplankton samples were analyzed by M.A. De Sève Consultants in Quebec.
LAKE UTOPIA; July 17, 2011
Sample Site AQ0005 Surface Secchi (3.5m)
Species #cells / L Percentage Biomass
(µg/l) #cells / L Percentage
Biomass (µg/l)
Chlorophyceae
Elakatothrix gelatinosa 2563 0 0.60 1281 0 0.30
Elakatothrix viridis 1281 0 0.26 641 0 0.13
Micratinium pusillum 12813 2 1.68 8328 2 1.09
Cyanobacteriophyceae
Anabaena flos-aquae 6406 1 0.75 13453 4 1.57
Aphanizomenon flos-aquae 10250 2 0.77 39399 10 2.95
Aphanocapsa holsatica 138378 23 0.07 115956 30 0.06
Chroococcus limneticus 6406 1 0.74 27227 7 3.16
Woronichinia naegeliana 82002 13 2.89 0 0 0.00
Bacillariophyceae
Asterionella formosa 11532 2 1.85 6086 2 0.97
Cyclotella bodanica 11532 2 10.46 5125 1 4.65
Cyclotella sp. 1 12172 2 0.23 3844 1 0.07
Tabellaria fenestrata 10250 2 12.81 21461 6 26.83
Tabellaria flocculosa 2563 0 5.13 0 0 0.00
Chrysophyceae
Uroglena sp. 1 21782 4 unknown 21141 6 unknown
Dinophyceae
Ceratium hirundinella 641 0 41.71 1602 0 104.28
Dinobryon cylindricum 10250 2 8.24 8328 2 6.69
Dinobryion bavaricum 0 0 0.00 3524 1 1.46
Xanthophyceae
Mallomonas sp. 1 3203 1 47.31 6086 2 89.89
Mallomonas sp. 2 641 0 5.44 2563 1 21.76
Cryptophyceae
Cryptomonas ovata 31391 5 128.80 28829 8 118.28
Cryptomonas sp. 1 232552 38 60.85 66306 17 17.35
Total 608608 100 330.58 381181 100.00 401.51

46
Table 2a. Results of grab samples (500mL) taken from Lake Utopia in late summer (August 18, 2011) at
sample site AQ0001. Phytoplankton samples were analyzed by M.A. De Sève Consultants in Quebec.
LAKE UTOPIA; August 18, 2011
Sample Site AQ0001 Surface Secchi (3.1m)
Species #cells / L Percentage Biomass
(µg/L) #cells / L Percentage
Biomass (µg/L)
Chlorophyceae
Elakatothrix viridis 0 0 0.00 640 0 0.13
Elakatothrix gelatinosa 10880 4 2.55 0 0 0.00
Cyanobacteriophyceae
Anabaena flos-aquae 3840 1 0.45 2560 1 0.30
Aphanizomenon flos-aquae 6720 2 0.50 24320 8 1.82
Aphanocapsa holsatica 95680 35 0.05 39360 12 0.02
Chroococcus limneticus 2560 1 0.30 3840 1 0.45
Merismopedia tenuissima 10240 4 0.00 0 0 0.00
Microcystis flos-aquae 1600 1 0.05 0 0 0.00
Snowella lacustris 27200 10 0.12 6720 2 0.03
Woronichinia naegeliana 19840 7 0.70 100480 31 3.55
Bacillariophyceae
Asterionella formosa 14080 5 2.25 16960 5 2.71
Cyclotella bodanica 960 0 0.87 0 0 0.00
Cyclotella sp. 1 16640 6 0.31 22720 7 0.43
Fragilaria sp. 1 0 0 0.00 8960 3 2.82
Tabellaria fenestrata 0 0 0.00 640 0 0.80
Tabellaria flocculosa 8960 3 17.92 32000 10 64.00
Chrysophyceae
Uroglena sp. 1 5120 2 unknown 8640 3 unknown
Dinophyceae 0 0 0.00 0 0 0.00
Ceratium hirundinella 0 0 0.00 320 0 20.84
Dinobryion bavaricum 0 0 0.00 15040 5 6.23
Xanthophyceae
Mallomonas sp. 2 7040 3 59.77 9920 3 84.23
Cryptophyceae
Cryptomonas ovata 13760 5 56.46 14400 4 59.08
Cryptomonas sp. 1 25920 10 6.78 14080 4 3.68
Total 271040 100 149.10 321600 100 251.12

47
Table 2b. Results of grab samples (500mL) taken from Lake Utopia in late summer (August 18, 2011) at
sample site AQ0005. Phytoplankton samples were analyzed by M.A. De Sève Consultants in Quebec.
LAKE UTOPIA; August 18, 2011
Sample Site AQ0005 Surface Secchi (3.3m)
Species #cells / L Percentage Biomass
(µg/L) #cells / L Percentage
Biomass (µg/L)
Chlorophyceae
Elakatothrix viridis 1280 0 0.26 0 0 0.26
Cyanobacteriophyceae
Anabaena flos-aquae 24640 5 2.88 67520 16 7.90
Aphanizomenon flos-aquae 68480 14 5.14 17600 4 1.32
Aphanocapsa holsatica 80320 17 0.04 24000 6 0.01
Chroococcus limneticus 37440 8 4.34 3200 1 0.37
Merismopedia tenuissima 12800 3 0.01 35200 8 0.01
Microcystis flos-aquae 6720 1 0.23 0 0 0.26
Snowella lacustris 34880 7 0.16 43840 10 0.20
Woronichinia naegeliana 39040 8 1.38 52480 13 1.85
Bacillariophyceae
Asterionella formosa 22720 5 3.64 51200 12 8.19
Cyclotella bodanica 0 0 0.26 1920 0 1.74
Cyclotella sp. 1 17920 4 0.34 13120 3 0.25
Fragilaria sp. 1 8640 2 2.72 17600 4 5.54
Tabellaria flocculosa 24960 5 49.92 29440 7 58.88
Chrysophyceae
Uroglena sp. 1 29760 6 unknown 25280 6 0.00
Dinophyceae
Ceratium hirundinella 320 0 20.84 0 0 0.26
Xanthophyceae
Mallomonas sp. 2 3520 1 29.89 4480 1 38.04
Cryptophyceae
Cryptomonas ovata 13440 3 55.14 21120 5 86.65
Cryptomonas sp. 1 58240 12 15.24 10240 2 2.68
Total 485120 100 192.14 418240 100 213.64

48
Table 3a. Results of grab samples (500mL) taken from Chamcook Lake in early summer (July 17, 2011)
at sample site AR0010. Phytoplankton samples were analyzed by M.A. De Sève Consultants in Quebec.
CHAMCOOK LAKE; July 17, 2011
Sample Site AR0010 Surface Secchi (6.3m)
Species #cells / L Percentage Biomass
(µg/L) #cells / L Percentage
Biomass (µg/L)
Chlorophyceae
Chlamydomonas sp. 1 7688 2 0.77 0 0 0.00
Cosmarium sp. 1 2563 1 40.17 7047 3 110.46
Elakatothrix gelatinosa 1922 1 0.45 3844 2 0.90
Micratinium pusillum 12813 4 1.68 24344 11 3.19
Quadrigula closterioides 2563 1 0.86 2563 1 0.86
Cyanobacteriophyceae
Aphanizomenon flos-aquae 3203 1 0.24 2563 1 0.19
Aphanocapsa holsatica 45485 14 0.02 28188 12 0.01
Chroococcus limneticus 0 0 0.00 5125 2 0.59
Gloeotrichia echinulata 76877 24 4.92 0 0 0.00
Bacillariophyceae
Asterionella formosa 16657 5 2.67 11532 5 1.85
Cyclotella bodanica 8328 3 7.55 12813 6 11.62
Tabellaria fenestrata 87768 28 109.71 69830 31 87.29
Tabellaria flocculosa 21141 7 42.28 12813 6 25.63
Dinophyceae
Ceratium hirundinella 641 0 41.71 0 0 0.00
Dinobryon cylindricum 15375 5 12.36 34595 15 27.81
Dinobryion bavaricum 0 0 0.00 3844 2 1.59
Peridinium inconspicuum 641 0 4.35 1281 1 8.69
Xanthophyceae
Mallomonas sp. 2 1281 0 10.88 2563 1 21.76
Cryptophyceae
Cryptomonas ovata 1281 0 5.26 3203 1 13.14
Cryptomonas sp. 1 12172 4 3.19 1922 1 0.50
Total 318398 100 289.05 228068 100 316.08

49
Table 3b. Results of grab samples (500mL) taken from Chamcook Lake in early summer (July 17, 2011)
at sample site AR0012. Phytoplankton samples were analyzed by M.A. De Sève Consultants in Quebec.
CHAMCOOK LAKE; July 17, 2011
Sample Site AR0012 Surface Secchi (5.8m)
Species #cells / L Percentage Biomass
(µg/L) #cells / L Percentage
Biomass (µg/L)
Chlorophyceae
Chlamydomonas sp. 1 1922 1 0.19 0 0 0.00
Cosmarium sp. 1 4484 2 70.29 1922 0 30.13
Quadrigula closterioides 8969 4 3.00 0 0 0.00
Cyanobacteriophyceae
Anabaena flos-aquae 7688 3 0.90 0 0 0.00
Aphanizomenon flos-aquae 3203 1 0.24 0 0 0.00
Aphanocapsa holsatica 72392 28 0.04 78799 14 0.04
Chroococcus limneticus 23063 9 2.68 10250 2 1.19
Gloeotrichia echinulata 0 0 0.00 224224 41 14.35
Bacillariophyceae
Asterionella formosa 0 0 0.00 15375 3 2.46
Cyclotella bodanica 10891 4 9.87 0 0 0.00
Fragilaria sp. 1 1922 1 0.61 19219 4 6.05
Tabellaria fenestrata 49329 19 61.66 105065 19 131.33
Tabellaria flocculosa 7047 3 14.09 8969 2 17.94
Dinophyceae
Dinobryon cylindricum 48689 19 39.14 74314 14 59.74
Peridinium inconspicuum 641 0 4.35 1922 0 13.04
Xanthophyceae
Mallomonas sp. 2 0 0 0.00 1281 0 10.88
Cryptophyceae
Cryptomonas ovata 5766 2 23.66 2563 0 10.51
Cryptomonas sp. 1 9610 4 2.51 1922 0 0.50
Total 255615 100 233.23 545825 100 298.16

50
Table 4a. Results of grab samples (500mL) taken from Chamcook Lake in late summer (August 17, 2011)
at sample site AR0010. Phytoplankton samples were analyzed by M.A. De Sève Consultants in Quebec.
CHAMCOOK LAKE; August 17, 2011
Sample Site AR0010 Surface Secchi (6m)
Species #cells / L Percentage Biomass
(µg/L) #cells / L Percentage
Biomass (µg/L)
Chlorophyceae Elakatothrix viridis 3844 0 0.77 7688 1 1.54
Cyanobacteriophyceae
Anabaena flos-aquae 22422 1 2.62 0 0 0.20
Aphanizomenon flos-aquae 42282 2 3.17 13453 1 1.01
Aphanothece clathrata 45485 2 0.07 0 0 0.20
Chroococcus limneticus 10250 1 1.19 5125 0 0.59
Gloeotrichia echinulata 1374812 72 87.99 1160839 84 74.29
Merismopedia tenuissima 41001 2 0.02 53814 4 0.02
Microcystis flos-aquae 13453 1 0.45 13453 1 0.45
Snowella lacustris 22422 1 0.10 0 0 0.20
Woronichinia naegeliana 166566 9 5.88 0 0 0.20
Bacillariophyceae
Cyclotella bodanica 641 0 0.58 0 0 0.20
Tabellaria flocculosa 11532 1 23.06 1281 0 2.56
Dinophyceae
Dinobryon cylindricum 5125 0 4.12 4484 0 1.86
Peridinium inconspicuum 6406 0 43.45 9610 1 65.18
Xanthophyceae
Mallomonas sp. 2 1922 0 16.32 1281 0 10.88
Cryptophyceae
Cryptomonas ovata 11532 1 47.31 10250 1 42.06
Cryptomonas sp. 1 139659 7 36.54 94174 7 24.64
Total 1919356 100 273.65 1375453 100 225.09

51
Table 4b. Results of grab samples (500mL) taken from Chamcook Lake in late summer (August 17,
2011) at sample site AR0012. Phytoplankton samples were analyzed by M.A. De Sève Consultants in
Quebec.
CHAMCOOK LAKE; August 17, 2011
Sample Site AR0012 Surface Secchi (6m)
Species #cells / L Percentage Biomass
(µg/L) #cells / L Percentage
Biomass (µg/L)
Chlorophyceae
Elakatothrix viridis 6406 1 1.29 19219 2 3.86
Cyanobacteriophyceae
Aphanizomenon flos-aquae 26266 2 1.97 0 0 0.00
Aphanocapsa holsatica 0 0 0.00 15375 2 0.01
Aphanothece clathrata 72392 6 0.11 71111 8 0.11
Chroococcus limneticus 10250 1 1.19 73033 8 8.47
Gloeotrichia echinulata 763642 61 48.87 505465 55 32.35
Merismopedia tenuissima 82002 7 0.03 0 0 0.00
Microcystis flos-aquae 6406 1 0.21 0 0 0.00
Snowella lacustris 80080 6 0.36 0 0 0.00
Woronichinia naegeliana 0 0 0.00 46126 5 1.63
Bacillariophyceae
Cyclotella bodanica 0 0 0.00 641 0 0.58
Tabellaria fenestrata 2563 0 3.20 1281 0 1.60
Tabellaria flocculosa 2563 0 5.13 3203 0 6.41
Dinophyceae
Dinobryion bavaricum 48048 4 19.91 3844 0 1.59
Peridinium inconspicuum 1922 0 13.04 6406 1 43.45
Xanthophyceae
Mallomonas sp. 2 1922 0 16.32 1922 0 16.32
Cryptophyceae
Cryptomonas ovata 10891 1 44.68 8969 1 36.80
Cryptomonas sp. 1 128128 10 33.53 156316 17 40.90
Total 1243481 100 189.84 912911 100 194.08

52
Table 5. Results of grab samples (500mL) taken from Digdeguash Lake in early summer (July 17, 2011)
at sample site AQ0018. Phytoplankton samples were analyzed by M.A. De Sève Consultants in Quebec.
DIGDEGUASH LAKE; July 17, 2011
Sample Site AQ0018 Surface Secchi (2.4 m)
Species #cells / L Percentage Biomass
(µg/L) #cells / L Percentage
Biomass (µg/L)
Chlorophyceae
Chlamydomonas sp. 1 32673 7 3.28 7367 1 0.74
Elakatothrix viridis 0 0 0.00 1281 0 0.26
Cyanobacteriophyceae
Anabaena flos-aquae 2563 1 0.30 3203 0 0.37
Aphanocapsa delicatissima 0 0 0.00 29149 3 0.00
Aphanocapsa holsatica 92893 19 0.05 233833 25 0.12
Chroococcus limneticus 7688 2 0.89 3844 0 0.45
Merismopedia tenuissima 262022 53 0.10 600920 63 0.24
Woronichinia naegeliana 0 0 0.00 17618 2 0.62
Bacillariophyceae
Cyclotella sp. 1 13453 3 0.25 11211 1 0.21
Fragilaria sp. 1 8969 2 2.83 8008 1 2.52
Tabellaria flocculosa 0 0 0.00 641 0 1.28
Dinophyceae
Gymnodinium sp. 1 320 0 1.05 0 0 0.00
Xanthophyceae
Mallomonas sp. 2 2563 1 21.76 2883 0 24.48
Mallomonas urnaformis 13453 3 189.74 5766 1 81.32
Cryptophyceae
Cryptomonas ovata 5125 1 21.03 6086 1 24.97
Cryptomonas sp. 1 54775 11 14.33 22422 2 5.87
Total 496496 100.00 255.62 954233 100.00 143.45
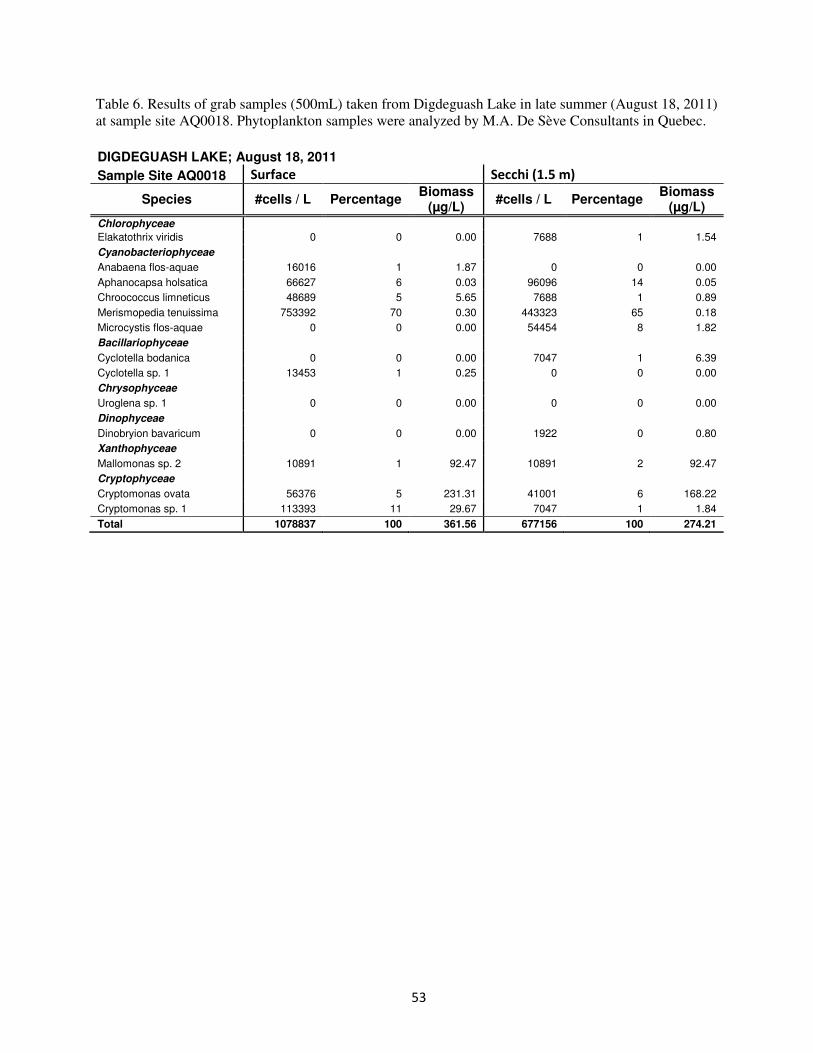
53
Table 6. Results of grab samples (500mL) taken from Digdeguash Lake in late summer (August 18, 2011)
at sample site AQ0018. Phytoplankton samples were analyzed by M.A. De Sève Consultants in Quebec.
DIGDEGUASH LAKE; August 18, 2011
Sample Site AQ0018 Surface Secchi (1.5 m)
Species #cells / L Percentage Biomass
(µg/L) #cells / L Percentage
Biomass (µg/L)
Chlorophyceae Elakatothrix viridis 0 0 0.00 7688 1 1.54
Cyanobacteriophyceae
Anabaena flos-aquae 16016 1 1.87 0 0 0.00
Aphanocapsa holsatica 66627 6 0.03 96096 14 0.05
Chroococcus limneticus 48689 5 5.65 7688 1 0.89
Merismopedia tenuissima 753392 70 0.30 443323 65 0.18
Microcystis flos-aquae 0 0 0.00 54454 8 1.82
Bacillariophyceae
Cyclotella bodanica 0 0 0.00 7047 1 6.39
Cyclotella sp. 1 13453 1 0.25 0 0 0.00
Chrysophyceae
Uroglena sp. 1 0 0 0.00 0 0 0.00
Dinophyceae
Dinobryion bavaricum 0 0 0.00 1922 0 0.80
Xanthophyceae
Mallomonas sp. 2 10891 1 92.47 10891 2 92.47
Cryptophyceae
Cryptomonas ovata 56376 5 231.31 41001 6 168.22
Cryptomonas sp. 1 113393 11 29.67 7047 1 1.84
Total 1078837 100 361.56 677156 100 274.21