an investigation into factors impacting financial exclusion at the bottom of the pyramid in south...
TRANSCRIPT

Full Terms & Conditions of access and use can be found athttp://www.tandfonline.com/action/journalInformation?journalCode=cdsa20
Download by: [University of Pretoria] Date: 02 June 2016, At: 05:36
Development Southern Africa
ISSN: 0376-835X (Print) 1470-3637 (Online) Journal homepage: http://www.tandfonline.com/loi/cdsa20
An investigation into factors impacting financialexclusion at the bottom of the pyramid in SouthAfrica
John P Wentzel, Krishna Sundar Diatha & Venkata Seshachal Sarma Yadavalli
To cite this article: John P Wentzel, Krishna Sundar Diatha & Venkata Seshachal SarmaYadavalli (2016) An investigation into factors impacting financial exclusion at the bottomof the pyramid in South Africa, Development Southern Africa, 33:2, 203-214, DOI:10.1080/0376835X.2015.1120648
To link to this article: http://dx.doi.org/10.1080/0376835X.2015.1120648
Published online: 01 Feb 2016.
Submit your article to this journal
Article views: 65
View related articles
View Crossmark data
An investigation into factors impacting financial exclusion atthe bottom of the pyramid in South AfricaJohn P Wentzela, Krishna Sundar Diathab and Venkata Seshachal Sarma Yadavallic
aAdjunct Faculty, Gordon Institute of Business Science, University of Pretoria, South Africa; bProfessor,Production & Operations Management Area, Indian Institute of Management Bangalore, India; cProfessor,Department of Industrial & Systems Engineering, University of Pretoria, South Africa.
ABSTRACTFinancial exclusion has been shown to have negative socio-economic effects on citizens, especially at the bottom of theeconomic pyramid. South Africa suffers from high levels offinancial exclusion, disproportionately at the bottom of thepyramid. This study investigates nine factors identified from theliterature as being positively associated with financial exclusionusing a logistic regression model. The findings show that the mostsignificant factors associated with being financially excluded atthe bottom of the pyramid in South Africa were educational level,primary source of income, age, home language and number ofdependents. The study further found that gender, relationshipstatus and home ownership were not associated with beingfinancially excluded. An interesting finding was that living in arural area as opposed to an urban area was not significantlyassociated with being excluded. The findings and theirimplications for expanding financial inclusion at the bottom of thepyramid are discussed.
KEYWORDSFinancial exclusion; bottomof the pyramid; logisticregression
1. Introduction
The term financial exclusion was first used by geographers who were concerned aboutlimited physical access to banking services as a result of bank branch closures in theUnited Kingdom (Leyshon & Thrift, 1995). The closure of banking branches resulted inpeople and certain groups not being able to access the financial services infrastructure.In the absence of alternative providers, these individuals and groups risked becomingexcluded from the formal financial services system. Numerous definitions of financialexclusion now exist in the literature. Financial exclusion has been defined as the inabilityof some societal groups to access the formal financial system (Carbo et al., 2005). Accord-ing to Conroy (2005) financial exclusion is a process that prevents poor and disadvantagedsocial groups from gaining access to the formal financial systems of their countries. Mohan(2006) holds that financial exclusion signifies the lack of access by certain segments of thesociety to appropriate, low-cost, fair and safe financial products and services from main-stream providers. Being financially excluded means households, and micro and small
© 2016 Government Technical Advisory Centre (GTAC)
CONTACT Krishna Sundar Diatha [email protected] Professor of Operations Management, Indian Institute ofManagement Bangalore, India 560076
DEVELOPMENT SOUTHERN AFRICA, 2016VOL. 33, NO. 2, 203–214http://dx.doi.org/10.1080/0376835X.2015.1120648
Dow
nloa
ded
by [
Uni
vers
ity o
f Pr
etor
ia]
at 0
5:36
02
June
201
6
enterprises, deal entirely in cash and are susceptible to irregular cash flows. Financialexclusion increases the risk of loss through theft and leaves people at the mercy of pred-atory practices from unregulated credit providers (Mohan, 2006).
The most basic form of formal financial inclusion is access to a bank account (Finscope,2010, 2011). People who do not have a basic bank account are thus defined as financiallyexcluded. People who do not have a bank account may, however, make use of informalfinancial services. A distinction thus needs to be drawn between being totally financiallyexcluded and formal financial exclusion. At a macroeconomic level, financial exclusioncan retard economic growth and increase poverty and inequality. It has been shown(Banerjee & Newman, 1993) that lack of broad access can generate persistent incomeinequality or poverty traps at a country level. Some researchers (Hulme & Mosley,1996; Yunus & Jolis, 2003) suggest that provisioning of financial services is among themost potent tools to reduce poverty and empower the poor. It has been shown (Sarma& Pais, 2011) that levels of human development and financial inclusion move in close cor-relation with each other at a country level.
The term ‘bottom of the pyramid’ was first described in 2002 (Prahalad & Hart, 2002).The authors divided the global population into four tiers creating a pyramid. At thebottom of the pyramid were four billion people whose per-capita income based on pur-chasing power parity was less than $1500 per annum, the minimum considered necessaryto sustain a decent life. Whilst this presented an untapped market for business, investing inthe bottom of the pyramid would also mean lifting billions of people out of poverty anddesperation. In a subsequent paper, Prahalad & Hammond (2002) argued that people atthe bottom of the pyramid pay higher prices for goods and services compared withmiddle-class consumers. Prahalad (2006) argued that serving bottom-of-the pyramid cus-tomers was not only a profitable opportunity for business, but also a social imperative. Byaddressing the problems at bottom of the pyramid, poverty and the living conditions of theworld’s poorest could be improved (Prahalad, 2006).
2. Research problem
Studies into financial exclusion in South Africa (Finscope, 2010, 2011) found that at least27% of the population was financially excluded, as they did not hold a bank account. Thisportion of the population is referred to as the unbanked. The ability to identify demo-graphic factors associated with being unbanked would allow easier identification of vul-nerable populations and enable more targeted intervention to address the problem ofbeing unbanked at the bottom of the pyramid. Research into factors associated with finan-cial exclusion has been reported previously.
Gender, social class, age, marital status, household income, ethnicity, region, edu-cational attainment, employment status, housing tenure and number of people in thehousehold were all factors associated with financial exclusion in the United Kingdom(Devlin, 2005). Research in the United States found that gender, net worth, age and house-hold size had an impact upon bank financial services ownership (Hogarth & O’Donnell,1997). Research in Europe has shown that financial exclusion among households hasvery strong links to low income and age, with the youngest and oldest people in societybeing the most likely to be excluded (European Commission, 2010). Geography hasalso been reported as being associated with financial exclusion with regional variations
204 J. P. WENTZEL ET AL.
Dow
nloa
ded
by [
Uni
vers
ity o
f Pr
etor
ia]
at 0
5:36
02
June
201
6
reported in the United States (Hogarth & O’Donnell, 1997) and some evidence of regionalvariations in the United Kingdom (Kempson et al., 2000). Housing tenure was shown to bethe second most important influence on total financial exclusion, with those in socialhousing – either housing association or, in particular, local authority housing – farmore likely to be excluded (Devlin, 2009).
Similar studies into financial exclusion have been conducted in emerging economiessuch as South Africa. In studying financial exclusion in Latin America (Solo, 2008) itwas found that there was a correlation between being unbanked and lower educationand income levels compared with banked people. In rural India, women have remainedconsiderably more deprived of basic banking services as compared with men (Chavan,2008), suggesting a gender association for financial exclusion. In Kenya and Ugandapeople in the 18 to 24 age category were significantly more likely to be financially excludedwhen compared with other age groups (Johnson & Nino-Zarazua, 2011). Further studiesin Kenya found income, education level, gender and location associated with being finan-cially excluded (Johnson & Arnold, 2010). A study into financial exclusion in Nigeria(Amaeshi, 2006) found that education levels – in particular, illiteracy – were stronglyassociated with financial exclusion. In Ghana, a study into financial exclusion in ruralcommunities found that it was associated with, among other factors, illiteracy, dependencyand unemployment (Osei-Assibey, 2009).
From the literature survey, numerous factors have been identified as being associatedwith financial exclusion. Using the literature review as a basis, the authors identifiedeight demographic factors highlighted in previous studies as possibly associated withbeing financially excluded. These factors were gender, age, primary source of income,home ownership status, marital status, highest level of education attained, the numberof dependents supported by the respondent and geographic location. With 11 officiallanguages in South Africa, the authors also decided to investigate whether there was anassociation between home language and financial exclusion.
3. Methodology
The research sought to study bottom-of-the-pyramid people, so there was a need tosegment the population in a meaningful way to identify bottom-of-the-pyramid respon-dents. It was decided to use the Living Standards Measure (LSM) to segment the SouthAfrican population and identify the sample that met the criteria for bottom of thepyramid. The South African Advertising Research Foundation developed the LSM meth-odology in the 1980s for market segmentation. The LSM methodology classifies the popu-lation into 10 categories from LSM 1 to LSM 10. It is a household-level multi-attribute toolthat uses access to services, durables and geographic indicators as determinants of thestandard of living of a household. The LSM tool has been widely used for market segmen-tation and understating living conditions in South Africa (Møller, 1997; De Jager, 2004;Martins, 2004). One of the advantages of the methodology is the avoidance of self-reportedincome as a basis for segmenting the population. The All Media and Products Survey 2011data on average household income as a function of LSM was used to determine the LSMcut-off value for the bottom of the pyramid (South Africa Advertising Research Foun-dation, 2011). The original definition of per-capita income was based on purchasingpower parity, and the average dollar/rand exchange rate for 2011 was used to calculate
DEVELOPMENT SOUTHERN AFRICA 205
Dow
nloa
ded
by [
Uni
vers
ity o
f Pr
etor
ia]
at 0
5:36
02
June
201
6

the dollar equivalent of the per-capita income. From the analysis it was found that LSM 1to LSM 4 cover the bottom of the pyramid in South Africa.
Data were drawn as a subset from those collected as part of continuing research on thebottom of the pyramid in South Africa. Data collection took the form of an administeredquestionnaire delivered at the respondent’s place of residence. The approach of usingadministered questionnaires offered advantages over alternative approaches. Theapproach is potentially the least burdensome on the respondent and merely requiresthe respondent to speak the same language in which the questions are asked. Administeredquestionnaires also score higher for completeness than alternative approaches (Bowling,2005). The pre-testing of the questionnaire was done systematically using face validityand content validity, as recommended by Cavana et al. (2001). The focus of the question-naire was to understand the respondent in the context of their household and community,their access to financial services infrastructure and their demographics. The final question-naire consisted of 14 sections, contained 95 questions and took on average 45 minutes toadminister.
The sampling methodology sought to obtain a country representative sample from thebottom of the pyramid. To ensure that the sample geographically represented the overallpopulation, the classification of the entire country by enumerator areas (EAs) was used asthe basis for calculating the sample plan (Statistics South Africa, 2003). A total of 650 EAswere analysed for total population and an average LSM was determined. Using these data,the appropriate EAs were selected and the number of required responses per EA wasdetermined. Using the resultant data, the sample was drawn proportional to populationsize in that EA. Between four and six interviewers were assigned per EA. To correctlyidentify respondents, two further levels of random sampling were deployed. Withineach EA, households were randomly selected and individual respondents were then ran-domly selected from adults in each sampled household using the Kish grid method (Kish,1949). This approach has also been followed by other studies into financial inclusion inSouth Africa (Finscope, 2010, 2011).
The data collection produced a total of 1997 completed questionnaires covering LSM 1to LSM 6. From the LSM classification it was determined that 615 respondents in thesample could be classified as bottom of the pyramid. Based on the All Media and ProductsSurvey 2011 data, the total LSM 1 to LSM 4 population of adults 15 years and older inSouth Africa was 10 542 000. The data consequently had a 3.72% confidence interval ata 95% confidence level. Out of the sample of 615, a total of 276 (44.9%) did not holdbank accounts. The nine independent variables (age, gender, residential area, home own-ership status, home language, number of dependents, primary source of income, highestlevel of education attained and relationship status) were a mixture of dichotomous, categ-orical and continuous variables.
Age was determined from date of birth and was a continuous variable. Gender was adichotomous variable (male or female), as was residential area (urban or non-urban).The remaining variables were categorical. The authors used the descriptors and definitionsused in previous studies into financial exclusion (Finscope, 2010, 2011) to determine thecategories for the remaining variables. The result was 15 categories for primary source ofincome, six categories for relationship status, seven categories for highest educationalattainment, five categories for home ownership status, seven categories for number ofdependents and 12 categories for home language.
206 J. P. WENTZEL ET AL.
Dow
nloa
ded
by [
Uni
vers
ity o
f Pr
etor
ia]
at 0
5:36
02
June
201
6
4. Results
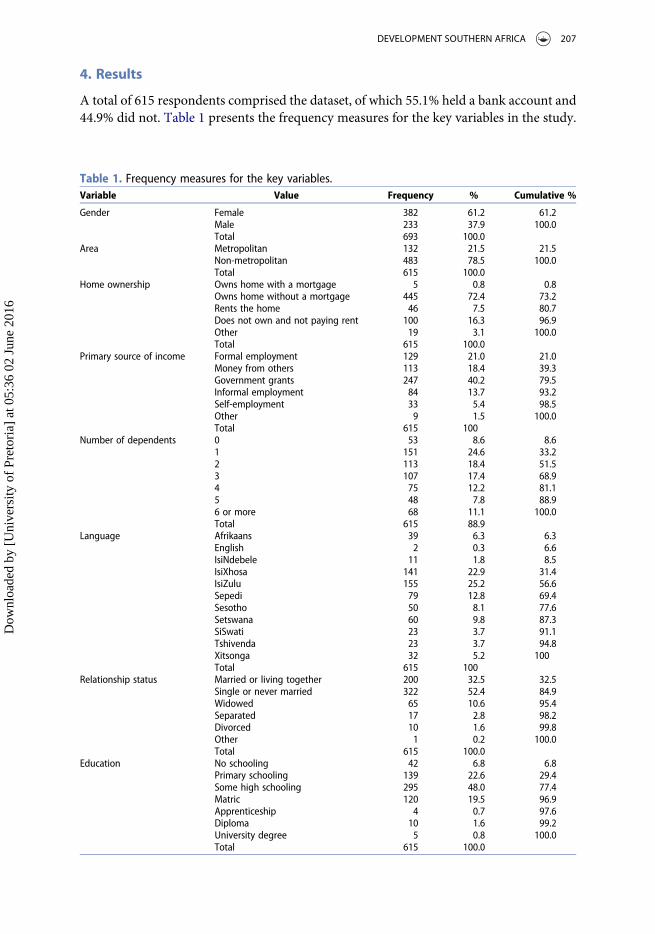
A total of 615 respondents comprised the dataset, of which 55.1% held a bank account and44.9% did not. Table 1 presents the frequency measures for the key variables in the study.
Table 1. Frequency measures for the key variables.Variable Value Frequency % Cumulative %
Gender Female 382 61.2 61.2Male 233 37.9 100.0Total 693 100.0
Area Metropolitan 132 21.5 21.5Non-metropolitan 483 78.5 100.0Total 615 100.0
Home ownership Owns home with a mortgage 5 0.8 0.8Owns home without a mortgage 445 72.4 73.2Rents the home 46 7.5 80.7Does not own and not paying rent 100 16.3 96.9Other 19 3.1 100.0Total 615 100.0
Primary source of income Formal employment 129 21.0 21.0Money from others 113 18.4 39.3Government grants 247 40.2 79.5Informal employment 84 13.7 93.2Self-employment 33 5.4 98.5Other 9 1.5 100.0Total 615 100
Number of dependents 0 53 8.6 8.61 151 24.6 33.22 113 18.4 51.53 107 17.4 68.94 75 12.2 81.15 48 7.8 88.96 or more 68 11.1 100.0Total 615 88.9
Language Afrikaans 39 6.3 6.3English 2 0.3 6.6IsiNdebele 11 1.8 8.5IsiXhosa 141 22.9 31.4IsiZulu 155 25.2 56.6Sepedi 79 12.8 69.4Sesotho 50 8.1 77.6Setswana 60 9.8 87.3SiSwati 23 3.7 91.1Tshivenda 23 3.7 94.8Xitsonga 32 5.2 100Total 615 100
Relationship status Married or living together 200 32.5 32.5Single or never married 322 52.4 84.9Widowed 65 10.6 95.4Separated 17 2.8 98.2Divorced 10 1.6 99.8Other 1 0.2 100.0Total 615 100.0
Education No schooling 42 6.8 6.8Primary schooling 139 22.6 29.4Some high schooling 295 48.0 77.4Matric 120 19.5 96.9Apprenticeship 4 0.7 97.6Diploma 10 1.6 99.2University degree 5 0.8 100.0Total 615 100.0
DEVELOPMENT SOUTHERN AFRICA 207
Dow
nloa
ded
by [
Uni
vers
ity o
f Pr
etor
ia]
at 0
5:36
02
June
201
6

In the sample, 62.1% of the respondents were female and 37.9% male. This ratio ishigher than the reported ratio for the country, which is 51.5% female and 48.5%male (Statistics South Africa, 2012). The reason for the difference between the twonumbers is not immediately apparent, but may be related to the time of day whenagents visited the homes. Interviews were conducted during the day and males mayhave been away working. Another possible explanation in rural areas is that malesmay be away working in urban areas and thus no males were living in the home atthe time of the interview. The average age of respondents was 39.5 years with a standarddeviation of 16.3 years. The results showed that the majority of bottom-of-the-pyramidcitizens live in rural areas. Only 21.5% of respondents were found to be living in urbanareas. Education attainment at the bottom of the pyramid showed a significant failure tocomplete formal schooling. Only 22.6% of respondents report having completed school-ing, and only 3.1% reported having completed further education such as an apprentice-ship or tertiary qualification. The problem of formal unemployment at the bottom of thepyramid is also evident. Only 21% of respondents held a formal job, with a further13.7% holding an informal job. In recent years the South African government has sig-nificantly expanded its grant programme, and the effect of this can be clearly seen. Some40.2% of respondent report that government grants (child support, old age pension anddisability grants) were their primary source of income. The dependence for the bottomof the pyramid on friends and family as primary sources of income is also seen, with18.4% of respondents dependent on friends and family as their primary source ofincome.
The study sought to determine which, if any, of the nine variables were statisticallyassociated with being unbanked at the bottom of the pyramid in South Africa. The depen-dent variable, being unbanked (UN), is dichotomous in that a respondent is either bankedor unbanked. Respondents who did not know their banking status were excluded from thestudy. The nine independent variables of interest were either dichotomous (residentialarea, gender) or categorical (age, marital status, highest level of education, primarysource of income, number of dependents, home language, home ownership status). Theindependent variable age was recorded as a continuous variable, but recoded into cat-egories. This was done in order to compare the results with banking usage results reportedpreviously (Finscope, 2010, 2011) which used the same age categories. In order to test therelationship between the dichotomous dependent and dichotomous and categorical inde-pendent variables, a logistic regression was chosen to conduct the investigation. A logisticregression is well suited to describing or testing a hypothesis between categorical ordichotomous independent and dependent variables (Peng et al., 2002). A logisticregression does not make any assumptions of normality, linearity or homogeneity forthe independent variables and is well suited for analysing dichotomous outcomes (Peng& So, 2002, Peng et al., 2002). Logistic regression has further been successfully used toidentify variables associated with financial exclusion (Devlin, 2009; Johnson & Nino-Zarazua, 2011).
For the logistic expression the independent variable was unbanked (UN). The depen-dent variables were age (A), gender (G), residential area (R), home ownership status (H),primary source of income (I), number of dependents (D), home language (L), relationshipstatus (M) and highest level of educational attainment (E). The form of the equation was
208 J. P. WENTZEL ET AL.
Dow
nloa
ded
by [
Uni
vers
ity o
f Pr
etor
ia]
at 0
5:36
02
June
201
6
thus:
UN = f (A, G, R, H, I, D, L, M, E) (1)
To conduct the analysis IBM, SPSS Statistics 20.0.0 software was used. The standarddummy variable technique was applied in which the first mentioned category is used asthe reference category in the final equation. The approach generates coefficients, standarderrors and significance levels of a predicted logit transformation of the probability of pres-ence of the variable of interest. The logistic expression used was thus:
logit(pUN) = b0 + b1A+ b2G+ b3R+ b4H + b5I + b6D+ b7L+ b8M + b9E (2)
where pUN is the probability of being unbanked and bi are the coefficients of theexpression. To assess whether the expression was a good fit to the observed data, theHosmer & Lemeshow (2000) goodness-of-fit statistic was used. Use of the Hosmer andLemeshow statistic was appropriate because the independent variables were categoricalor dichotomous. While the logistic regression may indicate a good overall fit of the vari-ables to the data, it is by no means certain that each variable in the logistic expression issignificant. In order to determine the significance of individual coefficients in the logisticexpression, the Wald Test was used (Polit, 1996; Agresti, 2007). The Wald test determineswhether the parameters associated with a group of explanatory variables is zero. If, for aparticular explanatory variable or group of explanatory variables, the Wald test is signifi-cant then it can be concluded that the parameters associated with these variables are notzero. Consequently, the variables have explanatory power in the logistic expression. If theWald test is not significant then these explanatory variables can be omitted from theexpression.
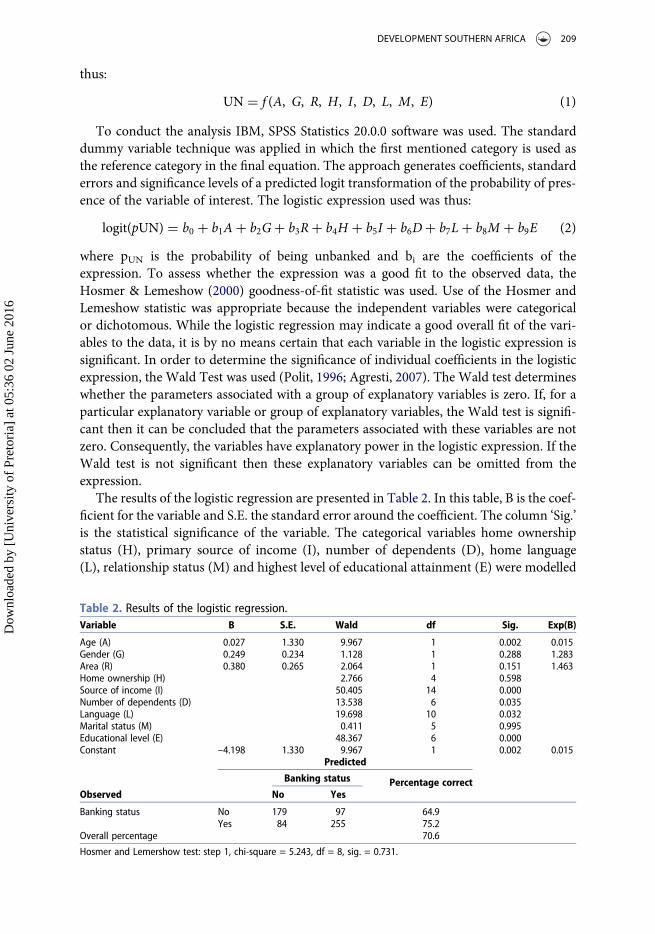
The results of the logistic regression are presented in Table 2. In this table, B is the coef-ficient for the variable and S.E. the standard error around the coefficient. The column ‘Sig.’is the statistical significance of the variable. The categorical variables home ownershipstatus (H), primary source of income (I), number of dependents (D), home language(L), relationship status (M) and highest level of educational attainment (E) were modelled
Table 2. Results of the logistic regression.Variable B S.E. Wald df Sig. Exp(B)
Age (A) 0.027 1.330 9.967 1 0.002 0.015Gender (G) 0.249 0.234 1.128 1 0.288 1.283Area (R) 0.380 0.265 2.064 1 0.151 1.463Home ownership (H) 2.766 4 0.598Source of income (I) 50.405 14 0.000Number of dependents (D) 13.538 6 0.035Language (L) 19.698 10 0.032Marital status (M) 0.411 5 0.995Educational level (E) 48.367 6 0.000Constant –4.198 1.330 9.967 1 0.002 0.015
Observed
Predicted
Banking status Percentage correctNo Yes
Banking status No 179 97 64.9Yes 84 255 75.2
Overall percentage 70.6
Hosmer and Lemershow test: step 1, chi-square = 5.243, df = 8, sig. = 0.731.
DEVELOPMENT SOUTHERN AFRICA 209
Dow
nloa
ded
by [
Uni
vers
ity o
f Pr
etor
ia]
at 0
5:36
02
June
201
6

using the standard dummy variable procedure in SPSS. As a consequence there is no coef-ficient listed in the table because they were not variables in the equation. Dummy vari-ables, which code for these variables, have coefficients. The recommended format ofprevious authors (Peng et al., 2002) was used in reporting the results of the logisticregression.
The test of the logistic regression against a constant was found to be significant. TheHosmer and Lemeshow goodness-of-fit statistic was 0.731, which was significant. Theresult indicates that the variables as a set reliability distinguish between being bankedand unbanked at the bottom of the pyramid in South Africa. The overall predictionsuccess of the expression was 70.6%. The logistic expression correctly predicted beingunbanked 75.2% of the time and being banked 64.9% of the time. The Wald criterionfor each of the variables in the expression was also determined. The variable is significantin the expression if the significant of theWald statistic is significant at the p < 0.05 level. Ofthe nine variables in the logistic expression, four were found not to be significant at the p <0.05 level. These variables were residential area (R), gender (G), home ownership status(H) and relationship status (M). The remaining variables in the expression – homelanguage (L), number of dependents (D), age (A), primary source of income (I) andhighest educational attainment (E) –were found to be significant.
The logistic analysis was repeated with the four non-significant variables – area (R),gender (G), home ownership status (H) and relationship status (M) – removed. TheHosmer and Lemeshow goodness-of-fit improved slightly to 0.759. The overall predictionsuccess of the expression declined slightly to 70.2%. The logistic expression correctly pre-dicted being unbanked 74.0% of the time and being banked 65.6% of the time. The Waldcriterion for each of the remaining variables in the expression was also determined, andthey showed little movement in the values or significance of the Wald statistics. The analy-sis confirmed that the four non-significant variables had no meaningful impact on the pre-diction of being unbanked at the bottom of the pyramid in South Africa. Table 3 presentsthe Wald statistic and significance level of each of the five independent variables in thelogistic equation. The use of both values allows a determination of which variables arethe most significant in predicting being unbanked at the bottom of the pyramid inSouth Africa.
Table 3. Results of the logistic regression with significant variables.Variable B S.E. Wald df Sig. Exp(B)
Age (A) 0.027 0.010 7.099 1 0.008 1.027Source of Income (I) 50.713 14 0.000Number of dependents (D) 14.340 6 0.026Language (L) 22.814 10 0.011Educational level (E) 51.238 6 0.000Constant 0.886 1.866 0.226 1 0.635 2.426
Observed
Predicted
Banking Status PercentageNo Yes Correct
Banking status No 181 95 65.6Yes 88 251 74.0
Overall percentage 70.2
Hosmer and Lemershow test: Step = 1, chi-square = 4.989, df = 8, sig. = 0.759.
210 J. P. WENTZEL ET AL.
Dow
nloa
ded
by [
Uni
vers
ity o
f Pr
etor
ia]
at 0
5:36
02
June
201
6

From the significant values it can be seen that the highest level of education attainment(E) is the most significant independent variable in the expression with p < 0.000 and aWald value of 51.238. This is closely followed by primary source of income (I). The age(A) of the respondents and their home language (L) follow in order of significance, fol-lowed by the number of dependents (D) that is the least significant.
The findings shows that the most significant variables associated with being unbankedat the bottom of the pyramid in South Africa were education level, primary source ofincome, age, home language and number of dependents. Education level was the most sig-nificant predictor of being unbanked. We observed a correlation between level of edu-cational attainment and being unbanked. In total, 71.4% of respondents with noschooling were unbanked compared with 26.6% of respondents who had completedMatric. Respondents who had some form of tertiary education (apprenticeship, diplomaor university degree) had the lowest level of being unbanked (15.8%).
The second most significant variable associated with being unbanked was primarysource of income. Respondents who were formally or self-employed had significantlylower levels of being unbanked than respondents who depended on government grants,informal employment or depended on family, friends or partners for their income. Thelowest levels of unbaked were recorded in respondents who were formally employed,with only 22.5% being unbanked. Respondents who were self-employed (farming,money from their own business, money from renting or from selling goods on thestreet) were found to be 30.3% unbanked. The highest levels of unbanked were foundin respondents who held informal jobs (59.5%) and those who depended on family,friends or partners as their primary source of income (59.3%).
To make a determination of the extent of age correlation with being unbanked, the agevariable was converted into a categorical variable. For comparative reasons, the same agebins as reported in similar studies into financial inclusion in South Africa (Finscope, 2010,2011) were used. The result showed that respondents younger than 25 years old and olderthan 65 years had higher rates of being unbanked than other age groups. For respondentsyounger than 25 years, some 53.7% were unbanked. For respondents older than 65 years,some 60% were unbanked. Unbanked portion in the remaining age categories ranged from43.7% (ages 25 to 34) to the lowest of 37.1% (ages 35 to 44).
Regarding the number of dependents it was found that the percentage of unbankedrespondents was highest for those who had no dependents. For respondents who hadone or more dependents, the unbanked percentages were all lower than 50%. Thelowest levels of unbanked among respondents were those with four dependents, where33.3% unbanked. The highest level of being unbanked among respondents was forthose who had two dependents, where 49.6% were unbanked. The analysis of homelanguage and being unbanked was compromised by small sample sets for some of thelanguages. The languages English and isiNdebele had very small sample sizes and conse-quently it was not feasible to attempt a determination of which home language was morestrongly associated with being unbanked at the bottom of the pyramid.
5. Conclusion
The results of the research highlight that understanding financial exclusion at the bottomof the pyramid is complex. Some aspects of the findings support previous studies in
DEVELOPMENT SOUTHERN AFRICA 211
Dow
nloa
ded
by [
Uni
vers
ity o
f Pr
etor
ia]
at 0
5:36
02
June
201
6

different geographies, but other aspects do not. This may imply that the circumstances andreasons behind financial exclusion at the bottom of the pyramid in one area may be differ-ent from another area. It further implies that solutions to address financial exclusion thatwork in one region may not work in another. Given the differences in socio-economicconditions across countries it may thus be expected that financial exclusion will bedriven by different factors in different countries.
The study’s finding that educational attainment is most correlated with financial exclu-sion also provides a potential way forward in addressing the problem. One of the ways ofreducing financial exclusion at the bottom of the pyramid in South Africa may be to focuson education rather than physical access exclusively. The more educated a respondentswas, the less likely they were to be financially excluded. The work may further suggestthat it could be beneficial to teach financial literacy and the role of banking early in theschool curriculum. This could assist students who do not complete their formal educationto have a basic understanding of the financial system and the benefits that having a bankaccount may bring. The finding that primary source of income is correlated with financialexclusion also provides interesting insights. Increasing levels of formal employment mayreduce levels of financial exclusion. It provides a further impetus for addressing thecurrent chronic unemployment in South Africa.
Our findings show that age is correlated with financial exclusion in South Africa. Itthus partially supports the findings based on US data (Hogarth & O’Donnell, 1997).Respondents aged 16 to 25 were more likely to be excluded compared with otherage groups. Part of the reason for this may be the very low levels of formal employmentin this age group. Only 9.3% of respondents in this age group were formally employedwhile 69.3% of respondents were dependent on receiving money from others. Theextremely high levels of unemployment and dependence on others may render theneed for a bank account moot, but the results also points to a significant problem ofyouth unemployment at the bottom of the pyramid. The finding of an associationbetween home language and financial exclusion was surprising. Whilst the samplesize was too small to determine which official languages were more associated withfinancial exclusion, it provides an interesting area for further study. The findingsalso highlight that providers need to be aware of the language in which they engageprospective clients.
A relationship between gender and being financially excluded was not found. Thisfinding does not support previous work (Hogarth & O’Donnell, 1997), which found aheterogeneous relationship between gender and financial exclusion in the UnitedStates, nor work which reported gender differences in Kenya and Uganda (Johnson& Nino-Zarazua, 2011) or India (Chavan, 2008). Marital status and home ownershipstatus were found to be unimportant in explaining exclusion. A more interestingfinding is that location (i.e. living in a rural as opposed to an urban area) is not associ-ated with being financially excluded. This contradicts the sense that building moreaccess channels to financial services in non-urban areas will reduce financial exclusion.The study instead point to a different conclusion. It may be that factors associated withbeing financially excluded, such as low levels of education and high levels of unemploy-ment, are more prevalent in rural areas than urban areas. Addressing these factors mayhave a greater impact on reducing financial exclusion in rural areas than attempting toprovide greater access to financial services.
212 J. P. WENTZEL ET AL.
Dow
nloa
ded
by [
Uni
vers
ity o
f Pr
etor
ia]
at 0
5:36
02
June
201
6
Disclosure statement
No potential conflict of interest was reported by the author.
References
Agresti, A, 2007. An introduction to categorical data analysis. Wiley, Hoboken, NJ.Amaeshi, K, 2006. Financial exclusion, financial institutions and corporate social responsibility: A
developing country perspective. doi:10.2139/ssrn.950989.Banerjee, A & Newman, A, 1993. Occupational choice and the process of development. Journal of
Political Economy 101(2), 274–298.Bowling, A, 2005. Mode of questionnaire administration can have serious effects on data quality.
Journal of Public Health 27(3), 281–291.Carbo, S, Gardener, P & Molyneux, P, 2005. Financial exclusion. Palgrave Macmillan Studies in
Banking and Financial Institutions. Palgrave Macmillan, New York.Cavana, R, Delahye, BL, & Sekaran, U, 2001. Applied business research: Qualitative and quantitat-
ive methods. Wiley, Milton, Australia.Chavan, P, 2008. Gender inequality in banking services. Economic and Political Weekly, 43(47),
22–28.Conroy, J, 2005. APEC and financial exclusion: Missed opportunities for collective action? Asia-
Pacific Development Journal 12(1), 53–79.De Jager, N, 2004. The living standards measure as a market segmentation tool for selected retailers.
North-West University, Potchefstroom Campus, Potchefstroom.Devlin, J, 2005. A detailed study of financial exclusion in the UK. Journal of Consumer Policy 28,
75–108.Devlin, J, 2009. An analysis of influences on total financial exclusion. The Service Industries Journal
29(8), 1021–1036.European Commission, 2010. Financial Exclusion in the EU: New Evidence from the EU-SILC
Special Module. Research Note 3/2010Finscope, 2010. Finscope South Africa 2010. Finmark Trust, Johannesburg, South Africa.Finscope, 2011. Finscope South Africa 2011. Finmark Trust, Johannesburg, South Africa.Hogarth, J, & O’Donnell, K, 1997. Being accountable: A descriptive study of unbanked households
in the U.S. Proceedings of the Association for Financial Counseling and Planning Education(AFCPE), 17–20 December, San Diego, California, USA, 58–67.
Hosmer, D, & Lemeshow, S, 2000. Applied logistic regression. Wiley, New York.Hulme, D, & Mosley, P, 1996. Finance against poverty, Volume 1. Routledge, London.Johnson, S, & Arnold, S, 2010. Financial exclusion in Kenya: Examining the changing picture,
2006–2009. In Financial inclusion in Kenya: Survey results and analysis from FinAccess 2009.Johnson, S, & Nino-Zarazua, M, 2011. Financial access and exclusion in Kenya and Uganda. Journal
of Development Studies 47(3), 475–496.Kempson, E, Whyley, C, Caskey, J, & Collard, S, 2000. In or out? Financial exclusion: A literature
and research review. In Consumer Research. Consumer Policy and Research Department,Financial Services Authority, London. Vol. 3, 5–100.
Kish, L, 1949. A procedure for objective respondent selection within the household. Journal of theAmerican Statistical Association 44(247), 380–387.
Leyshon, A & Thrift, N, 1995. Geographies of financial exclusion: Financial abandonment in Britainand the United States. Transactions of the Institute of British Geographers 20(3), 312–341.
Martins J, 2004. Household income and expenditure in Gauteng by Living Standards Measure(LSM) Group, 2003. Issue 332 of Research report. Bureau of Market Research, University ofSouth Africa, Pretoria.
Mohan, R, 2006. Economic growth, financial deepening and financial inclusion. Reserve Bank ofIndia, Bulletin Nov, 1305–1319.
Møller, V, 1997. Quality of life in South Africa. Vol 1 of Social Indicator Research Series. KluwerAcademic Publishers, Dordrecht, the Netherlands.
DEVELOPMENT SOUTHERN AFRICA 213
Dow
nloa
ded
by [
Uni
vers
ity o
f Pr
etor
ia]
at 0
5:36
02
June
201
6
Osei-Assibey, E, 2009. Financial exclusion: What drives supply and demand for basic financial ser-vices in Ghana? Savings and Development 3, 207–238.
Peng, C, & So, T, 2002. Logistic regression analysis and reporting: A primer. UnderstandingStatistics: Statistical Issues in Psychology, Education, and the Social Sciences 1(1), 31–70.
Peng, C-Y, Lee, K, & Ingersoll, G, 2002. An Introduction to Logistic Regression Analysis andReporting. The Journal of Educational Research 96(1), 3–14.
Polit, D, 1996. Data analysis and statistics for nursing research. Appleton and Lange, Stamford, CT.Prahalad, C, 2006. The fortune at the bottom of the pyramid. Pearson Prentice Hall, Upper Saddle
River, NJ.Prahalad, C & Hammond, A, 2002. Serving the world’s poor profitability. Harvard Business Review
Sept, 48–57.Prahalad, C&Hart, S, 2002. The fortune at the bottomof the pyramid. Strategy+Business 26(1), 1–26.Sarma, M, & Pais, J, 2011. Financial inclusion and development. Journal of International
Development 23, 613–628.Solo, T, 2008. Financial exclusion in Latin America—or the social costs of not banking the urban
poor. Environment and Urbanization 20(1), 47–66.South Africa Advertising Research Foundation, 2011. LSM Description Slides –March 2011. http://
www.saarf.co.za/LIFESTYLE/lifestyle.htm Accessed 12 January 2012.Statistics South Africa, 2003. Census 2001: Concepts and definitions. Statistics South Africa,
Pretoria.Statistics South Africa, 2012. Census 20011 Statistical release – P0301.4. Statistics South Africa,
Pretoria.Yunus, M, & Jolis, A, 2003. Banker to the poor: Micro-lending and the battle against world poverty.
New York: PublicAffairs.
214 J. P. WENTZEL ET AL.
Dow
nloa
ded
by [
Uni
vers
ity o
f Pr
etor
ia]
at 0
5:36
02
June
201
6